Article

Wavelet Analysis of Overnight Airflow to Detect Obstructive Sleep Apnea in Children

by
Verónica Barroso-García
1,2,
Gonzalo C. Gutiérrez-Tobal
1,2,*,
David Gozal
3,
Fernando Vaquerizo-Villar
1,2,
Daniel Álvarez
1,2,4,
Félix del Campo
1,2,4,
Leila Kheirandish-Gozal
3 and
Roberto Hornero
1,2
1
Biomedical Engineering Group, University of Valladolid, 47011 Valladolid, Spain
2
Centro de Investigación Biomédica en Red en Bioingeniería, Biomateriales y Nanomedicina (CIBER-BBN), 47011 Valladolid, Spain
3
Department of Child Health, The University of Missouri School of Medicine, Columbia, MO 65212, USA
4
Sleep-Ventilation Unit, Pneumology Department, Río Hortega University Hospital, 47012 Valladolid, Spain
*
Author to whom correspondence should be addressed.
Sensors 2021, 21(4), 1491; https://doi.org/10.3390/s21041491
Submission received: 19 January 2021 / Revised: 16 February 2021 / Accepted: 18 February 2021 / Published: 21 February 2021
(This article belongs to the Special Issue Biomedical Signal Processing for Disease Diagnosis)

Abstract

:
This study focused on the automatic analysis of the airflow signal (AF) to aid in the diagnosis of pediatric obstructive sleep apnea (OSA). Thus, our aims were: (i) to characterize the overnight AF characteristics using discrete wavelet transform (DWT) approach, (ii) to evaluate its diagnostic utility, and (iii) to assess its complementarity with the 3% oxygen desaturation index (ODI3). In order to reach these goals, we analyzed 946 overnight pediatric AF recordings in three stages: (i) DWT-derived feature extraction, (ii) feature selection, and (iii) pattern recognition. AF recordings from OSA patients showed both lower detail coefficients and decreased activity associated with the normal breathing band. Wavelet analysis also revealed that OSA disturbed the frequency and energy distribution of the AF signal, increasing its irregularity. Moreover, the information obtained from the wavelet analysis was complementary to ODI3. In this regard, the combination of both wavelet information and ODI3 achieved high diagnostic accuracy using the common OSA-positive cutoffs: 77.97%, 81.91%, and 90.99% (AdaBoost.M2), and 81.96%, 82.14%, and 90.69% (Bayesian multi-layer perceptron) for 1, 5, and 10 apneic events/hour, respectively. Hence, these findings suggest that DWT properly characterizes OSA-related severity as embedded in nocturnal AF, and could simplify the diagnosis of pediatric OSA.

1. Introduction

Pediatric obstructive sleep apnea (OSA) is a major sleep-related breathing disorder, affecting a large number of children (5%) and increasing the risk of negative health consequences among those affected [1,2]. Several studies have reported that the characteristic nocturnal respiratory disruptions manifesting as either cessation or reductions in airflow lead to inadequate gas exchange and fragmented sleep that affects not only other physiological processes, but also cognitive development [2,3,4]. Consequently, the morbidities can worsen and become irreversible if OSA is not timely treated [5].
Despite the potential seriousness of OSA-related complications, it remains an underdiagnosed disorder due to relative unawareness of both parents and primary care physicians and the inherent difficulties in accessing the diagnostic test [6,7]. In this regard, the gold standard approach for diagnosing OSA is overnight polysomnography (PSG), which is technically complex, labor intensive, expensive, potentially distressing to the child and uncomfortable to the parent, and relatively unavailable [6,7]. These drawbacks have led to multiple efforts focused around development of alternative methods that simplify OSA diagnosis in children. Typically, these studies centered around the analysis of a reduced number of physiological signals, such as photoplethysmography (PPG), electrocardiogram (ECG), airflow (AF), or blood oxygen saturation (SpO2), using statistical, nonlinear and/or spectral techniques [8,9,10,11,12,13,14]. However, most of these analyses are a direct extension of techniques previously used in studies of OSA in adults, and have not achieved the same efficacy metrics so far [8,9,10,11,12,13,14]. Major reasons for such differences reside in the fact that the density of respiratory events is remarkably lower in children, and the criteria to determine the severity categories are more conservative in children [1,5,15], thereby presenting greater difficulty for automatic analyses. Consequently, different approaches are required in order to detect and characterize the disturbances that the presence of OSA entails during physiological recordings in children.
In this study, we propose the analysis of oronasal airflow to enable the diagnosis of pediatric OSA, in light of the fact that respiratory events are defined based on total/partial reduction (apneas/hypopneas) of airflow [15]. Overnight AF tracings reflect the respiratory activity of children while asleep, including the cessations/reductions of AF in the context of OSA [15]. Unsurprisingly, AF analytics have already shown their utility in simplifying careening and potentially the diagnosis of pediatric OSA [11,12,16,17]. In addition, apneic events are usually, albeit not always accompanied by blood oxygen desaturations [15]. Consequently, conventional oximetry indices, such as the oxygen desaturation index ≥3% (ODI3), are typically used as a suboptimal surrogate of PSG when the latter is unavailable [18,19]. However, these indices routinely underestimate the severity of the disease [20,21], thus requiring complementary approaches.
AF is a non-stationary biomedical signal, that is, its properties change and evolve over time [17]. Thus, we propose implementation of wavelet analysis of AF. Unlike the methods based on Fourier transform, the wavelet transform (WT) does not make assumptions about the stationarity of the time series [22,23]. Hence, the WT decomposition is a promising method for the analysis and characterization of AF signal, which overcomes the limitations of conventional spectral analyses. In addition, WT analysis is capable of providing optimal time-frequency resolution (high time and frequency resolution at high and low frequencies, respectively), as well as high frequency resolution in long-lasting recordings [22,24]. It should be noted that a high frequency resolution at low frequencies is of utmost importance for the current study, since previous research has reported the existence of relevant OSA-related information at low frequencies of the AF signal [12,16]. Moreover, this property would allow us to obtain detailed information about a certain frequency range, while preserving the temporal information related to apneic events [25]. This methodology has been used successfully to characterize other signals involved in OSA diagnosis in adults and children, such as the electroencephalogram [26], ECG [27], SpO2 [25], and thoracic or abdominal effort [28,29]. However, WT analysis will be to characterize nocturnal AF in the context of pediatric OSA for the first time. Therefore, our starting hypothesis is that WT can provide useful information about the AF behavior in the presence of apneic or hypopneic events. Accordingly, the aims of this study were: (i) to characterize nocturnal AF by means of WT, (ii) to assess its utility to diagnose OSA in children, and (iii) to assess its complementarity with ODI3.

2. Database

Children (946; 584 males and 362 females), clinically suspected of suffering from pediatric OSA, spent one night in the specialized sleep laboratory of the Comer Children’s Hospital of the University of Chicago (Chicago, IL, USA) to undergo nocturnal polysomnography. The children’s caretakers were informed and agreed to participate in the study. The protocol was approved by the Ethics Committee of the University of Chicago (approval numbers: 11-0268-AM017, 09-115-B-AM031, and IRB14-1241).
During the PSG, up to 32 physiological signals were recorded, including AF. Following the guidelines of the American Academy of Sleep Medicine (AASM) [15], sleep medicine specialists scored the apnea and hypopnea events from these recordings to calculate the apnea-hypopnea index (AHI: number of apneic and hypopneic events per hour of sleep). Each child was then classified into one of the following four severity categories: AHI ∈ [0,1) events/hour (e/h) as no-OSA, AHI ∈ [1,5) e/h as mild OSA, AHI ∈ [5,10) e/h as moderate OSA, and AHI ∈ [10,∞) e/h as severe OSA [1,5].
The main characteristics of the children involved in the study are presented in Table 1. Out of the 946 children, 570 (60%) were randomly selected into the training group and 376 (40%) into the test group. Statistically significant differences (p-value < 0.01) between the training and test groups were evaluated using Fisher’s exact test for categorical variables and the non-parametric Mann-Whitney U test for continuous variables. No significant differences were found in any of the evaluated clinical or demographic variables.
AF and SpO2 recordings were obtained from the PSG recordings by means of a thermistor and a pulse oximeter, respectively. According to AASM, the AF and SpO2 recordings used in our study were resampled at the recommended frequency: 100 Hz for AF and 25 Hz for SpO2 [15]. Both signals were subjected to a preprocessing stage in order to automatically remove possible artifacts. This stage was conducted following the artifact removal methods proposed in previous studies [12,17]. Signals whose duration was less than 3 h after artifact removal were excluded from our study [17,30]. Moreover, AF signals were normalized to minimize the inter-individual differences related to particular physiological characteristics other than OSA [31].

3. Methods

Figure 1 shows the scheme of the stages followed in this study: (i) feature extraction to characterize AF by means of WT, as well as to compute ODI3, (ii) feature selection using the fast correlation-based filter (FCBF) to obtain an optimal feature subset, and (iii) application of machine-learning approaches to carry out multiclass classification and regression. The multiclass classification was performed to determine the OSA severity degree through AdaBoost.M2 with decision trees as base classifier. Regarding to the regression process, it was carried out to estimate the AHI of each child by means of multi-layer perceptron neural network with a Bayesian approach (BY-MLP). In this sense, recent studies have shown the usefulness of these selection and machine-learning methods in the context of pediatric OSA diagnosis [12,17].

3.1. Feature Extraction

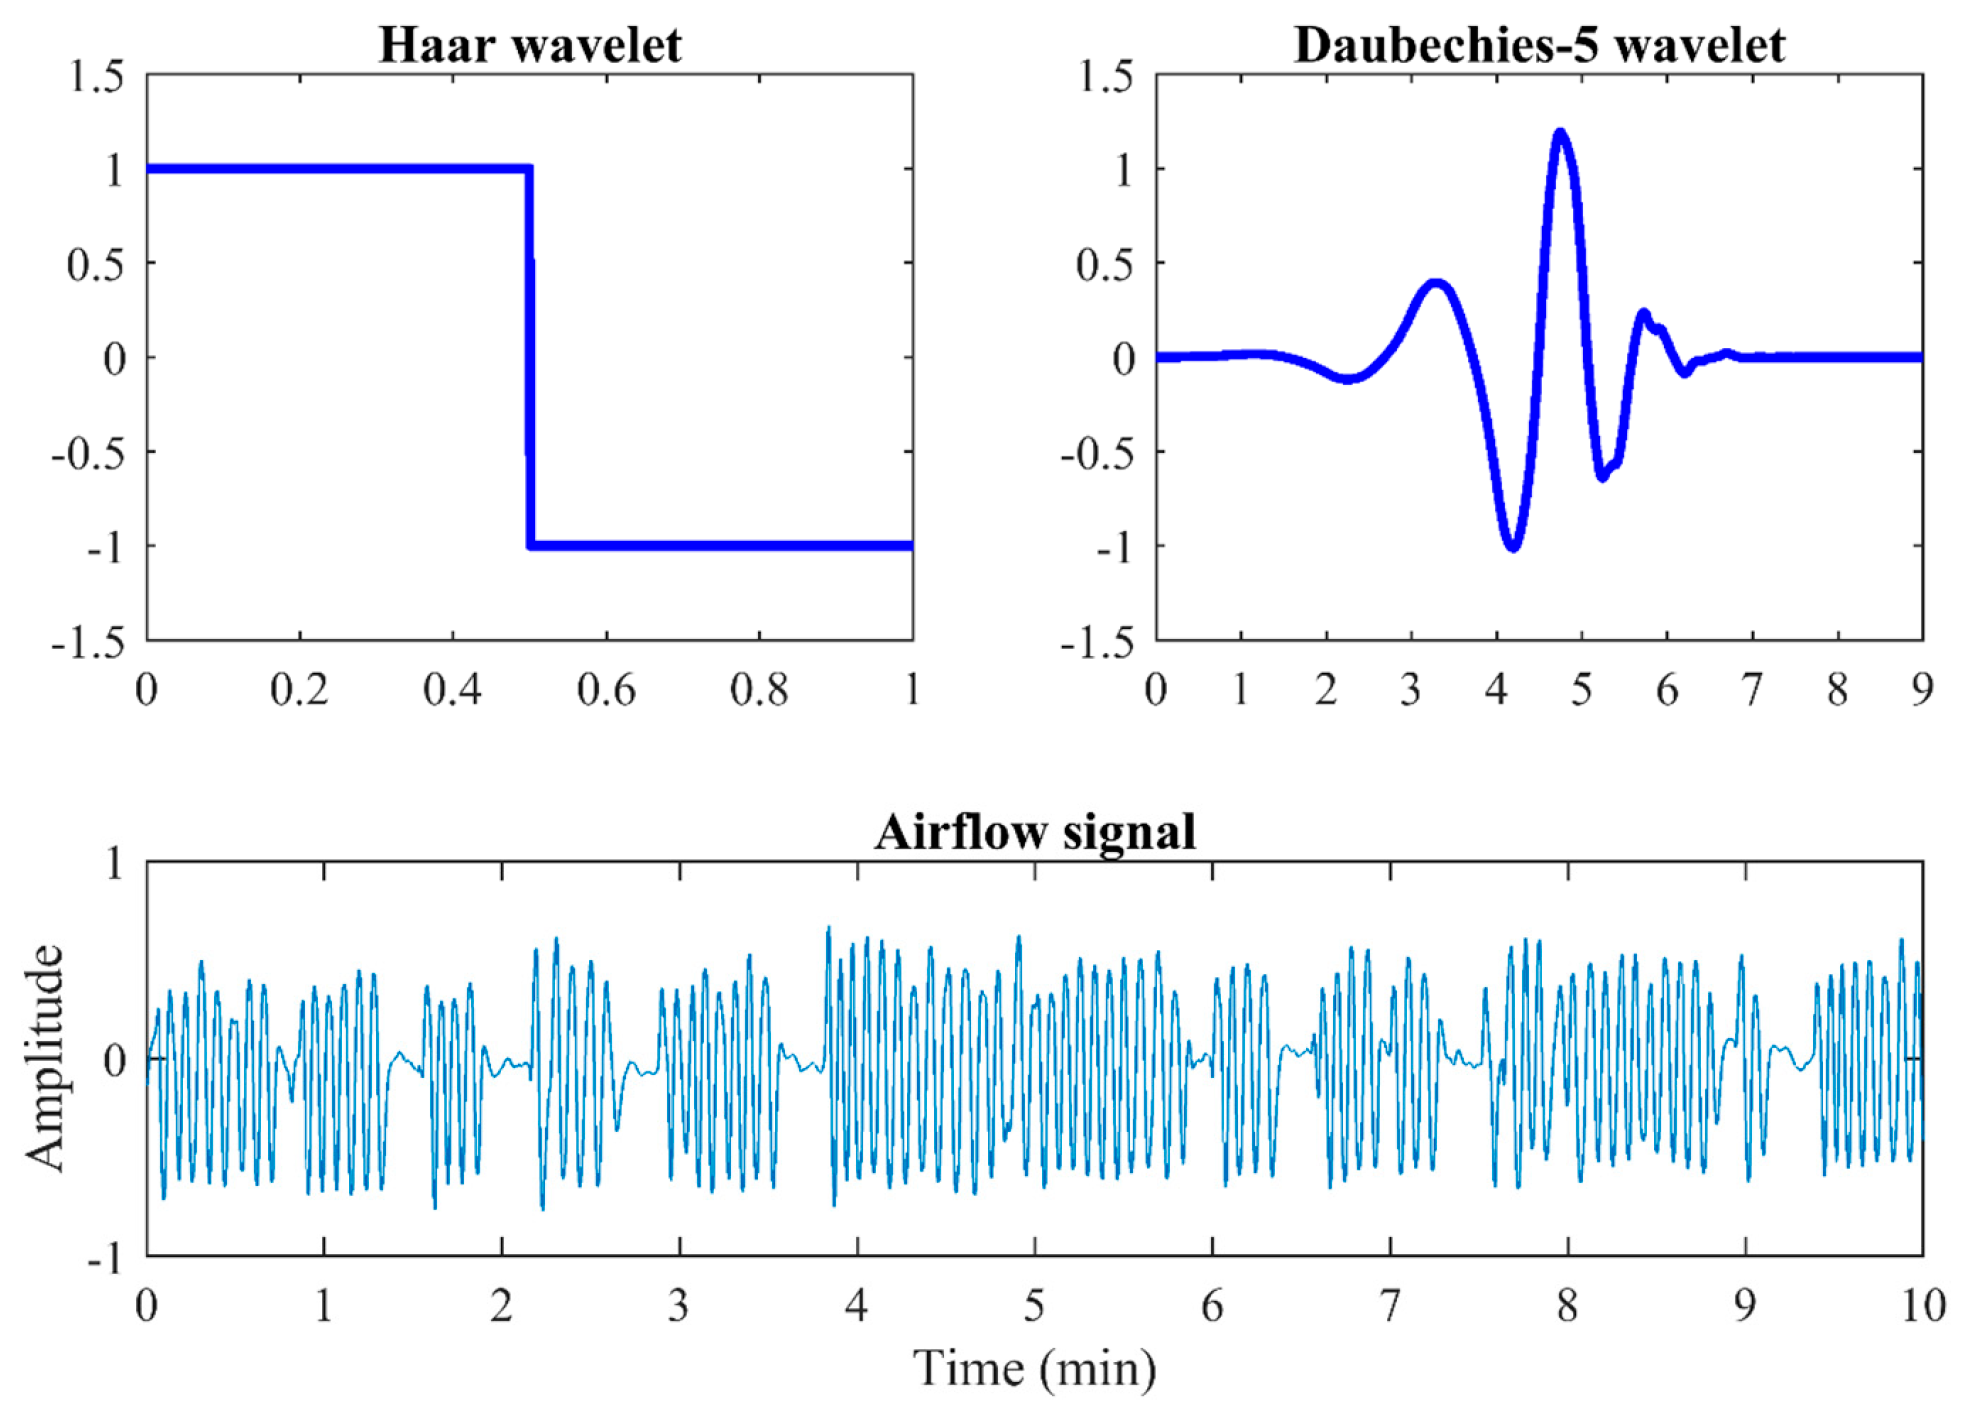
3.1.1. Wavelet Features
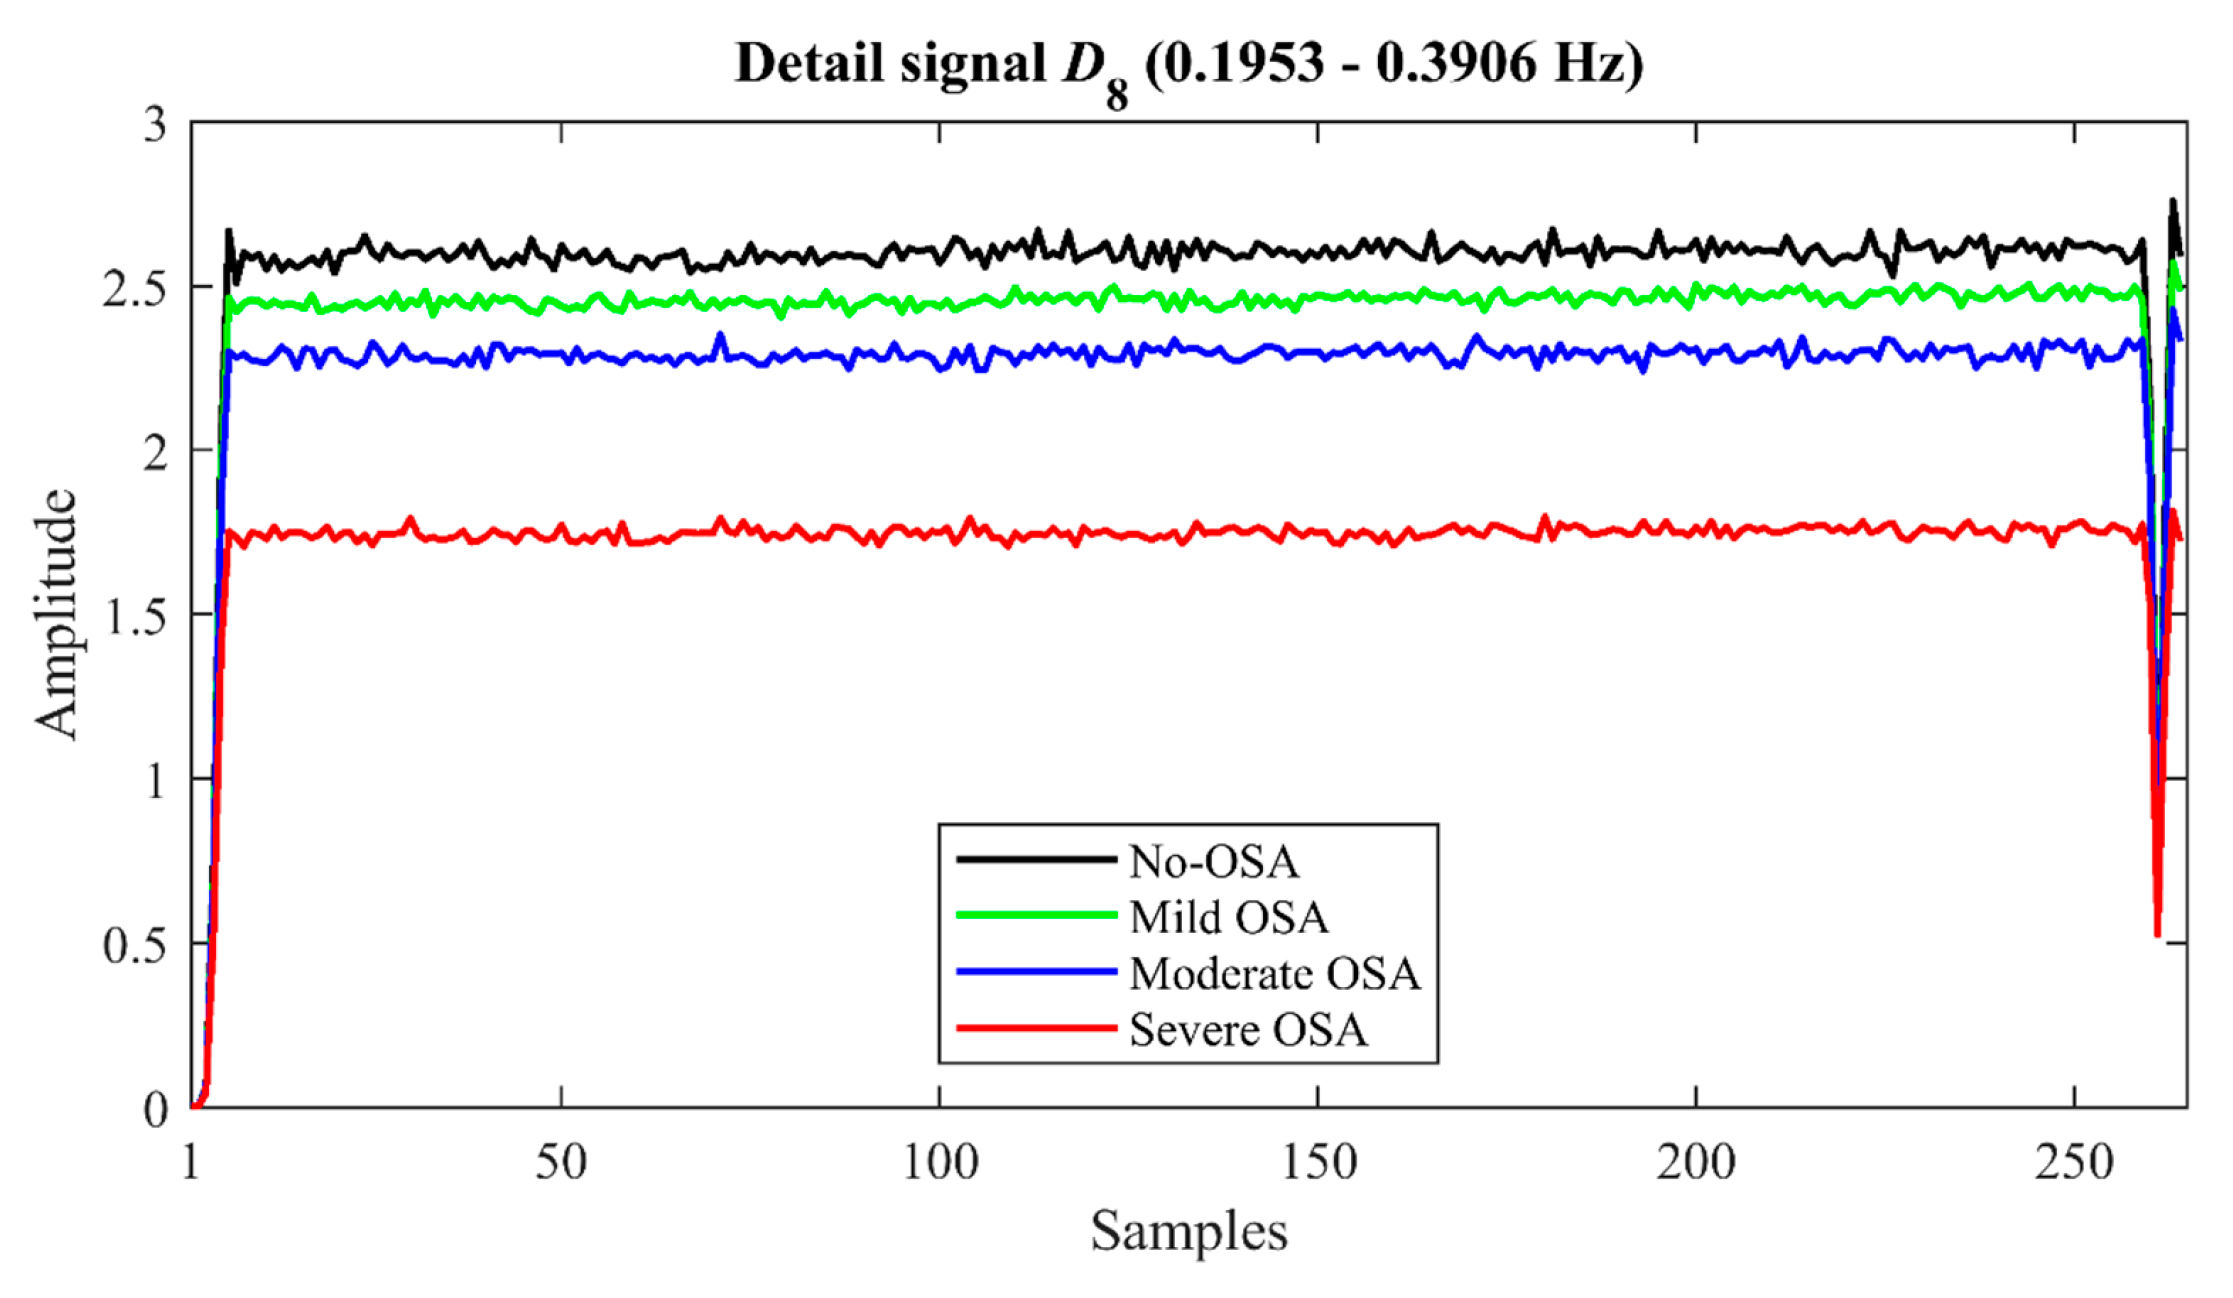
WT allows to conduct a multiresolution analysis of non-stationary signals, i.e., it allows to analyze a time series in different frequency ranges with variable resolution [24]. In our study, the analysis is performed using the discrete wavelet transform (DWT) to deal with the redundancy and computational complexity issues of the continuous approach [23,24]. Moreover, DWT has been successfully used in previous studies aimed at OSA detection [25,26,28,29]. As can be seen in Figure 2, multiresolution analysis with DWT consists of performing N = log2(M) decomposition steps, where M is the size of the time series x(n) [23,25]. At each step, the decomposition is conducted by using a scaling ϕj,n and a wavelet function ψj,n, which are generated by scaling and translation of basis functions and where j denotes the decomposition level [32]:
ϕ j , k ( n ) = s j 2 · ϕ ( n k · τ · s j s j ) = 2 j 2 · ϕ ( 2 j · n k ) ,
ψ j , k ( n ) = s j 2 · ψ ( n k · τ · s j s j ) = 2 j 2 · ψ ( 2 j · n k ) ,
where s = 2 and τ = 1 (dyadic sampling) are the scale and translation parameters, respectively, j ∈ Z is the decomposition level, k ∈ Z is the coefficient position within each sub-band of the decomposition, ϕ is the basis scaling function, and ψ is the basis wavelet function or mother wavelet. The scaling and wavelet functions allow to characterize the approximation and detail spaces at different resolutions, respectively. It cannot be affirmed that a generic optimal wavelet function exists, since in each particular case there will be a mother wavelet that better adapts to the signal under study.
In our work, Haar and Daubechies-5 wavelets have been evaluated due to their previous suitability to the AF signal [33,34]. Figure 3 shows the mother wavelets Haar and Daubechies-5, as well as a 10-min segment of AF signal. Haar is the simpler orthonormal wavelet, which does not cause edge effect due to it uses a single vanishing moment and a support width = 1 (Figure 3) [35,36]. It would avoid ignoring the relevant information contained in these regions. Moreover, the stepped shape of the Haar wavelet would allow to detect abrupt reductions of AF caused by apneic events. Regarding Daubechies-5, it uses 5 vanishing moments and a support width = 9 (Figure 3). When increasing the vanishing moment and the support width, the time-frequency localization improves [37,38], but the edge effect also increases [36]. Hence, the Daubechies-5 wavelet would provide a better localization while causing less edge effect than other higher order variants, such as Daubechies-10 or Daubechies-20 [36]. In addition, its shape resembles an AF signal, which would allow a better setting.
In practice, the scaling (ϕ) and wavelet (ψ) functions are considered as half-band low-pass h(n) and half-band high-pass g(n) filters, respectively, such as [24,32]:
g ( n ) = ( 1 ) 1 n · h ( 1 n ) .
Hence, as shown in Figure 2a, DWT can be implemented as a cascade of recursive filters, each of them followed by a subsampling process by 2 (dyadic sampling) to reduce the sampling frequency and increase the spectral resolution [24,29,32]. Thereby, the low frequency band can be split again, thus generating new levels of decomposition. At each decomposition level j, after the corresponding filter and subsampling, the approximation Aj (low frequency) and the detail Dj (high frequency) signals are obtained [24,25,29]:
A j [ k ] = n A j 1 · h ( 2 k n ) ,
D j [ k ] = n A j 1 · g ( 2 k n ) ,
where A0 is the time series x(n). This decomposition process finishes when level j = N is reached.
The AF signal was segmented into epochs of length 216 samples (≈10-min), as conducted in previous studies [12,39]. Thus, DWT decomposition for each segment was carried out at 16 levels (N = log2 (216)), using Haar and Daubechies-5 as mother wavelets [33,34]. An example of decomposition of AF segment by means of Daubechies-5 can be observed in Figure 2b.
Our DWT analysis mainly focused on D8 (0.1953–0.3906 Hz), which corresponds to the normal breathing frequency band in sleeping children [16,40]. This choice let us characterize the alterations caused by OSA in normal nocturnal respiration. Thereby, after obtaining the detail coefficients of D8 from each of the 946 AF signals, the following features were extracted to quantify the information contained in them [25]:
  • Four statistical moments (M1D8M4D8). Mean (M1D8), standard deviation (M2D8), skewness (M3D8), and kurtosis (M4D8) are computed to measure central tendency, dispersion, asymmetry, and peakedness of the distribution of the coefficients of D8 [25].
  • Maximum and minimum (MaxD8 and MinD8). They are the highest (MaxD8) and the lowest (MinD8) value of the coefficients of the detail signal D8. These features allow to quantify the maximum and minimum amplitude reached in this decomposition level [25].
  • Energy (ED8). This feature measures the quadratic amplitude of the detail signal D8, providing information about the activity produced in the resolution level associated to the representative frequency band of the normal breathing [25,41]. It is computed as the sum of the modulus of the detail coefficients squared [22,23]:
    E D 8 = k | D 8 [ k ] | 2 ,
In addition to the D8-derived features, the wavelet entropy from all detail levels has been obtained to also characterize the OSA global effects on the complete AF signal:
  • Wavelet entropy (WE). It is an extension of the well-known Shannon’s entropy. Therefore, this feature allows quantifying the energy distribution changes generated in the decomposition process, offering information about the underlying dynamical behavior and the irregularity of the signal [22,25,41]:
    W E = j = 1 N p j · log ( p j ) ,
    where pj is the normalized energy distribution at the decomposition level j:
    p j = E D j j = 1 N E D j   .
Due to the amplitude reductions of the AF signal produced by apneic events [15], as well as the ability of the DWT to assign low coefficients to the flatter signal parts and high coefficients to the steeper [42], it is expected to find higher coefficients in the signal D8 of the subjects without OSA. Consequently, and according to previous spectral analyses of AF [16,43], higher values of M1D8, M2D8, MaxD8, and MinD8, as well as lower values of M3D8 and M4D8, are expected in these subjects. In addition, it is also expected that there will be greater activity in the normal breathing band in the absence of apneas and hypopneas, i.e., that subjects without OSA have a higher ED8. Regarding WE, it has been observed that apneic events introduce changes in time and frequency domains of AF signal of children [11,12,16]. Thus, AF signals are expected to be more irregular (higher values of WE) as OSA severity increases. Thereby, since DWT allows to obtain higher frequency resolution at low frequencies, it is expected to provide a more detailed analysis than classical spectral analysis.

3.1.2. Oximetry Index

ODI3 was obtained from the SpO2 signal in order to compare the AF information with a common clinical index that usually acts as a surrogate of the full PSG, when the latter is not available. The guideline followed to calculate ODI3 was established according to the definition provided by Taha et al. [44]. Thus, the SpO2 reductions greater than or equal to 3% and lasting at least 10 s were considered desaturation events. Finally, ODI3 was computed dividing the total number of desaturations presented in the SpO2 signal by the recording time expressed in hours. Due to the blood oxygen desaturations are closely related to the occurrence of apneic events [15], ODI3 is expected to be higher as OSA severity increases.

3.2. Feature Selection

The fast correlation-based filter (FCBF) was used to obtain an optimal subset of relevant and non-redundant features [45]. Some motivations for using this algorithm are that it does not depend on subsequent analyzes and it reduces the complexity and dimensionality of the predictive models [45,46]. Moreover, this method has been successfully applied in the pediatric OSA context [12,13,17,25,47].
A bootstrapping procedure was conducted (1000 replicates) to obtain a stable and optimal subset [46]. The average significance was used as selection threshold Ts [30]. It was computed as the average number of times that all features were selected [30]. Hence, the features selected a number of times ≥Ts constituted the optimal set of features that fed the predictive models proposed in our study.

3.3. Machine-Learning Approaches

3.3.1. Multiclass Classification

In order to carry out a classification into 4-classes (no-OSA, mild, moderate, and severe OSA), we used the adaptive boosting (AdaBoost.M2) ensemble-learning algorithm due to previous success in classifying AF signals in the OSA context [12,48]. AdaBoost.M2 is based on iterative training of multiple ‘weak classifiers’ (also, base classifiers) of the same type, so that each new one focuses on the data misclassified by its predecessors [49,50]. Thereby, this method calls the base classification algorithm L times, giving it each time a different weight distribution for the training. The same weight is initially assigned to all instances and then it is updated in each iteration: more weight to wrongly classified instances and less weight to those correctly classified [49,50]. This allows the algorithm to adapt to the data, minimizing the expected error and focusing on correctly classifying the instances with more weight [50]. The weight update also involves the use of the learning rate α, a regularization parameter to deal with overfitting [48,50]. Finally, the weighted vote of all the previously trained classifiers is computed, obtaining a more robust prediction of each class [49,50].
In our study, decision trees were used as base classifiers, which is a common choice when using ensemble-learning methods [49]. The optimal number of weak classifiers L, as well as the learning rate α, require to be tuned. In this regard, both hyperparameters were optimized by applying bootstrapping (1000 replicates) in the training group and using 0.632 bootstrap to estimate the Cohen’s kappa (kappa) for each L/α pair [12,48].

3.3.2. Regression

A regression process by means of multi-layer perceptron neural network with a Bayesian approach (BY-MLP) was conducted to estimate AHI. BY-MLP has already shown its utility in OSA diagnosis [17,51,52]. This method is based on a set of perceptrons organized in layers, so that each perceptron is connected to all those of the next layer with a certain weight [53]. In order to obtain a universal approximation, BY-MLP is typically formed by 3 layers: (i) an input layer with NI perceptrons that receive the input patterns and propagate them to all the perceptrons of the next layer, (ii) a hidden layer with NH perceptrons that perform a non-linear processing of the received patterns and propagate it to the next layer, and (iii) an output layer with NO perceptrons that process the information received from the hidden layer and provide the response of the neural network [53]. The learning process of the network involves adjusting the weights associated to the connections between perceptrons. The technique applied to carry out this adjustment is the Bayesian inference, which allows finding the optimal weights that minimize the error function [52].
In our study, NI is equal to the number of features selected in the previous stage, NH is a parameter to be tuned, and NO is equal to one perceptron since the network purpose is to estimate the AHI. As in Adaboost.M2, the value of NH was optimized by applying bootstrapping (1000 replicates) in the training group and using 0.632 bootstrap to estimate the kappa [51].

3.4. Statistical Analysis

The data distribution of each biomedical index was evaluated by means of the Lilliefors test. The results showed that wavelet features did not follow a normal distribution. Consequently, the existence of statistically significant differences (p-value < 0.01) among OSA severity groups was assessed by means of the non-parametric Kruskal-Wallis test. Moreover, Spearman’s correlation was used to evaluate the relationship between AHI and the features under study. Cohen’s kappa of two-class (kappa2) and four-class (kappa4), as well as the four-class accuracy (Acc4), assessed the agreement between predicted and actual diagnosis [54]. In addition, the metrics used to evaluate the diagnostic performance of the machine-learning approaches for the common AHI thresholds 1 e/h, 5 e/h, and 10 e/h were sensitivity (Se), specificity (Sp), accuracy (Acc), positive and negative predictive values (PPV and NPV, respectively), and positive and negative likelihood ratios (LR+ and LR-, respectively). The statistically significant differences (p-value < 0.001) between diagnostic metrics of the models were evaluated using the Mann-Whitney U test for pairwise comparison with Bonferroni correction.

4. Results

4.1. Training Group

4.1.1. Extracted Features

The coefficients of D8 with and without sign computed by means of Haar obtained features with an average Spearman’s correlation of 0.2075 and 0.3190, respectively. Regarding Daubechies-5, the features achieved an average correlation of 0.2379 and 0.3447 for coefficients with and without sign, respectively. Consequently, the features extracted from D8 in absolute value and with Daubechies-5 were used in the following stages of our study.
Figure 4 displays the averaged detail signal D8 for each severity group in the training dataset. In this figure, higher amplitude values of D8 can be observed in subjects without OSA. In addition, the frequency distribution of the values of the D8 coefficients as OSA severity increases can be visualized in Figure 5. According to this figure, coefficients close to 0 are more frequent in children with OSA, increasing the asymmetry and the sharpness of the peak of the distribution as the AHI increases.
Table 2 shows the median and interquartile range values by OSA severity group of each feature, as well as its Spearman’s correlation coefficient with the AHI and the p-value obtained by means of the Kruskal-Wallis test in the training group. M1D8, M2D8, MaxD8, MinD8, and ED8 showed a decreasing trend as OSA severity increases. In contrast, the tendency of M3D8, M4D8, and ODI3 was towards higher values. Regarding WE, it showed less separability between groups, although with a notable increase in the most severe subjects. In addition, all the extracted features showed significant differences among OSA severity groups (p-value < 0.01 after Bonferroni correction).

4.1.2. Feature Selection

We carried out 2 selection trials, one only with wavelet features from AF and another that also included the ODI3. FCBF was applied to 1000 bootstrap replicates obtained from the training group. In the trial with wavelet features from AF, only M3D8 was selected more than Ts times (Ts = 125.25). As can be seen in Figure 6, M3D8, MinD8, and ODI3 exceeded this threshold (Ts = 205.33) when ODI3 was included in the selection process.

4.1.3. Optimization of Adaboost.M2 and BY-MLP

Two Adaboost.M2 models (ABAF and ABAF,ODI3) and two BY-MLP models (BY-MLPAF and BY-MLPAF,ODI3) were designed and trained after the feature selection stage. ABAF and BY-MLPAF models were fed only with the selected wavelet feature from AF (M3D8), while ABAF,ODI3 and BY-MLPAF,ODI3 models incorporated wavelet features from AF (M3D8 and MinD8) and ODI3. Regarding the Adaboost.M2 models, we conducted trials with values of L = [1:9 10:10:90 100:100:900 1000:1000:10000] and of α = [0.1:0.1:1]. The optimization of these parameters was based on the maximum kappa obtained through 0.632 bootstrap for the L/α pair: L = 8000 and α = 1 for ABAF and L = 3000 and α = 1 for ABAF,ODI3. Regarding the BY-MLP models, values of NH = [1:1:40] were used. In this case, the maximum kappa was reached with NH = 1 for BY-MLPAF and NH = 36 for BY-MLPAF,ODI3.

4.2. Test Group

In order to improve the generalization of our results, the trained models were assessed in 1000 bootstrap replicates from the test group. The diagnostic performance metrics were obtained by means of the bootstrap 0.632 procedure and the statistically significant differences (p-value < 0.001) between models were evaluated using the Mann-Whitney U test for pairwise comparison with the Bonferroni correction. Table 3 and Table 4 show the diagnostic performance (median [95% confidence interval]) achieved by each of the machine-learning models proposed in our study, as well as the ODI3. ODI3 showed a severity underestimation in 1 and 5 e/h. Regarding ABAF and BY-MLPAF models, these obtained an unbalanced Se-Sp pair, with a severity overestimation in 1 and 5 e/h and an underestimation in 10 e/h. When combining wavelet features from AF with ODI3 (ABAF,ODI3 and BY-MLPAF,ODI3) these negative effects of overestimation and underestimation were reduced. BY-MLPAF,ODI3 obtained highest Acc for 1 and 5 e/h and ABAF,ODI3 for 10 e/h, significantly outperforming (p-value < 0.001) the individual approaches. Moreover, these models also achieved higher performance than ABAF, BY-MLPAF, and ODI3 in terms of kappa2, kappa4, and Acc4.

5. Discussion

In the present work, we characterized overnight pediatric AF by means of wavelet features obtained from the normal respiratory band. In addition, we showed the complementarity between the wavelet analysis conducted on AF and ODI3, obtaining two machine-learning models with high performance to diagnose pediatric OSA. The interpretation of our findings is detailed below.

5.1. Training Group

Our results revealed that the mother wavelet Daubechies-5 is better suited to the nocturnal AF behavior of children than the Haar wavelet. This may be because Daubechies-5 uses more vanishing moments and a larger support width than Haar (Figure 3), which allowed to obtain a more precise phase space and time-frequency location, as well as to focus and detect the singularities of the AF signal [37,38].
According to Figure 4 and Figure 5, the subjects without OSA presented higher values of D8, as well as a less asymmetric and less peaked distribution than the subjects with OSA. These amplitude and distribution differences agree with the information provided by the statistical analysis carried out in the training group. Thereby, M1D8 and M2D8 showed a decreasing tendency as the OSA severity increased. This fact is consistent with a less activity in the normal breathing band as AHI increased, which causes a notable reduction of the coefficients of signal D8 from AF and a narrower dispersion range. Regarding M3D8 and M4D8, these experienced an increasing tendency, i.e., greater positive skewness and greater sharpness of the distribution peak in lower values of the coefficients of D8 as the AHI is higher. This indicates that apneas and hypopneas change the frequency distribution of AF signal and reduce its frequency components in the normal breathing band, which leads to fewer high coefficients and more coefficients close to zero in this band. According to this reduction of coefficients, the maximum and minimum values of D8 (MaxD8 and MinD8), as well as the energy of this level (ED8), were lower as the severity of OSA increased. This decrease revealed that apneic events reduce the detail signal amplitude and the activity produced in the resolution level associated to the normal breathing band, which agrees with a lower occurrence of normal breathing patterns. Moreover, an increase of WE could also be observed in the severely affected children. This fact suggests that severe OSA disturbs the energy distribution of AF signal at the different levels of decomposition. In this way, the wavelet energy is redistributed in other frequency bands associated with apneic events instead of concentrating in the normal breathing band. Consequently, the AF signal becomes more irregular in these cases. Thus, we showed that DWT provided useful information to characterize the nocturnal AF of children, as well as its behavior in presence of apneic events.

5.2. Feature Selection and Diagnostic Performance

Despite the clear tendencies shown by the 8 wavelet features extracted from AF, only the asymmetry of the distribution of the coefficients of D8 (M3D8) was relevant and not redundant with respect to the rest. This is coherent with the statistical analysis carried out in the training group, where M3D8 not only showed significant differences among severity groups, but was also the wavelet feature that obtained highest Spearman’s correlation with the AHI. Thus, the selection of M3D8 suggests that its individual utility to characterize the pediatric OSA is greater than individual and joint usefulness of the other wavelet features.
However, FCBF revealed that there is complementarity between ODI3 and the wavelet information obtained from both M3D8 and MinD8. In this regard, M3D8, MinD8, and ODI3 showed a clear separability among OSA severity groups (lower p-value), as well as a higher Spearman’s correlation with the AHI. Notice that FCBF did not select MinD8 in the trial with wavelet features from AF, but it was selected when ODI3 was included in the selection process. Due to the final subset is obtained as the union of the feature subsets selected in ≥Ts bootstrap replicates [46], this fact suggests that MinD8 contributes with additional information to ODI3 and different from that provided by M3D8, which highlights the joint usefulness of these features. Therefore, the information about the occurrence of apneic events provided by DWT through the distribution asymmetry (M3D8) and the minimum amplitude of D8 (MinD8) from AF is complementary to the information provided by ODI3 about the occurrence of desaturations.
This complementarity was also reflected in the machine-learning models used to classify children in 4-classes of OSA severity and estimate their AHI. ABAF, BY-MLPAF, and ODI3 achieved a moderate diagnostic performance in the testing group. These approaches were significantly outperformed (p-value < 0.001) by BY-MLPAF,ODI3 in kappa2 for the 3 AHI cut-offs, kappa4, and Acc4, as well as by ABAF,ODI3 in kappa2 for 1 and 10 e/h and kappa4. This fact revealed that the agreement between the predicted and actual OSA severity improves when wavelet information and ODI3 are combined, which confirmed the complementarity of both approaches. Moreover, the diagnostic accuracies reached by BY-MLPAF,ODI3 for 1, 5, and 10 e/h and ABAF,ODI3 for 1 and 10 e/h were also significantly higher (p-value < 0.001) than those obtained by the individual approaches. In this regard, BY-MLPAF,ODI3 achieved a more balanced Se-Sp pair in 5 e/h, as well as significantly higher Se and Acc (p-value < 0.001) than ABAF,ODI3 in 1 and 5 e/h. Hence, the AHI estimated by BY-MLPAF,ODI3 could be used by medical personnel to discriminate between mildly to moderately affected subjects. In addition, ABAF,ODI3 obtained a statistically significant higher Acc (p-value < 0.001) for 10 e/h. Furthermore, as LR+ > 10 is a robust indicator to determine the presence of a disease [55], the significantly higher LR+ (p-value < 0.001) obtained with ABAF,ODI3 for 10 e/h (LR+ = 18.99 [14.60, 51.76]) indicated that this model provides greater evidence than BY-MLPAF,ODI3 to detect severe OSA. Consequently, this multiclass classifier could be used as a potential automatic tool to this purpose. Therefore, the methodology proposed in the present study would be a useful alternative to nocturnal polysomnography, since it would help to simplify and streamline the pediatric OSA diagnosis in a timely fashion that potentially prevents the generation and worsening of deleterious consequences.

5.3. Comparison with Other Studies

As shown in Table 5, several studies focused on the simplification of pediatric OSA have applied automatic analysis techniques to polysomnographic signals such as ECG, PPG, SpO2, and AF [8,9,10,11,12,13,14,17,25,47]. In this regard, Shouldice et al. [10] applied temporal and spectral analysis methods to 50 ECG signals, obtaining 84.00% Acc for 1 e/h. Other studies such as those carried out by Gil et al. [8] and Dehkordi et al. [9] analyzed 21 and 146 PPG signals, respectively. They evaluated their proposal using 5 e/h as AHI cut-off for positive OSA and reached 80.00% Acc and 71.00% Acc, respectively. However, despite the high diagnostic performance achieved by these studies, the small sample size makes their results difficult to generalize.
In contrast, some studies involved a larger number of children (207–4191) [12,13,14,47]. Hornero et al. [13], Xu et al. [47], and Garde et al. [14] based their studies on the automatic analysis of SpO2 signals, while Jiménez-García et al. [12] focused on AF together with SpO2. They used the AHI cut-offs 1, 5, and 10 e/h, obtaining accuracies that ranged between 75.00–81.28%, 79.40–82.05%, and 88.19–90.26%, respectively. However, the diagnostic accuracies obtained by these studies were outperformed by our current proposal for all the 3 AHI cut-offs.
The work of Vaquerizo-Villar et al. [25], a previous study from our research group, was based on wavelet analysis combined with other features extracted from 981 SpO2 signals. This study used only the AHI cut-off 5 e/h to determine the presence of OSA, achieving a high Acc. However, our current proposal was evaluated according to the different severity categories, which allowed us to also identify children without OSA as well as the severely affected ones. In this regard, our methodology showed great usefulness for detecting severe cases (Acc = 90.99% [89.29,92.61] and LR+ = 18.99 [14.60,51.76] with ABAF,ODI3 for 10 e/h). As these pediatric subjects have an increased risk of developing comorbidities and neurocognitive deficits [1,5], our tool would allow to diagnose and treat these cases early on, before the consequences are irreversible. Moreover, automatic detection of no-OSA cases would reduce the waiting lists and streamline the diagnosis of children affected by this disease. In addition, it is worth noting the achieved improvement with respect to our previous study based on recurrence plots from AF [17]. Although the Acc in 1 e/h was lower, a more balanced Se-Sp pair should be noted, as well as the higher diagnostic performance obtained in 5 e/h. Moreover, we outperformed the Acc and LR+ obtained in 10 e/h, thus our current proposal is more robust to detect severe OSA. Regarding our latest work focused on the bispectral analysis of AF [56], it was improved in Sp, PPV, and LR+ for 1 and 5 e/h, as well as in all diagnostic metrics for 10 e/h by the current proposal. Hence, the DWT would be a more potentially useful tool than bispectrum to diagnose severe OSA cases in a timely fashion. Furthermore, DWT revealed changes of energy and frequency components of AF, that could not have been detected with bispectrum or recurrence plots.

5.4. Limitations and Future Work

One of the limitations of this study is the size of the population under study, since it would have been desirable to analyze a larger set of AF signals originating from multiple sources to ensure more generalizable results. Although we have shown that Daubechies-5 better reflects the behavior of AF than Haar, other mother wavelets that have not yet been applied in this context could be analyzed in future studies, and the results obtained with each of them could be compared. Moreover, it would also be interesting to search for mother wavelets that more closely resemble the shape of AF signal. The use of DWT and the analysis of the detail level D8 have also shown its usefulness in the diagnosis of the disease. However, wavelet packet decomposition could be applied in future research to obtain detail levels more fitting to the frequency features of the AF signal [57]. In addition, another future goal is to perform multiclass classification and/or AHI estimation through other advanced techniques of pattern recognition, such as deep-learning [58], and pediatric AF at-home recordings. Finally, the analysis proposed in this study could be used along with other PSG-derived signals, such as thoracic or abdominal effort, to distinguish among obstructive, central, and mixed apneic events in future research [15].

6. Conclusions

In this study, nocturnal AF of children has been characterized by means of features from wavelet analysis. We found that apneic events decrease the detail coefficients of the DWT associated to the normal breathing band (lower values of M1D8, MaxD8, and MinD8), as well as the activity produced in the frequency range 0.1953–0.3906 Hz of AF (lower values of ED8). Wavelet analysis also revealed that OSA changes the frequency and energy distribution of AF signal, reducing its frequency components in the normal breathing band (higher values of M3D8 and M4D8) and generating more global irregularity in the signal (higher values of WE). Our study also found complementarity between DWT features from AF and ODI3. These findings allowed us to obtain a BY-MLP model with high diagnostic accuracy to estimate the AHI of mildly to moderately affected children, as well as an AdaBoost.M2 model particularly useful for classifying severe pediatric subjects. Therefore, we conclude that DWT can characterize the nocturnal AF, and that such approach could be jointly used with ODI3 to simplify the diagnosis of OSA in children.

Author Contributions

Conceptualization, V.B.-G., G.C.G.-T., and R.H.; methodology, V.B.-G., G.C.G.-T., and R.H.; software, V.B.-G. and F.V.-V.; validation, V.B.-G., G.C.G.-T., F.V.-V., and D.Á.; formal analysis, V.B.-G., G.C.G.-T., F.V.-V., and D.Á.; investigation, V.B.-G.; resources, L.K.-G. and D.G.; data curation, L.K.-G., F.d.C., and D.G.; writing—original draft preparation, V.B.-G.; writing—review & editing, G.C.G.-T., L.K.-G., F.V.-V., D.Á., F.d.C., D.G., and R.H.; visualization, V.B.-G.; supervision, G.C.G.-T. and R.H.; project administration, R.H. All authors have read and agreed to the published version of the manuscript.

Funding

This work was supported by “Ministerio de Ciencia, Innovación y Universidades—Agencia Estatal de Investigación” and “European Regional Development Fund (FEDER)” under projects DPI2017-84280-R and RTC-2017-6516-1, by “European Commission” and “FEDER” under project POCTEP 0702_MIGRAINEE_2_E, and by “CIBER en Bioingeniería, Biomateriales y Nanomedicina (CIBER-BBN)” through “Instituto de Salud Carlos III” co-funded with FEDER funds. Verónica Barroso-García was in receipt of a “Ayuda para financiar la contratación predoctoral de personal investigador” grant from “Consejería de Educación de la Junta de Castilla y León” co-funded by European Social Fund (ESF). Daniel Álvarez is supported by a “Ramón y Cajal” grant (RYC2019-028566-I) by the “Ministerio de Ciencia e Innovación—Agencia Estatal de Investigación” co-funded by ESF. Fernando Vaquerizo-Villar was in receipt of a “Ayuda para contratos predoctorales para la Formación de Profesorado Universitario (FPU)” grant from “Ministerio de Educación, Cultura y Deporte” (FPU16/02938). Leila Kheirandish-Gozal and David Gozal are supported by “National Institutes of Health (NIH)” grants HL130984, HL140548, and AG061824, and a Tier 2 grant from the University of Missouri as well as by a grant from the Leda J. Sears Foundation.

Institutional Review Board Statement

The study was conducted according to the guidelines of the Declaration of Helsinki, and approved by the Ethics Committee of the Comer Children’s Hospital (approval numbers: 11-0268-AM017, 09-115-B-AM031, and IRB14-1241).

Informed Consent Statement

Informed consent was obtained from the legal caretakers of all subjects involved in the study.

Conflicts of Interest

The authors declare no conflict of interest that could inappropriately influence this research work.

Ethical Statement

The children’s caretakers gave their informed consent for inclusion before they participated in the study. The study was conducted in accordance with the Declaration of Helsinki, and the protocol was approved by the Ethics Committee of the Comer Children’s Hospital (approval numbers: 11-0268-AM017, 09-115-B-AM031, and IRB14-1241).

References

  1. Kaditis, A.G.; Alvarez, M.L.A.; Boudewyns, A.; Alexopoulos, E.I.; Ersu, R.; Joosten, K.; Larramona, H.; Miano, S.; Narang, I.; Trang, H.; et al. Obstructive sleep disordered breathing in 2- to 18-year-old children: Diagnosis and management. Eur. Respir. J. 2016, 47, 69–94. [Google Scholar] [CrossRef]
  2. Marcus, C.L.; Brooks, L.J.; Ward, S.D.; Draper, K.A.; Gozal, D.; Halbower, A.C.; Jones, J.; Lehmann, C.; Schechter, M.S.; Sheldon, S.; et al. Diagnosis and management of childhood obstructive sleep apnea syndrome. Pediatrics 2012, 130, e714–e755. [Google Scholar] [CrossRef] [Green Version]
  3. Hunter, S.J.; Gozal, D.; Smith, D.L.; Philby, M.F.; Kaylegian, J.; Gozal, K.L. Effect of sleep-disordered breathing severity on cognitive performance measures in a large community cohort of young school-aged children. Am. J. Respir. Crit. Care Med. 2016, 194, 739–747. [Google Scholar] [CrossRef] [PubMed] [Green Version]
  4. Blechner, M.; Williamson, A.A. Consequences of Obstructive Sleep Apnea in Children. Curr. Probl. Pediatr. Adolesc. Health Care 2016, 46, 19–26. [Google Scholar] [CrossRef]
  5. Álvarez, A.L.M.; Canet, T.; Alarco, C.M.; Estivill, E.; Julián, F.E.; Gozal, D.; Luque, J.M.J.; Roselló, L.M.A.; Pérez, M.F.; Andreu, M.M.; et al. Consensus document on sleep apnea-hypopnea syndrome in children. Arch. Bronconeumol. 2011, 47, 2–18. [Google Scholar] [CrossRef]
  6. Tan, H.L.; Gozal, D.; Ramirez, H.M.; Bandla, H.P.R.; Gozal, K.L. Overnight Polysomnography versus Respiratory Polygraphy in the Diagnosis of Pediatric Obstructive Sleep Apnea. Sleep 2014, 37, 255–260. [Google Scholar] [CrossRef] [PubMed] [Green Version]
  7. Álvarez, A.M.L.; Santos, T.J.; Carbajo, O.E.; Guevara, C.J.A.; Egüia, N.A.I.; Gozal, K.L.; Gozal, D. Reliability of home respiratory polygraphy for the diagnosis of sleep apnea in children. Chest 2015, 147, 1020–1028. [Google Scholar] [CrossRef] [Green Version]
  8. Gil, E.; Bailon, R.; Vergara, J.M.; Laguna, P. PTT Variability for Discrimination of Sleep Apnea Related Decreases in the Amplitude Fluctuations of PPG Signal in Children. IEEE Trans. Biomed. Eng. 2010, 57, 1079–1088. [Google Scholar] [CrossRef]
  9. Dehkordi, P.; Garde, A.; Karlen, W.; Petersen, C.L.; Wensley, D.; Dumont, G.A.; Mark Ansermino, J. Evaluation of cardiac modulation in children in response to apnea/hypopnea using the Phone OximeterTM. Physiol. Meas. 2016, 37, 187–202. [Google Scholar] [CrossRef] [PubMed]
  10. Shouldice, R.B.; Brien, O.L.M.; Brien, O.C.; De Chazal, P.; Gozal, D.; Heneghan, C. Detection of Obstructive Sleep Apnea in Pediatric Subjects using Surface Lead Electrocardiogram Features. Sleep 2004, 27, 784–792. [Google Scholar] [CrossRef] [Green Version]
  11. García, B.V.; Tobal, G.G.; Gozal, K.L.; Álvarez, D.; Villar, V.F.; Crespo, A.; Del Campo, F.; Gozal, D.; Hornero, R. Irregularity and Variability Analysis of Airflow Recordings to Facilitate the Diagnosis of Paediatric Sleep Apnoea-Hypopnoea Syndrome. Entropy 2017, 19, 447. [Google Scholar] [CrossRef] [Green Version]
  12. García, J.J.; Tobal, G.G.C.; García, M.; Gozal, K.L.; Montero, M.A.; Álvarez, D.; Del Campo, F.; Gozal, D.; Hornero, R. Assessment of Airflow and Oximetry Signals to Detect Pediatric Sleep Apnea-Hypopnea Syndrome Using AdaBoost. Entropy 2020, 22, 670. [Google Scholar] [CrossRef] [PubMed]
  13. Hornero, R.; Gozal, K.L.; Tobal, G.G.C.; Philby, M.F.; Álvarez, A.M.L.; Álvarez, D.; Dayyat, E.A.; Xu, Z.; Huang, Y.S.; Tamae Kakazu, M.; et al. Nocturnal Oximetry-based Evaluation of Habitually Snoring Children. Am. J. Respir. Crit. Care Med. 2017, 196, 1591–1598. [Google Scholar] [CrossRef]
  14. Garde, A.; Hoppenbrouwer, X.; Dehkordi, P.; Zhou, G.; Rollinson, A.U.; Wensley, D.; Dumont, G.A.; Ansermino, J.M. Pediatric pulse oximetry-based OSA screening at different thresholds of the apnea-hypopnea index with an expression of uncertainty for inconclusive classifications. Sleep Med. 2019, 60, 45–52. [Google Scholar] [CrossRef] [PubMed]
  15. Berry, R.B.; Budhiraja, R.; Gottlieb, D.J.; Gozal, D.; Iber, C.; Kapur, V.K.; Marcus, C.L.; Mehra, R.; Parthasarathy, S.; Quan, S.F.; et al. Rules for Scoring Respiratory Events in Sleep: Update of the 2007 AASM Manual for the Scoring of Sleep and Associated Events. J. Clin. Sleep Med. 2012, 8, 597–619. [Google Scholar] [CrossRef] [Green Version]
  16. Tobal, G.G.C.; Álvarez, A.M.L.; Álvarez, D.; Del Campo, F.; Santos, T.J.; Hornero, R. Diagnosis of pediatric obstructive sleep apnea: Preliminary findings using automatic analysis of airflow and oximetry recordings obtained at patients’ home. Biomed. Signal Process. Control 2015, 18, 401–407. [Google Scholar] [CrossRef] [Green Version]
  17. García, B.V.; Tobal, G.G.C.; Gozal, K.L.; Álvarez, D.; Villar, V.F.; Núñez, P.; Del Campo, F.; Gozal, D.; Hornero, R. Usefulness of recurrence plots from airflow recordings to aid in paediatric sleep apnoea diagnosis. Comput. Methods Programs Biomed. 2020, 183, 5083. [Google Scholar] [CrossRef]
  18. Kaditis, A.; Gozal, K.L.; Gozal, D. Pediatric OSAS: Oximetry can provide answers when polysomnography is not available. Sleep Med. Rev. 2015, 27, 96–105. [Google Scholar] [CrossRef]
  19. Van Eyck, A.; Verhulst, S.L. Improving the diagnosis of obstructive sleep apnea in children with nocturnal oximetry-based evaluations. Expert Rev. Respir. Med. 2018, 12, 165–167. [Google Scholar] [CrossRef]
  20. Kirk, V.G.; Bohn, S.G.; Flemons, W.W.; Remmers, J.E. Comparison of Home Oximetry Monitoring with Laboratory Polysomnography in Children. CHEST J. 2003, 124, 1702–1708. [Google Scholar] [CrossRef] [Green Version]
  21. Oeverland, B.; Skatvedt, O.; Kvarner, K.J.; Akre, H. Pulseoximetry: Sufficient to diagnose severe sleep apnea. Sleep Med. 2002, 3, 133–138. [Google Scholar] [CrossRef]
  22. Figliola, A.; Serrano, E. Analysis of physiological time series using wavelet transforms. IEEE Eng. Med. Biol. Mag. 1997, 16, 74–79. [Google Scholar] [CrossRef]
  23. Rosso, O.A.; Martin, M.T.; Figliola, A.; Keller, K.; Plastino, A. EEG analysis using wavelet-based information tools. J. Neurosci. Methods 2006, 153, 163–182. [Google Scholar] [CrossRef] [PubMed]
  24. Rioul, O.; Vetterli, M. Wavelets and Signal Processing. IEEE Signal Process. Mag. 1991, 8, 14–38. [Google Scholar] [CrossRef] [Green Version]
  25. Villar, V.F.; Álvarez, D.; Gozal, K.L.; Tobal, G.G.C.; García, B.V.; Crespo, A.; Del Campo, F.; Gozal, D.; Hornero, R. Wavelet analysis of oximetry recordings to assist in the automated detection of moderate-to-severe pediatric sleep apnea-hypopnea syndrome. PLoS ONE 2018, 13, 8502. [Google Scholar] [CrossRef] [Green Version]
  26. Lin, R.; Lee, R.G.; Tseng, C.L.; Zhou, H.K.; Chao, C.F.; Jiang, J.A. A new approach for identifying sleep apnea syndrome using wavelet transform and neural networks. Biomed. Eng. Appl. Basis Commun. 2006, 18, 138–143. [Google Scholar] [CrossRef] [Green Version]
  27. Khandoker, A.; Palaniswami, M.; Karmakar, C. Support Vector Machines for Automated Recognition of Obstructive Sleep Apnoea Syndrome from Electrocardiogram Recordings. IEEE Trans. Inf. Technol. Biomed. 2009. [Google Scholar] [CrossRef] [PubMed]
  28. Romero, F.O.; Berdiñas, G.B.; Betanzos, A.A.; Bonillo, M.V. A new method for sleep apnea classification using wavelets and feedforward neural networks. In Artificial Intelligence in Medicine; Elsevier: Amsterdam, The Netherlands, 2005; Volume 34, pp. 65–76. [Google Scholar]
  29. Tagluk, E.M.; Akin, M.; Sezgin, N. Classification of sleep apnea by using wavelet transform and artificial neural networks. Expert Syst. Appl. 2010, 37, 1600–1607. [Google Scholar] [CrossRef]
  30. Álvarez, D.; Hernández, C.A.; Crespo, A.; Tobal, G.G.C.; Villar, V.F.; García, B.V.; Moreno, F.; Arroyo, C.A.; Ruiz, T.; Hornero, R.; et al. A machine learning-based test for adult sleep apnoea screening at home using oximetry and airflow. Sci. Rep. 2020, 10, 5332. [Google Scholar] [CrossRef] [PubMed]
  31. Várady, P.; Micsik, T.; Benedek, S.; Benyó, Z. A novel method for the detection of apnea and hypopnea events in respiration signals. IEEE Trans. Biomed. Eng. 2002, 49, 936–942. [Google Scholar] [CrossRef] [PubMed]
  32. Mallat, S.G. A Theory for Multiresolution Signal Decomposition: The Wavelet Representation. IEEE Trans. Pattern Anal. Mach. Intell. 1989, 11, 674–693. [Google Scholar] [CrossRef] [Green Version]
  33. Lee, J.; Steele, C.M.; Chau, T. Classification of healthy and abnormal swallows based on accelerometry and nasal airflow signals. Artif. Intell. Med. 2011, 52, 17–25. [Google Scholar] [CrossRef]
  34. Kermit, M.; Eide, Å.J.; Lindblad, T.; Waldemark, K. Treatment of obstructive sleep apnea syndrome by monitoring patients airflow signals. Pattern Recognit. Lett. 2000, 21, 277–281. [Google Scholar] [CrossRef]
  35. Dyduch, H.M. Nonlinear Alleviation of Edge Effects in the Context of Minimizing Prediction Errors. Int. J. Econ. Financ. 2018, 10. [Google Scholar] [CrossRef] [Green Version]
  36. Gogolewski, D. Influence of the edge effect on the wavelet analysis process. Meas. J. Int. Meas. Confed. 2020, 152, 7314. [Google Scholar] [CrossRef]
  37. Daubechies, I. Ten Lectures on Wavelets; Society for Industrial and Applied Mathematics: Philadelphia, PA, USA, 1992. [Google Scholar]
  38. Daubechies, I. The Wavelet Transform, Time-Frequency Localization and Signal Analysis. IEEE Trans. Inf. Theory 1990, 36, 961–1005. [Google Scholar] [CrossRef] [Green Version]
  39. Garcia, B.V.; Tobal, G.G.C.; Gozal, K.L.; Alvarez, D.; Villar, V.F.; Del Campo, F.; Gozal, D.; Hornero, R. Usefulness of Spectral Analysis of Respiratory Rate Variability to Help in Pediatric Sleep Apnea-Hypopnea Syndrome Diagnosis. In Proceedings of the Annual International Conference of the IEEE Engineering in Medicine and Biology Society, EMBS, Berlin, Germany, 23–27 July 2019; Institute of Electrical and Electronics Engineers Inc.: New York, NY, USA, 2019; pp. 4580–4583. [Google Scholar]
  40. Fleming, S.; Thompson, M.; Stevens, R.; Heneghan, C.; Plüddemann, A.; MacOnochie, I.; Tarassenko, L.; Mant, D. Normal ranges of heart rate and respiratory rate in children from birth to 18 years of age: A systematic review of observational studies. Lancet 2011, 377, 1011–1018. [Google Scholar] [CrossRef] [Green Version]
  41. Rosso, O.A.; Blanco, S.; Yordanova, J.; Kolev, V.; Figliola, A.; Schürmann, M.; Bașar, E. Wavelet entropy: A new tool for analysis of short duration brain electrical signals. J. Neurosci. Methods 2001, 105, 65–75. [Google Scholar] [CrossRef]
  42. Olkkonen, J.T. Discrete Wavelet Transforms-Theory and Applications; InTech: Melbourne, FL, USA, 2012. [Google Scholar]
  43. García, B.V.; Tobal, G.G.C.; Gozal, K.L.; Álvarez, D.; Villar, V.F.; Crespo, A.; Del Campo, F.; Gozal, D.; Hornero, R. Análisis espectral de la señal de flujo aéreo como ayuda al diagnóstico del síndrome de apnea-hipopnea del sueño en niños. In Proceedings of the XXXIV Congreso Anual de la Sociedad Española de Ingeniería Biomédica, Valencia, Spain, 23–25 November 2016; pp. 228–231. [Google Scholar]
  44. Taha, B.H.; Dempsey, J.A.; Weber, S.M.; Badr, M.S.; Skatrud, J.B.; Young, T.B.; Jacques, A.J.; Seow, K.C. Automated detection and classification of sleep-disordered breathing from conventional polysomnography data. Sleep 1997, 20, 991–1001. [Google Scholar] [CrossRef]
  45. Yu, L.; Liu, H. Feature Selection for High-Dimensional Data: A Fast Correlation-Based Filter Solution. In Proceedings of the Twentieth International Conference on Machine Learning (ICML-03), Washington, DC, USA, 21–24 August 2003; pp. 856–863. [Google Scholar]
  46. Guyon, I.; Elisseeff, A. An Introduction to Variable and Feature Selection. J. Mach. Learn. Res. 2003, 3, 1157–1182. [Google Scholar]
  47. Xu, Z.; Tobal, G.G.C.; Wu, Y.; Gozal, K.L.; Ni, X.; Hornero, R.; Gozal, D. Cloud Algorithm-Driven Oximetry-Based Diagnosis of Obstructive Sleep Apnea in Symptomatic Habitually-Snoring Children. Eur. Respir. J. 2018, 1788. [Google Scholar] [CrossRef]
  48. Tobal, G.G.C.; Member, S.; Alvarez, D.; Del Campo, F.; Hornero, R.; Member, S. Utility of AdaBoost to Detect Sleep Apnea-Hypopnea Syndrome from Single-Channel Airflow. IEEE Trans. Biomed. Eng. 2016, 63. [Google Scholar] [CrossRef] [Green Version]
  49. Witten, I.H.; Frank, E.; Hall, M.A. Data Mining: Practical Machine Learning Tools and Techniques, 3rd ed.; Morgan Kaufmann/Elsevier: Burlington, NJ, USA, 2011; ISBN 978-0-12-374856-0. [Google Scholar]
  50. Freund, Y.; Schapire, R.E. A Decision-Theoretic Generalization of On-Line Learning and an Application to Boosting. J. Comput. Syst. Sci. 1997, 55, 119–139. [Google Scholar] [CrossRef] [Green Version]
  51. Tobal, G.G.C.; Alvarez, D.; Crespo, A.; Del Campo, F.; Hornero, R. Evaluation of Machine-Learning Approaches to Estimate Sleep Apnea Severity from at-Home Oximetry Recordings. IEEE J. Biomed. Heal Inform. 2018. [Google Scholar] [CrossRef]
  52. Marcos, J.V.; Hornero, R.; Lvarez, D.; Nabney, I.T.; Del Campo, F.; Zamarrón, C. The classification of oximetry signals using Bayesian neural networks to assist in the detection of obstructive sleep apnoea syndrome. Physiol. Meas. 2010, 31, 375–394. [Google Scholar] [CrossRef] [PubMed]
  53. Bishop, C.M. Neural Networks for Pattern Recognition; Oxford University Press: Oxford, UK, 1996. [Google Scholar]
  54. Cohen, J. A Coefficient of Agreement for Nominal Scales. Educ. Psychol. Meas. 1960, 20, 37–46. [Google Scholar] [CrossRef]
  55. Deeks, J.J.; Altman, D.G. Diagnostic tests 4: Likelihood ratios. BMJ 2004, 329, 168–169. [Google Scholar] [CrossRef] [Green Version]
  56. García, B.V.; Tobal, G.G.C.; Gozal, K.L.; Villar, V.F.; Álvarez, D.; Del Campo, F.; Gozal, D.; Hornero, R. Bispectral analysis of overnight airflow to improve the pediatric sleep apnea diagnosis. Comput. Biol. Med. 2021, 129, 4167. [Google Scholar] [CrossRef]
  57. Coifman, R.R.; Meyer, Y.; Quake, S.; Wickerhauser, M.V. Signal processing and compression with wavelet packets. In Wavelets and their Applications; Springer: Dordrecht, The Netherlands, 1994; pp. 363–379. [Google Scholar]
  58. Mendonça, M.; García, R.; Dias, M. A Systematic Review of Detecting Sleep Apnea Using Deep Learning. Sensors 2019, 19, 4934. [Google Scholar] [CrossRef] [Green Version]
Figure 1. Scheme of the proposed methodology.
Sensors 21 01491 g001
Figure 2. (a) Wavelet decomposition where x(n) is the time series, g(n) are half-band high-pass filters, h(n) are half-band low-pass filters, /2 are subsampling processes, and Dj and Aj are detail and approximation signals of the decomposition level j, respectively. (b) Detailed signals at each decomposition level of airflow signal.
Sensors 21 01491 g002
Figure 3. Mother wavelets Haar and Daubechies-5, and a 10-min segment of AF signal.
Sensors 21 01491 g003
Figure 4. Averaged D8 signal by OSA severity groups in the training group.
Sensors 21 01491 g004
Figure 5. Distribution of the coefficients of D8 by OSA severity in the training group.
Sensors 21 01491 g005
Figure 6. Results of feature selection using FCBF in 1000 bootstrap from the training group with wavelet features from AF and ODI3.
Sensors 21 01491 g006
Table 1. Demographic and clinical characteristics of the different subject groups included during the training and testing phases of the study.
CharacteristicAllTraining GroupTest Group
#Subjects946570 (60%)376 (40%)
Age (years)6 [6]6 [5]6 [6]
#Males584 (61.7%)339 (59.5%)245 (65.2%)
BMI (kg/m2)17.9 [6.2]17.7 [6.7]18.1 [6.0]
AHI (e/h)3.8 [7.8]4.2 [8.3]3.3 [6.4]
#No-OSA163 (17.2%)91 (16.0%)72 (19.1%)
#Mild OSA386 (40.8%)223 (39.1%)163 (43.4%)
#Moderate OSA172 (18.2%)111 (19.5%)61 (16.2%)
#Severe OSA225 (23.8%)145 (25.4%)80 (21.3%)
The characteristics are presented as median [interquartile range] or number (%). BMI = body mass index, AHI = apnea-hypopnea index, OSA = obstructive sleep apnea.
Table 2. Statistical analysis of the extracted features in the training group.
FeatureNo-OSAMild OSAModerate OSASevere OSARHOp-Value
MedianIQRMedianIQRMedianIQRMedianIQR
M1D82.620.972.460.862.291.031.671.08−0.4024<<0.01
M2D82.641.272.341.202.271.341.611.28−0.3058<0.01
M3D80.250.690.290.540.500.791.051.060.4413<<0.01
M4D82.872.762.981.963.582.925.324.340.3666<0.01
MaxD86.671.096.610.996.591.366.211.44−0.1662<0.01
MinD8 (10−3)2.870.842.600.932.521.141.861.06−0.4154<<0.01
ED8 (103)2.681.562.361.412.191.671.331.44−0.3809<0.01
WE0.260.040.250.040.260.050.280.050.2793<0.01
ODI31.162.022.213.244.365.9814.2818.680.6979<<0.01
IQR = Interquartile range; RHO = Spearman’s correlation between the feature and the AHI; p-value = result of Kruskal-Wallis test after Bonferroni correction; p-value < 10−19 is denoted as <<0.01.
Table 3. Diagnostic evaluation of the proposed models and ODI3.
AHI cut-off = 1 e/h
ModelSe (%)
[95%CI]
Sp (%)
[95%CI]
Acc (%)
[95%CI]
PPV (%)
[95%CI]
NPV (%)
[95%CI]
LR+
[95%CI]
LR-
[95%CI]
kappa2
ABAF79.89 a,b,c,d
[77.10,82.46]
47.24 a,b,c,d
[39.35,54.83]
73.61 a,b,c,d
[70.86,76.27]
86.43 a,b,c,d
[83.88,88.85]
35.62 a,b,c,d
[29.29,41.47]
1.52 a,b,c,d
[1.36,1.88]
0.43 a,b,c,d
[0.36,0.57]
0.2395 a,b,c,d
[0.1692,0.3059]
ABAF,ODI380.26 a,e,f,g
[77.63,83.05]
68.07 a,e,f,g
[61.85,74.49]
77.97 a,e,f,g
[75.54,80.51]
91.45 a,e,f,g
[89.31,93.30]
44.94 a,e,f,g
[38.97,51.32]
2.56 a,e,f,g
[2.20,3.47]
0.29 a,e,f,g
[0.25,0.35]
0.4040 a,e,f,g
[0.3406,0.4677]
BY-MLPAF100.00 b,e,h,i
[100.00, 100.00]
0.00 b,e,h,i
[0.00, 0.00]
80.85 b,e,h,i
[78.47,83.18]
80.85 b,e,h,i
[78.47,83.18]
ND b,e,h,i1.00 b,e,h,i
[1.00, 1.00]
ND b,e,h,i0.00 b,e,h,i
[0.00, 0,00]
BY-MLPAF,ODI391.16 c,f,h,j
[89.14,93.02]
43.28 c,f,h,j
[36.45,50.59]
81.96 c,f,h,j
[79.46,84.25]
87.18 c,f,h,j
[84.93,89.18]
53.55 c,f,h,j
[45.68,61.85]
1.62 c,f,h,j
[1.46,1.92]
0.21 c,f,h,j
[0.16,0.29]
0.3696 c,f,h,j
[0.2944,0.4413]
ODI359.78 d,g,i,j
[56.66,63.32]
86.06 d,g,i,j
[80.83,90.79]
64.81 d,g,i,j
[61.89,67.97]
94.79 d,g,i,j
[92.83,96.64]
33.68 d,g,i,j
[29.46,38.12]
4.59 d,g,i,j
[3.52,10.83]
0.47 d,g,i,j
[0.42,0.52]
0.2875 d,g,i,j [0.2424,0.3422]
AHI cut-off = 5 e/h
ModelSe (%)
[95%CI]
Sp (%)
[95%CI]
Acc (%)
[95%CI]
PPV (%)
[95%CI]
NPV (%)
[95%CI]
LR+
[95%CI]
LR-
[95%CI]
kappa2
ABAF74.43 a,b,c,d
[70.10,79.12]
47.18 a,b,c,d
[43.31,51.21]
57.46 a,c,d
[54.40,60.51]
45.81 a,c,d
[42.12,49.93]
75.57 a,b,c,d
[71.57,79.90]
1.42 a,c,d
[1.30,1.58]
0.54 a,b,c,d
[0.44,0.65]
0.1928 a,c,d
[0.1408,0.2467]
ABAF,ODI368.03 a,e,f,g
[63.10,72.79]
90.28 a,e,f,g
[87.94,92.45]
81.91 a,e,f
[79.50,84.36]
80.78 a,e,f,g
[76.22,85.18]
82.49 a,e,f,g
[79.67,85.32]
7.18 a,e,f,g
[5.91,11.14]
0.35 a,e,f,g
[0.30,0.41]
0.6009 a,e,f
[0.5497,0.6540]
BY-MLPAF77.25 b,e,h,i
[73.13,81.50]
45.05 b,e,h,i
[41.40,49,13]
57.14 e,h,i
[54.20,60.27]
45.82 e,h,i
[42.03,49.81]
76.89 b,e,h,i
[72.83,81.24]
1.41 e,h,i
[1.30,1.57]
0.50 b,e,h,i
[0.41,0.62]
0.1967 e,h,i
[0.1475,0.2481]
BY-MLPAF,ODI379.32 c,f,h,j
[74.90,83.50]
83.83 c,f,h,j
[80.92,86.61]
82.14 c,f,h,j
[79.84,84.40]
74.57 c,f,h,j
[70.37,79.04]
87.17 c,f,h,j
[84.52,89.91]
4.97 c,f,h,j
[4.28,6.52]
0.25 c,f,h,j
[0.20,0.30]
0.6221 c,f,h,j
[0.5754,0.6696]
ODI369.45 d,g,i,j
[64.63,74.16]
89.38 d,g,i,j
[86.91,91.68]
81.88 d,i,j
[79.54,84.25]
79.79 d,g,i,j
[75.04,83.97]
83.01 d,g,i,j
[80.30,85.84]
6.68 d,g,i,j
[5.60,10.17]
0.34 d,g,i,j
[0.29,0.40]
0.6024 d,i,j [0.5509,0.6553]
AHI cut-off = 10 e/h
ModelSe (%)
[95%CI]
Sp (%)
[95%CI]
Acc (%)
[95%CI]
PPV (%)
[95%CI]
NPV (%)
[95%CI]
LR+
[95%CI]
LR-
[95%CI]
kappa2
ABAF41.06 a,b,c,d
[34.66,47.67]
85.52 a,b,c,d
[83.13,87.83]
76.07 a,b,c,d
[73.51,78.39]
43.30 a,b,c,d
[36.89,50.53]
84.28 a,b,c,d
[81.92,86.60]
2.86 a,b,c,d
[2.36,3.80]
0.69 a,b,c,d
[0.61,0.77]
0.2697 a,b,c,d
[0.2040,0.3363]
ABAF,ODI372.37 a,e,f,g
[66.59,77.90]
95.99 a,e,f,g
[94.60,97.31]
90.99 a,e,f,g
[89.29,92.61]
83.01 a,e,f,g
[77.43,88.45]
92.76 a,e,f,g
[91.03,94.44]
18.99 a,e,f,g
[14.60,51.76]
0.29 a,e,f,g
[0.23,0.35]
0.7159 a,e,g
[0.6605,0.7677]
BY-MLPAF50.00 b,e,h,i
[42.96,56.68]
75.96 b,e,h,i
[73.18,78.80]
70.47 b,e,h,i
[67.77,73.07]
35.97 b,e,h,i
[30.57,41.70]
84.86 b,e,h,i
[82.28,87.30]
2.10 b,e,h,i
[1.77,2.55]
0.66 b,e,h,i
[0.57,0.76]
0.2271 b,e,h,i
[0.1623,0.2886]
BY-MLPAF,ODI374.85 c,f,h,j
[68.75,80.51]
95.00 c,f,h,j
[93.42,96.46]
90.69 c,f,h,j
[88.87,92.47]
80.04 c,f,h,j
[74.53,85.78]
93.32 c,f,h,j
[91.66,94.91]
15.60 c,f,h,j
[12.23,30.31]
0.26 c,f,h,j
[0.21,0.33]
0.7141 c,h,j
[0.6570,0.7660]
ODI381.05 d,g,i,j
[75.71,86.12]
88.58 d,g,i,j
[86.34,90.76]
87.00 d,g,i,j
[84.93,89.06]
65.84 d,g,i,j
[60.31,71.74]
94.55 d,g,i,j
[93.01,96.10]
7.23 d,g,i,j
[6.10,9.98]
0.21 d,g,i,j
[0.16,0.27]
0.6422 d,g,i,j [0.5894,0.6956]
Se = sensitivity; Sp = specificity; Acc = accuracy; PPV = positive predictive value; NPV = negative predictive value; LR+ = positive likelihood ratio; LR- = negative likelihood ratio; kappa2 = Cohen’s kappa of two-class; 95%CI = 95% confidence interval; ND = Non defined; ODI3 = 3% oxygen desaturation index; ABAF = Adaboost.M2 fed with optimal wavelet features from AF; ABAF,ODI3 = Adaboost.M2 fed with optimal wavelet features from AF and ODI3; BY-MLPAF = Bayesian multi-layer perceptron fed with optimal wavelet features from AF; BY-MLPAF,ODI3 = Bayesian multi-layer perceptron fed with optimal wavelet features from AF and ODI3, a Significant differences (p-value < 0.001) between ABAF and ABAF,ODI3; b Significant differences (p-value < 0.001) between ABAF and BY-MLPAF; c Significant differences (p-value < 0.001) between ABAF and BY-MLPAF,ODI3; d Significant differences (p-value < 0.001) between ABAF and ODI3; e Significant differences (p-value < 0.001) between ABAF,ODI3 and BY-MLPAF; f Significant differences (p-value < 0.001) between ABAF,ODI3 and BY-MLPAF,ODI3; g Significant differences (p-value < 0.001) between ABAF,ODI3 and ODI3; h Significant differences (p-value < 0.001) between BY-MLPAF and BY-MLPAF,ODI3; i Significant differences (p-value < 0.001) between BY-MLPAF and ODI3; j Significant differences (p-value < 0.001) between BY-MLPAF,ODI3 and ODI3.
Table 4. Global diagnostic metrics of the proposed models and ODI3.
kappa4 [95%CI]Acc4 (%) [95%CI]
ABAF0.1126 [0.0796,0.1466] a,b,c,d30.52 [27.90,33.37] a,b,c,d
ABAF,ODI30.4021 [0.3605,0.4463] a,e,f,g57.46 [54.47,60.60] a,e,f
BY-MLPAF0.0664 [0.0342,0.1004] b,e,h,i32.53 [29.87,35.20] b,e,h,i
BY-MLPAF,ODI30.4088 [0.3637,0.4493] c,f,h,j58.57 [55.36,61.47] c,f,h,j
ODI30.3826 [0.3362,0.4258] d,g,i,j57.23 [53.95,60.22] d,i,j
kappa4 = Cohen’s kappa of four-class; Acc4 = four-class accuracy; 95%CI = 95% confidence interval; ODI3 = 3% oxygen desaturation index; ABAF = Adaboost.M2 fed with optimal wavelet features from AF; ABAF,ODI3 = Adaboost.M2 fed with optimal wavelet features from AF and ODI3; BY-MLPAF = Bayesian multi-layer perceptron fed with optimal wavelet features from AF; BY-MLPAF,ODI3 = Bayesian multi-layer perceptron fed with optimal wavelet features from AF and ODI3; a Significant differences (p-value < 0.001) between ABAF and ABAF,ODI3; b Significant differences (p-value < 0.001) between ABAF and BY-MLPAF; c Significant differences (p-value < 0.001) between ABAF and BY-MLPAF,ODI3; d Significant differences (p-value < 0.001) between ABAF and ODI3; e Significant differences (p-value < 0.001) between ABAF,ODI3 and BY-MLPAF; f Significant differences (p-value < 0.001) between ABAF,ODI3 and BY-MLPAF,ODI3; g Significant differences (p-value < 0.001) between ABAF,ODI3 and ODI3; h Significant differences (p-value < 0.001) between BY-MLPAF and BY-MLPAF,ODI3; i Significant differences (p-value < 0.001) between BY-MLPAF and ODI3; j Significant differences (p-value < 0.001) between BY-MLPAF,ODI3 and ODI3.
Table 5. Comparison with other studies of the literature.
StudyNº Subjects
(Total Dataset/Test Set)
SignalMethods
(Analysis/Selection/Classification)
AHI cut-off (e/h)Se (%)Sp (%)PPV (%)NPV (%)LR+LR-Acc (%)
Shouldice et al. (2004) [10]50/25ECGTemporal and spectral analysis/–/ QDA185.7081.8085.7081.804.710.1884.00
Gil et al. (2010) [8]21/21PPGAnalysis of HRV, PTTV, and DAP events/Wrap method/LDA575.0085.70--5.24 *0.29 *80.00
Dehkordi et al. (2016) [9]146/146PPGTemporal, spectral, and detrended fluctuation analysis/LASSO/LASSO576.0068.00--2.38 *0.35 *71.00
Hornero et al. (2017) [13]4,191/3,602SpO2Statistical, spectral, non-linear
analysis, and ODI3/FCBF/
MLP
184.0253.1981.6457.341.790.3075.15
568.1687.1968.6286.955.320.3781.65
1068.6694.0767.6894.3111.580.3390.17
Vaquerizo-Villar et al. (2018) [25]981/392SpO2Statistical, spectral, wavelet analysis, and ODI3/FCBF/SVM571.9091.1083.8084.5014.600.3184.00
Xu et al. (2019) [47]432/432SpO2ODI3 and 3rd statistical
moment of the spectral band
of interest/FCBF/MLP
195.3419.1081.96 *51.52 *1.180.2579.63
577.7880.4672.28 *84.68 *3.990.2779.40
1073.5392.7375.76 *91.89 *10.070.2988.19
Garde et al. (2019) [14]207/207SpO2
PRV
Temporal and spectral analysis/Stepwise-selection/LR180.0065.00--2.29 *0.31 *75.00
585.0079.00--4.05 *0.19 *82.00
1082.0091.00--9.11 *0.20 *89.00
Barroso-García et al. (2020) [17]946/376AF
ODI3
Recurrence quantification analysis and ODI3/FCBF/BY-MLP197.7022.2284.1469.571.260.1083.24
578.7278.3068.5285.983.630.2778.46
1078.7594.2678.7594.2613.710.2390.96
Jiménez-
García et al.
(2020) [12]
974/390AF
SpO2
Statistical, non-linear, spectral
analysis, and ODI3/FCBF /
Multiclass AdaBoost.M2 with LDA
192.0636.0085.8051.921.440.2281.28
576.0385.6676.0385.665.300.2882.05
1062.6597.7288.1490.6327.480.3890.26
Barroso-García et al. (2021) [56]946/376AF
ODI3
Bispectral analysis and ODI3/FCBF/MLP198.0315.2783.0165.011.160.1482.16
581.5683.0074.1788.254.850.2282.49
1072.2994.9879.5892.6915.010.2990.15
This study946/376AF
ODI3
Wavelet analysis and ODI3/FCBF/Multiclass AdaBoost.M2 with decision trees180.2668.0791.4544.942.560.2977.97
568.0390.2880.7882.497.180.3581.91
1072.3795.9983.0192.7618.990.2990.99
Wavelet analysis and ODI3/FCBF/BY-MLP191.1643.2887.1853.551.620.2181.96
579.3283.8374.5787.174.970.2582.14
1074.8595.0080.0493.3215.600.2690.69
QDA = Quadratic discriminant analysis, HRV = Heart rate variability, PTTV = Pulse transit time variability, DAP = Decreases in amplitude fluctuations of the PPG signal, LDA = Linear discriminant analysis, LASSO = Least absolute shrinkage and selection operator, ODI3 = 3% oxygen desaturation index, FCBF = Fast correlation based filter, MLP = Multi-Layer perceptron neural network, FSLR = Forward stepwise logistic regression, LR = Logistic regression model, SVM = Support vector machine, PRV = Pulse rate variability, BY-MLP = Multi-Layer perceptron neural network with Bayesian approach. * Computed from reported data.
Publisher’s Note: MDPI stays neutral with regard to jurisdictional claims in published maps and institutional affiliations.

