
Structural Health Monitoring Using Ultrasonic Guided-Waves and the Degree of Health Index

 , , , and
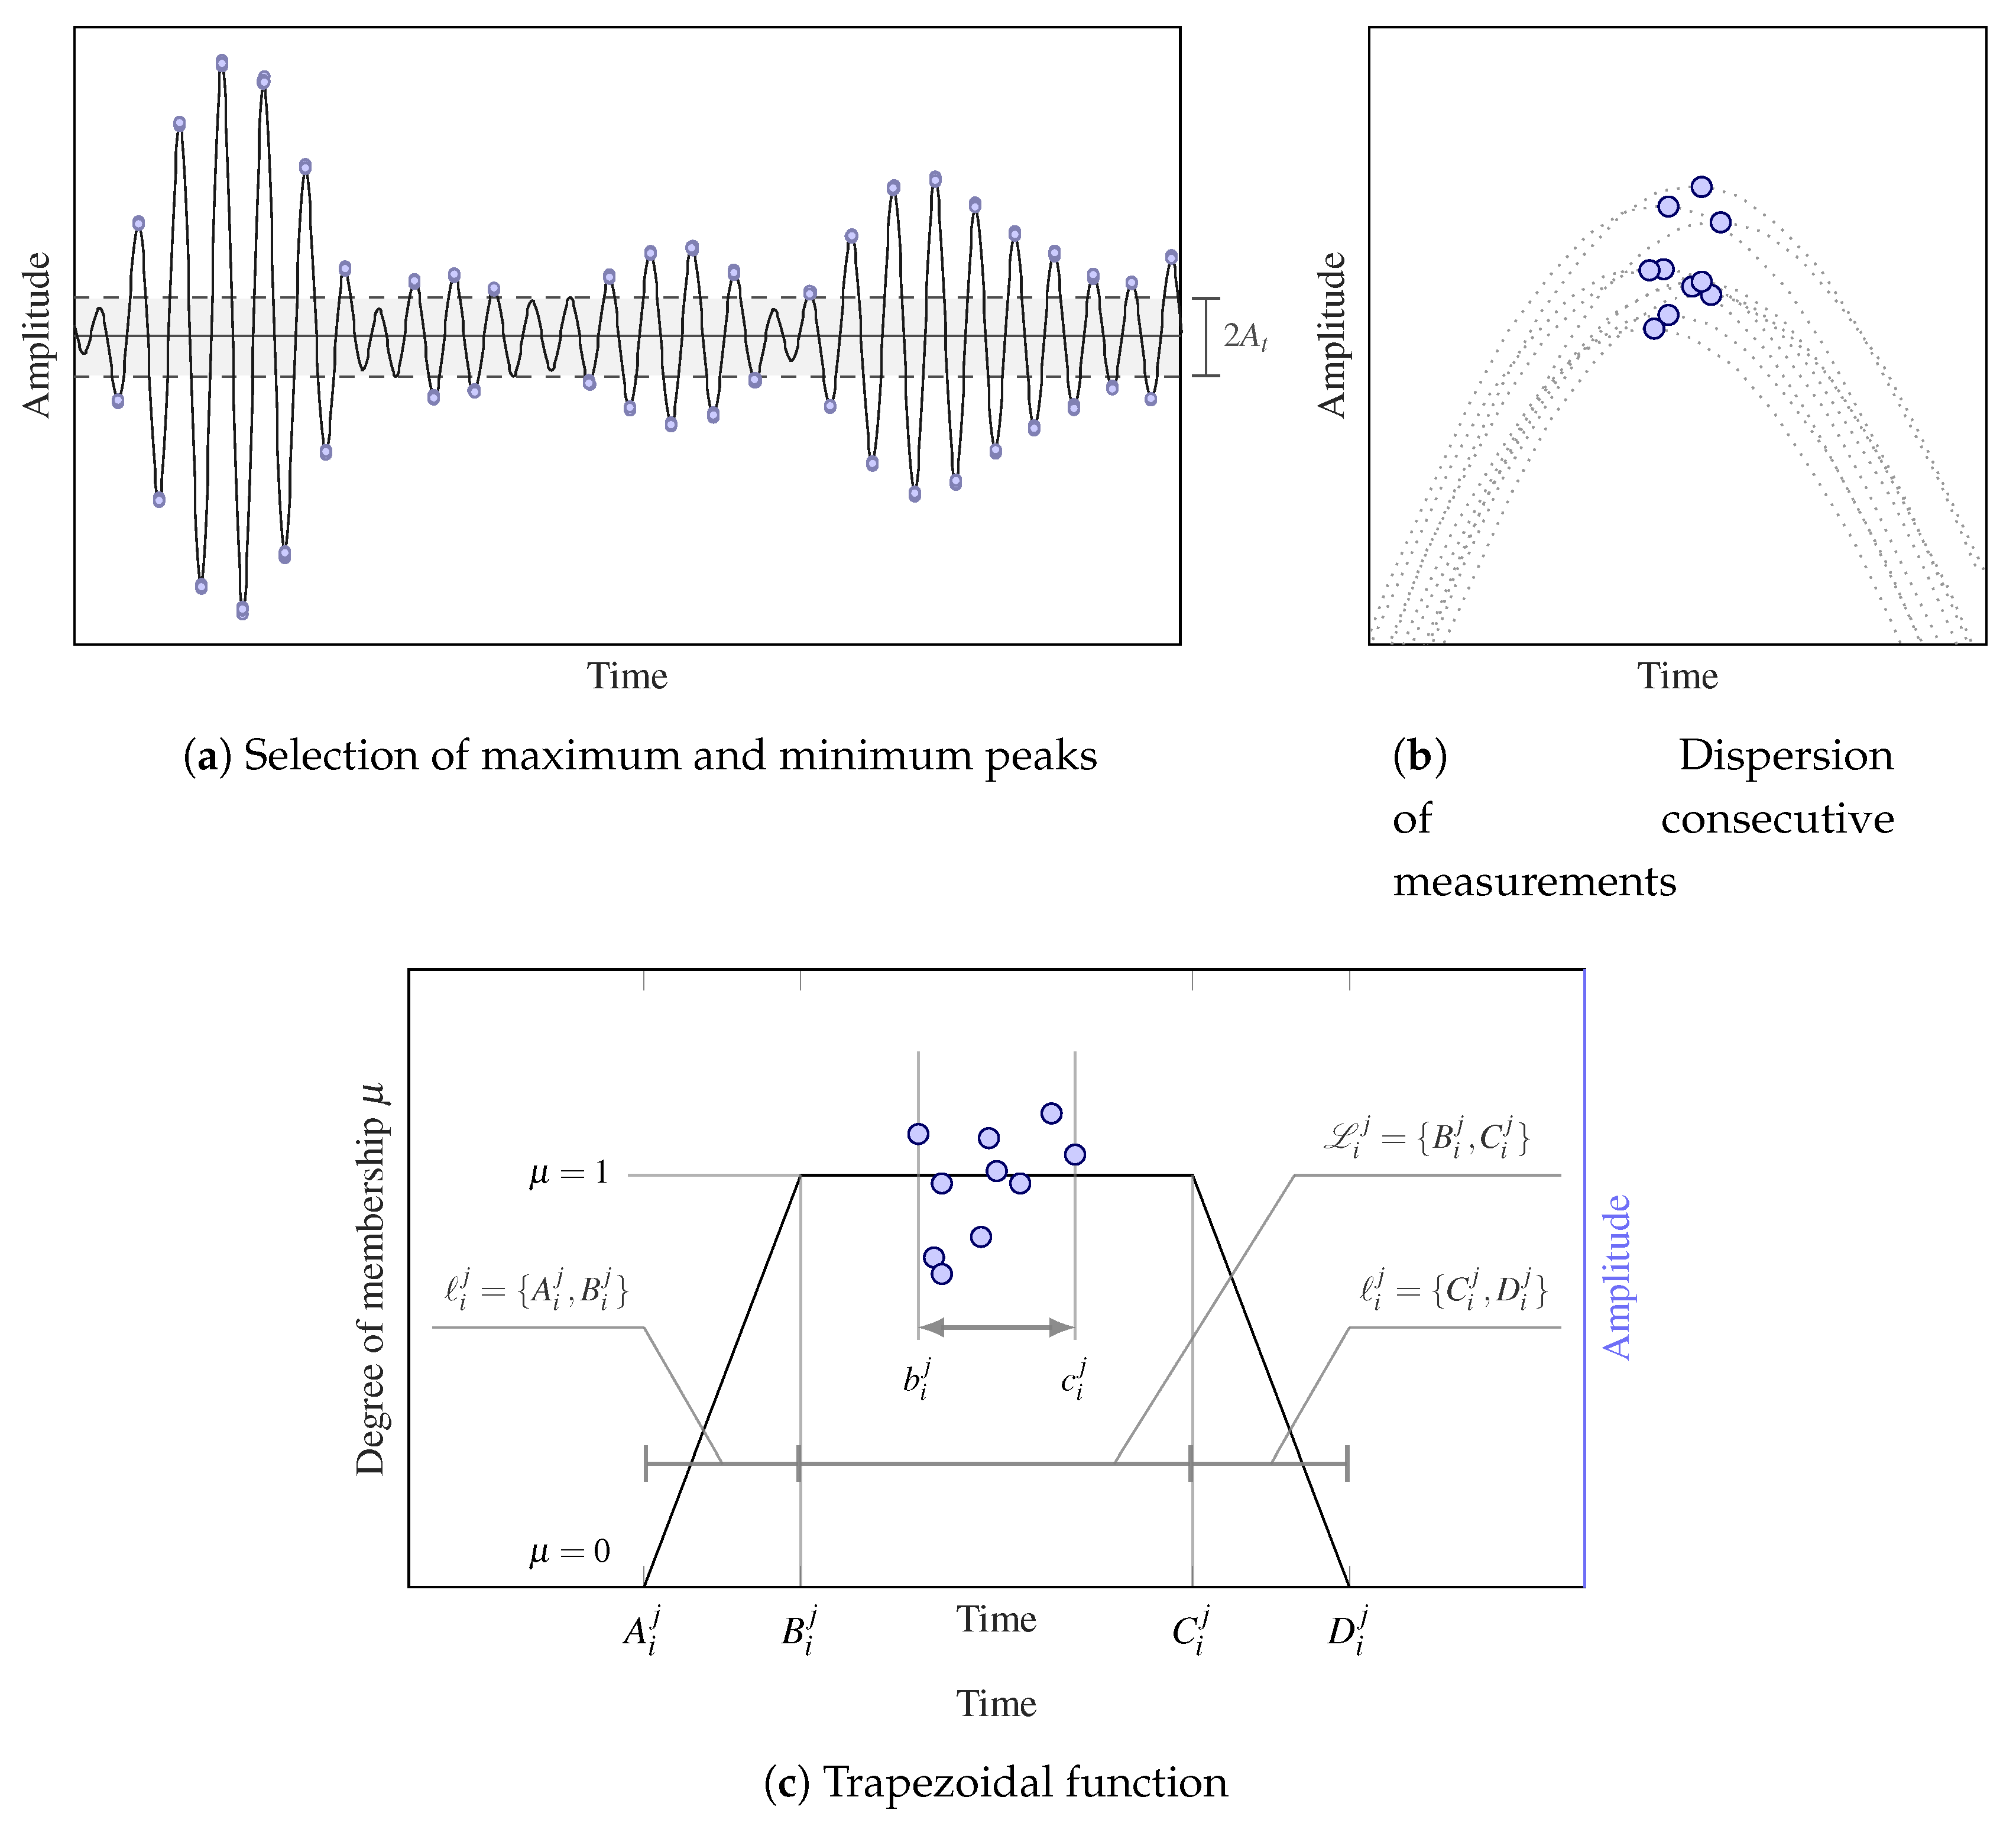
Abstract
:1. Introduction
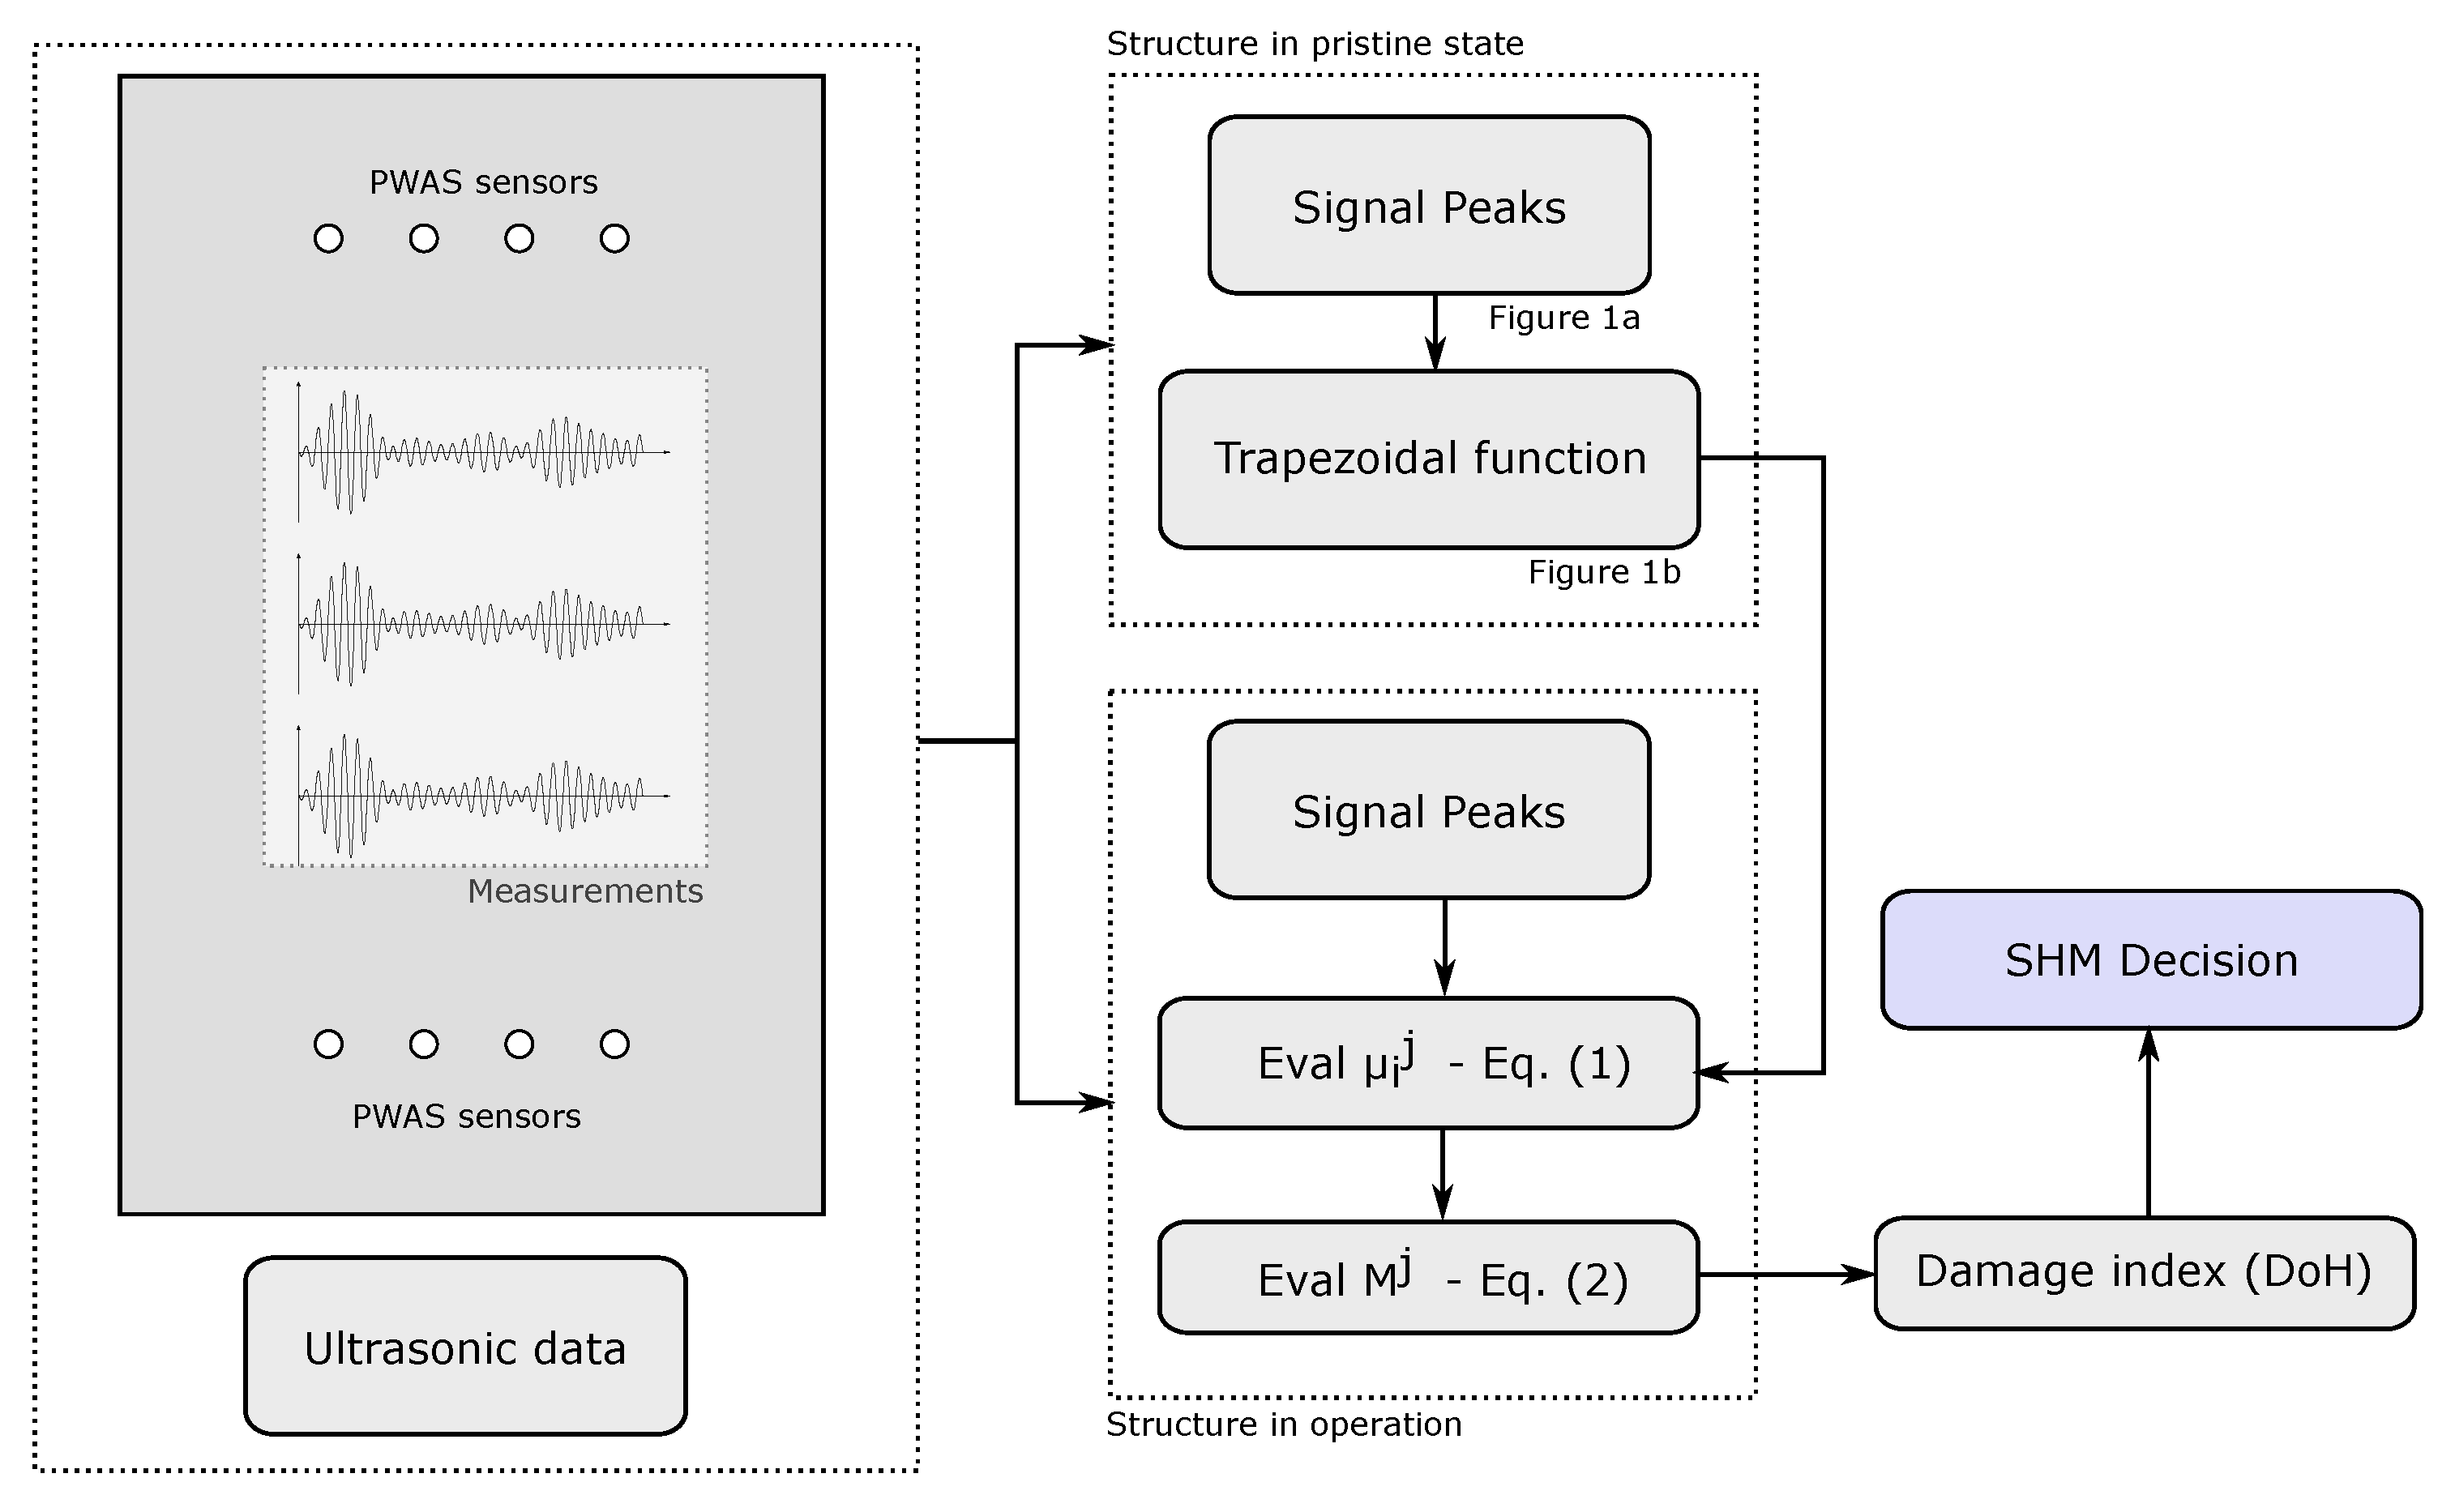
2. Methodology
3. Case Study
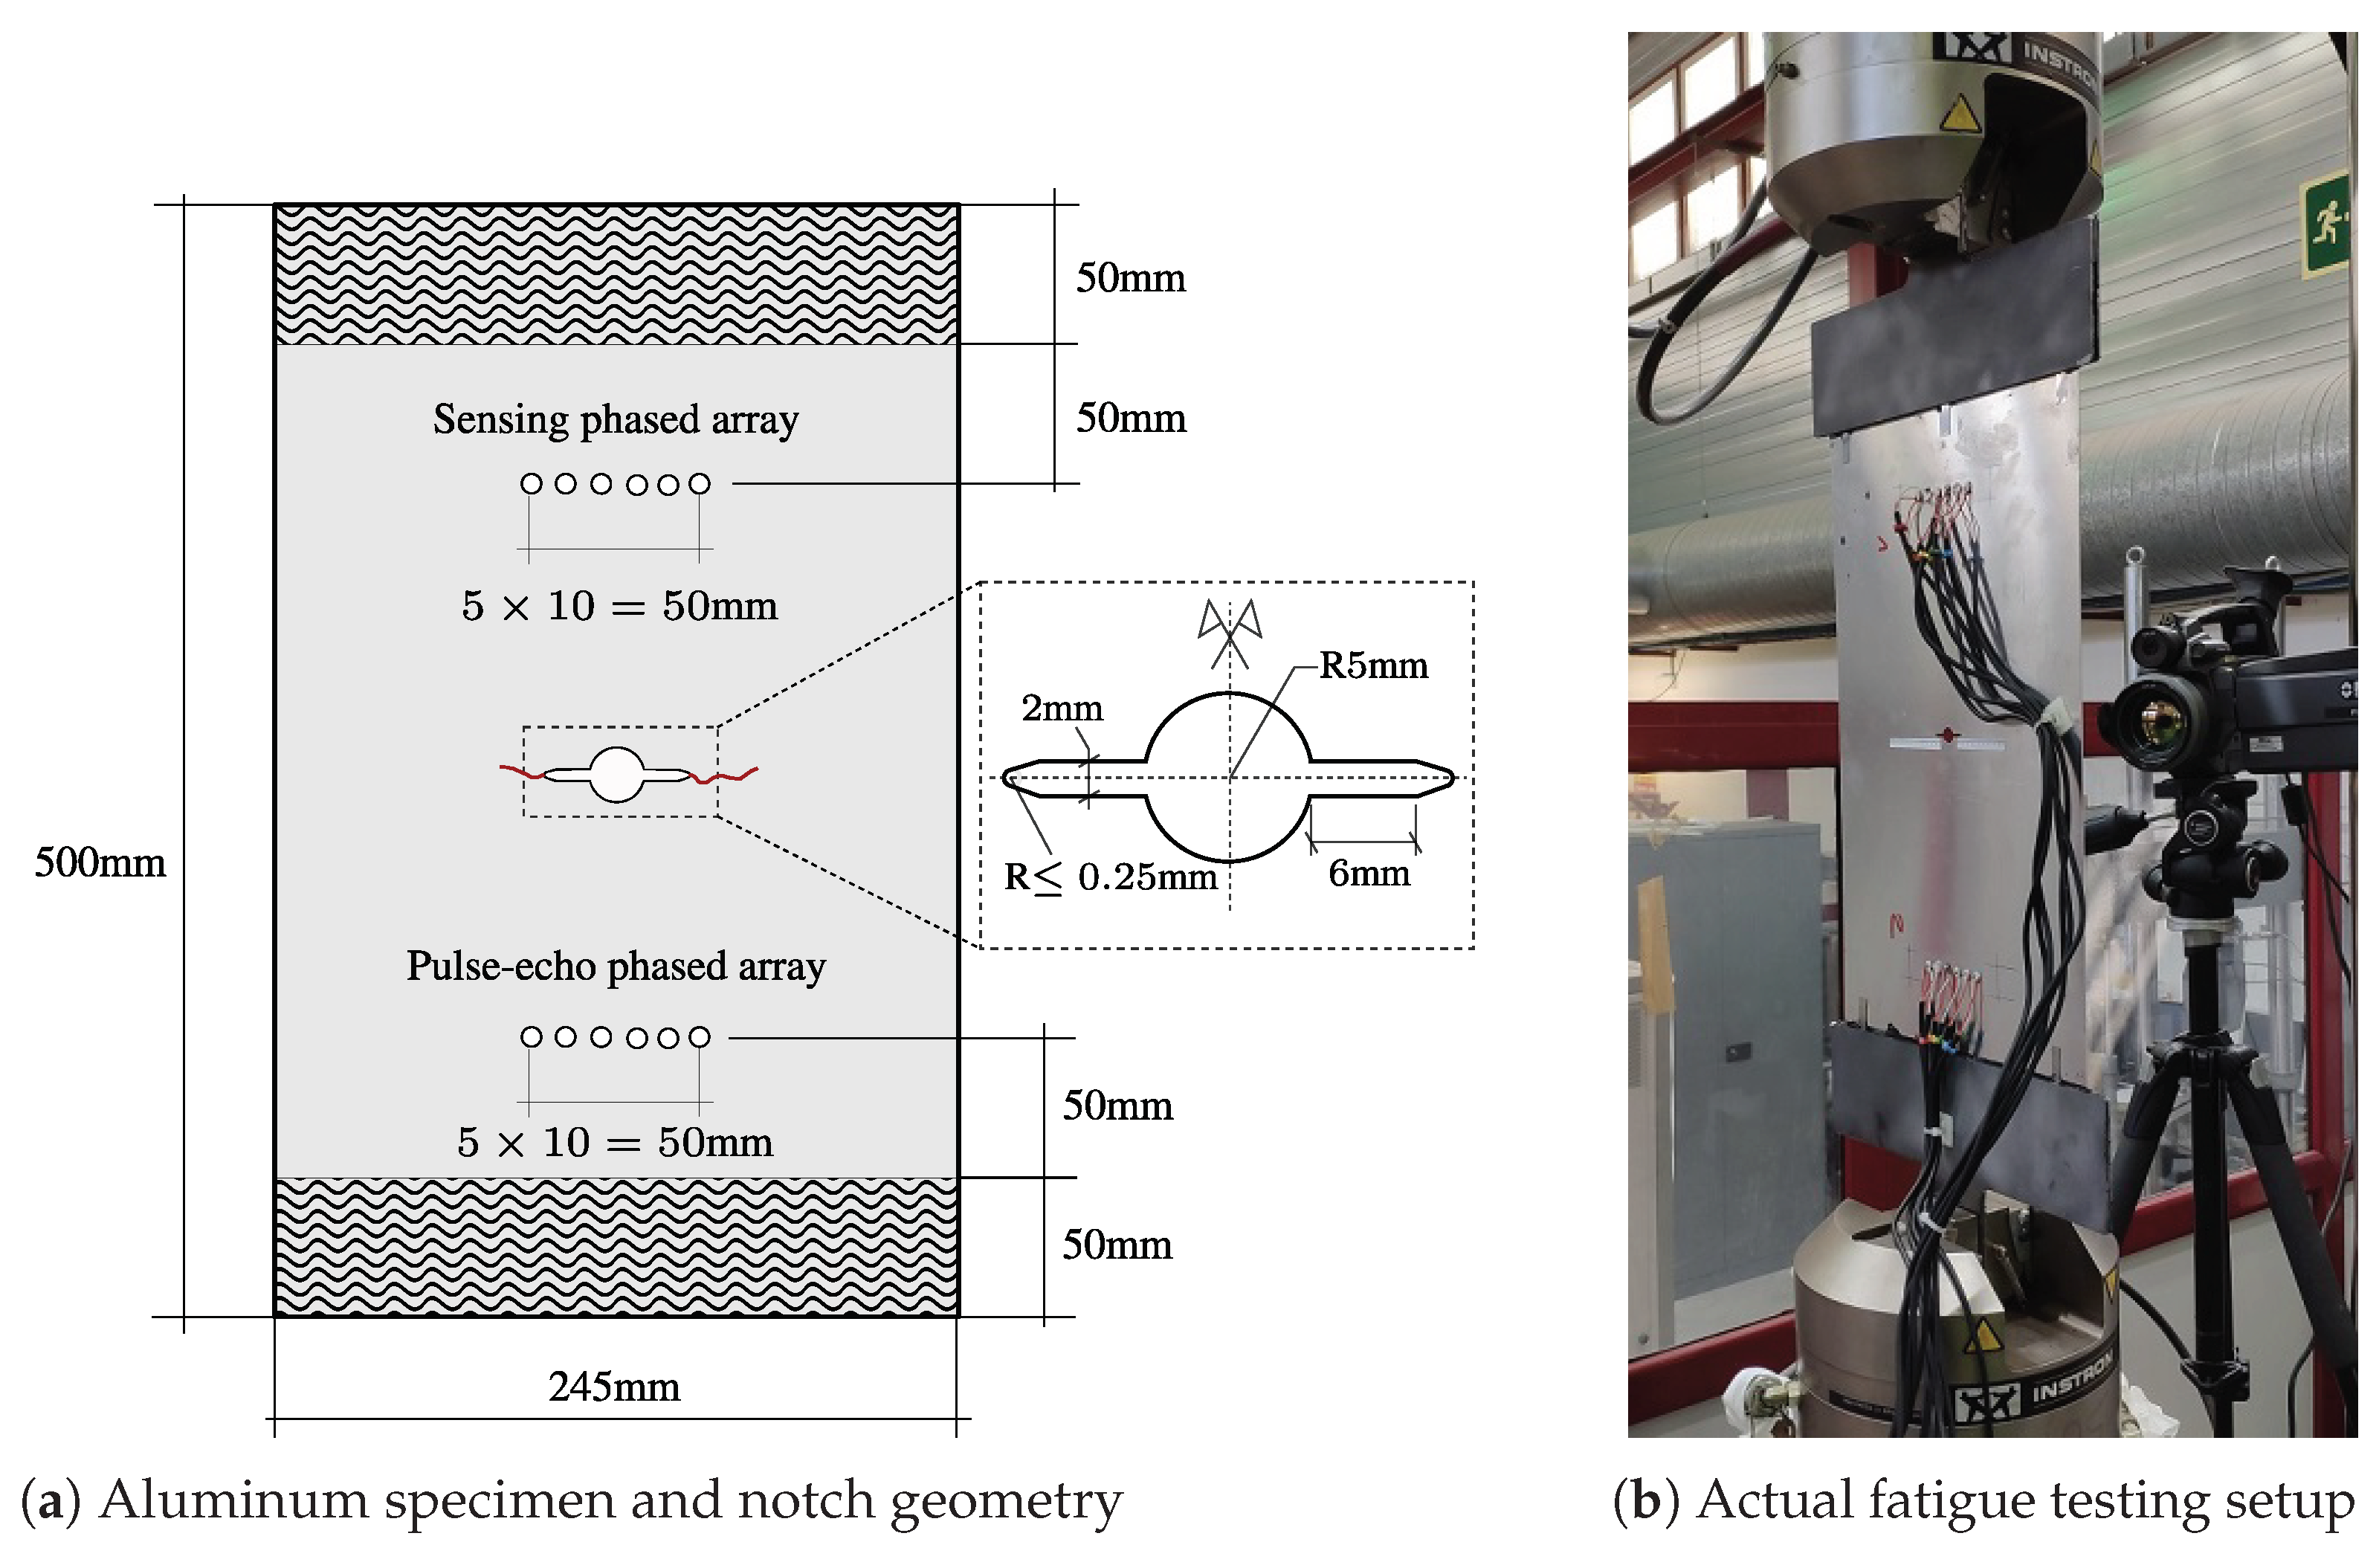
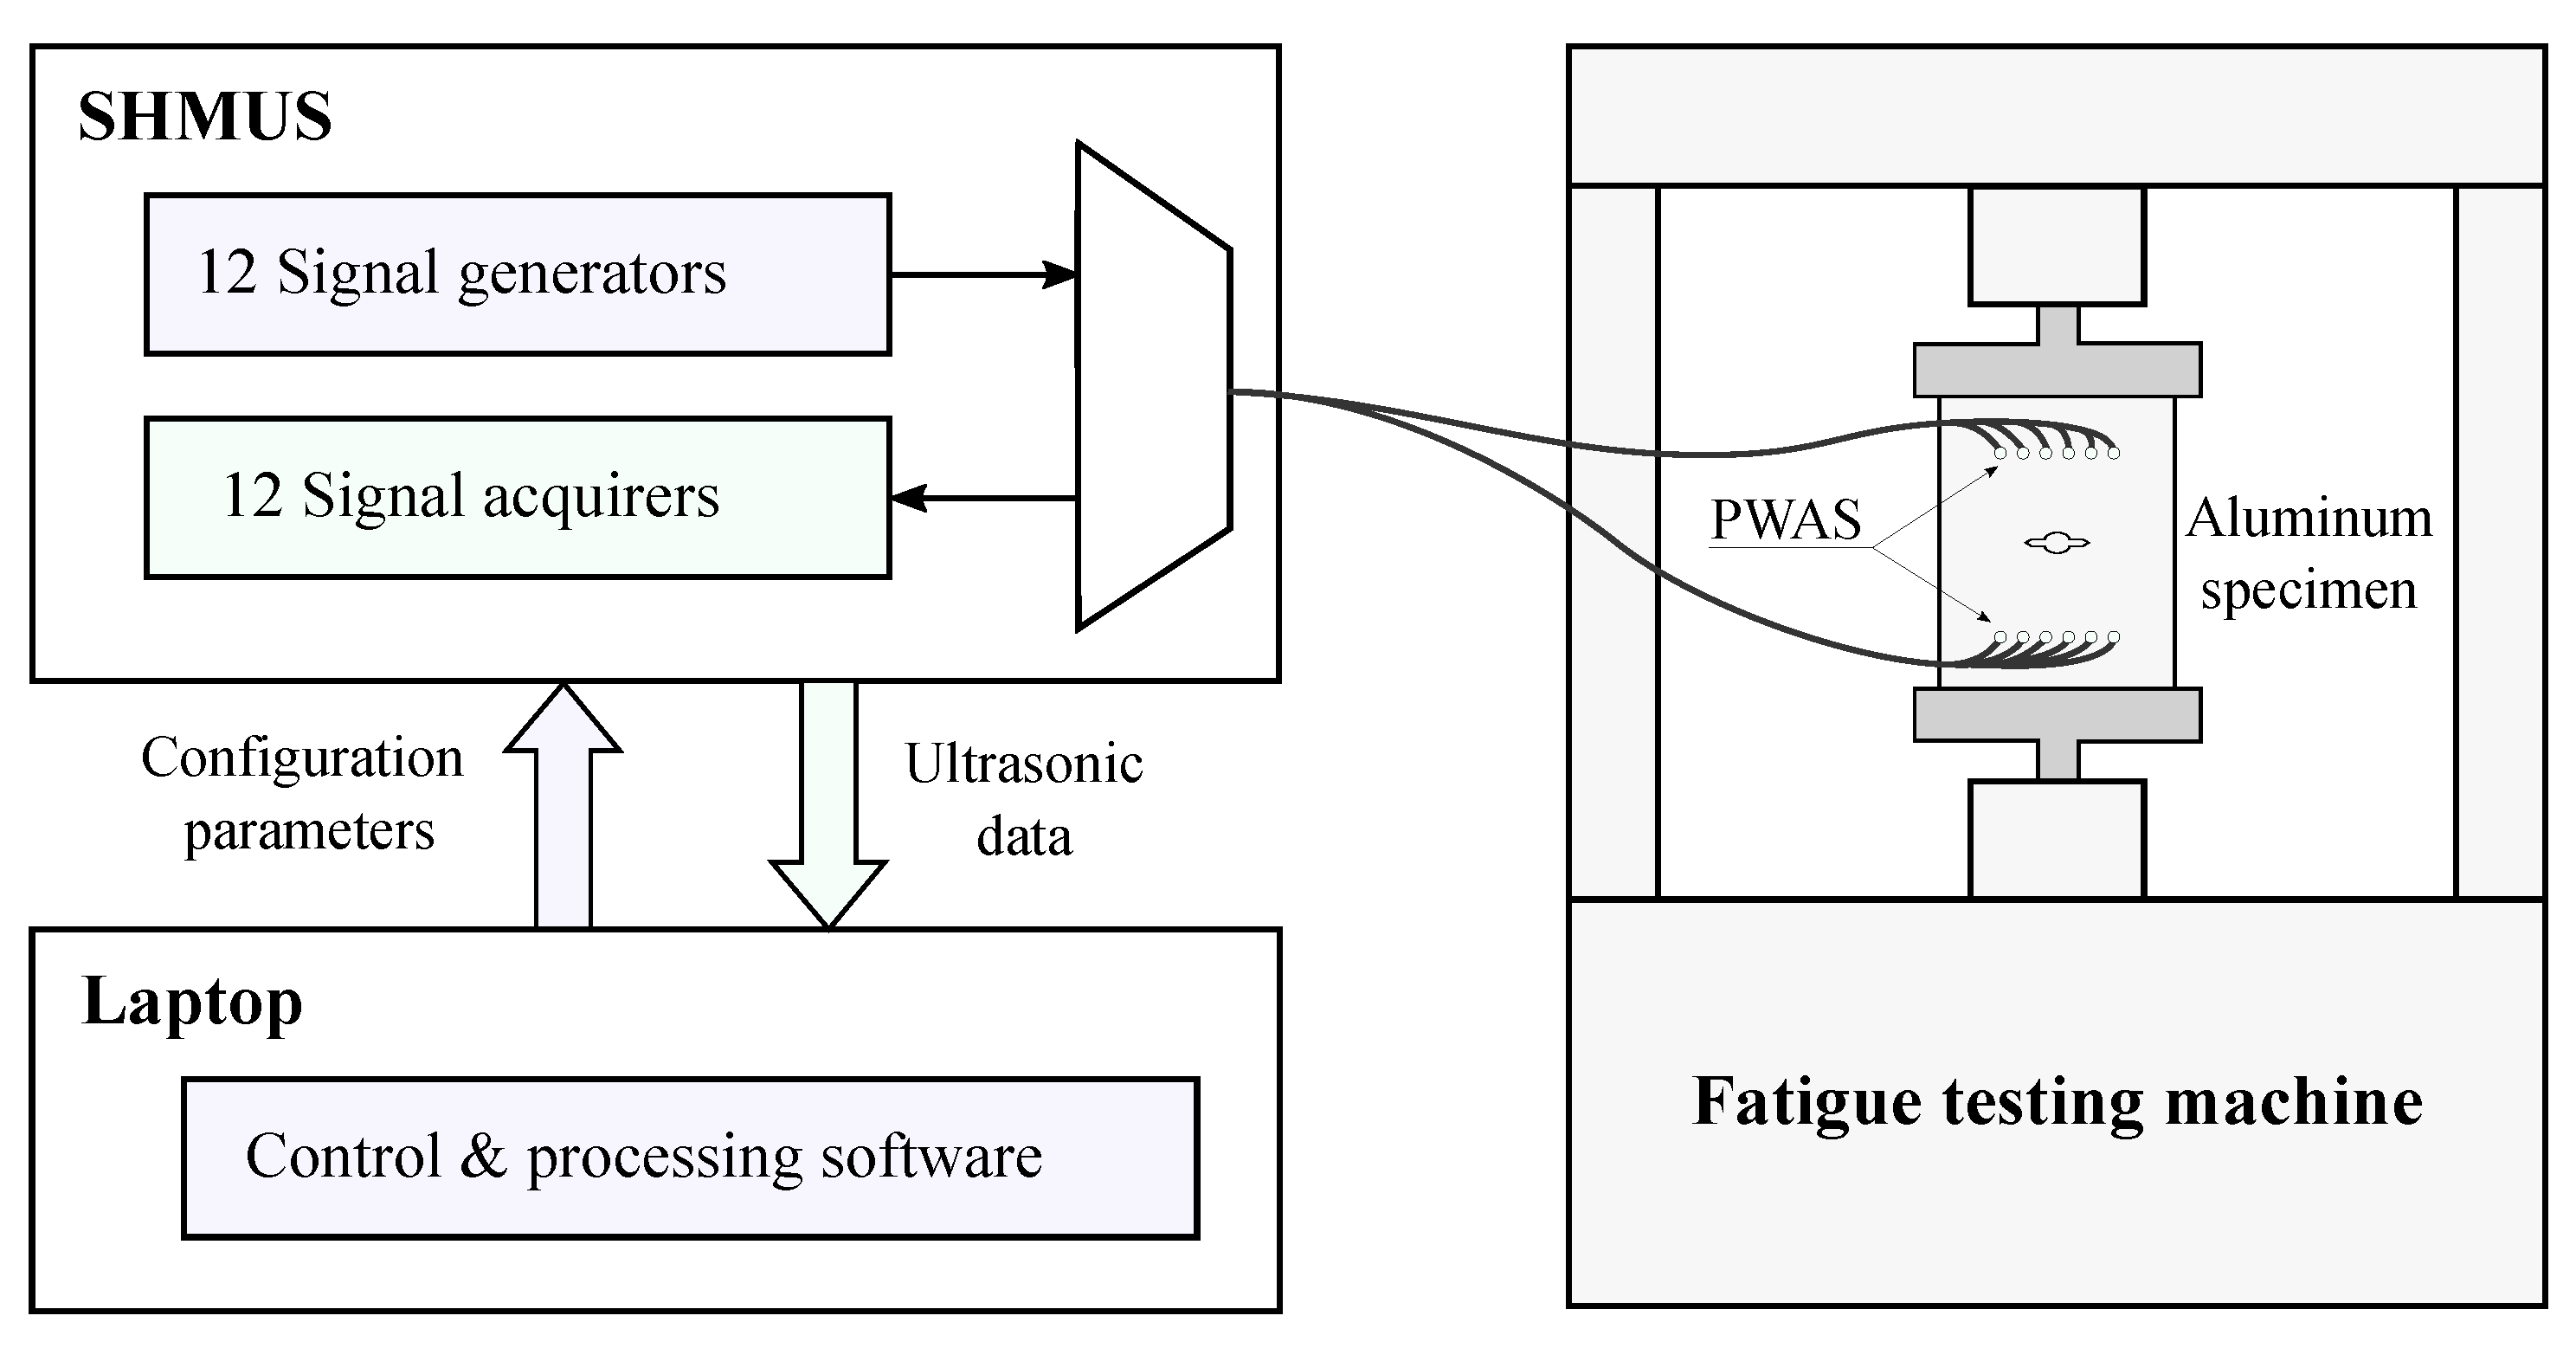
3.1. Fatigue Testing Configuration
3.2. Ultrasonic Guided-Wave Based Tests
3.3. Damage Monitoring Results
4. Discussion
4.1. On the Ultrasonic Guided-Waves Results
4.2. On the Fatigue Properties of the Specimen
5. Conclusions
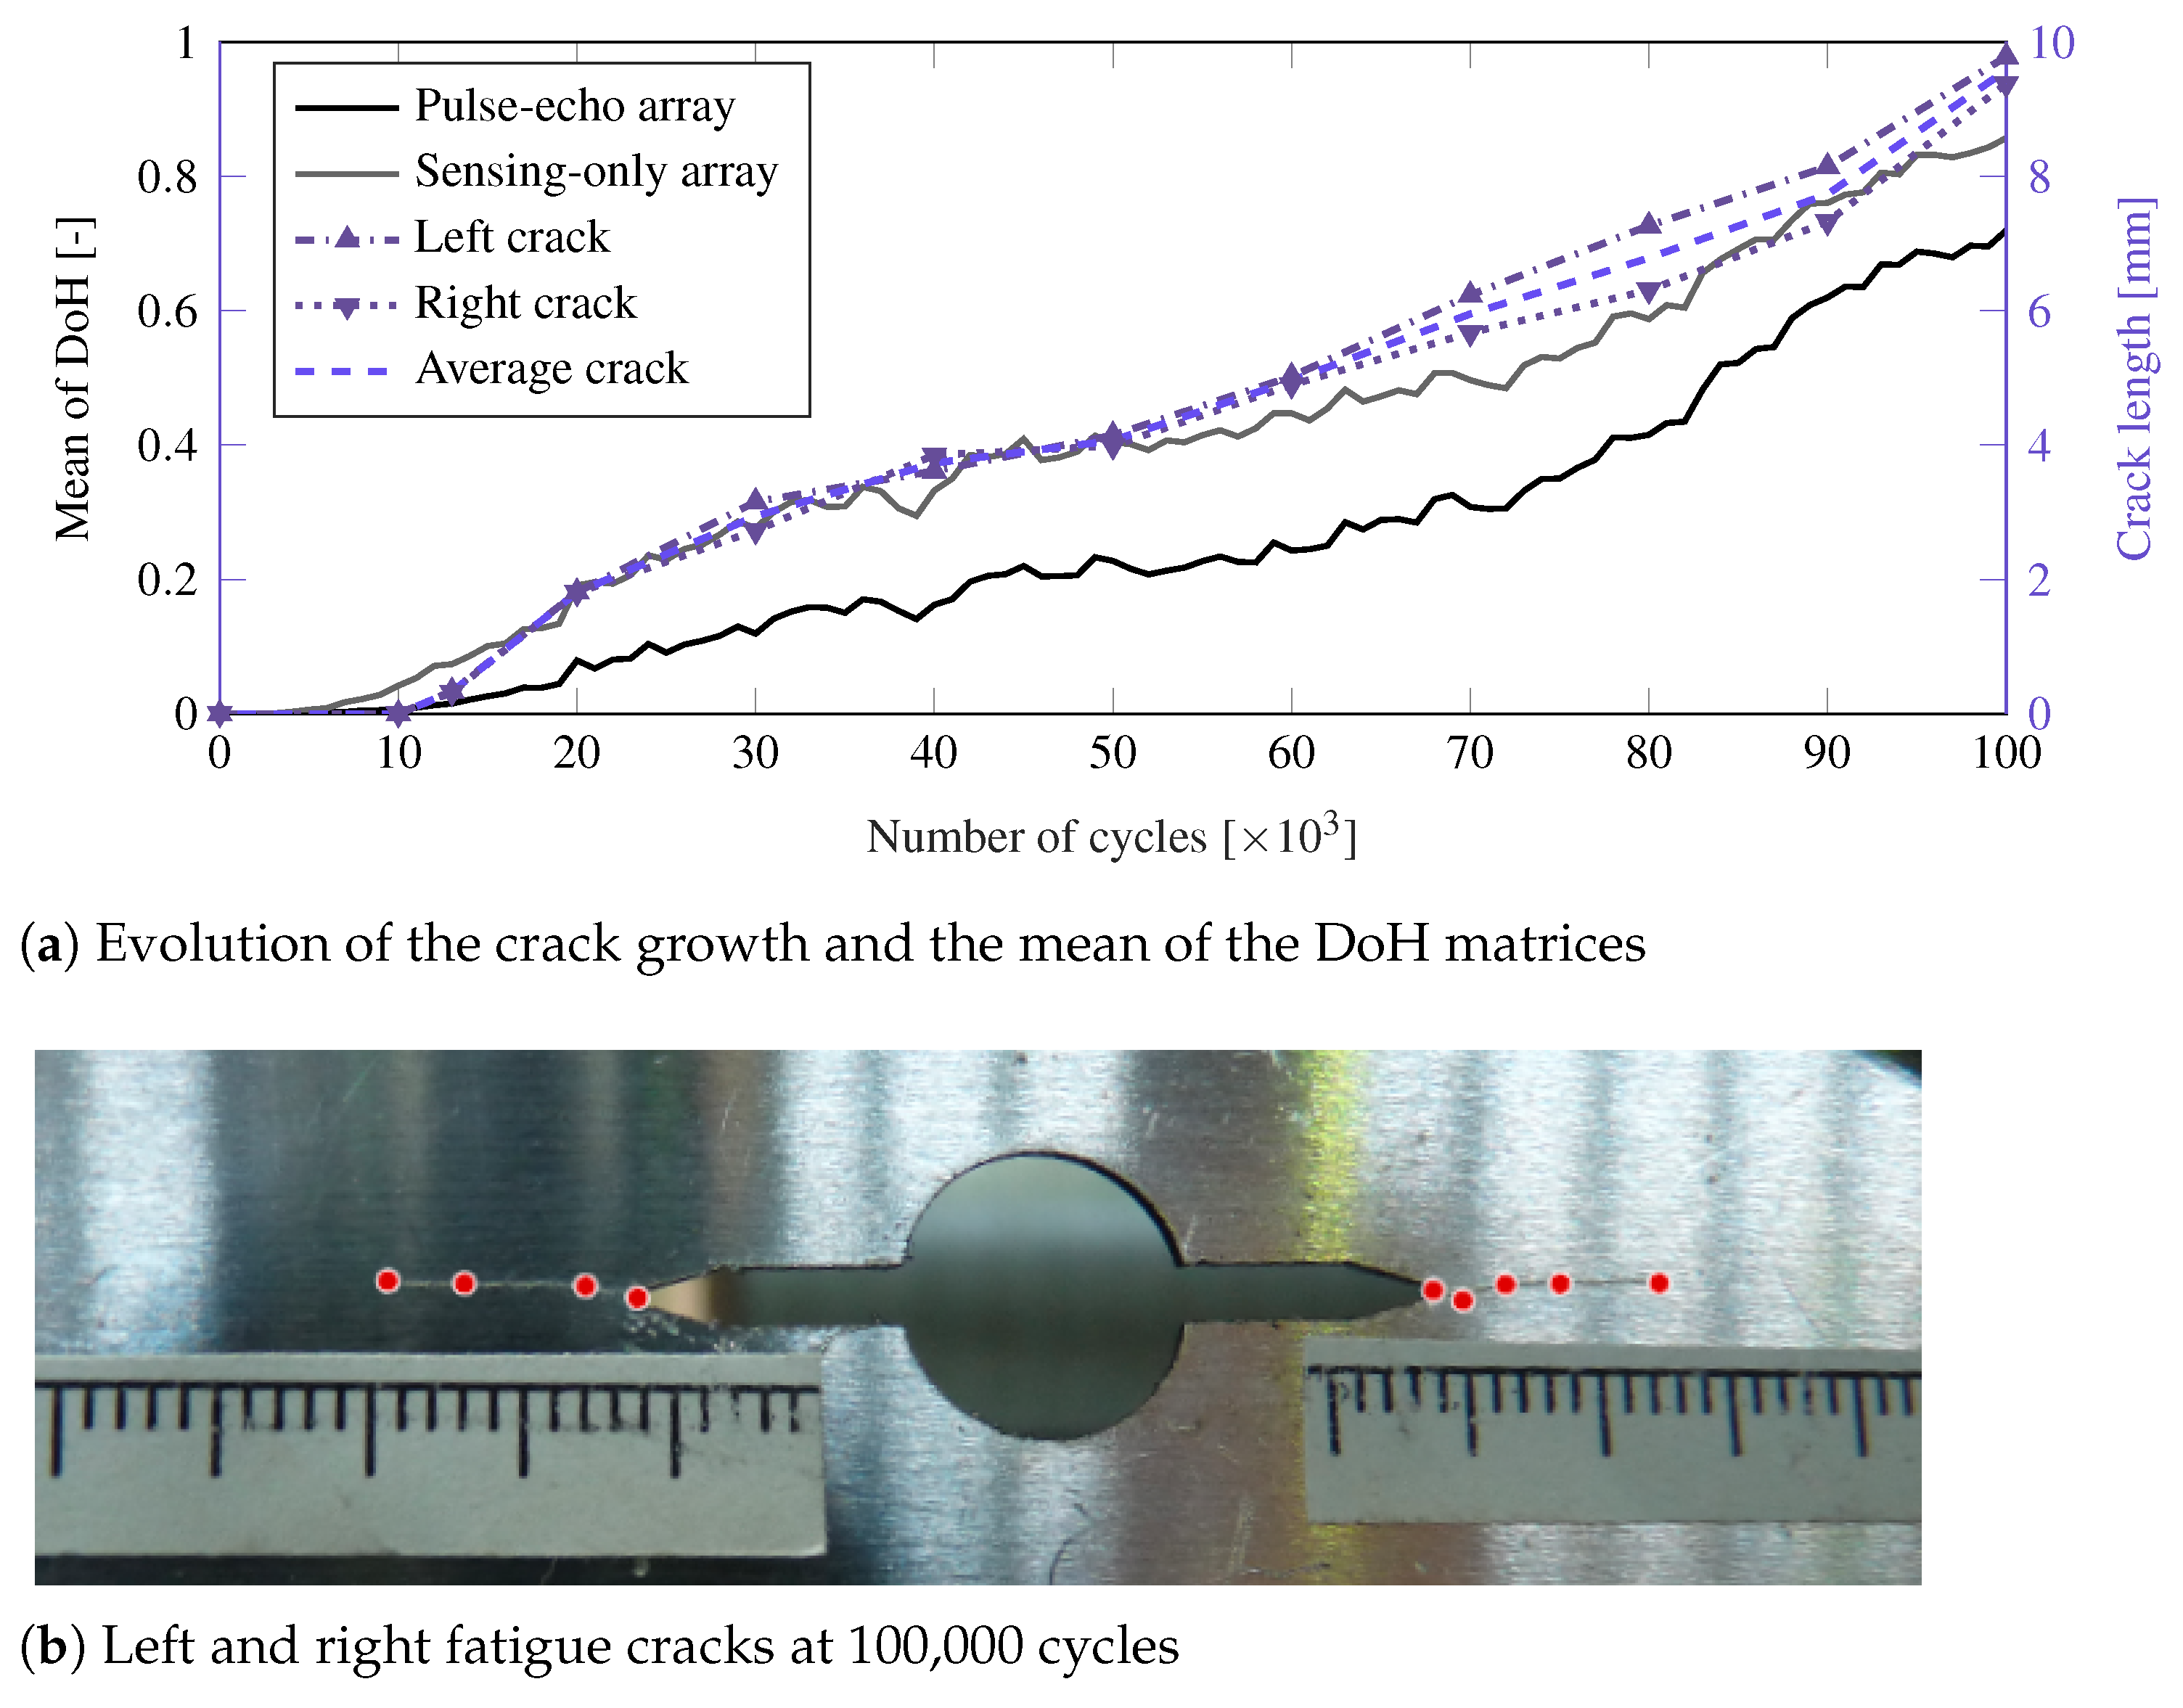
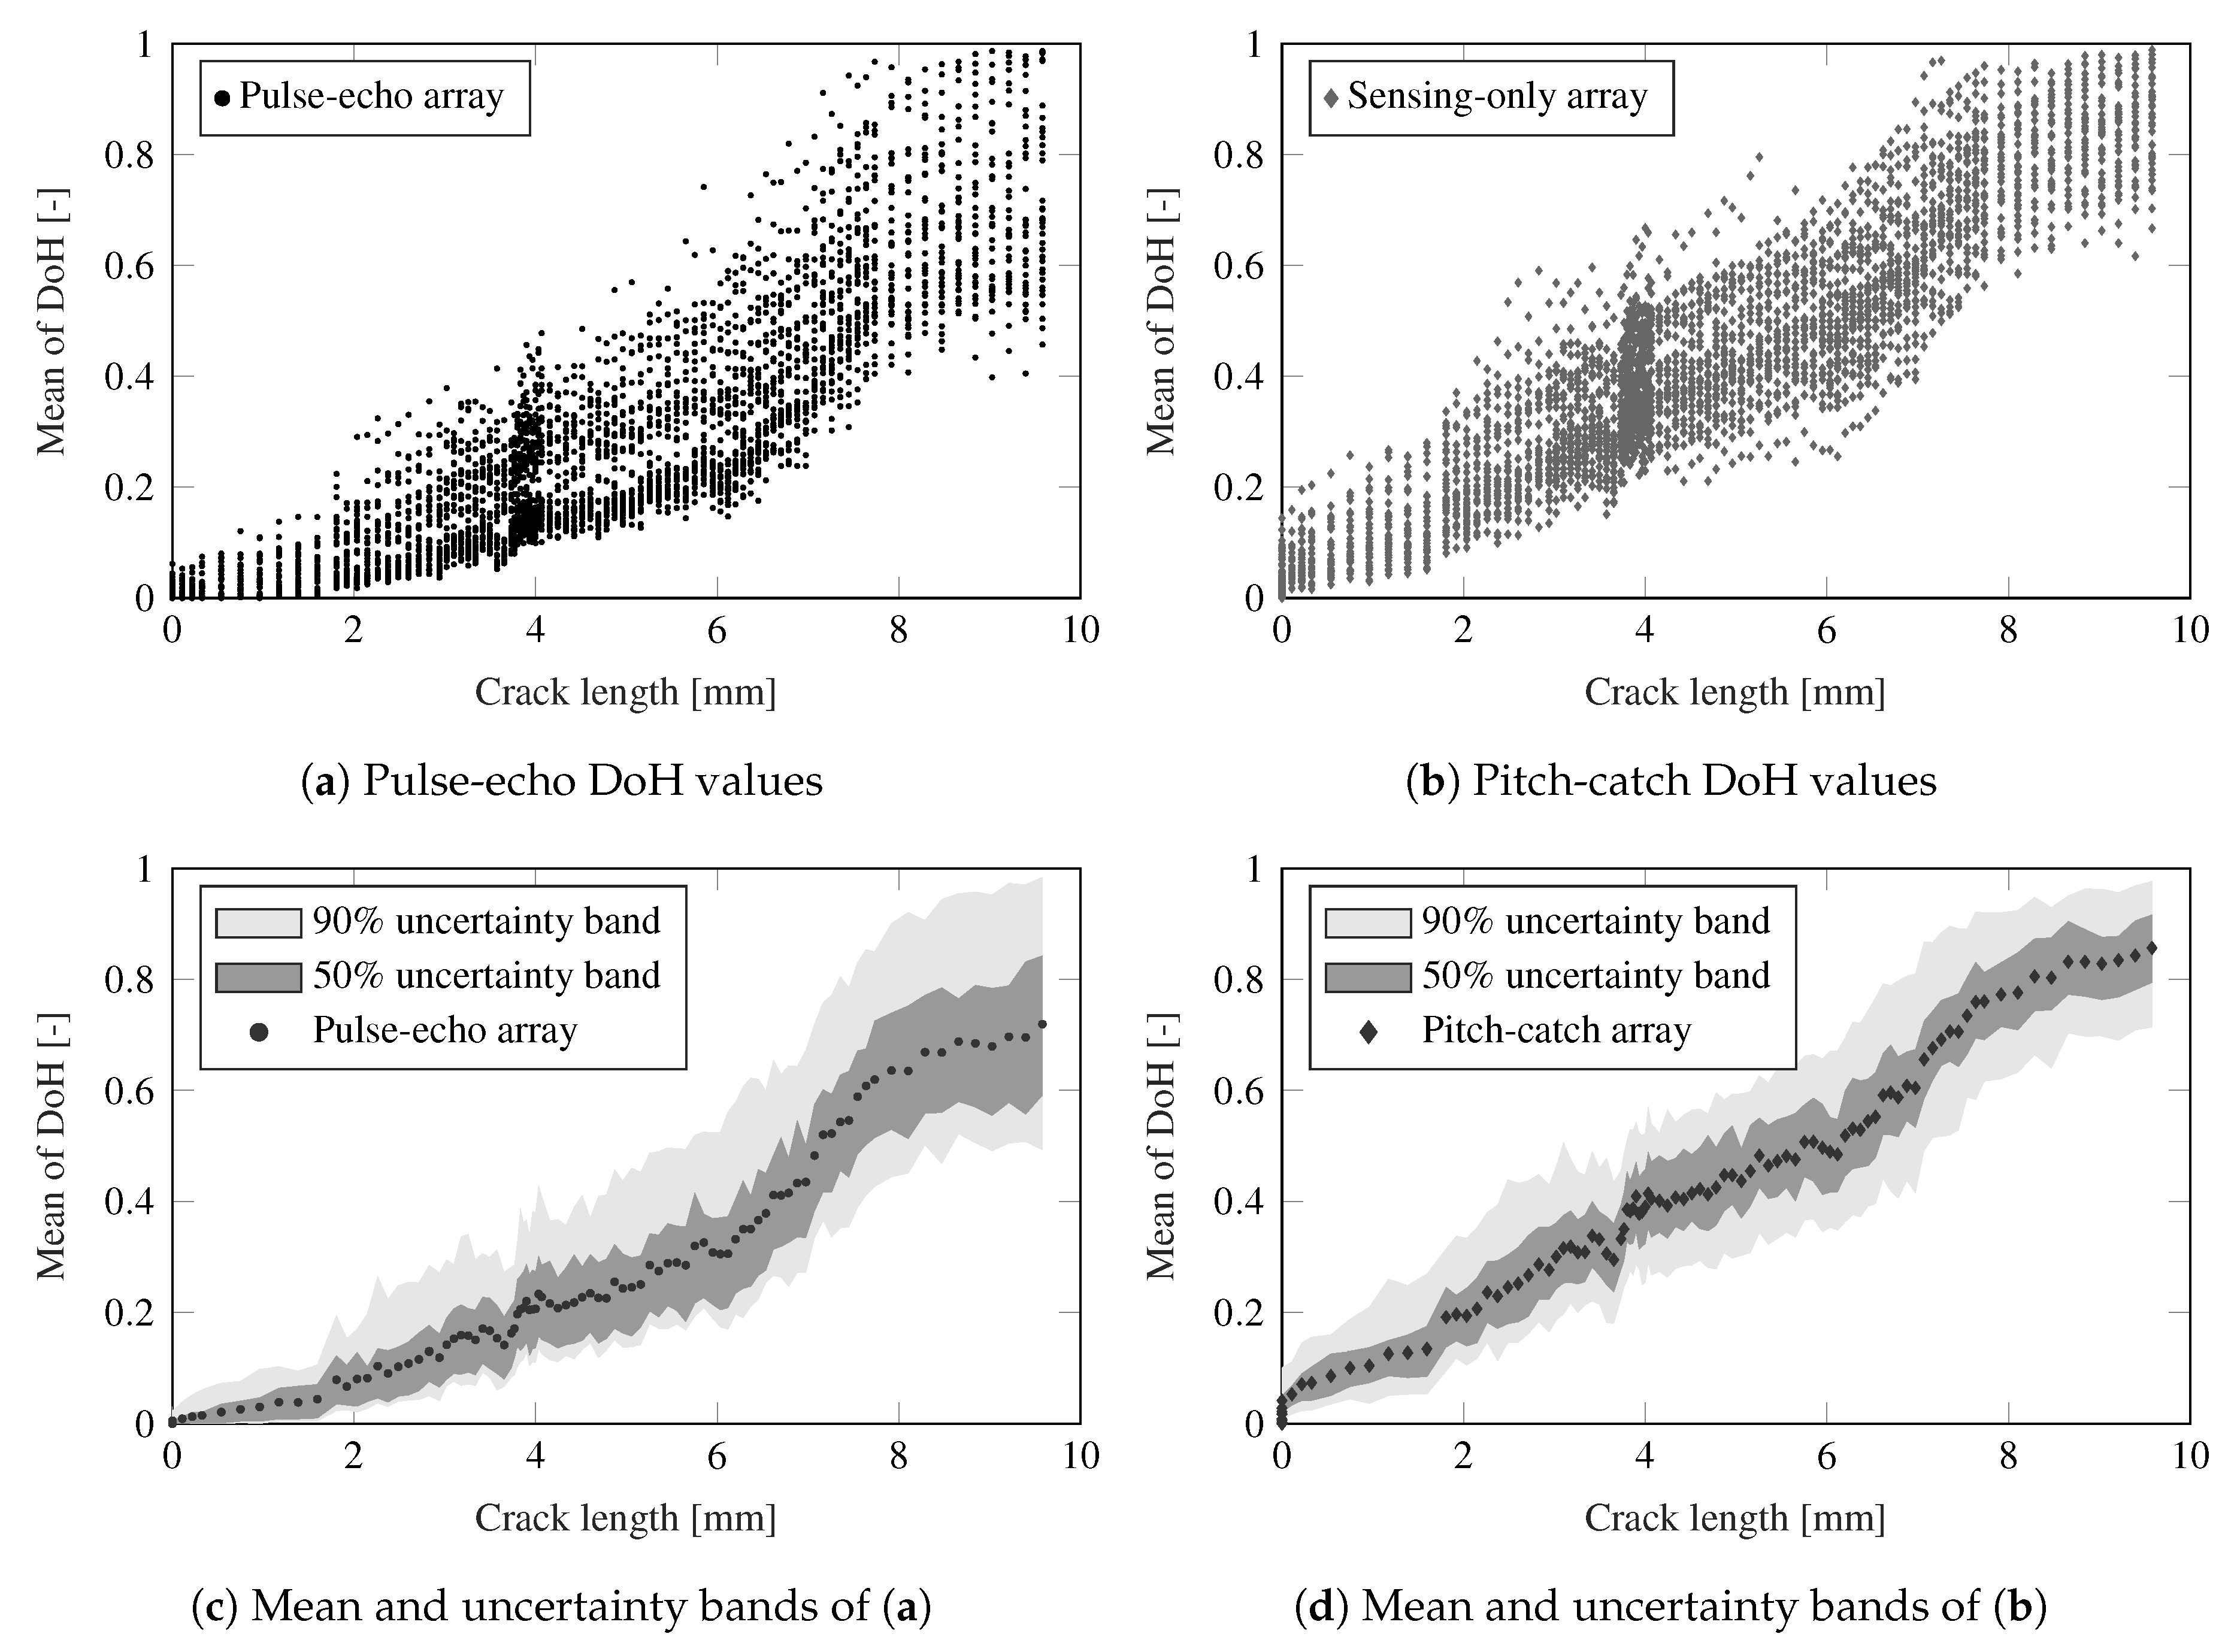
- The proposed DoH damage index detects the damage onset and monitors its growth in a thin-walled metallic plate under fatigue testing conditions. It also shows a remarkable correlation with the fatigue crack length evolution.
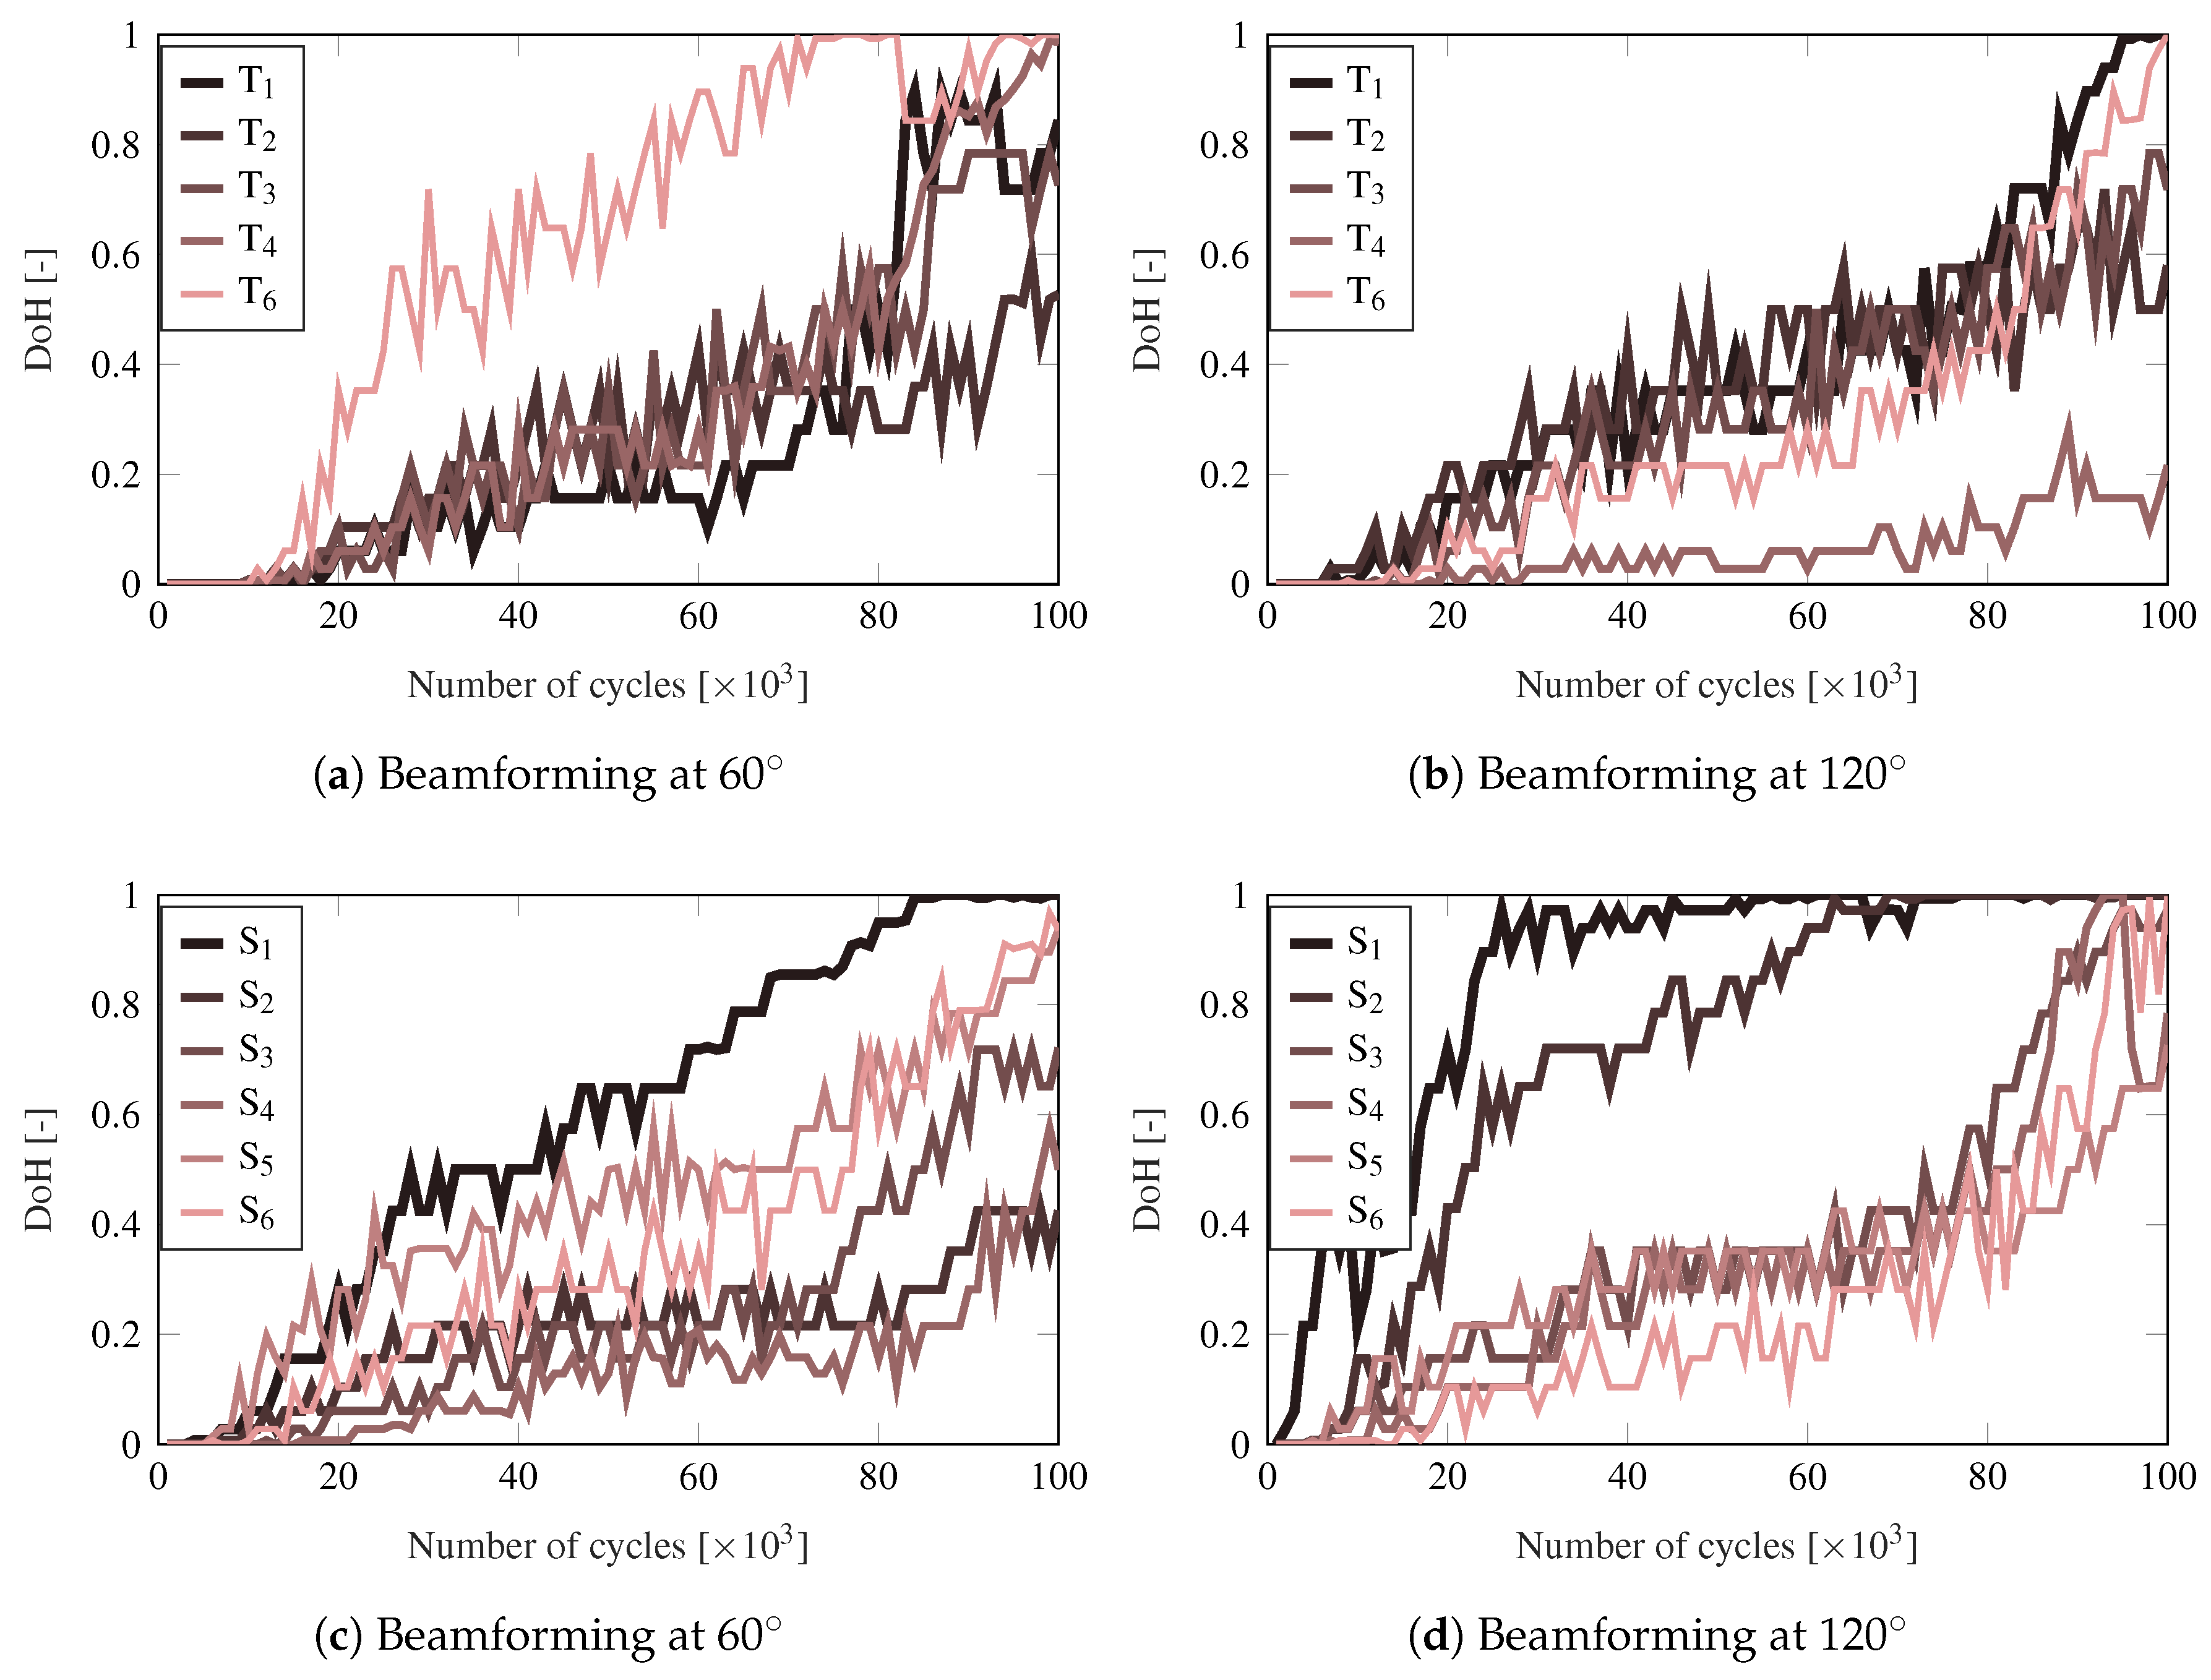
- The damage evolution is accurately monitored using both the pulse-echo and sensing only phased-arrays of PWAS along with the transmission beamforming technique.
- The robustness of the proposed damage index builds on a pattern matching process, partially using fuzzy logic fundamentals, and information stemming from the transmission beamforming tests.
- The observed accuracy alongside the large amount of data contained in the DoH matrices encourage the use of the proposed method for a reliable diagnosis of damage features and mechanical properties.
Author Contributions
Funding
Institutional Review Board Statement
Informed Consent Statement
Data Availability Statement
Acknowledgments
Conflicts of Interest
References
- Callister, W.D.; Rethwisch, D.G. Materials Science and Engineering; John Wiley & Sons: New York, NY, USA, 2011; Volume 5. [Google Scholar]
- Muñoz, C.Q.G.; Márquez, F.P.G. Future maintenance management in renewable energies. In Renewable Energies; Springer: Cham, Switzerland, 2018; pp. 149–159. [Google Scholar]
- Choi, H.; Jeong, J.J.; Kim, J. Development of an Estimation Instrument of Acoustic Lens Properties for Medical Ultrasound Transducers. J. Healthc. Eng. 2017, 2017, 6580217. [Google Scholar] [CrossRef] [Green Version]
- Capozzoli, L.; Rizzo, E. Combined NDT techniques in civil engineering applications: Laboratory and real test. Constr. Build. Mater. 2017, 154, 1139–1150. [Google Scholar] [CrossRef]
- Gholizadeh, S. A review of non-destructive testing methods of composite materials. Procedia Struct. Integr. 2016, 1, 50–57. [Google Scholar] [CrossRef] [Green Version]
- Bochud, N.; Gomez, A.; Rus, G.; Peinado, A. A sparse digital signal model for ultrasonic nondestructive evaluation of layered materials. Ultrasonics 2015, 62, 160–173. [Google Scholar] [CrossRef]
- Adams, D. Health Monitoring of Structural Materials and Components: Methods with Applications; John Wiley & Sons: Hoboken, NJ, USA, 2007. [Google Scholar]
- Giurgiutiu, V. Structural Health Monitoring: With Piezoelectric Wafer Active Sensors, 2nd ed.; Elsevier: Oxford, UK, 2014. [Google Scholar]
- Zilberstein, V.; Walrath, K.; Grundy, D.; Schlicker, D.; Goldfine, N.; Abramovici, E.; Yentzer, T. MWM eddy-current arrays for crack initiation and growth monitoring. Int. J. Fatigue 2003, 25, 1147–1155. [Google Scholar] [CrossRef]
- Gomez, J.; Zubia, J.; Aranguren, G.; Arrue, J.; Poisel, H.; Saez, I. Comparing polymer optical fiber, fiber Bragg grating, and traditional strain gauge for aircraft structural health monitoring. Appl. Opt. 2009, 48, 1436–1443. [Google Scholar] [CrossRef]
- Gagar, D.; Foote, P.; Irving, P. Effects of loading and sample geometry on acoustic emission generation during fatigue crack growth: Implications for structural health monitoring. Int. J. Fatigue 2015, 81, 117–127. [Google Scholar] [CrossRef]
- Rose, J.L. Ultrasonic Guided Waves in Solid Media; Cambridge University Press: Cambridge, UK, 2014. [Google Scholar]
- Lamb, H. On the vibrations of an elastic sphere. Proc. Lond. Math. Soc. 1881, 1, 189–212. [Google Scholar] [CrossRef] [Green Version]
- Leong, W.; Staszewski, W.; Lee, B.; Scarpa, F. Structural health monitoring using scanning laser vibrometry: III. Lamb waves for fatigue crack detection. Smart Mater. Struct. 2005, 14, 1387. [Google Scholar] [CrossRef]
- Su, Z.; Ye, L.; Lu, Y. Guided Lamb waves for identification of damage in composite structures: A review. J. Sound Vib. 2006, 295, 753–780. [Google Scholar] [CrossRef]
- Farrar, C.R.; Worden, K. An introduction to structural health monitoring. Philos. Trans. R. Soc. A Math. Phys. Eng. Sci. 2007, 365, 303–315. [Google Scholar] [CrossRef]
- Yuan, F.G. Structural Health Monitoring (SHM) in Aerospace Structures; Woodhead Publishing: Cambridge, UK, 2016. [Google Scholar]
- Wang, D.; Ou-Yang, J.; Guo, W.; Yang, X.; Zhu, B. Novel fabrication of PZT thick films by an oil-bath based hydrothermal method. Ceram. Int. 2017, 43, 9573–9576. [Google Scholar] [CrossRef]
- Giurgiutiu, V.; Zagrai, A.; Jing Bao, J. Piezoelectric wafer embedded active sensors for aging aircraft structural health monitoring. Struct. Health Monit. 2002, 1, 41–61. [Google Scholar] [CrossRef]
- Zagrai, A.; Doyle, D.; Gigineishvili, V.; Brown, J.; Gardenier, H.; Arritt, B. Piezoelectric wafer active sensor structural health monitoring of space structures. J. Intell. Mater. Syst. Struct. 2010, 21, 921–940. [Google Scholar] [CrossRef]
- Mace, B.R.; Renno, J.; Manconi, E. Waves and finite elements. In Proceedings of the Noise and Vibration: Emerging Methods, Sorrento, Italy, 1–4 April 2012. [Google Scholar]
- Cantero-Chinchilla, S.; Chiachío, J.; Chiachío, M.; Chronopoulos, D.; Jones, A. A robust Bayesian methodology for damage localization in plate-like structures using ultrasonic guided-waves. Mech. Syst. Signal Process. 2019, 122, 192–205. [Google Scholar] [CrossRef] [Green Version]
- Yan, G. A Bayesian approach for damage localization in plate-like structures using Lamb waves. Smart Mater. Struct. 2013, 22, 035012. [Google Scholar] [CrossRef]
- Chiachío, J.; Bochud, N.; Chiachío, M.; Cantero, S.; Rus, G. A multilevel Bayesian method for ultrasound-based damage identification in composite laminates. Mech. Syst. Signal Process. 2017, 88, 462–477. [Google Scholar] [CrossRef] [Green Version]
- Yan, W.J.; Chronopoulos, D.; Papadimitriou, C.; Cantero-Chinchilla, S.; Zhu, G.S. Bayesian inference for damage identification based on analytical probabilistic model of scattering coefficient estimators and ultrafast wave scattering simulation scheme. J. Sound Vib. 2020, 468, 115083. [Google Scholar] [CrossRef]
- Watkins, R.; Jha, R. A modified time reversal method for Lamb wave based diagnostics of composite structures. Mech. Syst. Signal Process. 2012, 31, 345–354. [Google Scholar] [CrossRef]
- Zhao, X.; Gao, H.; Zhang, G.; Ayhan, B.; Yan, F.; Kwan, C.; Rose, J.L. Active health monitoring of an aircraft wing with embedded piezoelectric sensor/actuator network: I. Defect detection, localization and growth monitoring. Smart Mater. Struct. 2007, 16, 1208. [Google Scholar] [CrossRef]
- Azuara, G.; Barrera, E.; Ruiz, M.; Bekas, D. Damage Detection and Characterization in Composites Using a Geometric Modification of the RAPID Algorithm. IEEE Sens. J. 2019, 20, 2084–2093. [Google Scholar] [CrossRef]
- Giurgiutiu, V.; Bao, J. Embedded-ultrasonics structural radar for in situ structural health monitoring of thin-wall structures. Struct. Health Monit. 2004, 3, 121–140. [Google Scholar] [CrossRef] [Green Version]
- Michaels, J.E. Detection, localization and characterization of damage in plates with an in situ array of spatially distributed ultrasonic sensors. Smart Mater. Struct. 2008, 17, 035035. [Google Scholar] [CrossRef] [Green Version]
- Cawley, P.; Cegla, F.; Galvagni, A. Guided waves for NDT and permanently-installed monitoring. Insight Non Test. Cond. Monit. 2012, 54, 594–601. [Google Scholar] [CrossRef]
- Zhang, T.; Ou-Yang, J.; Yang, X.; Wei, W.; Zhu, B. High performance KNN-based single crystal thick film for ultrasound application. Electron. Mater. Lett. 2019, 15, 1–6. [Google Scholar] [CrossRef]
- Croxford, A.J.; Wilcox, P.D.; Drinkwater, B.W.; Konstantinidis, G. Strategies for guided-wave structural health monitoring. Proc. R. Soc. A Math. Phys. Eng. Sci. 2007, 463, 2961–2981. [Google Scholar] [CrossRef]
- Eybpoosh, M.; Berges, M.; Noh, H.Y. An energy-based sparse representation of ultrasonic guided-waves for online damage detection of pipelines under varying environmental and operational conditions. Mech. Syst. Signal Process. 2017, 82, 260–278. [Google Scholar] [CrossRef]
- Chua, C.A.; Cawley, P. Crack growth monitoring using fundamental shear horizontal guided waves. Struct. Health Monit. 2020, 19, 1311–1322. [Google Scholar] [CrossRef]
- Li, J.; Lu, Y.; Lee, Y.F. Debonding detection in CFRP-reinforced steel structures using anti-symmetrical guided waves. Compos. Struct. 2020, 253, 112813. [Google Scholar] [CrossRef]
- Castillero, J.; Aranguren, G.; Etxaniz, J.; Gil-Garcia, J.M. Composite Leading Edge Monitoring with a Guided Wave System. In European Workshop on Structural Health Monitoring; Rizzo, P., Milazzo, A., Eds.; Springer International Publishing: Cham, Switzerland, 2021; pp. 830–837. [Google Scholar]
- Da Silva, S.; Junior, M.D.; Junior, V.L.; Brennan, M.J. Structural damage detection by fuzzy clustering. Mech. Syst. Signal Process. 2008, 22, 1636–1649. [Google Scholar] [CrossRef]
- Anaya, M.; Tibaduiza, D.A.; Pozo, F. Detection and classification of structural changes using artificial immune systems and fuzzy clustering. Int. J. Bio Inspired Comput. 2017, 9, 35–52. [Google Scholar] [CrossRef]
- Cantero-Chinchilla, S.; Chiachío-Ruano, J.; Chiachío-Ruano, M.; Etxaniz, J.; Aranguren, G.; Jones, A.; Essa, Y.; Martin De La Escalera, F. Lamb wave-based damage indicator for plate-like structures. In Proceedings of the European Conference of the PHM Society, Utrecht, The Netherlands, 3–6 July 2018; Prognostics and Health Management Society (PHM Society): Rochester, NY, USA, 2018; Volume 4. [Google Scholar]
- Beck, J.L. Bayesian system identification based on probability logic. Struct. Control Health Monit. 2010, 17, 825–847. [Google Scholar] [CrossRef]
- Amjad, U.; Yadav, S.K.; Kundu, T. Detection and quantification of pipe damage from change in time of flight and phase. Ultrasonics 2015, 62, 223–236. [Google Scholar] [CrossRef] [PubMed]
- Adnan, M.M.; Sarkheyli, A.; Zain, A.M.; Haron, H. Fuzzy logic for modeling machining process: A review. Artif. Intell. Rev. 2015, 43, 345–379. [Google Scholar] [CrossRef]
- ASTM-E647-15e1. Standard Test Method for Measurement of Fatigue Crack Growth Rates; Standard; ASTM International: West Conshohocken, PA, USA, 2015. [Google Scholar]
- Aranguren, G.; Etxaniz, J.; Barrera, E.; Ruiz, M.; Olivares, M.A.; Taboada, I.; Urrutia, A.; Melendez, R. Structural health monitoring ultrasound system. In Proceedings of the EWSHM-8th European Workshop on Structural Health Monitoring, Bilbao, Spain, 5–8 July 2016; pp. 5–8. [Google Scholar]
- Cantero-Chinchilla, S.; Aranguren, G.; Malik, M.K.; Etxaniz, J.; Martín de la Escalera, F. An Empirical Study on Transmission Beamforming for Ultrasonic Guided-Wave Based Structural Health Monitoring. Sensors 2020, 20, 1445. [Google Scholar] [CrossRef] [PubMed] [Green Version]
- Olson, S.E.; DeSimio, M.P.; Derriso, M.M. Beam Forming of Lamb Waves for Structural Health Monitoring. J. Vib. Acoust. 2007, 129, 730–738. [Google Scholar] [CrossRef]
- Chiachío Ruano, M.; Chiachío Ruano, J.; Cantero Chinchilla, S.; Aranguren, G.; Royo, J.M.; Etxaniz, J.; Calvo Echenique, A. Señal Ultrasónica Guiada de Monitorización de Fatiga en Placa Metálica; University of Granada: Granada, Spain, 2020. [Google Scholar] [CrossRef]
- Poulsen, S.; Andersen, M.A. Hysteresis controller with constant switching frequency. IEEE Trans. Consum. Electron. 2005, 51, 688–693. [Google Scholar] [CrossRef]
- Grahn, T. Lamb wave scattering from a circular partly through-thickness hole in a plate. Wave Motion 2003, 37, 63–80. [Google Scholar] [CrossRef]
- Aranguren, G.; Etxaniz, J.; Cantero-Chinchilla, S.; Gil-Garcia, J.M.; Malik, M.K. Ultrasonic Guided Wave Testing on Cross-Ply Composite Laminate: An Empirical Study. Sensors 2020, 20, 5291. [Google Scholar] [CrossRef]
- Lu, Y.; Michaels, J.E. Feature extraction and sensor fusion for ultrasonic structural health monitoring under changing environmental conditions. IEEE Sens. J. 2009, 9, 1462–1471. [Google Scholar]
- Croxford, A.J.; Moll, J.; Wilcox, P.D.; Michaels, J.E. Efficient temperature compensation strategies for guided wave structural health monitoring. Ultrasonics 2010, 50, 517–528. [Google Scholar] [CrossRef] [PubMed]
- Zima, B.; Kędra, R. Detection and size estimation of crack in plate based on guided wave propagation. Mech. Syst. Signal Process. 2020, 142, 106788. [Google Scholar] [CrossRef]
- Cho, H.; Lissenden, C.J. Structural health monitoring of fatigue crack growth in plate structures with ultrasonic guided waves. Struct. Health Monit. 2012, 11, 393–404. [Google Scholar] [CrossRef]
- Chiachío, J.; Jalón, M.L.; Chiachío, M.; Kolios, A. A Markov chains prognostics framework for complex degradation processes. Reliab. Eng. Syst. Saf. 2020, 195, 106621. [Google Scholar] [CrossRef]
- Vasudeven, A.; Sadananda, K.; Louat, N. A review of crack closure, fatigue crack threshold and related phenomena. Mater. Sci. Eng. A 1994, 188, 1–22. [Google Scholar] [CrossRef]
- Walker, K. The effect of stress ratio during crack propagation and fatigue for 2024-T3 and 7075-T6 aluminum. In Effects of Environment and Complex Load History on Fatigue Life; ASTM International: West Conshohocken, PA, USA, 1970. [Google Scholar]
- Forman, R.; Shivakumar, V.; Cardinal, J.; Williams, L.; McKeighan, P. Fatigue Crack Growth Database for Damage Tolerance Analysis; Technical Report DOT/FAA/AR-05/15; US Department of Transportation Federal Aviation Administration (FAA), Office of Aviation Research Washington: Washington, DC, USA, 2005. [Google Scholar]
- Cross, R.; Makeev, A.; Armanios, E. Simultaneous uncertainty quantification of fracture mechanics based life prediction model parameters. Int. J. Fatigue 2007, 29, 1510–1515. [Google Scholar] [CrossRef]
- Popov, B.N. Stresss Corrosion Cracking. In Corrosion Engineering; Elsevier: Amsterdam, The Netherlands, 2015; pp. 365–450. [Google Scholar]


Publisher’s Note: MDPI stays neutral with regard to jurisdictional claims in published maps and institutional affiliations. |
© 2021 by the authors. Licensee MDPI, Basel, Switzerland. This article is an open access article distributed under the terms and conditions of the Creative Commons Attribution (CC BY) license (http://creativecommons.org/licenses/by/4.0/).
Share and Cite
Cantero-Chinchilla, S.; Aranguren, G.; Royo, J.M.; Chiachío, M.; Etxaniz, J.; Calvo-Echenique, A. Structural Health Monitoring Using Ultrasonic Guided-Waves and the Degree of Health Index. Sensors 2021, 21, 993. https://doi.org/10.3390/s21030993
Cantero-Chinchilla S, Aranguren G, Royo JM, Chiachío M, Etxaniz J, Calvo-Echenique A. Structural Health Monitoring Using Ultrasonic Guided-Waves and the Degree of Health Index. Sensors. 2021; 21(3):993. https://doi.org/10.3390/s21030993
Chicago/Turabian StyleCantero-Chinchilla, Sergio, Gerardo Aranguren, José Manuel Royo, Manuel Chiachío, Josu Etxaniz, and Andrea Calvo-Echenique. 2021. "Structural Health Monitoring Using Ultrasonic Guided-Waves and the Degree of Health Index" Sensors 21, no. 3: 993. https://doi.org/10.3390/s21030993