
Paper-Based Analytical Devices for Colorimetric and Luminescent Detection of Mercury in Waters: An Overview

 ,
,  and
and 
Abstract
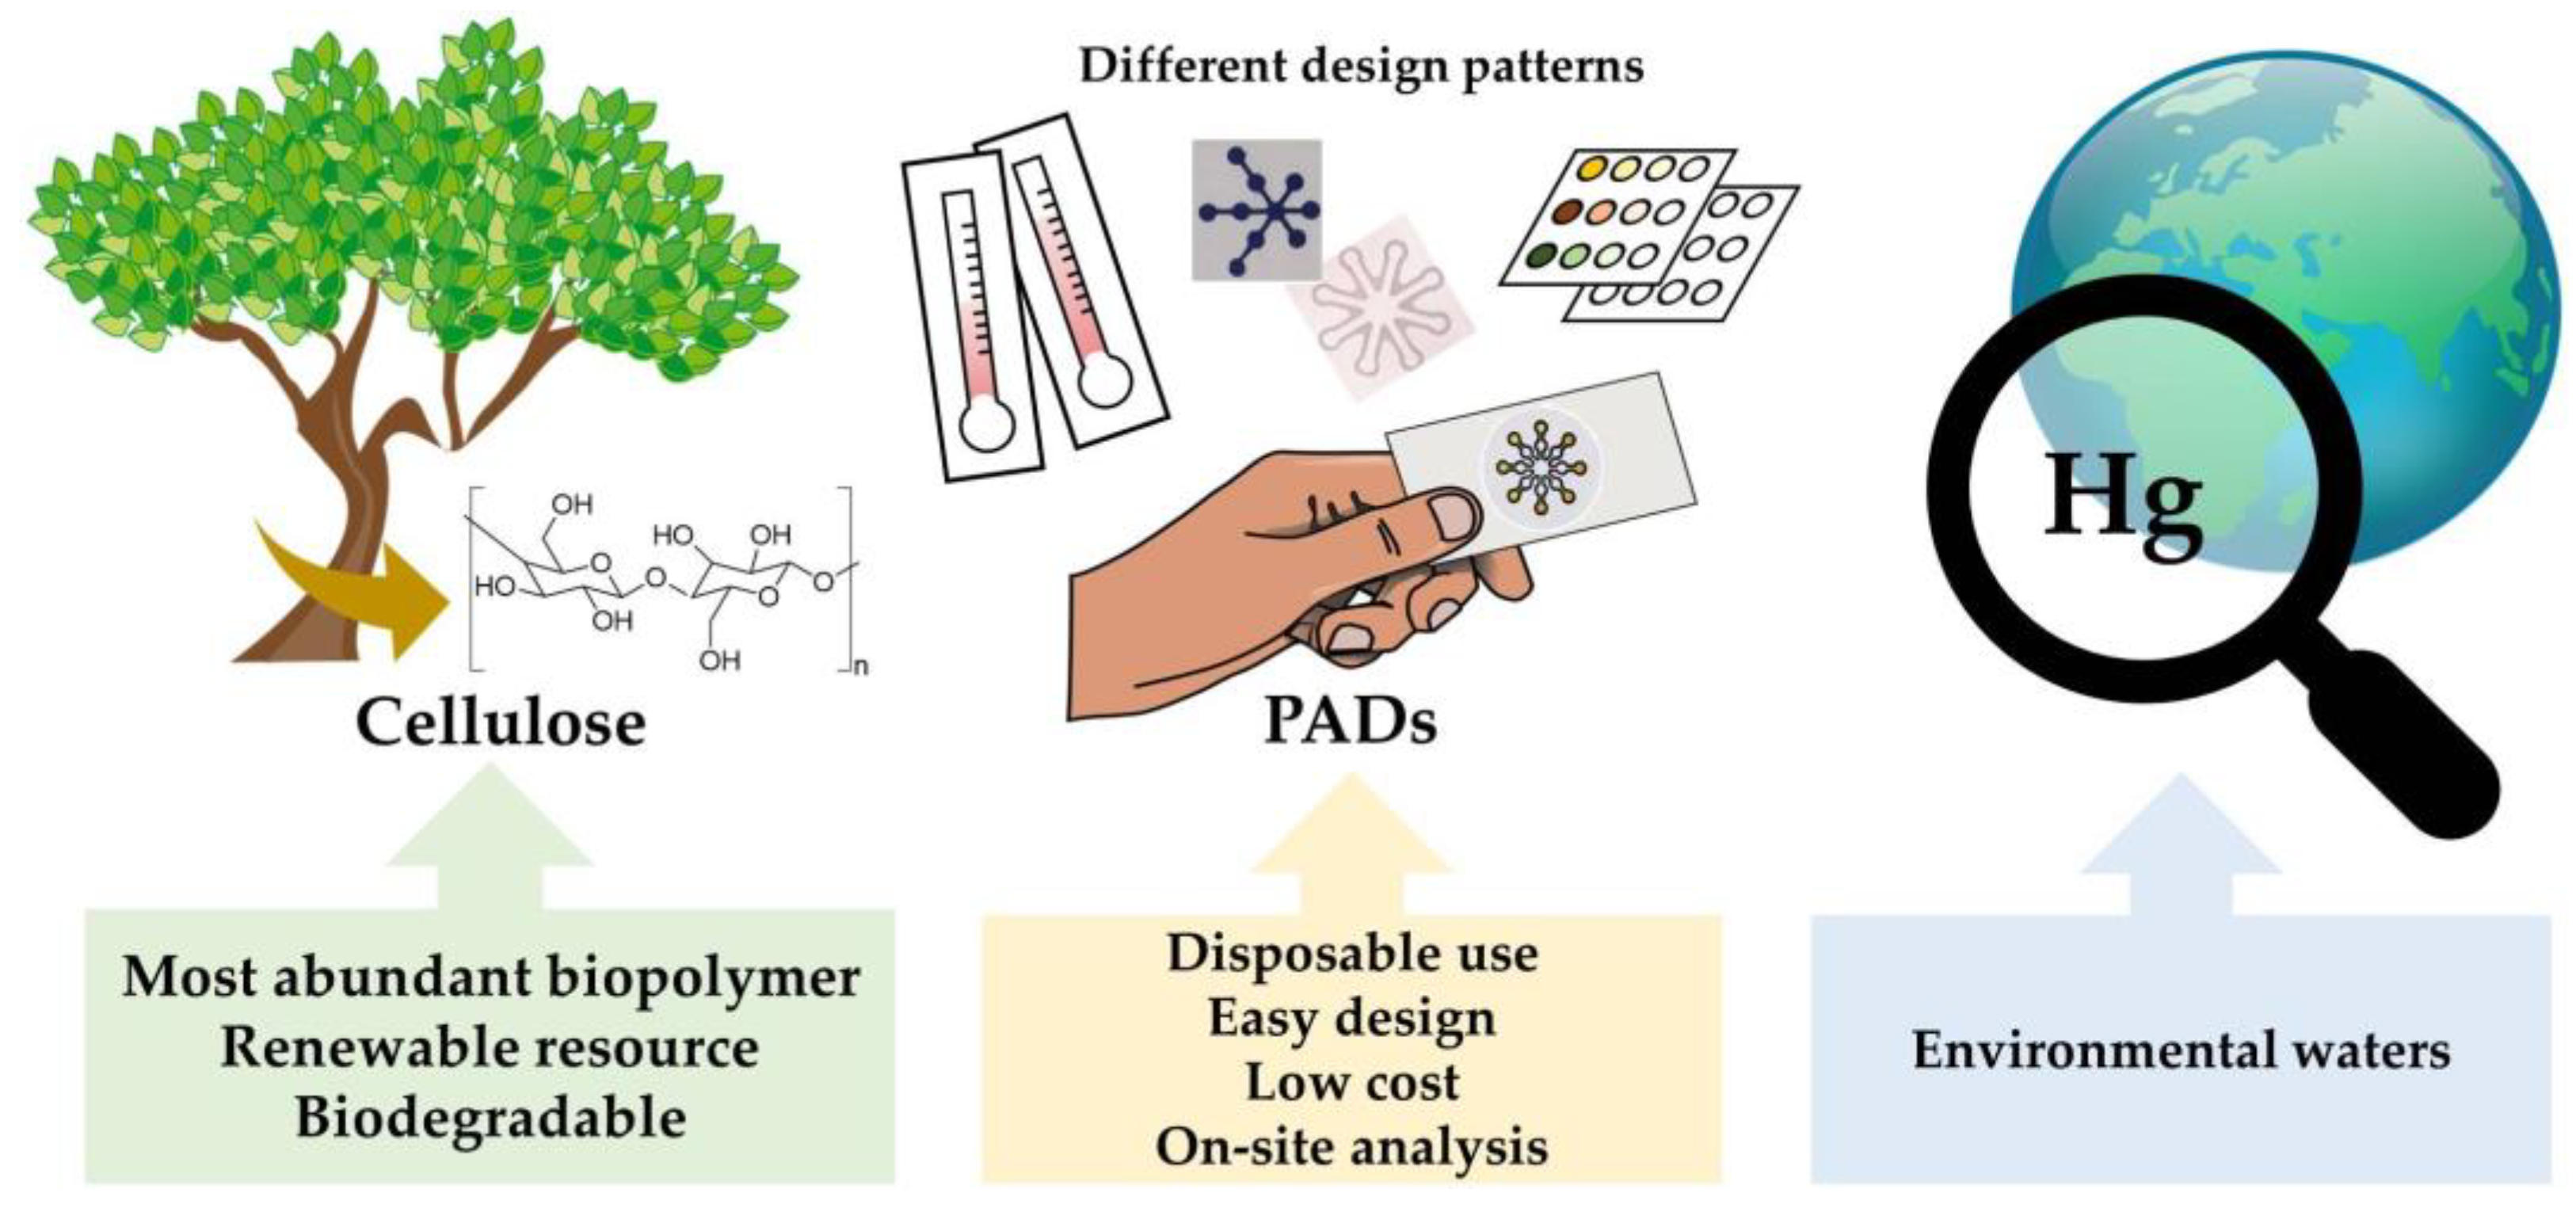
:1. Introduction
2. Development of Paper-Based Analytical Devices for the Detection of Mercury
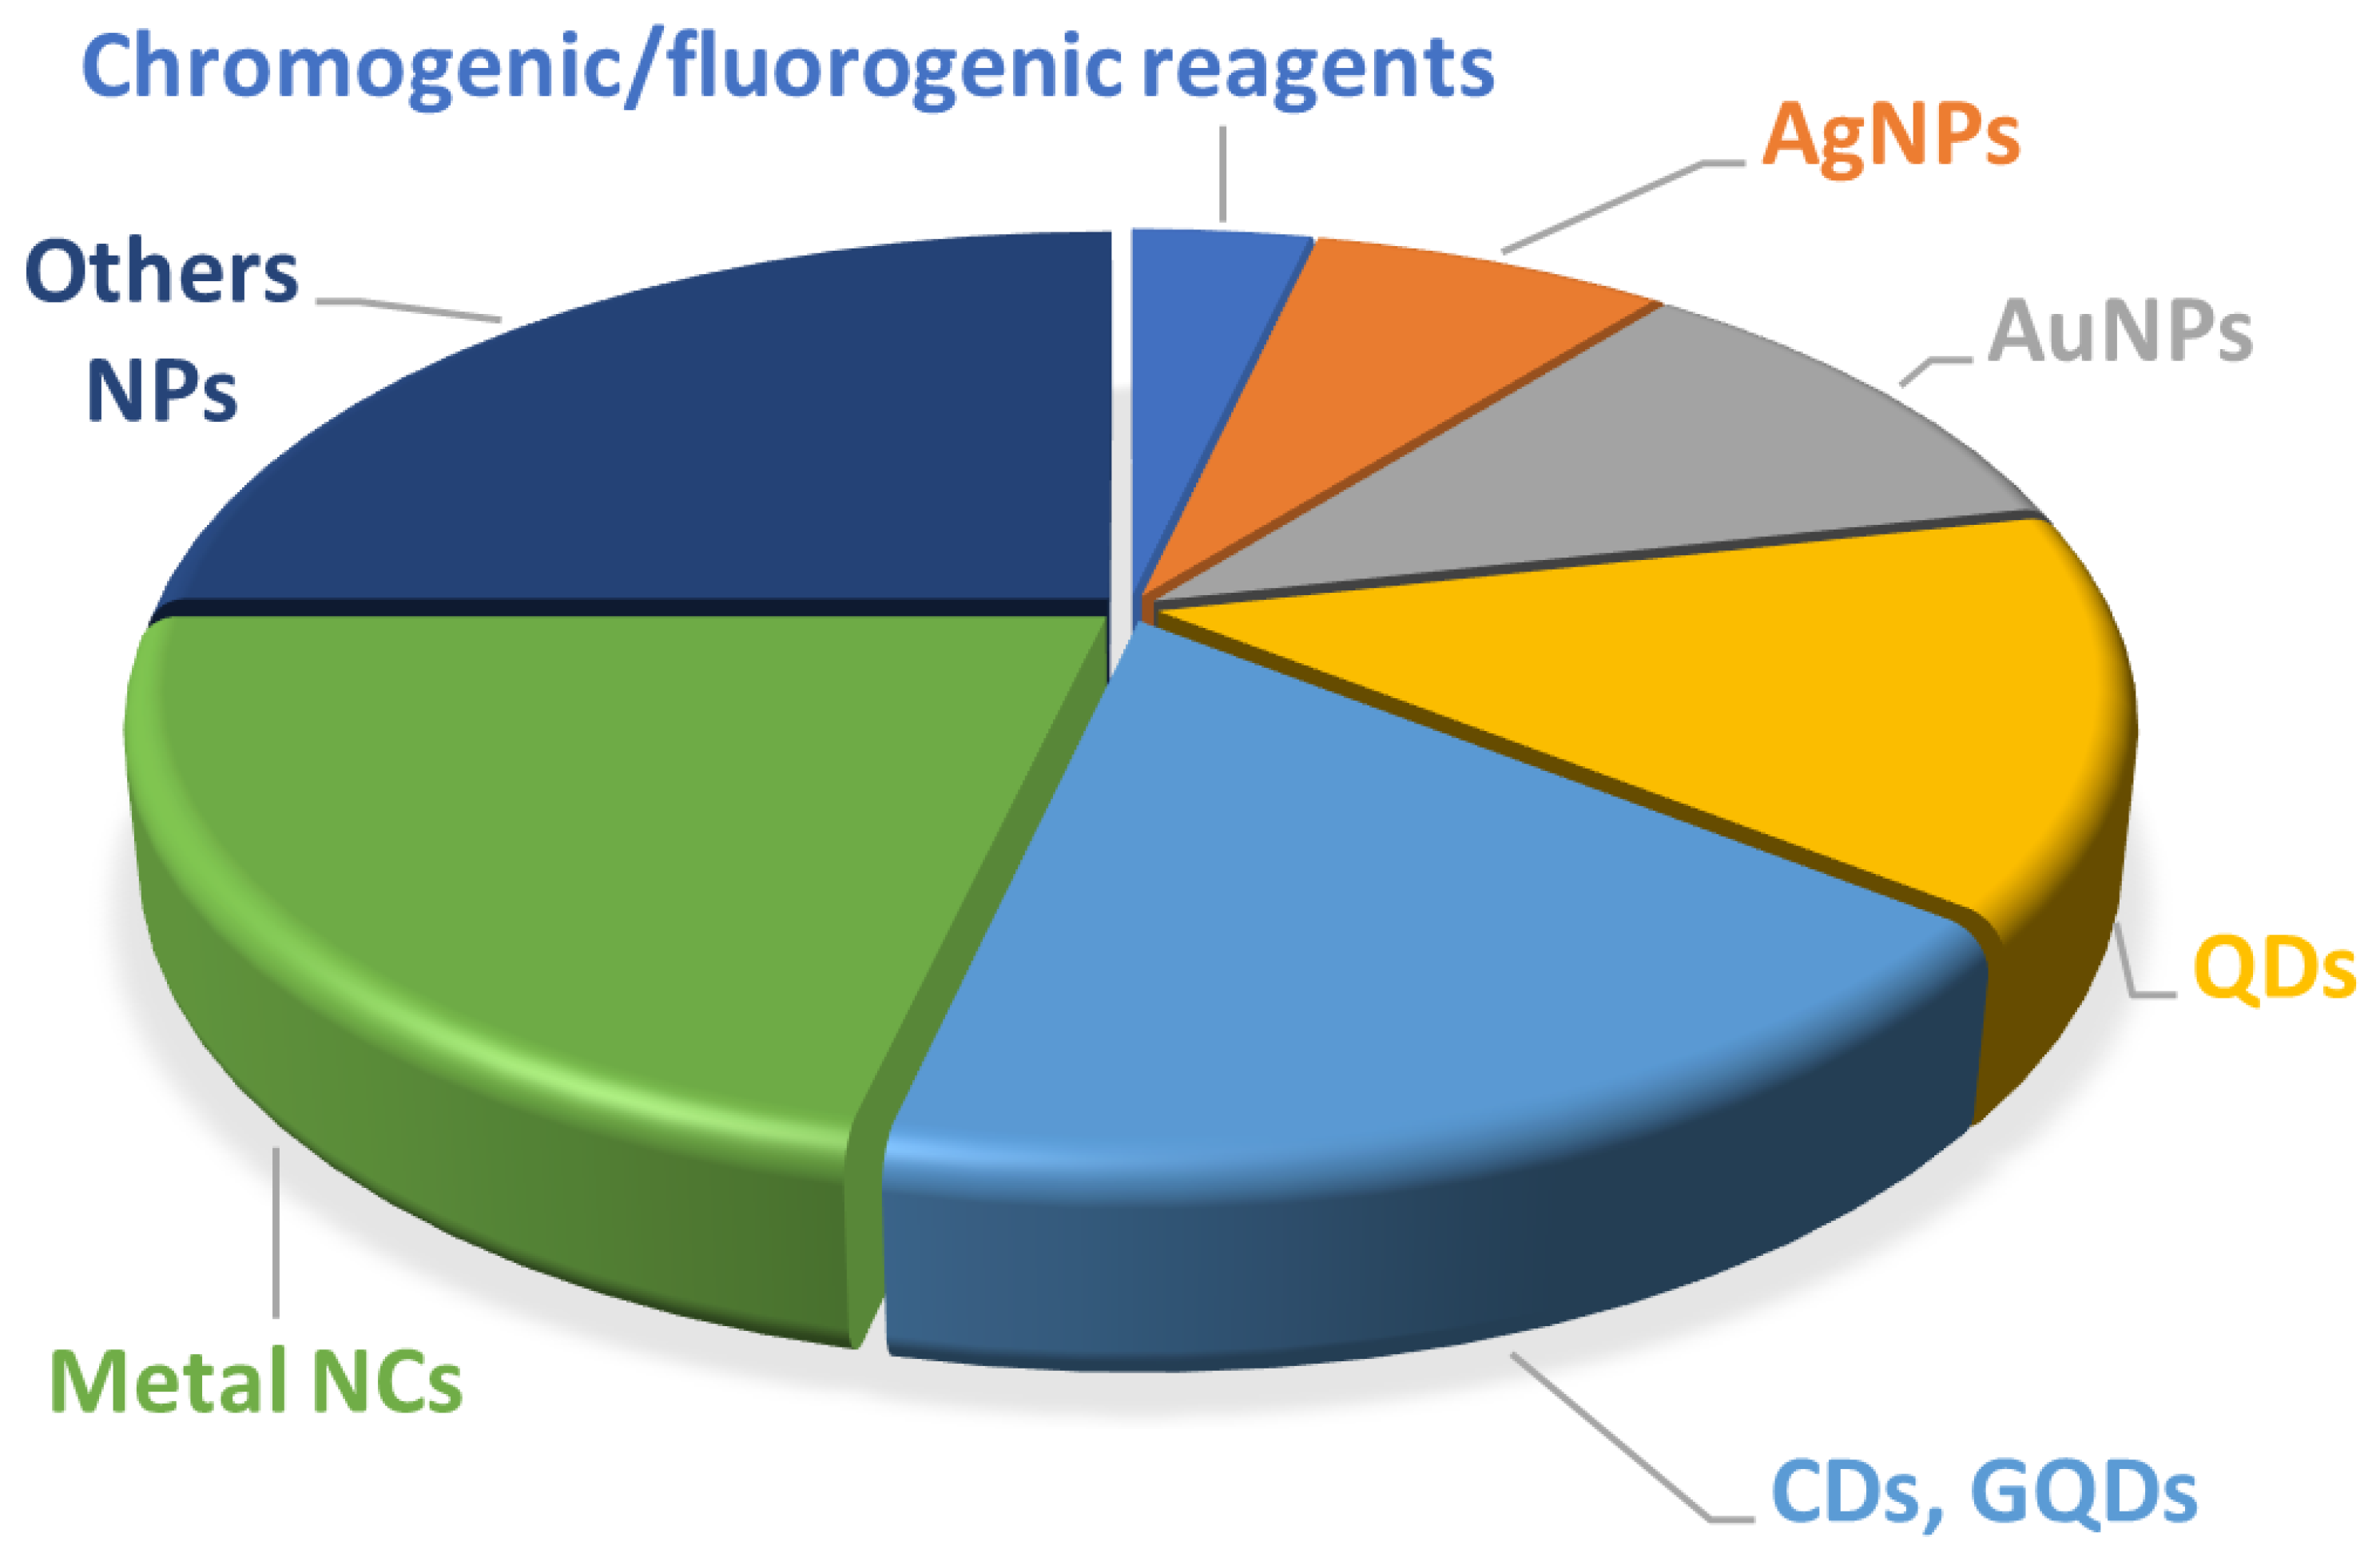
3. Paper-Based Sensors Integrated with Organic Chromogenic/Fluorogenic Receptors for Hg Detection
4. Paper-Based Analytical Devices Integrated with Nanomaterials as Receptors for Hg Detection
4.1. Plasmonic Nanoparticles
4.1.1. Gold Nanoparticles
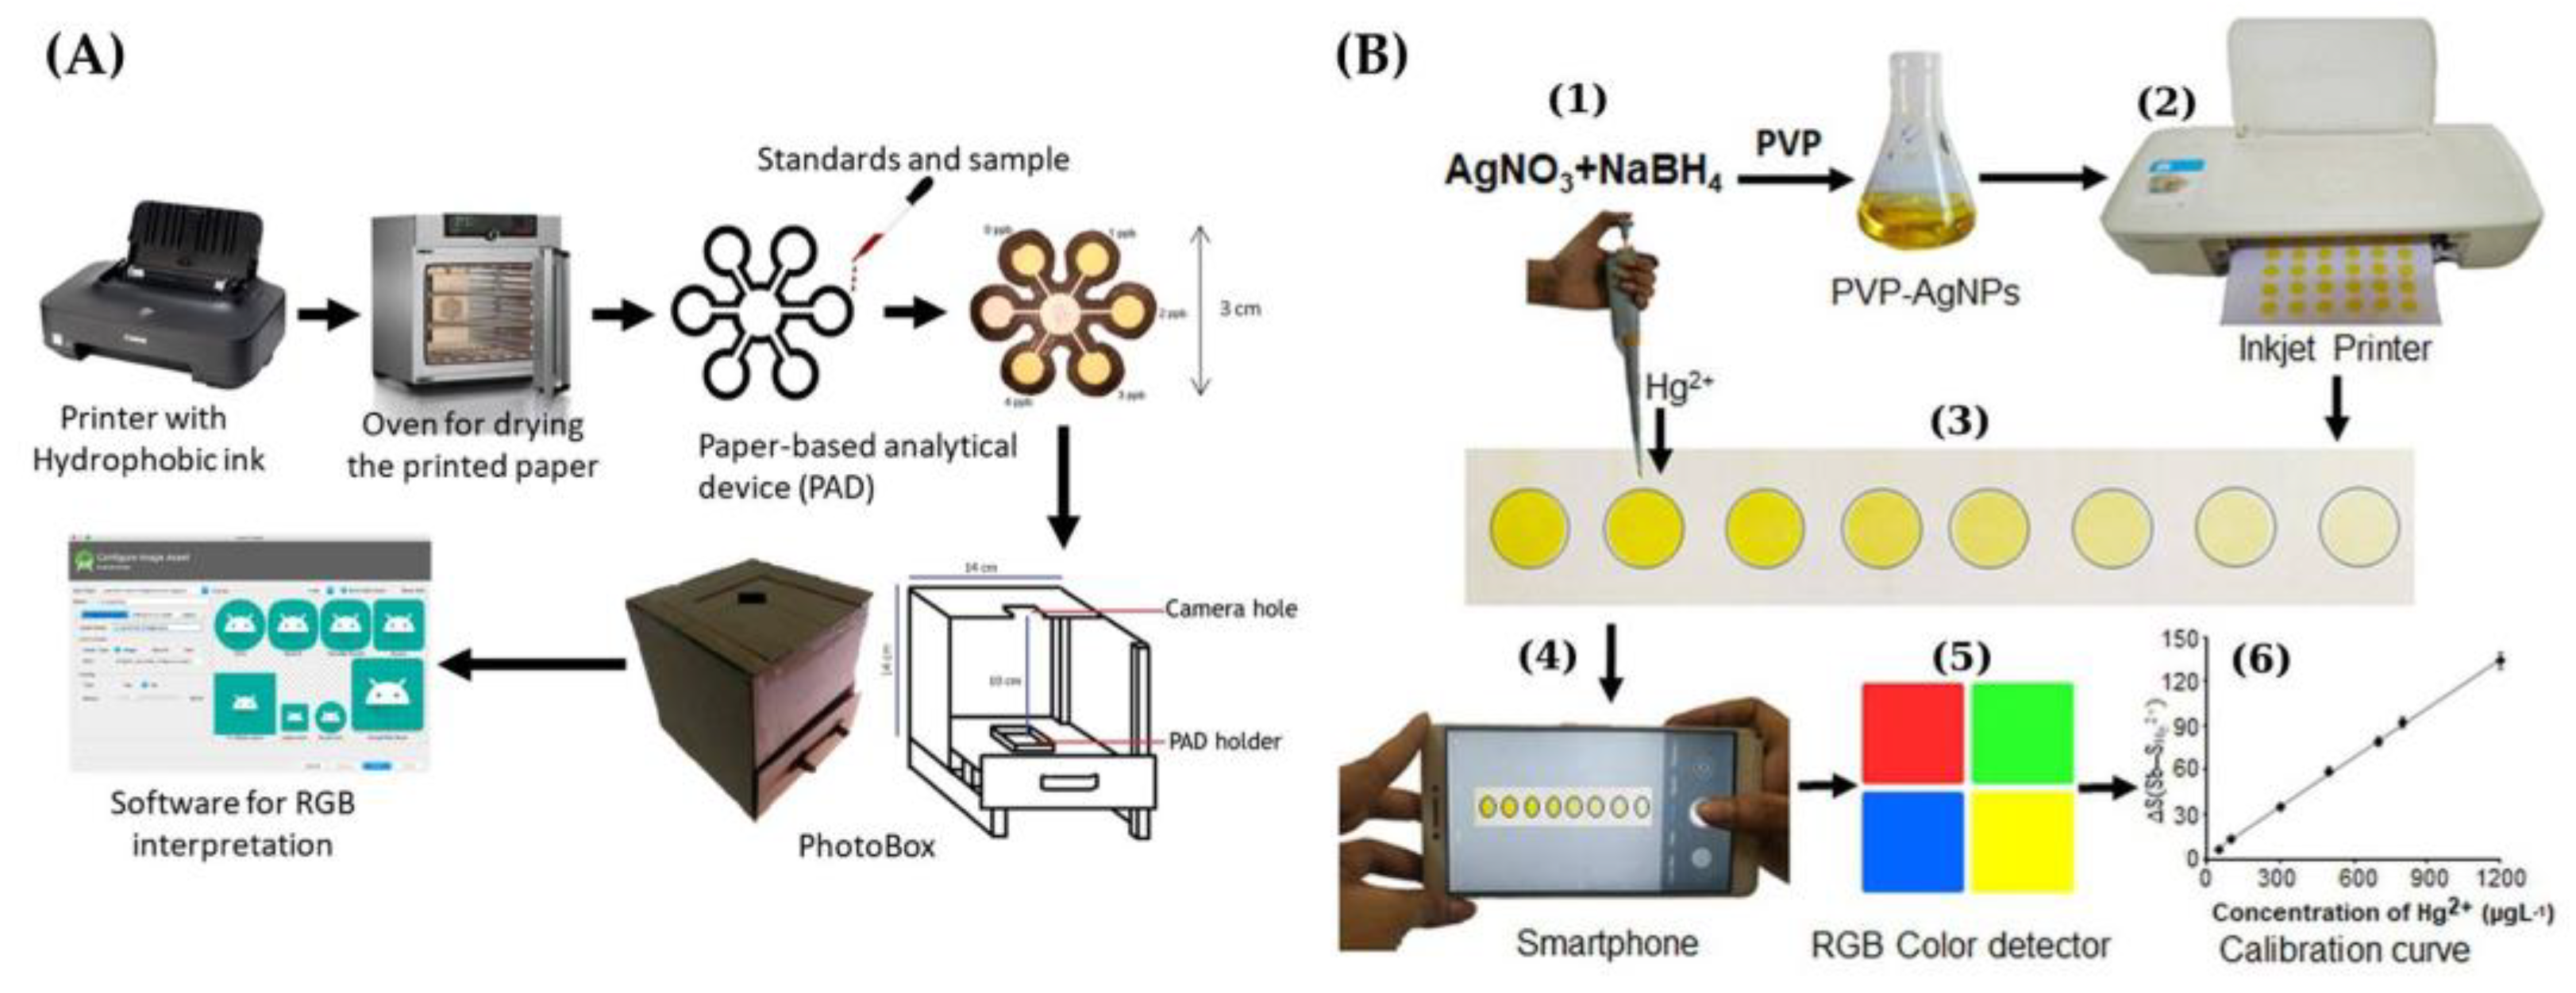
4.1.2. Silver Nanoparticles
4.2. Fluorescent Nanoparticles
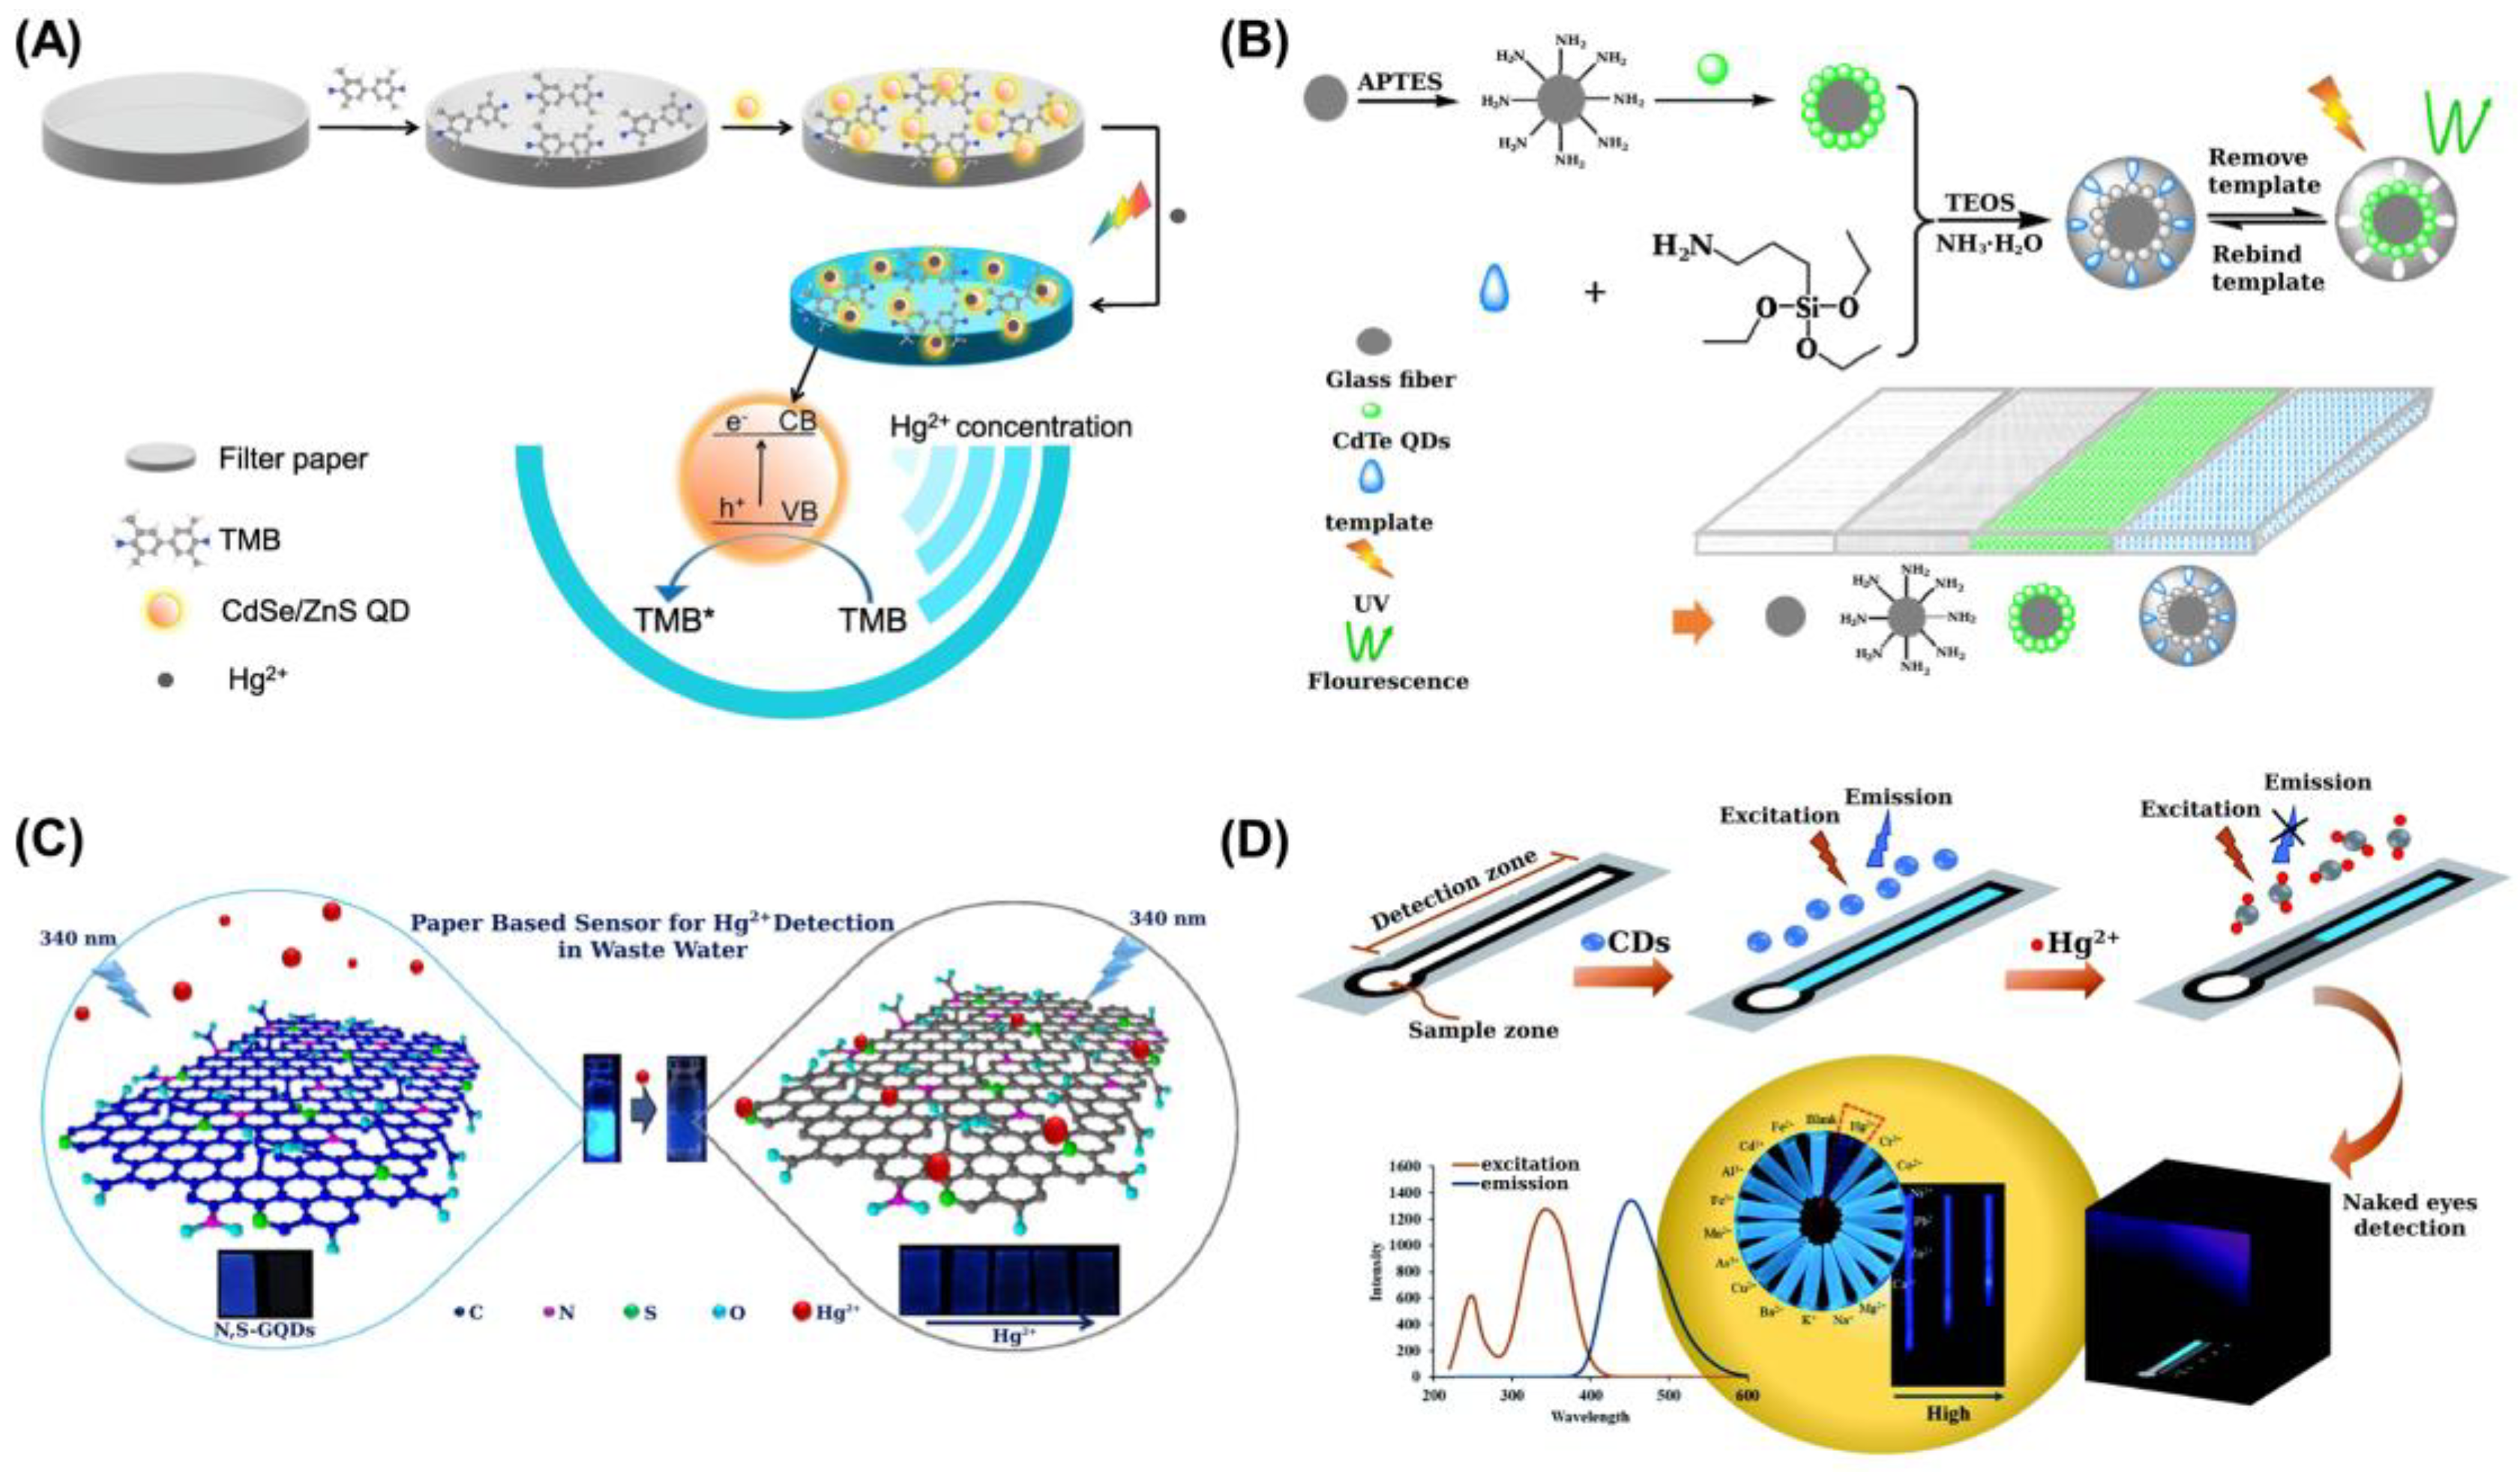
4.2.1. Quantum Dots
4.2.2. Carbon Quantum Dots and Graphene Quantum Dots
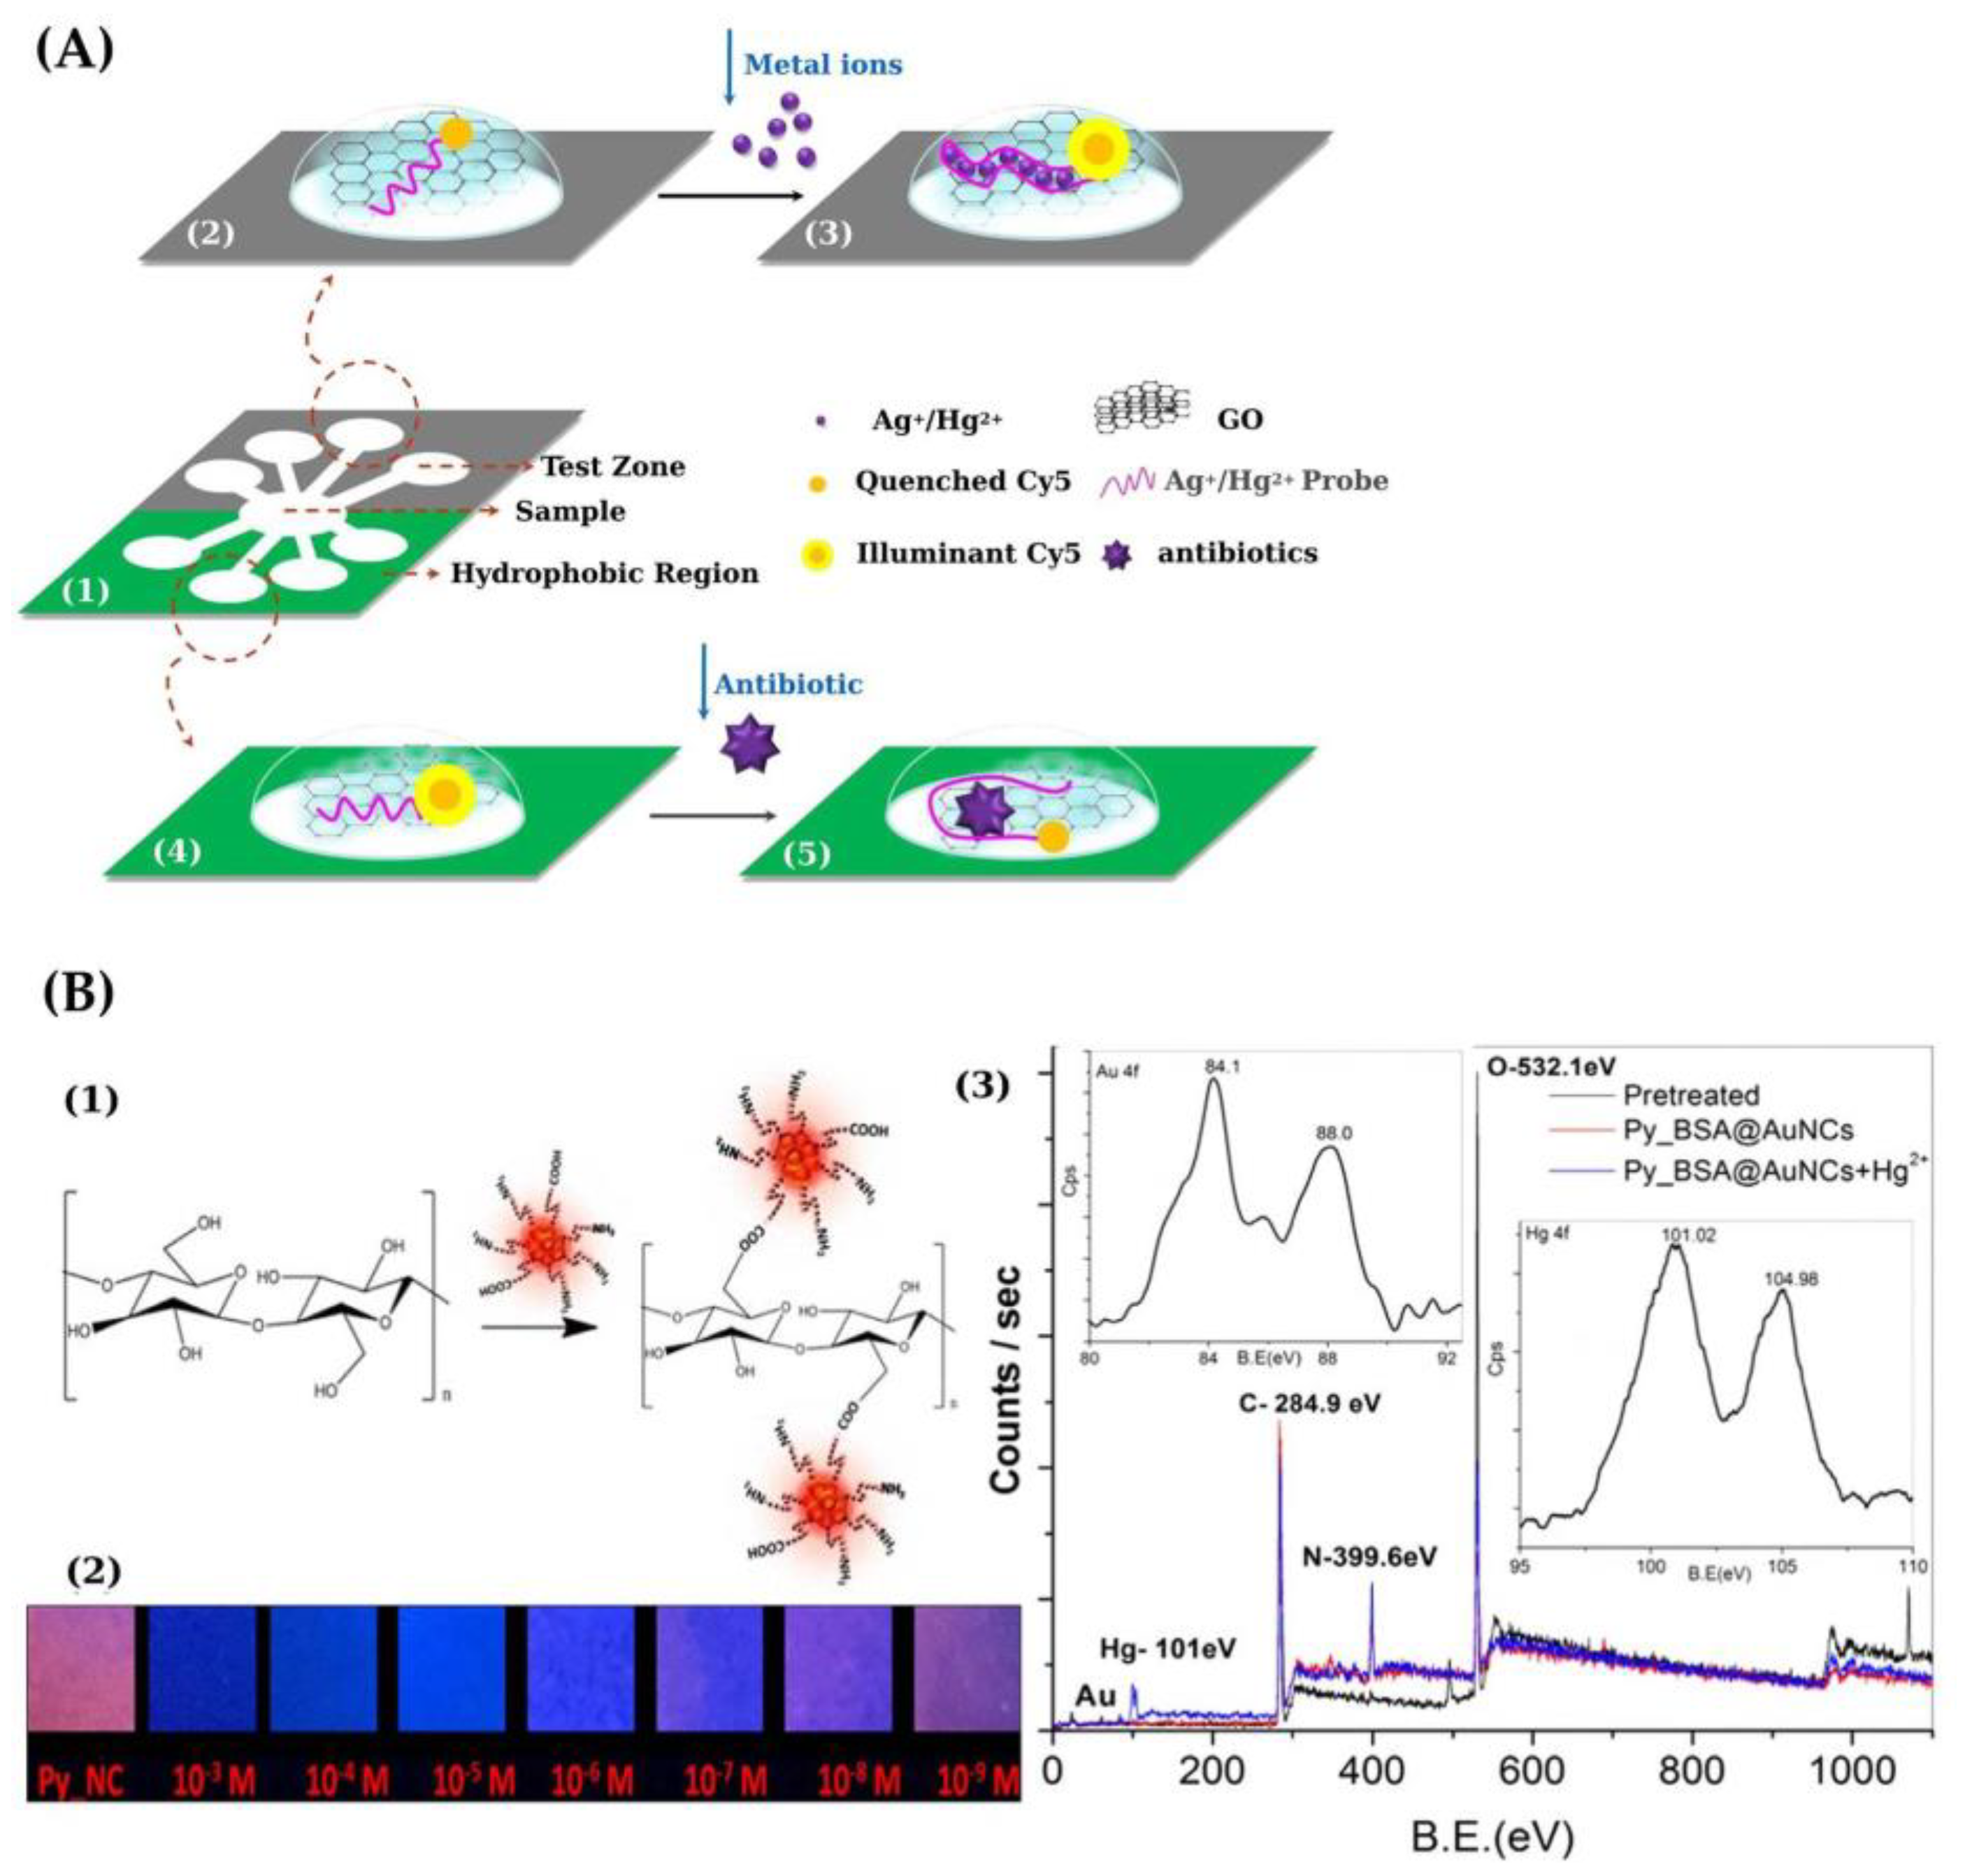
4.2.3. Metal Nanoclusters
4.3. Other Nanoreceptors

| Material | Type of PAD | Recognition Element | Signal Readout | Sample/Matrix | LOD (ppb) | Ref. |
|---|---|---|---|---|---|---|
| Nitrocellulose membrane | Lateral flow strip * | DNA-conjugated AuNPs | Visual detection | River water Tap water | 0.02 | [58] |
| Filter paper | Paper-based sensor | ssDNA-AuNPs | Smartphone | Pond water River water | 10 | [59] |
| Nitrocellulose membrane | Lateral flow strip * | Thiol-modified ssDNA- AuNPs | Visual detection and digital camera | Waters | 0.005 (naked eye) 0.0015 (quantitative) | [60] |
| Nitrocellulose | Paper-matrix array * | ssDNA-AuNPs; Signal-enhanced by Ag(I) reduction | Scanner | Tap water Lake water | 0.0005 (500 times better after signal amplification) | [61] |
| Cellulose nanofiber | AuNPs@CNF * membrane | AuNPs | Naked eye | Water | 0.2 | [62] |
| Filter paper (salinization) | μ-PAD | N,N0-bis(2-hydroxyethyl) Dithiooxamide-AuNPs | Naked eye and digital camera | Salmon fish and dust storm days | 3 | [63] |
| Filter paper | Paper-based sensor | AgNPs, AgNPls | Naked eye and Digital camera | Drinking water Tap water | 120 (2 after preconcentration) | [65] |
| Cellulose | μ-PAD * | AgNPs | Digital camera | Waters | 1 | [66] |
| Whatman paper No. 1 | μ-PAD * | AgNPs | Smartphone | Waters (tap, pond, etc.) | 3 (1 after preconcentration) | [67] |
| Whatman paper No. 1 | Paper-based sensor | Glucose-AgNPs | Digital camera | --- | 20 (colorimetry) 200 (naked eye) | [68] |
| Whatman paper No. 1 | Paper-based sensor | AgNPs (photosynthesis) | Naked eye and photometry | Aqueous solutions | 5 (photometry) 5 × 10³ (naked eye) | [69] |
| Whatman filter | Paper-based sensor * | AgNPs | Smartphone | River water | 0.86 | [70] |
| Whatman paper No. 1 | Paper-based sensor (CH3Hg+) | Oxalicalix[4]arene- AgNPs | Colorimetry, fluorimetry, Naked eye | Waters | 0.34 CH3Hg+ (colorimetry) 14 (paper strip) | [71] |
| Whatman (Different papers) | Paper-based sensor | AgNPs | Smartphone | Waters (River, pond, etc.) | 10 | [72] |
| Filter paper | Paper-based sensor | AgNPs | Smartphone | Waters | 5.6 (in solution) 60 (PAD) | [73] |
| Filter paper | Paper-based sensor | CdSe/ZnS and TMB | Smartphone and naked eye | Cosmetic cream Tap water | ca. 18 | [78] |
| Filter paper | Paper-based sensor | MS2 QDs | Naked eye under UV lamp | Waters | 0.36 (fluorimetry) 2 (naked eye) | [79] |
| Filter paper | 3D Origami m-PAD | Grafted CdTe QDs (Paper@QDs@IIPs) | Fluorescence | Lake water, Seawater | 0.056 | [80] |
| Filter paper | Paper strip | N,S-codoped GQDs | Digital camera | Wastewater | 0.028 (fluorimetry) | [81] |
| Carboxylated Cellulose spheres | Fluorescent spherical sponge cellulose (Cu, Hg, Al) | CDs | Digital and mobile cameras after UV irradiation | Tap water River water | 5.2 (Hg) | [82] |
| Filter paper | μ-PAD (Hg, Cu) | N-doped CDs | Digital camera (UV irradiation) | Tap water | 1.24 Hg (fluorimetry) 20 Hg (m-PAD) | [83] |
| Filter paper | Paper-based sensor | CDs | Naked eye (UV irradiation) | Tap water Lake water | 0.028 (fluorimetry) | [84] |
| Filter paper (Different types) | Distance-based μ-PAD | N-doped CDs | Naked eye (UV irradiation) | Drinking water tap water, pond water | 5 (after preconc.) | [85] |
| Filter paper | Paper-based sensor (UV LED irradiation) | N-doped CDs | Smartphone | --- | 2.14 | [86] |
| Whatman No. 1 paper | μ-PAD (Hg, Ag, antibiotics) | Fluorescent ssDNA- functionalized graphene oxide | Scanner | Spiked water | 24.2 (Hg) | [87] |
| Filter paper | Paper-based sensor * | BSA-AuNCs (conjugated with Pyridoxal) | Naked eye | Fish, tap water, River water | 6.38 (fluorimetry) 0.2 (naked eye) | [88] |
| Filter paper | Paper-based sensor | BSA-AuNCs and Tb(III) (reference) | Naked eye (UV irradiation) | Biological samples | 0.2 (fluorimetry) 20 (naked eye) | [89] |
| Whatman paper No. 1 | Paper-based sensor | Curcumin NPs | Digital camera | Waters (several types) | 170 (direct) 3 (Prec.) | [90] |
| Filter paper | Paper-based sensor * | PtNPs and TMB | Digital camera and Smartphone | Pond water Tap water | 2 | [91] |
| Filter paper | Paper-based sensor | NaYF4:Yb3+/Er3+ NPs Functionalized With RBT | Digital camera after diode laser irradiation (980 nm) | 0.74 (in solution) | [92] | |
| Filter paper | Paper-based sensor | fluorescent nanoaggregates (FNAs) | Naked eye (UV irradiation) | Tap water, pond water seawater | 4 (Hg2+) 18 (CH3Hg+) (fluorimetry) | [93] |
5. Hg Speciation Using PADs
6. Conclusions and Outlook
Author Contributions
Funding
Institutional Review Board Statement
Informed Consent Statement
Data Availability Statement
Acknowledgments
Conflicts of Interest
Abbreviations
| AgNPs | silver nanoparticles |
| AgNPls | silver nanoplates |
| AFM | atomic force microscopy |
| AuNCs | gold nanoclusters |
| AuNPs | gold nanoparticles |
| AuNRs | gold nanorods |
| BSA | bovine serum albumin |
| BV | biliverdin |
| CA | citric acid |
| CCS | carboxylated cellulose spheres |
| CDs | carbon dots |
| CHEF | chelation-enhanced fluorescence |
| CNF | cellulose nanofibrilatted |
| CQDs | carbon quantum dots |
| CS-CDs | sponge cellulose fluorescence spherical |
| CuNPs | copper nanoparticles |
| CURNPs | curcumin nanoparticles |
| CV-AAS | cold vapor-atomic absorption spectrometry |
| CV-AFS | cold vapor-atomic fluorescence spectrometry |
| DAOC | di-acetamido-oxacalix[4]arene (DAOC) |
| DNA | deoxyribonucleic acid |
| EDTA | Ethylenediaminetetraacetic acid |
| ETAAS | electrothermal atomic absorption spectrometry |
| FNAs | Fluorescent nanoaggregates |
| GLU | glucose |
| GO | graphene oxide |
| GQD | graphene quantum dots |
| HEPES | 2-[4-(2-hydroxyethel) piperazine-1-yl]ethanesulfonic acid |
| ICP-MS | inductively coupled plasma-mass spectrometry |
| ICTs | information and communication technologies |
| IFP | infrared fluorescence protein |
| LED | Light emitting diode |
| LOC | Lab-on-chip |
| LOD | limit of detection |
| LRET | luminescence resonance energy transfer |
| LSPR | localized surface plasmon resonance |
| MBA | mercaptobenzonic acid |
| NCs | nanoclusters |
| NCDs | nitrogen-doped carbon dots |
| NPs | nanoparticles |
| PADs | Paper-based analytical devices |
| μPADs | microfluidic paper-based analytical devices |
| PET | photoinduced electron transfer |
| PEI | polyethylenimine |
| ppb | parts-per-billion |
| ppm | parts-per-million |
| PtNPs | platinum nanoparticles |
| Py | pyridoxal |
| QDs | quantum dots |
| RDV | rhodamine appended vinyl ether |
| RGB | red green blue |
| SA-LFS | signal-amplified lateral flow strip |
| SERS | surface-enhanced Raman scattering |
| SA-LFS | signal-amplified lateral flow strip |
| SPR | surface plasmon resonance |
| ssDNA | single-strand DNA |
| TLm | 6-thienyl-lumazine |
| TMB | 3,3,5,5-tetramethylbenzidine |
| TXRF | total reflection X-ray fluorescence |
| USEPA | United States Environmental Protection Agency |
| UC | upconversion |
| UV | ultraviolet |
| WHO | World Health Organization |
| XPS | X-ray photoelectron spectroscopy |
References
- Repetto, M. Toxicología Avanzada, 1st ed.; Diaz de Santos: Madrid, Spain, 1995; pp. 359–391. [Google Scholar]
- Bjørklund, G.; Dadar, M.; Mutter, J.; Aaseth, J. The toxicology of mercury: Current research and emerging trends. Environ. Res. 2017, 159, 545–554. [Google Scholar] [CrossRef]
- Bakir, F.; Damluji, S.F.; Zaki, I.A. Methylmercury poisoning in Iraq: An interuniversity report. Science 1973, 181, 230–241. [Google Scholar] [CrossRef] [PubMed]
- Minamata Disease: The History and Measures. Available online: http://www.env.go.jp/en/chemi/hs/minamata2002/ (accessed on 8 October 2021).
- Raj, D.; Maiti, S.K. Sources, toxicity, and remediation of mercury: An essence review. Environ. Monit. Assess. 2019, 191, 566. [Google Scholar] [CrossRef] [PubMed]
- Mercury Emissions: The Global Context. Available online: https://www.epa.gov/international-cooperation/mercury-emissions-global-context (accessed on 8 October 2021).
- Leopold, K.; Foulkes, M.; Worsfold, P. Methods for the determination and speciation of mercury in natural waters: A review. Anal. Chim. Acta 2010, 663, 127–138. [Google Scholar] [CrossRef]
- Drinking-Water. Available online: https://www.who.int/news-room/fact-sheets/detail/drinking-water (accessed on 8 October 2021).
- World Health Organization. Guidelines for Drinking-Water Quality, 4th ed.; World Health Organization: Geneva, Switzerland, 1993. [Google Scholar]
- USEPA. National Primary Drinking Water Regulations. Available online: https://www.epa.gov/ground-water-and-drinking-water/national-primary-drinking-water-regulations (accessed on 8 October 2021).
- Council Directive 98/83/EC of 3 November 1998 on the Quality of Water Intended for Human Consumption. Off. J. Eur. Communities 1998, 41, 32–54. Available online: https://eur-lex.europa.eu/legal-content/EN/TXT/?uri=CELEX%3A31998L0083 (accessed on 8 October 2021).
- Kozaki, D.; Mori, M.; Hamasaki, S.; Doi, T.; Tanihata, S.; Yamamoto, A.; Takahashi, T.; Sakamoto, K.; Funado, S. Simple mercury determination using an enclosed quartz cell with cold vapour-atomic absorption spectrometry. Anal. Methods 2021, 13, 1106–1109. [Google Scholar] [CrossRef]
- da Silva, M.J.; Paim, A.P.S.; Pimentel, M.F.; Cervera, M.L.; de la Guardia, M. Determination of total mercury in nuts at ultratrace level. Anal. Chim. Acta 2014, 838, 13–19. [Google Scholar] [CrossRef]
- Guerrero, M.M.L.; Cordero, M.T.S.; Alonso, E.V.; Pavón, J.M.C.; de Torres, A.G. High resolution continuum source atomic absorption spectrometry and solid phase extraction for the simultaneous separation/preconcentration and sequential monitoring of Sb, Bi, Sn and Hg in low concentrations. J. Anal. At. Spectrom. 2015, 30, 1169–1178. [Google Scholar] [CrossRef]
- Chen, Y.; He, M.; Chen, B.; Hu, B. Thiol-grafted magnetic polymer for preconcentration of Cd, Hg, Pb from environmental water followed by inductively coupled plasma mass spectrometry detection. Spectrochim. Acta Part B 2021, 177, 106071. [Google Scholar] [CrossRef]
- Romero, V.; Gryglicka, M.; de la Calle, I.; Lavilla, I.; Bendicho, C. Ultrasensitive determination of mercury in waters via photochemical vapor deposition onto quartz substrates coated with palladium nanoparticles followed by total reflection X-ray fluorescence analysis. Microchim. Acta 2016, 183, 141–148. [Google Scholar] [CrossRef]
- Lim, J.W.; Kim, T.-Y.; Woo, M.-A. Trends in sensor development toward next-generation point-of-care testing for mercury. Biosens. Bioelectron. 2021, 183, 113228. [Google Scholar] [CrossRef]
- Pena-Pereira, F.; Bendicho, C.; Pavlović, D.M.; Martín-Esteban, A.; Álvarez, M.D.; Pan, Y.; Cooper, J.; Yang, Z.; Safarik, I.; Pospiskova, K.; et al. Miniaturized analytical methods for determination of environmental contaminants of emerging concern: A review. Anal. Chim. Acta 2021, 1158, 238108. [Google Scholar] [CrossRef] [PubMed]
- Botasini, S.; Heijo, G.; Méndez, E. Toward decentralized analysis of mercury (II) in real samples. A critical review on nanotechnology-based methodologies. Anal. Chim. Acta 2013, 800, 1–11. [Google Scholar] [CrossRef]
- Keçili, R.; Hussain, C.M. Green micro total analysis systems (G μTAS) for environmental samples. Trends Environ. Anal. Chem. 2021, 30, e00128. [Google Scholar] [CrossRef]
- Fu, L.-M.; Wang, Y.-N. Detection methods and applications of microfluidic paper-based analytical devices. TrAC Trends Anal. Chem. 2018, 107, 196–211. [Google Scholar] [CrossRef]
- López-Marzo, A.M.; Merkoçi, A. Paper-based sensors and assays: A success of the engineering design and the convergence of knowledge areas. Lab Chip 2016, 16, 3150–3176. [Google Scholar] [CrossRef] [PubMed]
- Almeida, M.I.G.S.; Jayawardane, B.M.; Kolev, S.D.; McKelvie, I.D. Developments of microfluidic paper-based analytical devices (μPADs) for water analysis: A review. Talanta 2018, 177, 176–190. [Google Scholar] [CrossRef]
- Meredith, N.A.; Quinn, C.; Cate, D.M.; Reilly, T.H.; Volkens, J.; Henry, C.S. Paper-based analytical devices for environmental analysis. Analyst 2016, 141, 1874–1887. [Google Scholar] [CrossRef] [PubMed]
- Aydindogan, E.; Celik, E.G.; Timur, S. Paper-based analytical methods for smartphone sensing with functional nanoparticles: Bridges from Smart Surfaces to Global Health. Anal. Chem. 2018, 90, 12325–12333. [Google Scholar] [CrossRef]
- Yang, Y.; Noviana, E.; Nguyen, M.P.; Geiss, B.J.; Dandy, D.S.; Henry, C.S. Paper-based microfluidic devices: Emerging themes and applications. Anal. Chem. 2017, 89, 71–91. [Google Scholar] [CrossRef]
- Nery, E.W.; Kubota, L.T. Sensing approaches on paper-based devices: A review. Anal. Bioanal. Chem. 2013, 405, 7573–7595. [Google Scholar] [CrossRef] [PubMed]
- Liana, D.D.; Raguse, B.; Gooding, J.J.; Chow, E. Recent advances in paper-based sensors. Sensors 2012, 12, 11505–11526. [Google Scholar] [CrossRef] [PubMed] [Green Version]
- Kaneta, T.; Alahmad, W.; Varanusupakul, P. Microfluidic paper-based analytical devices with instrument free detection and miniaturized portable detectors. Appl. Spectrosc. Rev. 2019, 54, 117–141. [Google Scholar] [CrossRef] [Green Version]
- Morbioli, G.G.; Mazzu-Nascimento, T.; Stockton, A.M.; Carrilho, E. Technical aspects and challenges of colorimetric detection with microfluidic paper-based analytical devices (μPADs)-A review. Anal. Chim. Acta 2017, 970, 1–22. [Google Scholar] [CrossRef]
- Cate, D.M.; Adkins, J.A.; Mettakoonpitak, J.; Henry, C.S. Recent developments in paper-based microfluidic devices. Anal. Chem. 2015, 87, 19–41. [Google Scholar] [CrossRef] [PubMed]
- Li, Y.; Chen, Y.; Yu, H.; Tian, L.; Wang, Z. Portable and smart devices for monitoring heavy metal ions integrated with nanomaterials. TrAC Trends Anal. Chem. 2018, 98, 190–200. [Google Scholar] [CrossRef]
- Ullah, N.; Mansha, M.; Khan, I.; Qurashi, A. Nanomaterial-based optical chemical sensors for the detection of heavy metals in water: Recent advances and challenges. TrAC Trends Anal. Chem. 2018, 100, 155–166. [Google Scholar] [CrossRef]
- Sriram, G.; Bhat, M.P.; Patil, P.; Uthappa, U.T.; Jung, H.-Y.; Altalhi, T.; Kumeria, T.; Aminabhavi, T.M.; Pai, R.K.; Madhuprasad; et al. Paper-based microfluidic analytical devices for colorimetric detection of toxic ions: A review. TrAC Trends Anal. Chem. 2017, 93, 212–227. [Google Scholar] [CrossRef]
- Noviana, E.; Ozer, T.; Carrell, C.S.; Link, J.S.; McMahon, C.; Jang, I.; Henry, C.S. Microfluidic paper-based analytical devices: From design to applications. Chem. Rev. 2021, 121, 11835–11885. [Google Scholar] [CrossRef]
- Ozer, T.; McMahon, C.; Henry, C.S. Advances in paper-based analytical devices. Annu. Rev. Anal. Chem. 2020, 13, 85–109. [Google Scholar] [CrossRef] [Green Version]
- Bendicho, C.; Lavilla, I.; Pena-Pereira, F.; de la Calle, I.; Romero, V. Nanomaterial-integrated cellulose platforms for optical sensing of trace metals and anionic species in the environment. Sensors 2021, 21, 604. [Google Scholar] [CrossRef]
- Martinez, A.W.; Phillips, S.T.; Butte, M.J.; Whitesides, G.M. Patterned paper as a platform for inexpensive, low-volume, portable bioassays. Angew. Chem. Int. Ed. 2007, 46, 1318–1320. [Google Scholar] [CrossRef] [PubMed] [Green Version]
- Feigl, F.; Anger, V. Spot Tests in Inorganic Analysis, 6th ed.; Elsevier Science: Amsterdam, The Netherlands, 1972. [Google Scholar]
- Mercury and Health. Available online: https://www.who.int/news-room/fact-sheets/detail/mercury-and-health (accessed on 8 October 2021).
- Paciornik, S.; Yallouz, A.V.; Campos, R.C.; Gannerman, D. Scanner image analysis in the quantification of mercury using spot-tests. J. Braz. Chem. Soc. 2006, 17, 156–161. [Google Scholar] [CrossRef]
- Díez-Gil, C.; Caballero, A.; Ratera, I.; Tárraga, A.; Molina, P.; Veciana, J. Naked-eye and selective detection of mercury (II) ions in mixed aqueous media using a cellulose-based support. Sensors 2007, 7, 3481–3488. [Google Scholar] [CrossRef] [PubMed] [Green Version]
- Liu, J.; Wu, D.; Yana, X.; Guan, Y. Naked-eye sensor for rapid determination of mercury ion. Talanta 2013, 116, 563–568. [Google Scholar] [CrossRef]
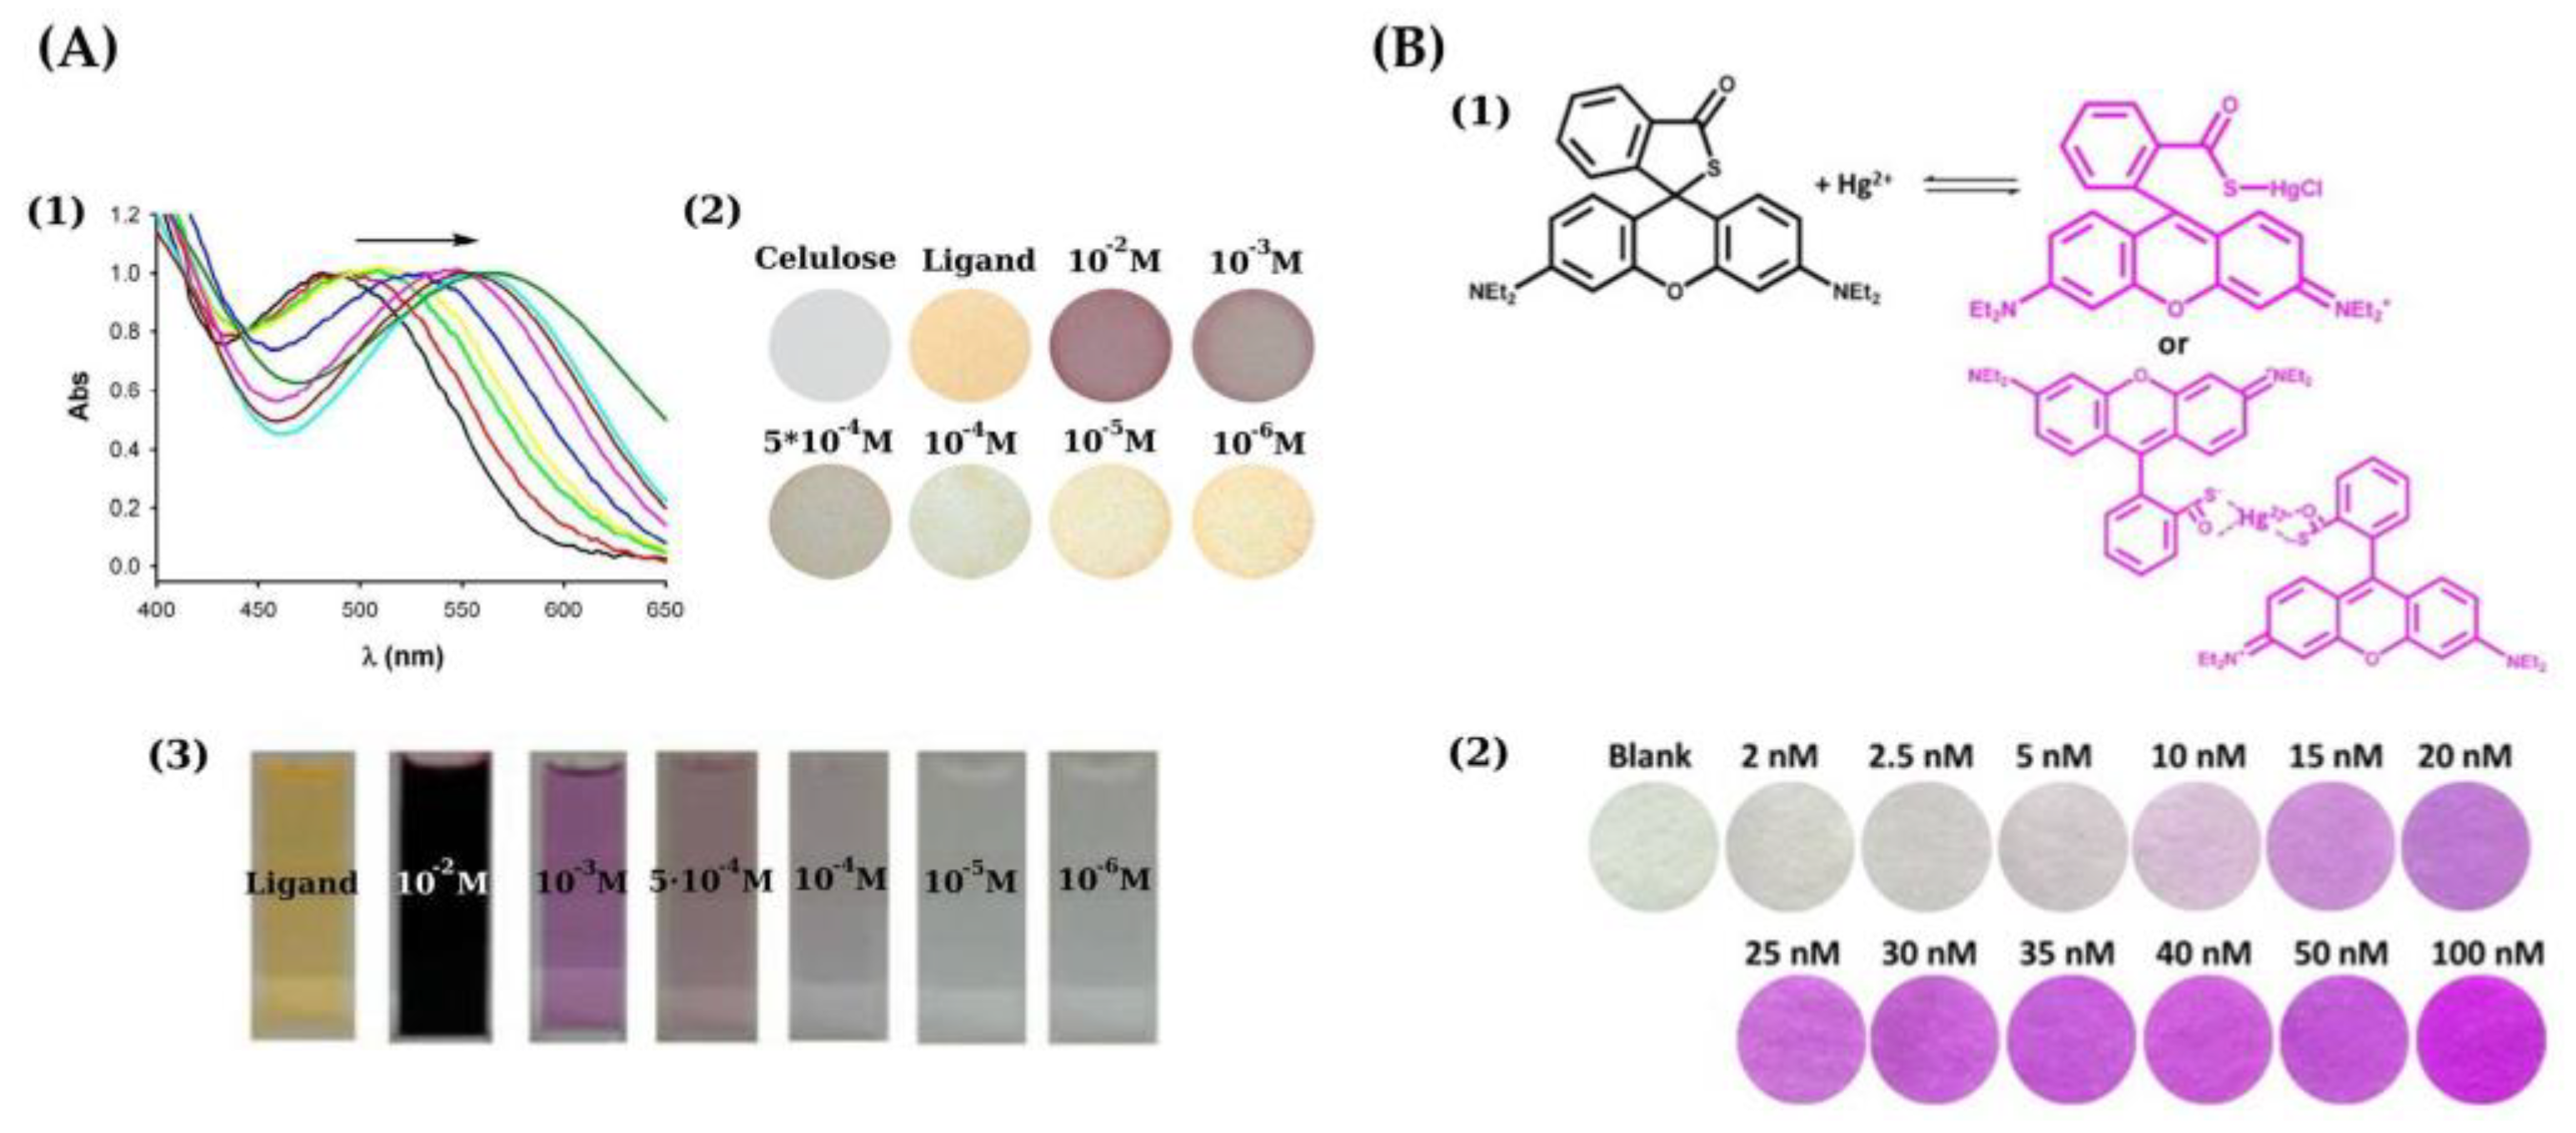
- Patil, S.K.; Das, D. A nanomolar detection of mercury(II) ion by a chemodosimetric rhodamine-based sensor in an aqueous medium: Potential applications in real water samples and as paper strips. Spectrochim. Acta Part A 2019, 210, 44–51. [Google Scholar] [CrossRef] [PubMed]
- Ponram, M.; Balijapalli, U.; Sambath, B.; Iyer, S.K.; Kakaraparthi, K.; Thota, G.; Bakthavachalam, V.; Cingaram, R.; Sung-Ho, J.; Sundaramurthy, K.N. Inkjet-printed phosphorescent Iridium(III) complex based paper sensor for highly selective detection of Hg2+. Dyes Pigm. 2019, 163, 176–182. [Google Scholar] [CrossRef]
- Sutariya, P.G.; Soni, H.; Gandhi, S.A.; Pandya, A. Luminescent behavior of pyrene-allied calix[4]arene for the highly pH-selective recognition and determination of Zn2+, Hg2+ and I− via the CHEF-PET mechanism: Computational experiment and paper-based device. New J. Chem. 2019, 43, 9855–9864. [Google Scholar] [CrossRef]
- Ergun, E.G.C. Three in one sensor: A fluorometric, colorimetric and paper based probe for the selective detection of mercury(II). New J. Chem. 2021, 45, 4202–4209. [Google Scholar] [CrossRef]
- Cai, L.; Fang, Y.; Mo, Y.; Huang, Y.; Xu, C.; Zhang, Z.; Wang, M. Visual quantification of Hg on a microfluidic paper-based analytical device using distance-based detection technique. AIP Adv. 2017, 7, 085214. [Google Scholar] [CrossRef] [Green Version]
- Nashukha, H.L.; Sitanurak, J.; Sulistyarti, H.; Nacapricha, D.; Uraisin, K. Simple and equipment-free paper-based device for determination of mercury in contaminated soil. Molecules 2021, 26, 2004. [Google Scholar] [CrossRef] [PubMed]
- Idros, N.; Chu, D. Triple-indicator-based multidimensional colorimetric sensing platform for heavy metal ion detections. ACS Sens. 2018, 3, 1756–1764. [Google Scholar] [CrossRef] [PubMed]
- Kamnoet, P.; Aeungmaitrepirom, W.; Menger, R.F.; Henry, C.S. Highly selective simultaneous determination of Cu(II), Co(II), Ni(II), Hg(II), and Mn(II) in water samples using microfluidic paper-based analytical devices. Analyst 2021, 146, 2229–2239. [Google Scholar] [CrossRef]
- Liu, L.; Lin, H. Paper-based colorimetric array test strip for selective and semiquantitative multi-ion analysis: Simultaneous detection of Hg2+, Ag+, and Cu2+. Anal. Chem. 2014, 86, 8829–8834. [Google Scholar] [CrossRef] [PubMed]
- Al-Shamsi, N.; Laptenok, S.P.; Bufaroosha, M.S.; Greish, Y.E.; Saleh, N. Time-resolved photoluminescence of 6-thienyl-lumazine fluorophores in cellulose acetate nanofibers for detection of mercury ions. Spectrochim. Acta Part A 2019, 222, 117189. [Google Scholar] [CrossRef]
- Gu, Z.; Zhao, M.; Sheng, Y.; Bentolila, L.A.; Tang, Y. Detection of mercury ion by infrared fluorescent protein and its hydrogel-based paper assay. Anal. Chem. 2011, 83, 2324–2329. [Google Scholar] [CrossRef] [PubMed]
- Ding, Y.; Wang, S.; Li, J.; Chen, L. Nanomaterial-based optical sensors for mercury ions. TrAc Trends Anal. Chem. 2016, 82, 175–190. [Google Scholar] [CrossRef]
- Li, M.; Cushing, S.K.; Wu, N. Plasmon-enhanced optical sensors: A review. Analyst 2015, 140, 386–406. [Google Scholar] [CrossRef] [Green Version]
- Yu, L.; Song, Z.; Peng, J.; Yang, M.; Zhi, H.; He, H. Progress of gold nanomaterials for colorimetric sensing based on different strategies. TrAC Trends Anal. Chem. 2020, 127, 115880. [Google Scholar] [CrossRef]
- He, Y.; Zhang, X.; Zhang, S.; Baloda, M.; Gurung, A.S.; Zeng, K.; Liu, G. Visual detection of Hg2+ in aqueous solution using gold nanoparticles and thymine-rich hairpin DNA probes. Biosens. Bioelectron. 2011, 26, 4464–4470. [Google Scholar] [CrossRef] [Green Version]
- Chen, G.-H.; Chen, W.-Y.; Yen, Y.-C.; Wang, C.-W.; Chang, H.-T.; Chen, C.-F. Detection of mercury(II) ions using colorimetric gold nanoparticles on paper-based analytical devices. Anal. Chem. 2014, 86, 6843–6849. [Google Scholar] [CrossRef]
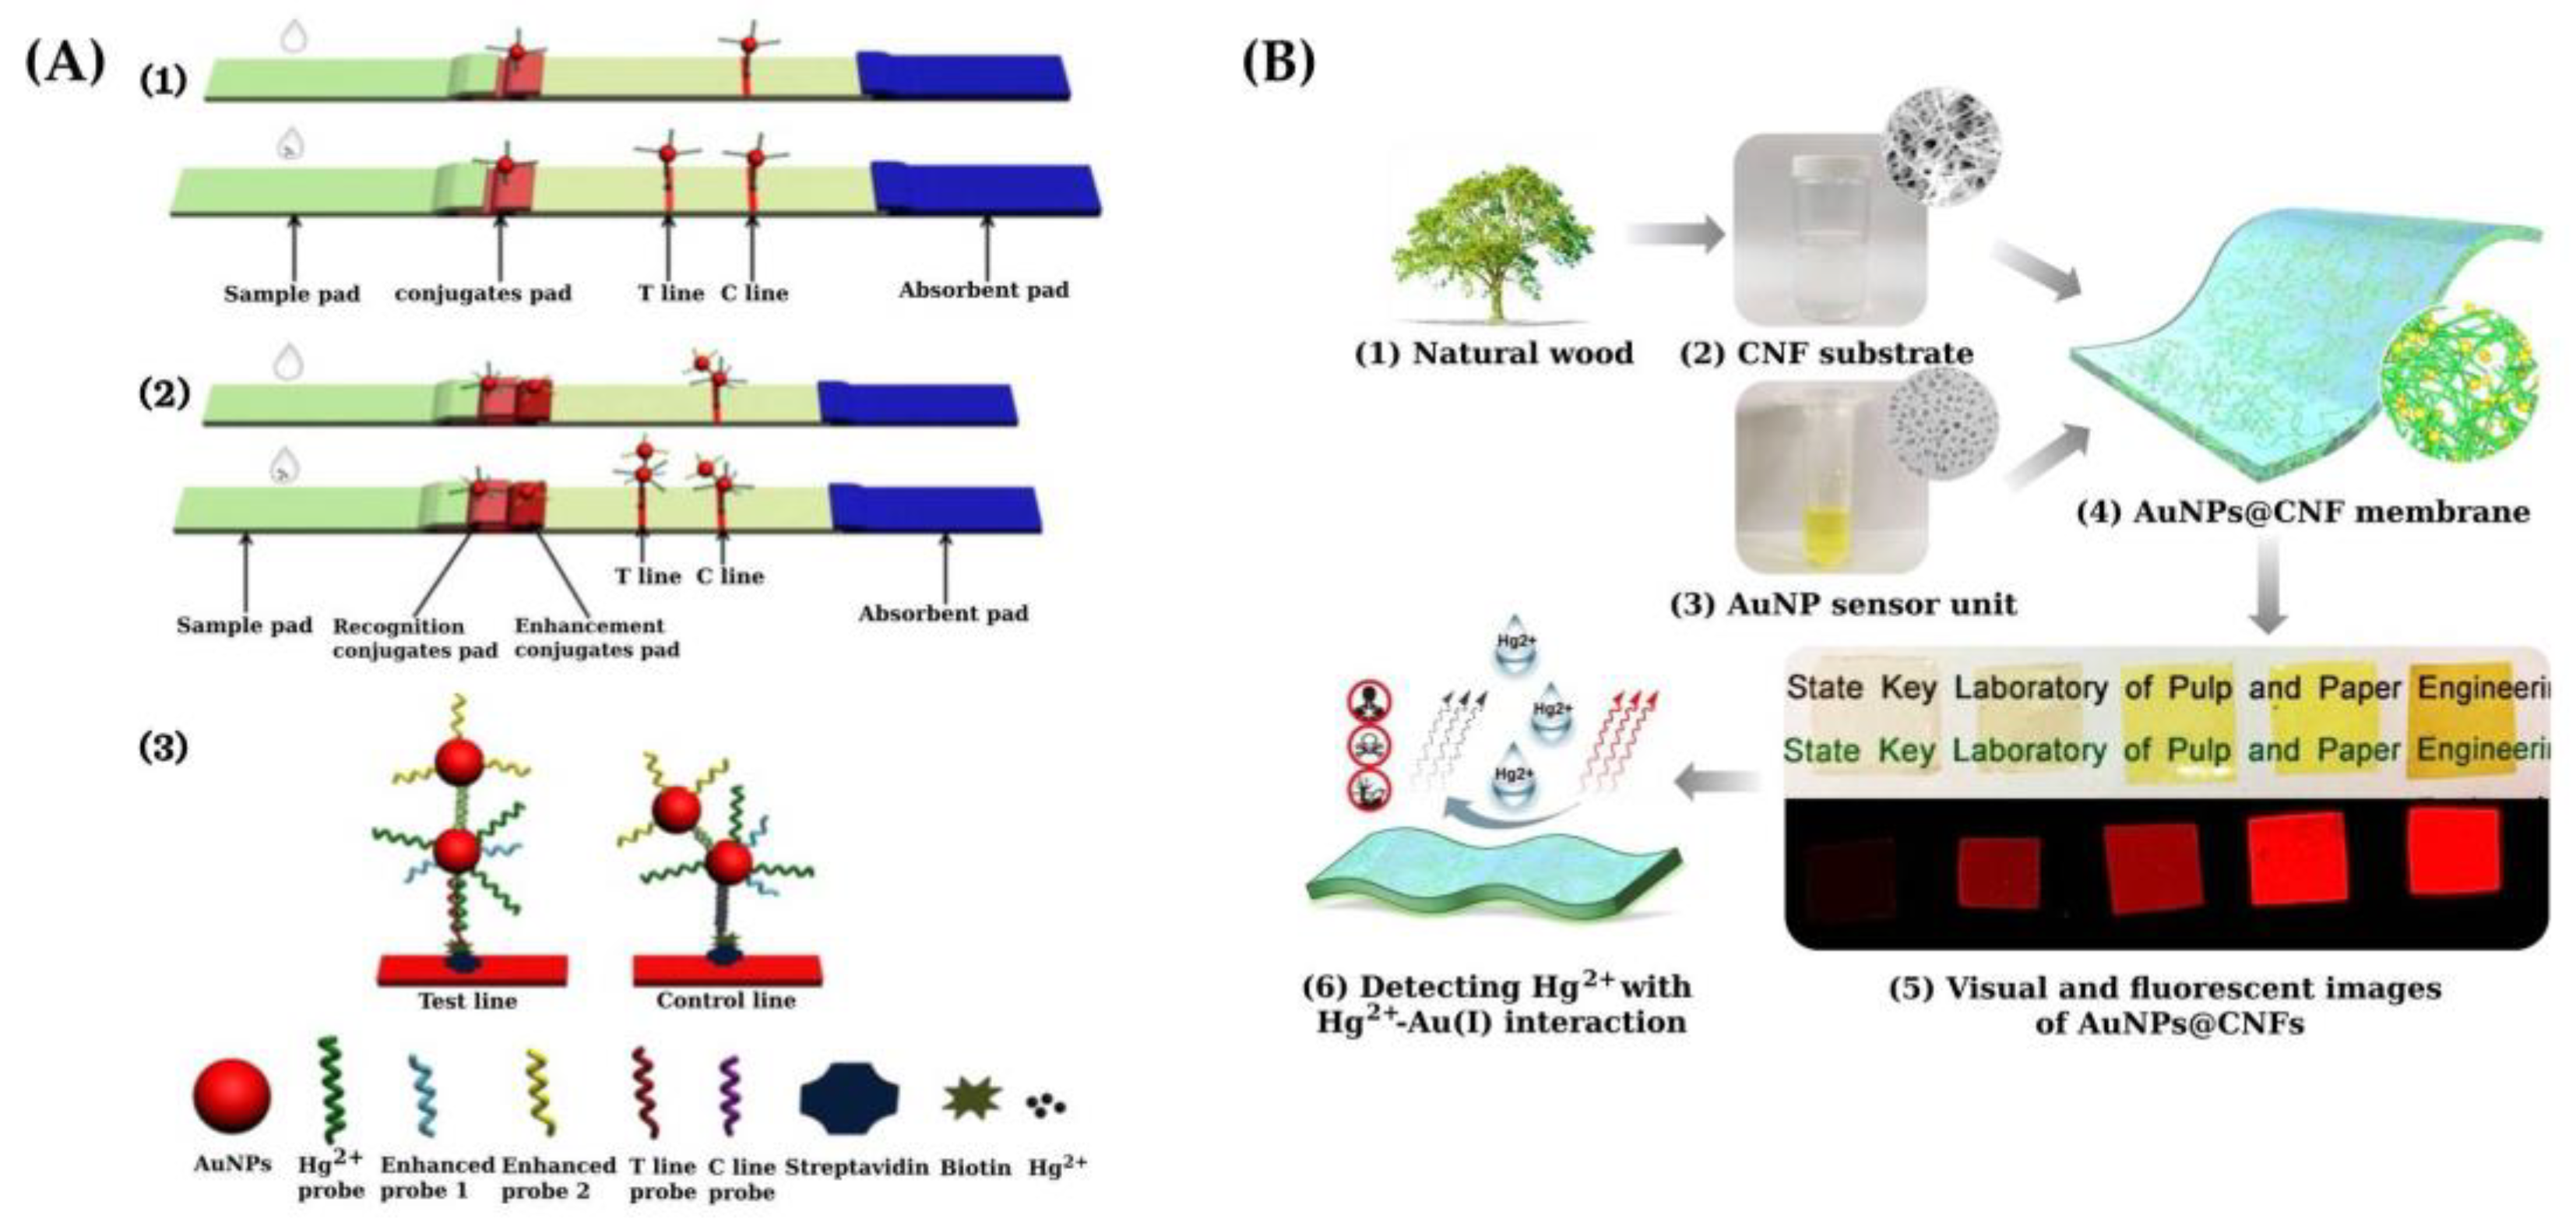
- Zhu, M.; Wang, Y.; Deng, Y.; Yao, L.; Adeloju, S.B.; Pan, D.; Xue, F.; Wu, Y.; Zheng, L.; Chen, W. Ultrasensitive detection of mercury with a novel one-step signal-amplified lateral flow strip based on gold nanoparticle-labeled ssDNA recognition and enhancement probes. Biosens. Bioelectron. 2014, 61, 14–20. [Google Scholar] [CrossRef] [PubMed]
- Yao, L.; Teng, J.; Qu, H.; Zhu, M.; Zheng, L.; Xue, F.; Chen, W. Paper matrix based array for rapid and sensitive optical detection of mercury ions using silver enhancement. Microchim. Acta 2017, 184, 569–576. [Google Scholar] [CrossRef]
- Fu, J.; Zhu, J.; Tian, Y.; He, K.; Yu, H.; Chen, L.; Fang, D.; Jia, D.; Xie, J.; Liu, H.; et al. Green and transparent cellulose nanofiber substrate-supported luminescent gold nanoparticles: A stable and sensitive solid-state sensing membrane for Hg(II) detection. Sens. Actuators B 2020, 319, 128295. [Google Scholar] [CrossRef]
- Shariati, S.; Khayatian, G. Microfluidic paper-based analytical device using gold nanoparticles modified with N,N’-bis(2-hydroxyethyl)dithiooxamide for detection of Hg(II) in air, fish and water samples. New J. Chem. 2020, 44, 18662–18667. [Google Scholar] [CrossRef]
- Yang, P.-C.; Lin, P.-H.; Huang, C.-C.; Wu, T.; Lin, Y.-W. Determination of Hg(II) based on the inhibited catalytic growth of surface enhanced Raman scattering-active gold nanoparticles on a patterned hydrophobic paper substrate. Microchem. J. 2020, 157, 104983. [Google Scholar] [CrossRef]
- Apilux, A.; Siangproh, W.; Praphairaksit, N.; Chailapakul, O. Simple and rapid colorimetric detection of Hg(II) by a paper-based device using silver nanoplates. Talanta 2012, 97, 388–394. [Google Scholar] [CrossRef]
- Meelapsom, R.; Jarujamrus, P.; Amatatongchai, M.; Chairam, S.; Kulsing, C.; Shen, W. Chromatic analysis by monitoring unmodified silver nanoparticles reduction on double layer microfluidic paper-based analytical devices for selective and sensitive determination of mercury(II). Talanta 2016, 155, 193–201. [Google Scholar] [CrossRef]
- Jarujambus, P.; Meelapsom, R.; Pencharee, S.; Obma, A.; Amatatongchai, M.; Ditcharoen, N.; Chairam, S.; Tamuang, S. Use of a smartphone as a colorimetric analyzer in paper-based devices for sensitive and selective determination of mercury in water samples. Anal. Sci. 2018, 34, 75–81. [Google Scholar] [CrossRef] [Green Version]
- Nain, A.; Barman, S.R.; Jain, S.; Mukherjee, A.; Satija, J. Dual mechanism-based sensing of mercury using unmodified, heteroepitaxially synthesized silver nanoparticles. Appl. Nanosci. 2017, 7, 299–307. [Google Scholar] [CrossRef] [Green Version]
- Ismail, M.; Khan, M.I.; Akhtar, K.; Seo, J.; Khan, M.A.; Asiri, A.M.; Khan, S.B. Phytosynthesis of silver nanoparticles; naked eye cellulose filter paper dual mechanism sensor for mercury ions and ammonia in aqueous solution. J. Mater. Sci. Mater. Electron. 2019, 30, 7367–7383. [Google Scholar] [CrossRef]
- Firdaus, M.L.; Aprian, A.; Meileza, N.; Hitsmi, M.; Elvia, R.; Rahmidar, L.; Khaydarov, R. Smartphone coupled with a paper-based colorimetric device for sensitive and portable mercury ion sensing. Chemosensors 2019, 7, 25. [Google Scholar] [CrossRef] [Green Version]
- Dey, S.; Kumar, A.; Mahto, A.; Raval, I.H.; Modi, K.M.; Haldar, S.; Jain, V.K. Oxacalix[4]arene templated silver nanoparticles as dual readout sensor: Developing portable kit for rapid detection of methylmercury and its speciation. Sens. Actuators B 2020, 317, 128180. [Google Scholar] [CrossRef]
- Monisha; Shrivas, K.; Kant, T.; Patel, S.; Devi, R.; Dahariya, N.S.; Pervez, S.; Deb, M.K.; Rai, M.K.; Rai, J. Inkjet-printed paper-based colorimetric sensor coupled with smartphone for determination of mercury (Hg2+). J. Hazard. Mater. 2021, 414, 125440. [Google Scholar] [CrossRef]
- Mavaei, M.; Chahardoli, A.; Fattahi, A.; Khoshroo, A. A Simple method for developing a hand-drawn paper-based sensor for mercury using green synthesized silver nanoparticles and smartphone as a hand-held-device for colorimetric assay. Glob. Chall. 2021, 5, 2000099. [Google Scholar] [CrossRef]
- Costas-Mora, I.; Romero, V.; Lavilla, I.; Bendicho, C. An overview of recent advances in the application of quantum dots as luminescent probes to inorganic-trace analysis. TrAC Trends Anal. Chem. 2014, 57, 64–72. [Google Scholar] [CrossRef]
- Dong, Y.; Cai, J.; You, X.; Chi, Y. Sensing applications of luminescent carbon-based dots. Analyst 2015, 140, 7468–7486. [Google Scholar] [CrossRef]
- Costas-Mora, I.; Romero, V.; Lavilla, I.; Bendicho, C. Luminescent assays based on carbon dots for inorganic trace analysis. Rev. Anal. Chem. 2015, 34, 61–76. [Google Scholar] [CrossRef]
- Zhang, L.; Wang, E. Metal nanoclusters: New fluorescent probes for sensors and bioimaging. Nano Today 2014, 9, 132–157. [Google Scholar] [CrossRef]
- Li, H.; Wang, W.; Wang, Z.; Lv, Q.; Bai, H.; Zhang, Q. Analyte-enhanced photocatalytic activity of CdSe/ZnS quantum dots for paper-based colorimetric sensing of Hg2+ under visible light. Microchem. J. 2021, 164, 106037. [Google Scholar] [CrossRef]
- Guo, X.; Huang, J.; Wei, Y.; Zeng, Q.; Wang, L. Fast and selective detection of mercury ions in environmental water by paper-based fluorescent sensor using boronic acid functionalized MoS2 quantum dots. J. Hazard. Mater. 2020, 381, 120969. [Google Scholar] [CrossRef] [PubMed]
- Qi, J.; Li, B.; Wang, X.; Zhang, Z.; Wang, Z.; Han, J.; Chen, L. Three-dimensional paper-based microfluidic chip device for multiplexed fluorescence detection of Cu2+ and Hg2+ ions based on ion imprinting technology. Sens. Actuators B 2017, 251, 224–233. [Google Scholar] [CrossRef]
- Anh, N.T.N.; Chowdhury, A.D.; Doong, R. Highly sensitive and selective detection of mercury ions using N,S-codoped graphene quantum dots and its paper strip based sensing application in wastewater. Sens. Actuators B 2017, 252, 1169–1178. [Google Scholar] [CrossRef]
- Yu, S.; Li, W.; Fujii, Y.; Omura, T.; Minami, H. Fluorescent spherical sponge cellulose sensors for highly selective and semiquantitative visual analysis: Detection of Hg2+ and Cu2+ ions. ACS Sustain. Chem. Eng. 2019, 7, 19157–19166. [Google Scholar] [CrossRef]
- Patir, K.; Gogoi, S.K. Nitrogen-doped carbon dots as fluorescence ON–OFF–ON sensor for parallel detection of copper(II) and mercury(II) ions in solutions as well as in filter paper-based microfluidic device. Nanoscale Adv. 2019, 1, 592–601. [Google Scholar] [CrossRef] [Green Version]
- Wang, Y.; Yang, L.; Liu, B.; Yu, S.; Jiang, C. A colorimetric paper sensor for visual detection of mercury ions constructed with dual-emission carbon dots. New J. Chem. 2018, 42, 15671–15677. [Google Scholar] [CrossRef]
- Ninwong, B.; Sangkaew, P.; Hapa, P.; Ratnarathorn, N.; Menger, R.F.; Henry, C.S.; Dungchai, W. Sensitive distance-based paper-based quantification of mercury ions using carbon nanodots and heating-based preconcentration. RSC Adv. 2020, 10, 9884–9893. [Google Scholar] [CrossRef] [Green Version]
- Jiawen, Y.; Yijia, G.; Fanghao, C.; Dan, S.; Shuping, X.; Jingjing, C.; Weiqing, X.; Qidan, C. A Smartphone-assisted paper-based analytical device for fluorescence assay of Hg2+. Chem. Res. Chin. Univ. 2019, 35, 972–977. [Google Scholar]
- Zhang, Y.; Zuo, P.; Ye, B.-C. A low-cost and simple paper-based microfluidic device for simultaneous multiplex determination of different types of chemical contaminants in food. Biosens. Bioelectron. 2015, 68, 14–19. [Google Scholar] [CrossRef]
- Bothra, S.; Upadhyay, Y.; Kumar, R.; Kumar, S.K.A.; Sahoo, S.K. Chemically modified cellulose strips with pyridoxal conjugated red fluorescent gold nanoclusters for nanomolar detection of mercuric ions. Biosens. Bioelectron. 2017, 90, 329–335. [Google Scholar] [CrossRef]
- Qi, Y.-X.; Zhang, M.; Zhu, A.; Shi, G. Terbium(III)/gold nanocluster conjugates: The development of a novel ratiometric fluorescent probe for mercury(II) and a paper-based visual sensor. Analyst 2015, 140, 5656–5661. [Google Scholar] [CrossRef] [PubMed]
- Pourreza, N.; Golmohammadi, H.; Rastegarzadeh, S. Highly selective and portable chemosensor for mercury determination in water samples using curcumin nanoparticles in a paper based analytical device. RSC Adv. 2016, 6, 69060–69066. [Google Scholar] [CrossRef]
- Chen, W.; Fang, X.; Li, H.; Cao, H.; Kong, J. A simple paper-based colorimetric device for rapid mercury(II) assay. Sci. Rep. 2016, 6, 31948. [Google Scholar] [CrossRef]
- Li, H.; Wang, L. NaYF4:Yb3+/Er3+ nanoparticle-based upconversion luminescence resonance energy transfer sensor for mercury(II) quantification. Analyst 2013, 138, 1589–1595. [Google Scholar] [CrossRef] [PubMed]
- Dey, N. A simple strategy for the visual detection and discrimination of Hg2+ and CH3Hg+ species using fluorescent nanoaggregates. Dalton Trans. 2021, 50, 12563–12569. [Google Scholar] [CrossRef]


| Material | Type of PAD | Recognition Element | Signal Readout | Sample/Matrix | LOD (ppb) | Ref. |
|---|---|---|---|---|---|---|
| 3 MM Whatman chromatography paper | Paper-based sensor | CuI | Scanner | Fish | 7 (ng/g) | [41] |
| Cellulose | Paper-based sensor | bis(ferrocenyl) azine | Naked eye | Aqueous media | 104 | [42] |
| Porous silica matrix onto cellulose | Paper-based sensor * | Rhodamine B thiolactone | Flatbed scanner and naked eye | Water | 0.24 (Scanner) | [43] |
| Filter paper | Paper-based sensor | Rhodamine appended vinyl ether | Naked eye | Drinking water Tap water | 27.2 (in solution) 104 (paper strip) | [44] |
| Whatman paper | Paper-based sensor | Ir complex (Phosphorescent) | Naked eye | --- | 3.56 (fluorimetry) | [45] |
| Cellulose paper | Paper-based sensor (Hg, I, Zn) | Calix[4]arene (fluorescent) | Digital camera (UV irradiation) | Wastewater | 0.58 (fluorimetry) | [46] |
| Filter paper | Paper-based sensor | Tetrahydrophenazine-based Fluorophore | Digital camera | --- | 8 × 10³ (neutral pH) 3 × 10³ (pH 1.6–2.3) | [47] |
| Filter paper | μ-PAD | Dithizone | Naked eye | Whitening cream | 930 | [48] |
| Whatman No. 4 filter paper | μ-PAD | HgI42− complex | Digital camera | Contaminated soil and water | 2 × 10⁴ | [49] |
| Whatman grades No. 1 and 4 | μ-PAD (Hg, Pb, Cr, Cu, Fe) | Three indicators (ligands) | Digital camera | Waters | 20 | [50] |
| Whatman No. 1 paper | μ-PAD (Cu, Co, Ni, Mn, Hg) | Dithizone (for Hg) | Scanner | Drinking, pond and tap water | 200 (scanner) ca. 104 (naked eye) | [51] |
| Whatman grade No. 1 filter paper | Array paper strip (for Hg, Ag, Cu) | 5 indicators (18 formulations) | Flatbed scanner | Pond water | 38 (Hg) | [52] |
Publisher’s Note: MDPI stays neutral with regard to jurisdictional claims in published maps and institutional affiliations. |
© 2021 by the authors. Licensee MDPI, Basel, Switzerland. This article is an open access article distributed under the terms and conditions of the Creative Commons Attribution (CC BY) license (https://creativecommons.org/licenses/by/4.0/).
Share and Cite
Bendicho, C.; Lavilla, I.; Pena-Pereira, F.; la Calle, I.d.; Romero, V. Paper-Based Analytical Devices for Colorimetric and Luminescent Detection of Mercury in Waters: An Overview. Sensors 2021, 21, 7571. https://doi.org/10.3390/s21227571
Bendicho C, Lavilla I, Pena-Pereira F, la Calle Id, Romero V. Paper-Based Analytical Devices for Colorimetric and Luminescent Detection of Mercury in Waters: An Overview. Sensors. 2021; 21(22):7571. https://doi.org/10.3390/s21227571
Chicago/Turabian StyleBendicho, Carlos, Isela Lavilla, Francisco Pena-Pereira, Inmaculada de la Calle, and Vanesa Romero. 2021. "Paper-Based Analytical Devices for Colorimetric and Luminescent Detection of Mercury in Waters: An Overview" Sensors 21, no. 22: 7571. https://doi.org/10.3390/s21227571