
From Fully Physical to Virtual Sensing for Water Quality Assessment: A Comprehensive Review of the Relevant State-of-the-Art


Abstract
:1. Introduction
1.1. Background and Motivation
- (i)
- Developing state-of-the-art laboratory facilities and their subsequent maintenance is expensive;
- (ii)
- It generally requires specialized equipment and expert personnel to assess WQ;
- (iii)
- Results can be questionable because of the field-sampling error and errors introduced by the malfunction or miscalibration of laboratory equipment;
- (iv)
- It lacks real-time WQ information and therefore prone to time-delayed responses to pollution incidences;
- (v)
- It is labour-intensive and time-consuming.
- (i)
- There is limited information on surface and groundwater resources concerning a comprehensive overview of WQ parameters, particularly in the context of virtual sensing;
- (ii)
- There is no clear specification book for an advanced water quality assessment (WQA) system;
- (iii)
- In this study scenario (surface and groundwater), no study has reviewed very recent advances in ML concepts that have the potential to enrich the virtual sensing realization for WQA.
1.2. Work Objectives
- To provide an overview of key WQ parameters for the particular water use. The overview will:
- 1.1.
- Discuss the criteria for selecting WQ parameters and then identify (or provide) the key parameters that need to be monitored for the specified use case;
- 1.2.
- Discuss the importance and traditional measurement process for each parameter;
- 1.3.
- Provide the corresponding threshold concerning acceptable contamination;
- 1.4.
- Provide the required accuracy for measuring each of the parameters;
- 1.5.
- Formulate the measurement cost model (or estimate) for each parameter.
- To discuss virtual sensing fundamentals (for dummies level);
- To formulate a comprehensive specification book for an advanced WQA process (that involves a robust virtual sensing module) that has the potential to be an enabler for real-time (or near real-time) monitoring of WQ;
- To identify and discuss the most recent advances in ML concepts that can enrich the virtual sensing realization for WQA.
2. Water Quality Parameters: An Overview
2.1. Description of the Use Case
2.2. Selection of Key Water Quality Parameters
- Salinity: salinity (known as the concentration of dissolved salts in soils and waters) problem exists when salt builds up in the crop root zone to concentrations that cause a loss in yield [32]. High salt concentration increases the soil solution’s osmotic pressure, a situation that can lead to physiological drought. That is, although the soil in the field may appear to have enough moisture, the crops will wilt since their roots will be unable to absorb the soil water [37,39];
- Water infiltration rate: the problem of infiltration occurs when the usual infiltration rate is significantly reduced to supply the crops with adequate water to sustain satisfactory yields. The two most common WQ factors impacting the normal infiltration rate include water’s salinity and its sodium content in relation to magnesium and calcium content [32];
- Specific ion toxicity: toxicity problem occurs when particular ions (or constituents) in the water or soil gets absorbed by the crops and accumulate to amounts high enough to damage the crops or reduced the yields. The main ions of concern include sodium, chloride, and boron [32,39]. Toxicity issues, which may occur even in low concentrations of these ions, often complements and complicates water infiltration or salinity problem [32];
- Miscellaneous problems: the other problems related to irrigation WQ include high nitrogen concentrations that may cause excessive vegetative growth; high concentrations of chemical oxygen demand that consumes dissolved oxygen and inhibits plant growth; and numerous abnormalities often linked with an unusual water pH [32,34]. Another significant problem faced by farmers using irrigation water is damage to irrigation equipment because of water-induced encrustation or corrosion [40].
2.3. A Brief Discussion of Key Water Quality Parameters
2.3.1. Potential of Hydrogen (pH)
2.3.2. Electrical Conductivity (EC)
2.3.3. Dissolved Oxygen (DO)
2.3.4. Chemical Oxygen Demand (COD)
2.3.5. Total Nitrogen (TN)
2.3.6. Sulphate
2.3.7. Chloride
2.3.8. Boron
2.3.9. Sodium, Calcium, and Magnesium
2.3.10. Potassium
2.3.11. Alkalinity
2.3.12. Escherichia coli (E. coli)
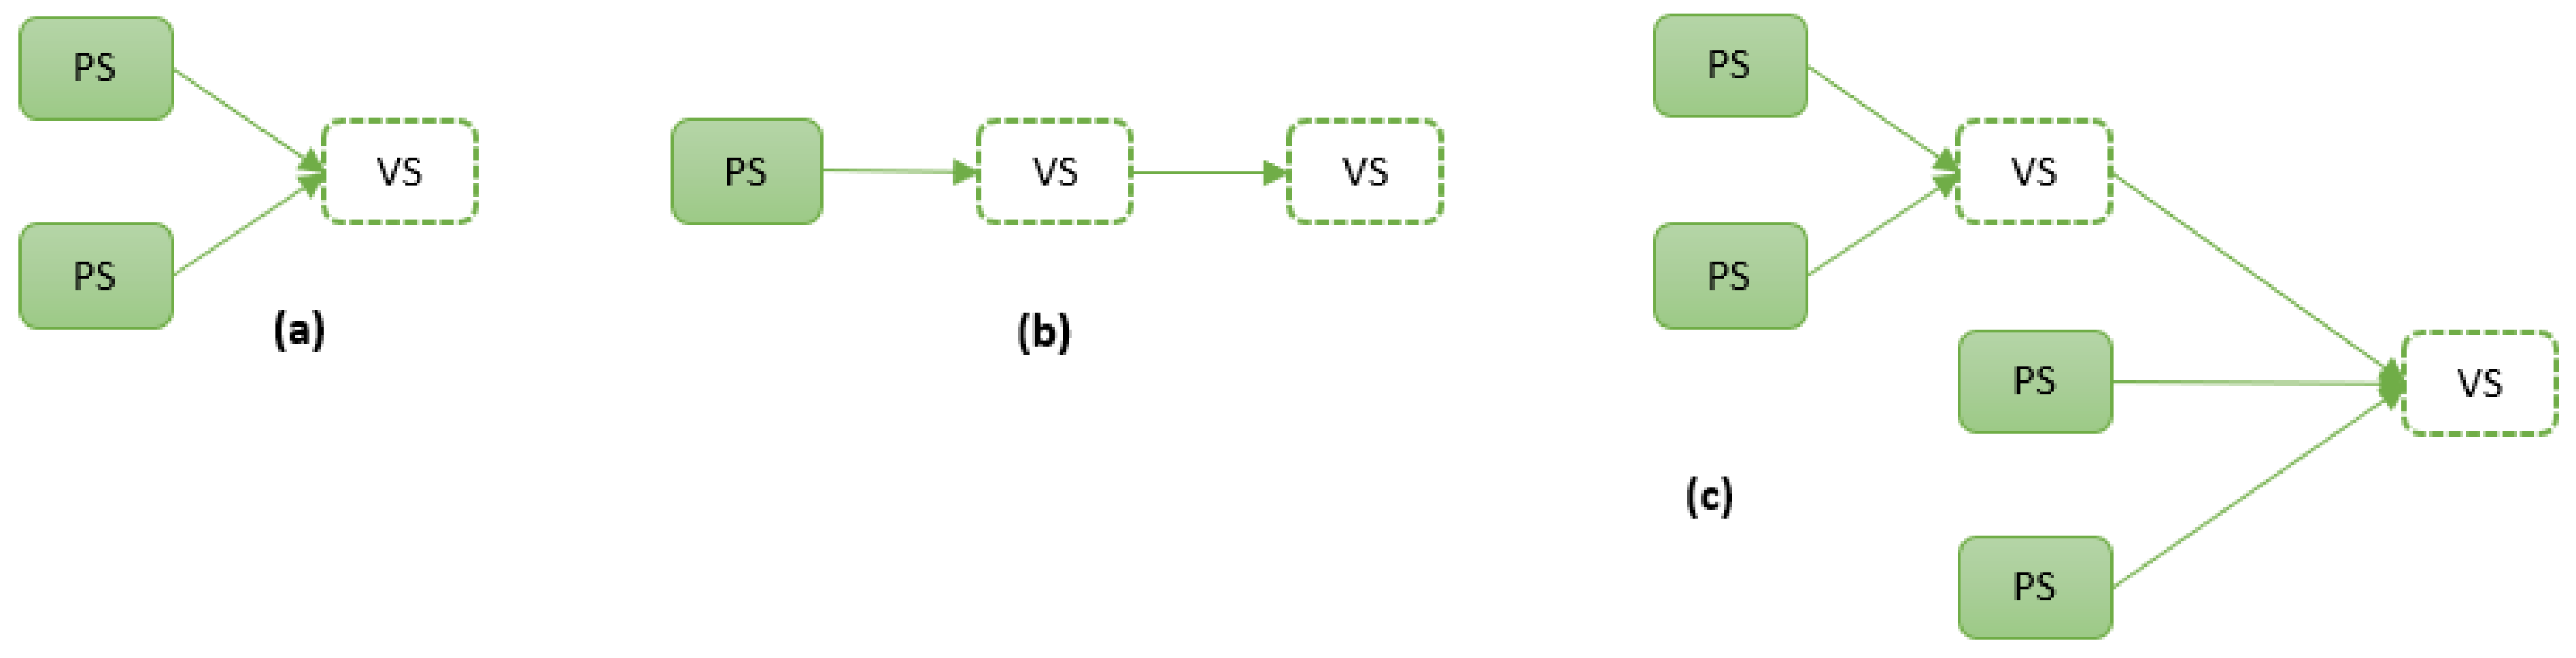
2.4. Irrigation Water Quality Indices
2.5. Regulatory Standards with Respect to Acceptable Contamination
2.6. Measurement Accuracy and Acceptable “Accuracy Tolerance” Ranges
2.7. Measurement Costs Models or Estimates
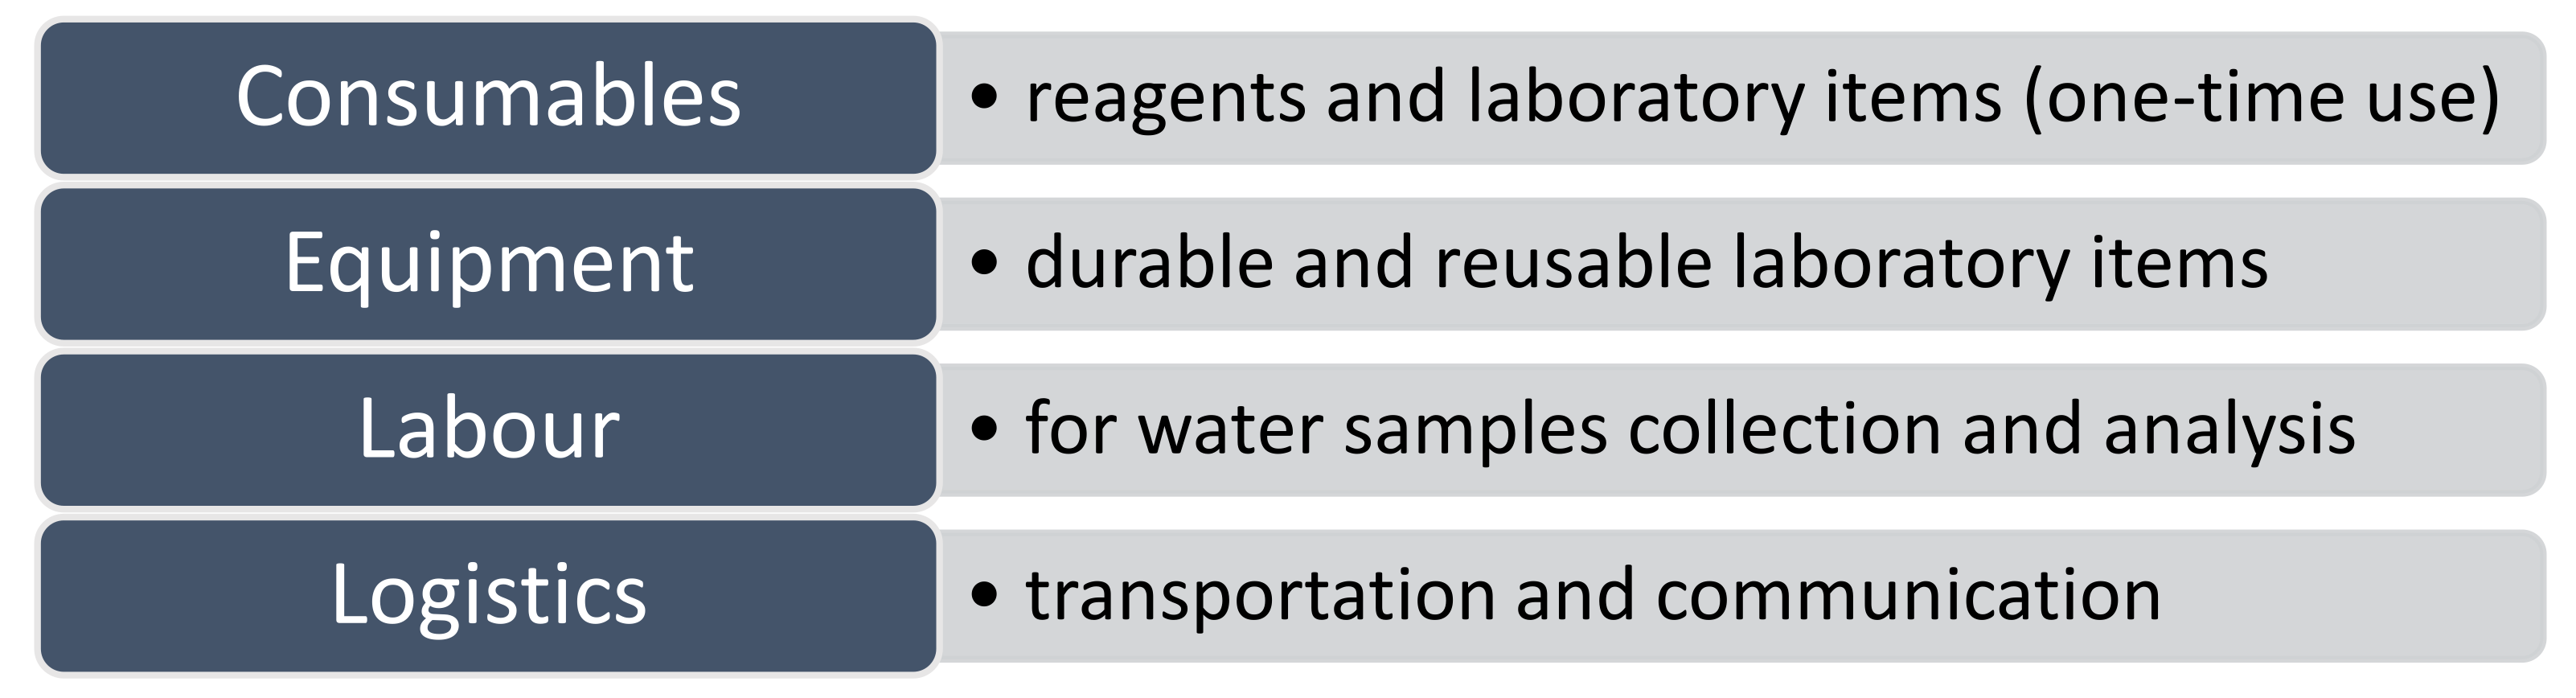
- Sample preservation: this will consider the required sample preservation and (or) recommended sample transportation time. Sampling and sample preservation may introduce serious errors due to failure to properly remove previous sample residues from sample containers, contamination from a sampling device, and loss of metals by precipitation and/or adsorption on sample containers caused by a failure to properly acidify the sample [43]. The COD analysis is one such case since its sample must be preserved by acidification to pH ≤ 2 using the concentrated sulphuric acid [43]. Noting the sample transportation time is essential, particularly for rural populations where the nearest regional laboratories can be miles away from source water supplies. For instance, the E. coli sample must preferably be analyzed within six hours of sample collection [71], and this may be impractical in such cases;
- Transportation cost: the return of samples to central laboratories within a few hours depends, to some extent, on the availability of good road infrastructure and reliable motorized transport for sampling officers. Therefore, transportation costs (vehicle fuel and maintenance) will always be a factor whenever the samples need to be transported to the laboratory (lab);
- Equipment cost: this will recognize costs of reusable (or durable) lab items such as refrigerators, culture tube racks, weighing scales, incubators, autoclaves, hot plates, magnetic stirrers, glassware, inoculation loops, etc. since some of the equipment rely on stable electricity supply and periodic maintenance or replacement;
- Consumables (quantity + safety): consumables include reagents costs and one-time use laboratory items like distilled water, absorbent pads, filter paper, alcohol disinfectant, gloves, cotton swabs, gas cylinders, etc. We will pay more attention to the quantity and safety of each reagent per parameter assessment. For instance, the COD test involves dangerous chemicals that need careful disposal (hazardous mercuric sulphate) and are potentially harmful (sulphuric acid) to operators [43];
- Duration of measurement: this will assess the time it takes to complete the experimental analysis since the assessment time usually determines the feasibility of measuring the particular parameter in real-time [29]. For instance, sulphate determination takes less than 10 min, COD takes 2–4 h, while E. coli takes about 18 h;
- Communication + computing costs: this will consider the costs associated with hardware and software for data storage, processing, interpretation, and reporting; production of outputs such as presentation software or geographic information systems. This step is critical since interpretation and reporting of monitoring results enable relevant stakeholders to make suitable recommendations for future actions [7].
3. Fundamentals of Virtual Sensing
3.1. Physical Versus Virtual Sensors
3.2. An Introduction to Virtual Sensing (for Dummies Level)
- The vs. value is cheaper both initially and in the long run since no equipment needs to be bought or maintained;
- It is ideal for real-time monitoring since the vs. will never be removed for issues such as recalibration;
- It is also ideal for high-frequency monitoring since there is no need to wait for a long chemical reaction to take place;
- It can be easily scaled over many locations without extra investment.
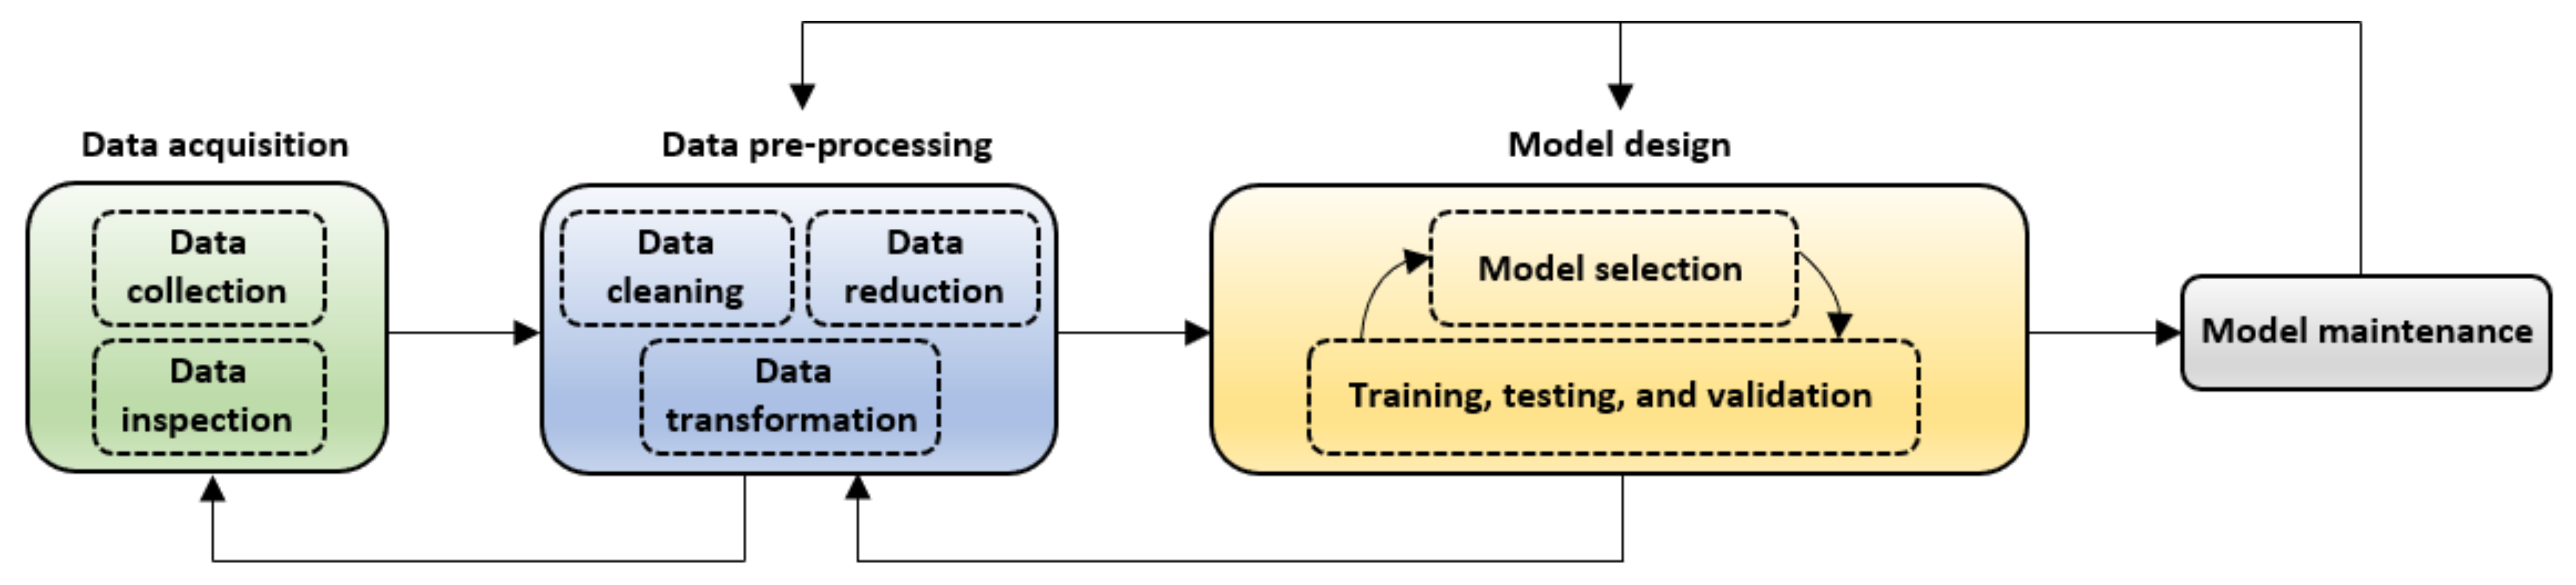
3.3. Virtual Sensor Development
3.3.1. Data Acquisition
3.3.2. Data Pre-Processing
3.3.3. Model Design
- (i)
- Model structure selection;
- (ii)
- Model training, testing, and validation.
3.3.4. Model Maintenance
3.4. Current Status of Virtual Sensor Applications for Water Quality Assessment
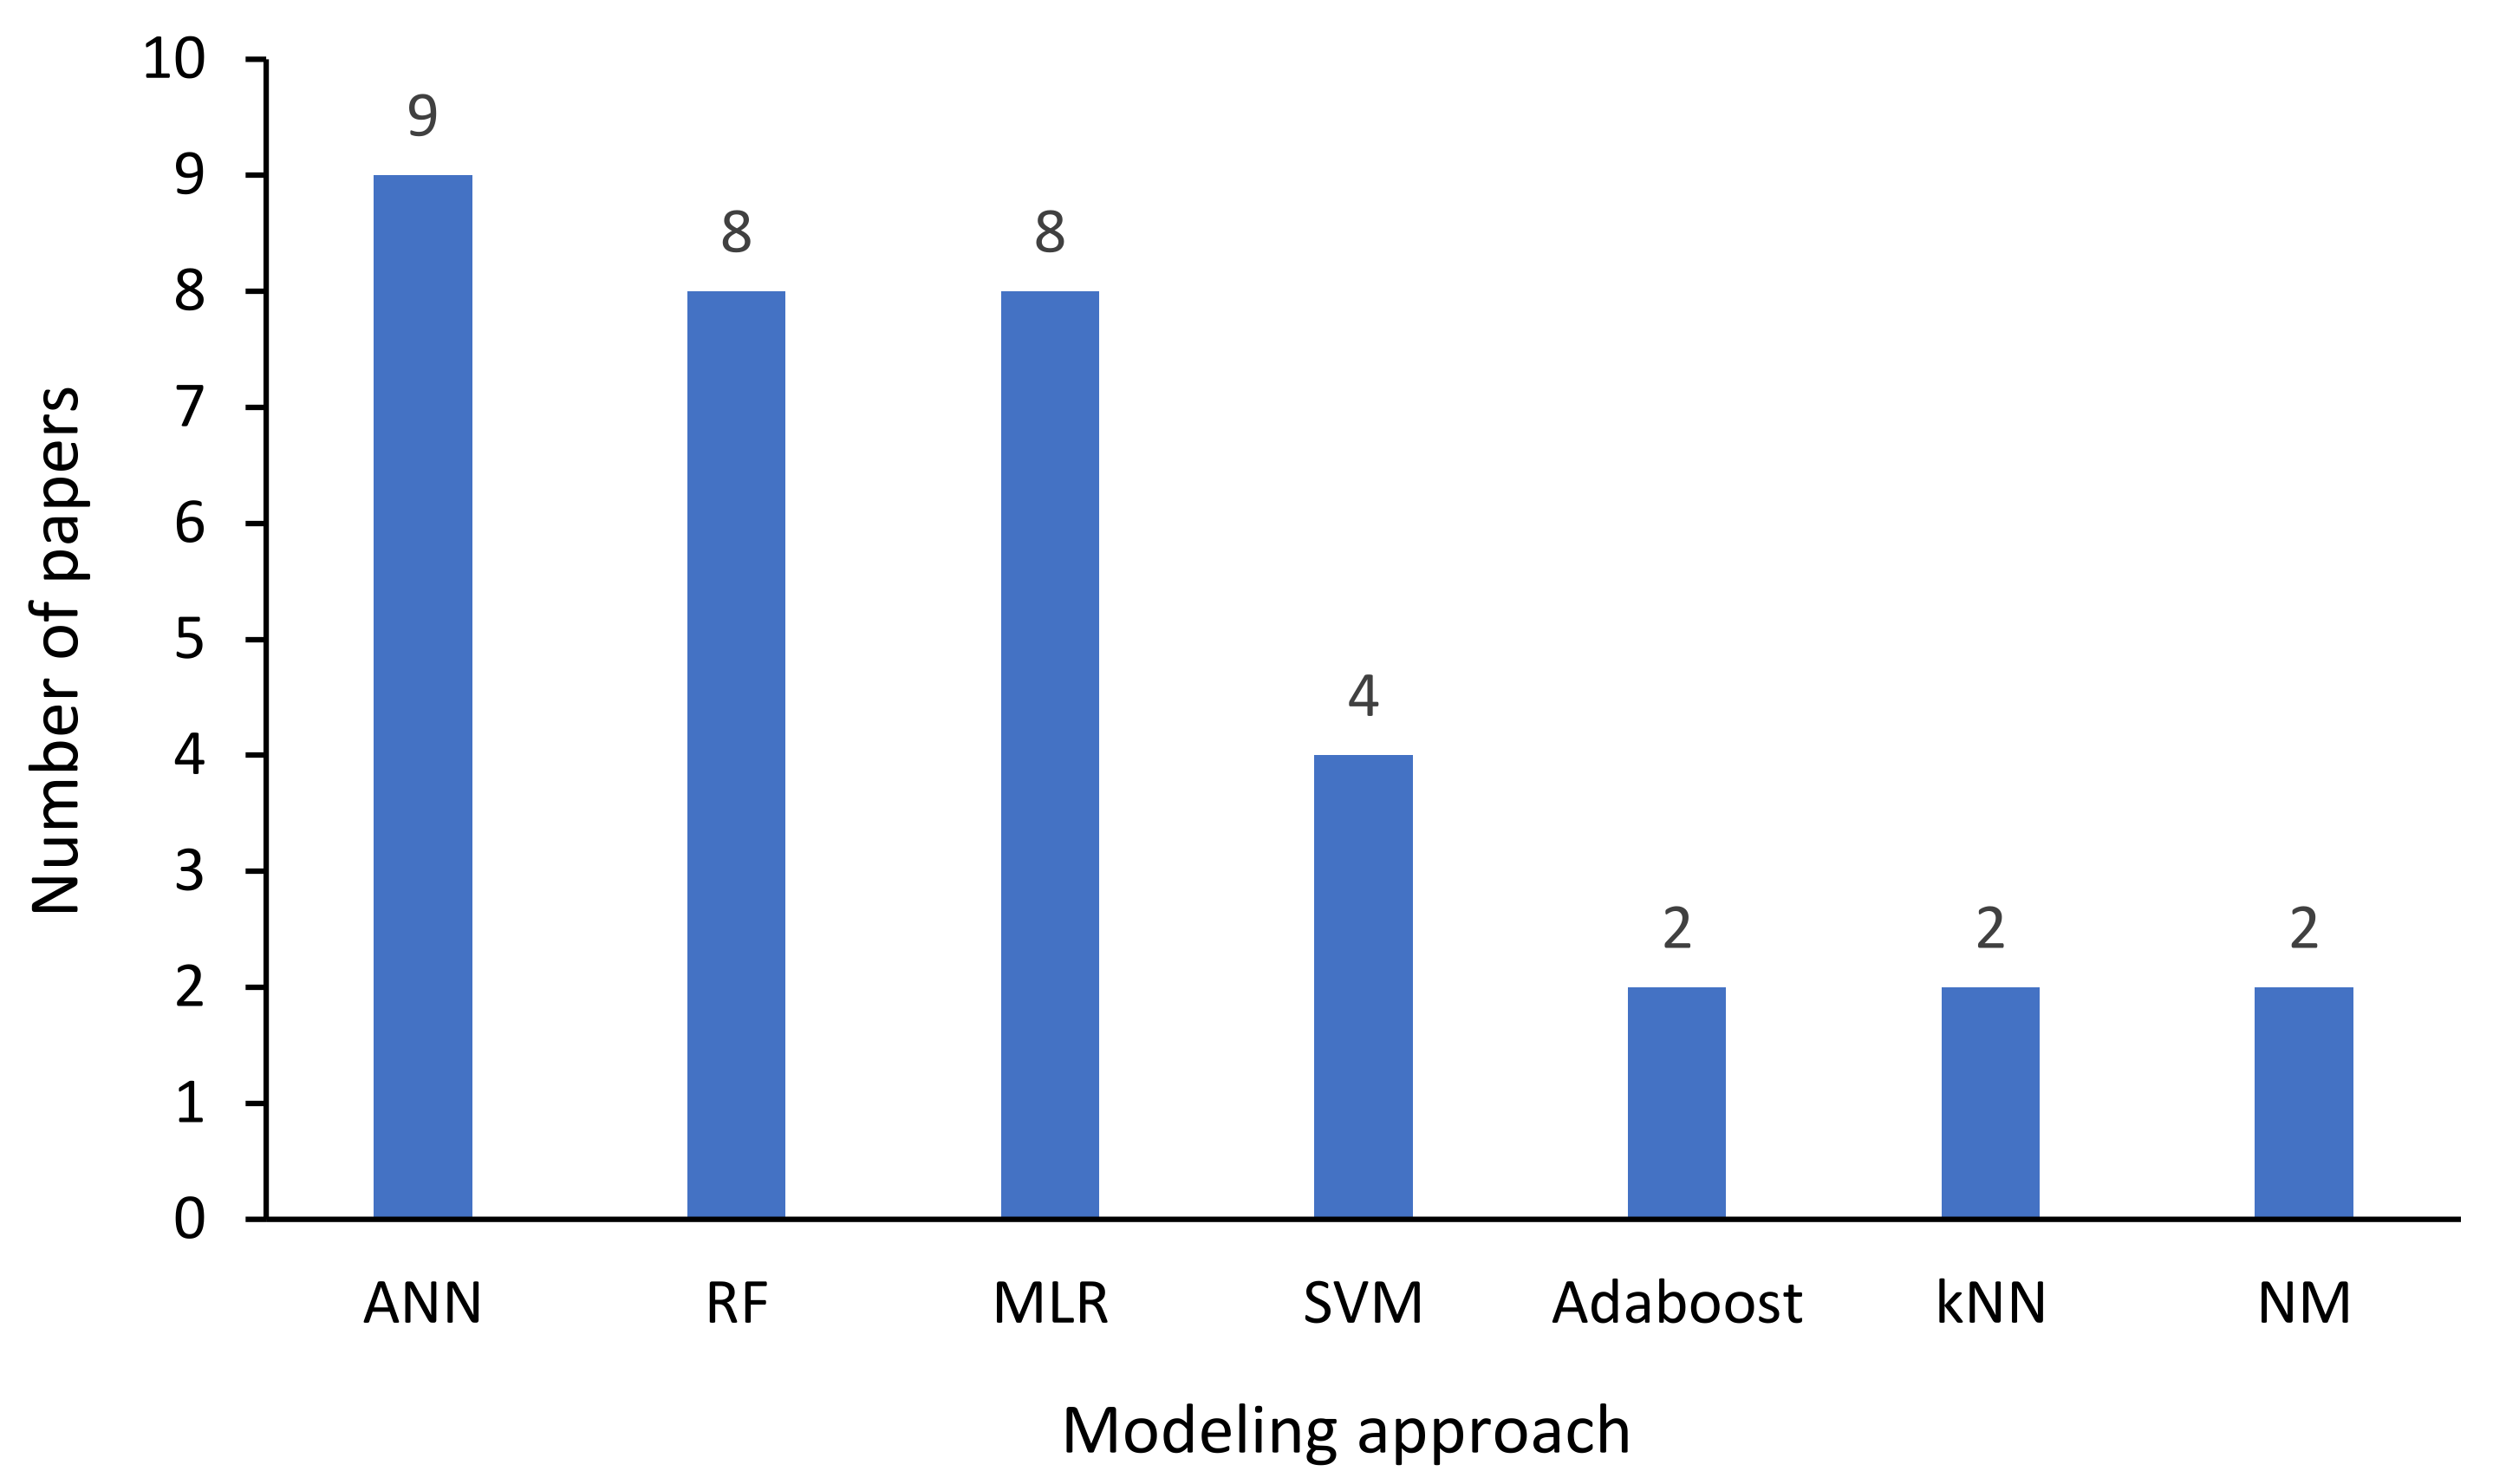
3.4.1. Commonly Used Modeling Approaches
- (i)
- The simplest compared to other ML algorithms;
- (ii)
- One of the most successful ML techniques in practice (particularly from transferability to the end-user point of view) since the models are not very sensitive to noise and outliers.
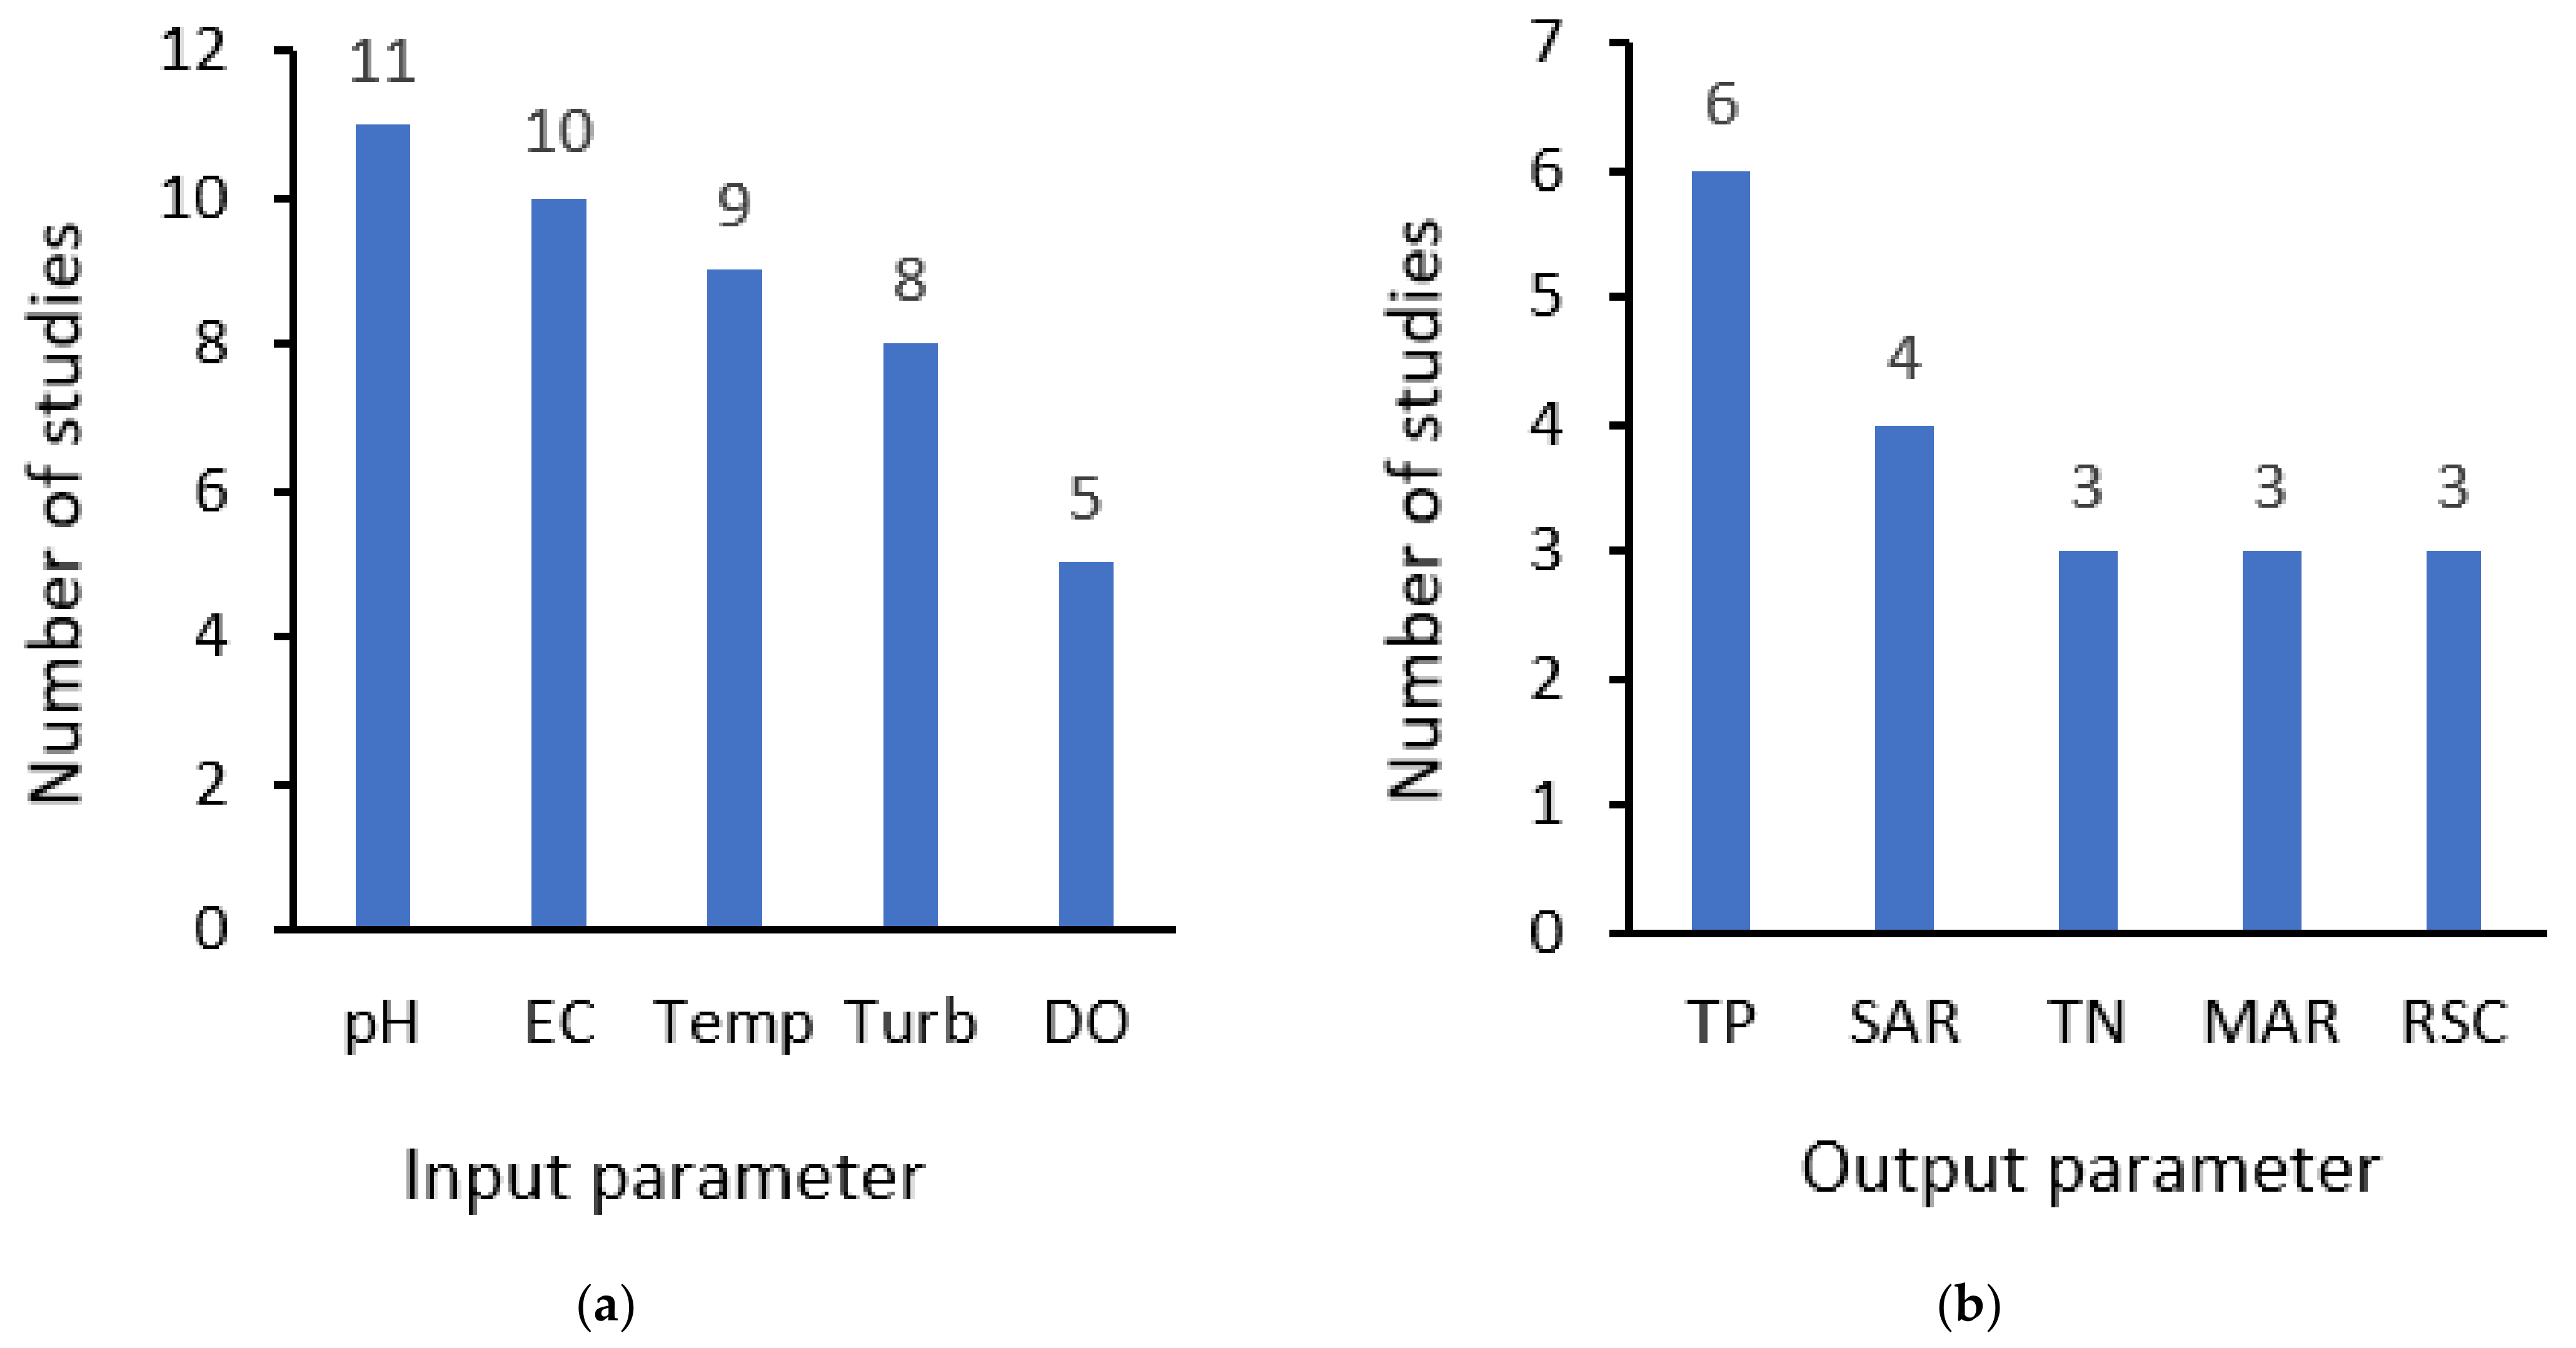
3.4.2. Water Quality Parameters Modeled
- (i)
- TP concentrations change very rapidly with discharge, and the traditional grab sampling method is usually insufficient to capture the variabilities of TP concentration patterns [101];
- (ii)
- Despite the interest in measuring TP, the sensor technology for continuous measurement of TP concentrations surface waters has not been developed yet [101];
- (iii)
- TP is one of the nutrients whose presence in excessive amounts in water bodies leads to eutrophication; a condition that has caused a series of WQ problems for freshwater and marine ecosystems around the world [113].
3.4.3. Data Collection Time Scale and Sampling Frequency
Data Collection Time Scale
Sampling Frequency
3.4.4. Data Pre-Processing
3.5. An Update of the Measurement Cost Estimate
4. A Specification Book
4.1. Parameters That Must Be Measured (or Observed) Continuously
4.2. Specifications for Input and Output Parameters
4.2.1. The Respective (or Recommended) Accuracy Tolerance Ranges for Predictors
4.2.2. The Recommended Accuracy Tolerance Ranges for Predicted Parameters
4.2.3. The Realistic Measurement Frequency
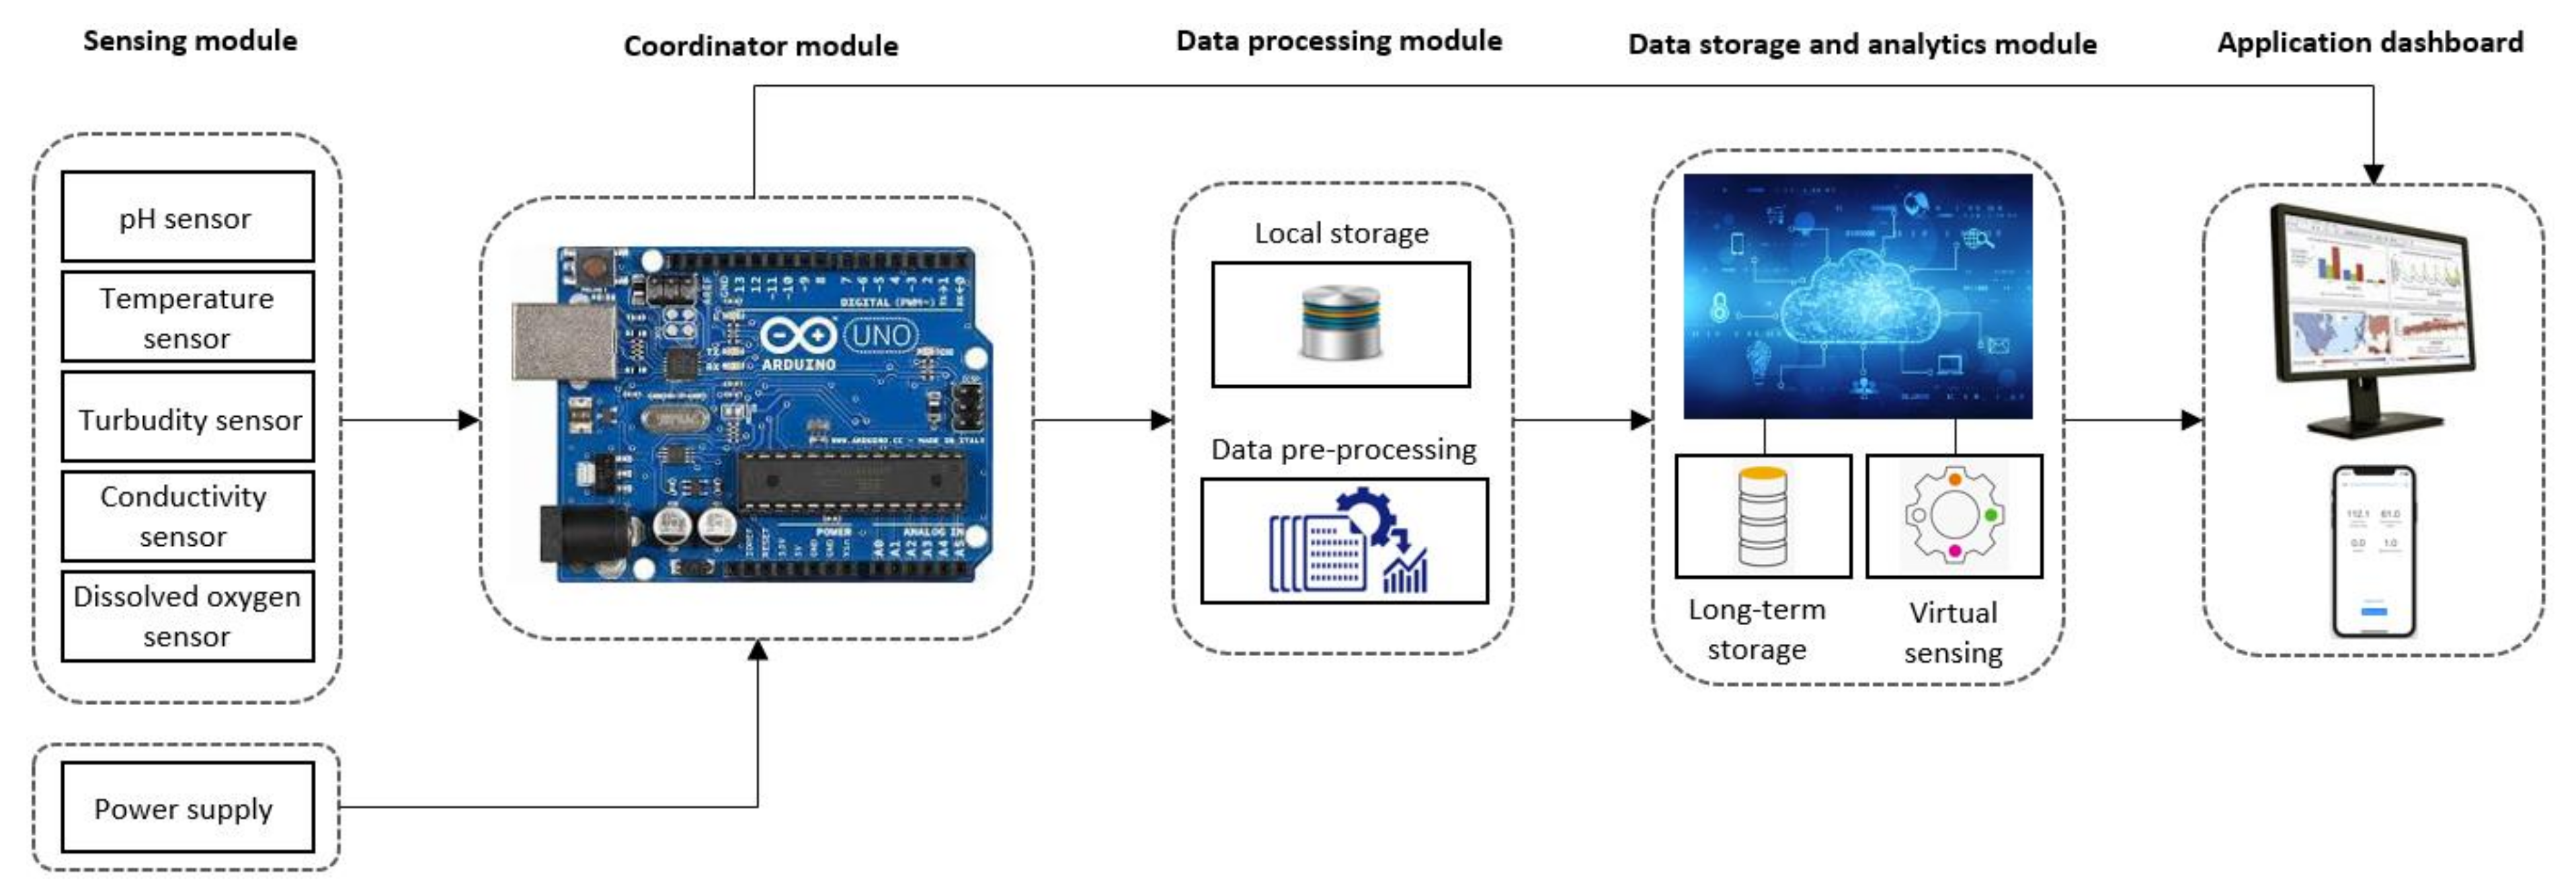
4.3. The Global System Architecture of Virtual Sensor Monitoring in an IoT Environment
4.3.1. Sensing Module
4.3.2. Coordinator Module
4.3.3. Data Processing Module
4.3.4. Data Storage and Analytics Module
4.3.5. Application Dashboard
4.4. The Updated Cost Model: The Global System Architecture Included
5. Recent Advances in Machine Learning Concepts
- (i)
- Labelled data scarcity;
- (ii)
- Data quality (outliers, missing values, measurement noise, etc.);
- (iii)
- Unsupervised feature exploitation;
- (iv)
- Computational complexity reduction;
- (v)
- Virtual sensor maintenance.
- (i)
- Improves the representation ability;
- (ii)
- Is efficient in handling massive data;
- (iii)
- Enables the extraction of nonlinear latent variables;
- (iv)
- Offers the possibility of utilizing unlabeled data.
- (i)
- Complexity of the predictive method;
- (ii)
- Analysis time of input parameters;
- (iii)
- Reliability of the measured data.
5.1. Auto-Encoders (AEs)
5.2. Deep Belief Networks (DBNs)
- (i)
- Labelled data scarcity and the unsupervised feature exploitation: the DBN’s unsupervised learning phase, followed by a supervised fine-tuning (or semi-supervised learning capability), provides a valuable solution to the labelled data scarcity problem. Additionally, the features extracted during the learning stage can be used for inferring information on the model structure [133];
- (ii)
- Model complexity reducing: a DBN is characterized by the utilization of multiple layers of representation which enables the approximation of more complex functions with the reduced number of parameters [133]. This facilitates the model complexity reduction, particularly in terms of the number of model parameters (weights and biases) and the model order.
5.3. Convolutional Neural Networks (CNNs)
5.4. Echo State Networks (ESNs)
5.5. Generative Adversarial Networks (GANs)
6. Conclusions
Author Contributions
Funding
Institutional Review Board Statement
Informed Consent Statement
Conflicts of Interest
References
- Ahmed, U.; Mumtaz, R.; Anwar, H.; Shah, A.A.; Irfan, R. Efficient Water Quality Prediction Using Supervised. Water 2019, 11, 2210. [Google Scholar] [CrossRef] [Green Version]
- Jia, Y.; Zheng, F.; Maier, H.R.; Ostfeld, A.; Creaco, E.; Savic, D.; Langeveld, J.; Kapelan, Z. Water quality modeling in sewer networks: Review and future research directions. Water Res. 2021, 202, 117419. [Google Scholar] [CrossRef] [PubMed]
- Pule, M.; Yahya, A.; Chuma, J. Wireless sensor networks: A survey on monitoring water quality. J. Appl. Res. Technol. 2017, 15, 562–570. [Google Scholar] [CrossRef]
- Department of Water Affairs and Forestry. Volume 1: Domestic Use. In South African Water Quality Guidelines, 2nd ed.; Department of Water Affairs and Forestry: Pretoria, South Africa, 1996. [Google Scholar]
- Adu-Manu, K.S.; Tapparello, C.; Heinzelman, W.; Katsriku, F.A.; Abdulai, J.D. Water quality monitoring using wireless sensor networks: Current trends and future research directions. ACM Trans. Sens. Netw. 2017, 13, 1–41. [Google Scholar] [CrossRef] [Green Version]
- Behmel, S.; Damour, M.; Ludwig, R.; Rodriguez, M.J. Water quality monitoring strategies—A review and future perspectives. Sci. Total Environ. 2016, 571, 1312–1329. [Google Scholar] [CrossRef] [PubMed]
- Chapman, D. Water Quality Assessments—A Guide to Use of Biota, Sediments and Water in Environmental Monitoring, 2nd ed.; CRC Press: London, UK, 1996; ISBN 0419216006. [Google Scholar]
- Rahman, Z.; Crocker, J.; Chang, K.; Khush, R.; Bartram, J. A comparative assessment of institutional frameworks for managing drinking water quality. J. Water Sanit. Hyg. Dev. 2011, 1, 242–258. [Google Scholar] [CrossRef]
- Zhuiykov, S. Solid-state sensors monitoring parameters of water quality for the next generation of wireless sensor networks. Sens. Actuators B Chem. 2012, 161, 1–20. [Google Scholar] [CrossRef]
- Gholizadeh, M.H.; Melesse, A.M.; Reddi, L. A comprehensive review on water quality parameters estimation using remote sensing techniques. Sensors 2016, 16, 1298. [Google Scholar] [CrossRef] [Green Version]
- Murphy, K.; Heery, B.; Sullivan, T.; Zhang, D.; Paludetti, L.; Lau, K.T.; Diamond, D.; Costa, E.; O’Connor, N.; Regan, F. A low-cost autonomous optical sensor for water quality monitoring. Talanta 2015, 132, 520–527. [Google Scholar] [CrossRef]
- Yaroshenko, I.; Kirsanov, D.; Marjanovic, M.; Lieberzeit, P.A.; Korostynska, O.; Mason, A.; Frau, I.; Legin, A. Real-time water quality monitoring with chemical sensors. Sensors 2020, 20, 3432. [Google Scholar] [CrossRef]
- McGrath, M.; Scanaill, C.N.; Nafus, D. Sensor Technologies: Healthcare, Wellness, and Environmental Applications; Springer Nature: Berlin/Heidelberg, Germany, 2013. [Google Scholar]
- Chen, Y.; Song, L.; Liu, Y.; Yang, L.; Li, D. A review of the artificial neural network models for water quality prediction. Appl. Sci. 2020, 10, 5776. [Google Scholar] [CrossRef]
- Ahmed, U.; Mumtaz, R.; Anwar, H.; Mumtaz, S.; Qamar, A.M. Water quality monitoring: From conventional to emerging technologies. Water Sci. Technol. Water Supply 2020, 20, 28–45. [Google Scholar] [CrossRef]
- Jan, F.; Min-Allah, N.; Düştegör, D. Iot based smart water quality monitoring: Recent techniques, trends and challenges for domestic applications. Water 2021, 13, 1729. [Google Scholar] [CrossRef]
- Manrique, J.A.; Rueda-Rueda, J.S.; Portocarrero, J.M.T. Contrasting Internet of Things and Wireless Sensor Network from a Conceptual Overview. In Proceedings of the 2016 IEEE International Conference on Internet of Things (iThings) and IEEE Green Computing and Communications (GreenCom) and IEEE Cyber, Physical and Social Computing (CPSCom) and IEEE Smart Data (SmartData), Chengdu, China, 15–18 December 2016; pp. 252–257. [Google Scholar] [CrossRef]
- Almetwally, S.A.H.; Hassan, M.K.; Mourad, M.H. Real Time Internet of Things (IoT) Based Water Quality Management System. Procedia CIRP 2020, 91, 478–485. [Google Scholar] [CrossRef]
- Patil, H.K.; Chen, T.M. Wireless Sensor Network Security. In Computer and Information Security Handbook; Morgan Kaufmann: Burlington, MA, USA, 2017; pp. 317–337. [Google Scholar]
- Foschi, J.; Turolla, A.; Antonelli, M. Soft sensor predictor of E. coli concentration based on conventional monitoring parameters for wastewater disinfection control. Water Res. 2021, 191, 116806. [Google Scholar] [CrossRef]
- Huang, M.; Ma, Y.; Wan, J.; Chen, X. A sensor-software based on a genetic algorithm-based neural fuzzy system for modeling and simulating a wastewater treatment process. Appl. Soft Comput. J. 2015, 27, 1–10. [Google Scholar] [CrossRef]
- Pattanayak, A.S.; Pattnaik, B.S.; Udgata, S.K.; Panda, A.K. Development of Chemical Oxygen on Demand (COD) Soft Sensor Using Edge Intelligence. IEEE Sens. J. 2020, 20, 14892–14902. [Google Scholar] [CrossRef]
- Li, Y.; Pandis, I.; Guo, Y. Enabling Virtual Sensing as a Service. Informatics 2016, 3, 3. [Google Scholar] [CrossRef] [Green Version]
- Vallejo, M.; De La Espriella, C.; Gómez-Santamaría, J.; Ramírez-Barrera, A.F.; Delgado-Trejos, E. Soft metrology based on machine learning: A review. Meas. Sci. Technol. 2019, 31, 032001. [Google Scholar] [CrossRef]
- Kadlec, P.; Gabrys, B.; Strandt, S. Data-driven Soft Sensors in the process industry. Comput. Chem. Eng. 2009, 33, 795–814. [Google Scholar] [CrossRef] [Green Version]
- Sun, Q.; Ge, Z. A Survey on Deep Learning for Data-Driven Soft Sensors. IEEE Trans. Ind. Inform. 2021, 17, 5853–5866. [Google Scholar] [CrossRef]
- Yan, W.; Xu, R.; Wang, K.; Di, T.; Jiang, Z. Soft Sensor Modeling Method Based on Semisupervised Deep Learning and Its Application to Wastewater Treatment Plant. Ind. Eng. Chem. Res. 2020, 59, 4589–4601. [Google Scholar] [CrossRef]
- Li, H.; Yu, D.; Braun, J.E. A review of virtual sensing technology and application in building systems. HVAC R Res. 2011, 17, 619–645. [Google Scholar] [CrossRef]
- Pattnaik, B.S.; Pattanayak, A.S.; Udgata, S.K.; Panda, A.K. Machine learning based soft sensor model for BOD estimation using intelligence at edge. Complex Intell. Syst. 2021, 7, 961–976. [Google Scholar] [CrossRef]
- Haimi, H.; Mulas, M.; Corona, F.; Vahala, R. Data-derived soft-sensors for biological wastewater treatment plants: An overview. Environ. Model. Softw. 2013, 47, 88–107. [Google Scholar] [CrossRef]
- Wang, G.; Jia, Q.-S.; Zhou, M.; Bi, J.; Qiao, J.; Abusorrah, A. Artificial neural networks for water quality soft-sensing in wastewater treatment: A review. Artif. Intell. Rev. 2021. [Google Scholar] [CrossRef]
- Ayers, R.S.; Westcot, D.W. Water Quality for Agriculture; Food and Agriculture Organization of the United Nations: Rome, Italy, 1985; Volume 29, ISBN 9251022631. [Google Scholar]
- Davis, R. 5. Water Quality. Feedlot Design and Construction; Meat & Livestock Australia Ltd.: North Sydney, Australia, 2016. [Google Scholar]
- Chen, C.Y.; Wang, S.W.; Kim, H.; Pan, S.Y.; Fan, C.; Lin, Y.J. Non-conventional water reuse in agriculture: A circular water economy. Water Res. 2021, 199, 117193. [Google Scholar] [CrossRef]
- Van Veelen, M.; Gilfillan, T.C.; Harris, J. Conceptual Design Report for a National River Water Quality Assessment Programme; Water Research Commission: Pretoria, South Africa, 1992. [Google Scholar]
- Quinlivan, L.; Chapman, D.V.; Sullivan, T. Validating citizen science monitoring of ambient water quality for the United Nations sustainable development goals. Sci. Total Environ. 2020, 699, 134255. [Google Scholar] [CrossRef]
- Zaman, M.; Shahid, S.A.; Heng, L. Guideline for Salinity Assessment, Mitigation and Adaptation Using Nuclear and Related Techniques; Springer Nature: Berlin/Heidelberg, Germany, 2018; ISBN 9783319961897. [Google Scholar]
- Elsayed, S.; Hussein, H.; Moghanm, F.S.; Khedher, K.M.; Eid, E.M.; Gad, M. Application of irrigation water quality indices and multivariate statistical techniques for surface water quality assessments in the northern nile delta, egypt. Water 2020, 12, 3300. [Google Scholar] [CrossRef]
- Fipps, G. Irrigation Water Quality Standards and Salinity Management Strategies. Texas FARMER Collection; AgriLife Extension-Texas A&M University: College Station, TX, USA, 2003. [Google Scholar]
- Department of Water Affairs and Forestry. Volume 4: Agricultural Use: Irrigation. In South African Water Quality Guidelines, 2nd ed.; Department of Water Affairs and Forestry: Pretoria, South Africa, 1996. [Google Scholar]
- Konz, W. Integrated Total Analysis Systems. Compr. Sampl. Sample Prep. 2012, 1, 99–107. [Google Scholar] [CrossRef]
- Madrid, Y.; Zayas, Z.P. Water sampling : Traditional methods and new approaches in water sampling strategy. Trends Anal. Chem. 2007, 26, 293–299. [Google Scholar] [CrossRef]
- Federation, W.E.; Association, A.P.H. Standard Methods for the Examination of Water and Wastewater; American Public Health Association (APHA): Washington, DC, USA, 2005; ISBN 9780123821652. [Google Scholar]
- Wilde, F.D. Guidelines for Field-Measured 6.0 Water-Quality Properties. 2008; Volume 2, pp. 1–29. Available online: https://pubs.usgs.gov/twri/twri9a6/twri9a6_Chapter6.0v2.pdf (accessed on 1 August 2021).
- Monteiro, M.; Costa, M. A time series model comparison for monitoring and forecasting water quality variables. Hydrology 2018, 5, 37. [Google Scholar] [CrossRef] [Green Version]
- Bartram, J.; Ballance, R. (Eds.) Water Quality Monitoring: A Practical Guide to the Design and Implementation of Freshwater Quality Studies and Monitoring Programmes; CRC Press: Boca Raton, FL, USA, 1996. [Google Scholar]
- Hassan, H.H.; Badr, I.H.A.; Abdel-fatah, H.T.M.; Elfeky, E.M.S.; Abdel-aziz, A.M. Low cost chemical oxygen demand sensor based on electrodeposited nano-copper film. Arab. J. Chem. 2018, 11, 171–180. [Google Scholar] [CrossRef] [Green Version]
- Cerda, V.; Tappin, A. Flow analysis techniques for phosphorus: An overview Flow analysis techniques for phosphorus: An overview. Talanta 2005, 66, 307–331. [Google Scholar] [CrossRef]
- Tabatabai, M.A. A Rapid Method for Determination of Sulfate in Water Samples. Environ. Lett. 1974, 7, 237–243. [Google Scholar] [CrossRef]
- Nuttall, K.L.; Gordon, W.H.; Ash, K.O. Inductively coupled plasma mass spectrometry for trace element analysis in the clinical laboratory. Ann. Clin. Lab. Sci. 1995, 25, 264–271. [Google Scholar]
- Banerjee, P.; Prasad, B. Determination of concentration of total sodium and potassium in surface and ground water using a flame photometer. Appl. Water Sci. 2020, 10, 1–7. [Google Scholar] [CrossRef]
- Oster, J.D.; Sposito, G.; Smith, C.J. Accounting for potassium and magnesium in irrigation water quality assessment. Calif. Agric. 2016, 70, 71–76. [Google Scholar] [CrossRef] [Green Version]
- Edition, F. Guidelines for Drinking-Water Quality; WHO Chronicle; WHO: Geneva, Switzerland, 2011; Volume 38, ISBN 9789241547611. [Google Scholar]
- Ewaid, S.H.; Kadhum, S.A.; Abed, S.A.; Salih, R.M. Development and evaluation of irrigation water quality guide using IWQG V.1 software: A case study of Al-Gharraf Canal, Southern Iraq. Environ. Technol. Innov. 2019, 13, 224–232. [Google Scholar] [CrossRef]
- El Bilali, A.; Taleb, A.; Brouziyne, Y. Groundwater quality forecasting using machine learning algorithms for irrigation purposes. Agric. Water Manag. 2021, 245, 106625. [Google Scholar] [CrossRef]
- Ogunfowokan, A.O.; Obisanya, J.F.; Ogunkoya, O.O. Salinity and sodium hazards of three streams of different agricultural land use systems in Ile-Ife, Nigeria. Appl. Water Sci. 2013, 3, 19–28. [Google Scholar] [CrossRef]
- Tefera, A.K.; Wassie, A.B.; Sinshaw, B.G.; Defersha, D.T.; Takele, T.A.; Atanaw, S.B.; Tesfaye, A.T.; Getu, E.; Fenta, H.M.; Atinkut, H.B.; et al. Groundwater quality evaluation of the alluvial aquifers using GIS and water quality indices in the Upper Blue Nile Basin, Ethiopia. Groundw. Sustain. Dev. 2021, 14, 100636. [Google Scholar] [CrossRef]
- Jeong, H.; Kim, H.; Jang, T. Irrigation water quality standards for indirect wastewater reuse in agriculture: A contribution toward sustainablewastewater reuse in South Korea. Water 2016, 8, 169. [Google Scholar] [CrossRef] [Green Version]
- Board, Oregon Watershed Enhancement. The Oregon Plan for Salmon and Watersheds Water Quality Monitoring Technical Guide Book; Oregon Watershed Enhancement Board: Salem, OR, USA, 1999; Available online: http://docs.streamnetlibrary.org/Protocols/021.pdf (accessed on 1 August 2021).
- Williams, R.; Kilaru, V.J.; Snyder, E.G.; Kaufman, A.; Dye, T.; Rutter, A.; Russell, A.; Hafner, H. Air Sensor Guidebook; US Environmental Protection Agency: Washington, DC, USA, 2014. [Google Scholar]
- Meyer, A.M.; Klein, C.; Fünfrocken, E.; Kautenburger, R.; Beck, H.P. Real-time monitoring of water quality to identify pollution pathways in small and middle scale rivers. Sci. Total Environ. 2019, 651, 2323–2333. [Google Scholar] [CrossRef]
- Wagner, R.; Mattraw, H.; Ritz, G.; Smith, B. Guidelines and Standard Procedures for Continuous Water-Quality Monitors: Site Selection, Field Operation, Calibration, Record Computation, and Reporting; US Department of the Interior, US Geological Survey: Washington, DC, USA, 2006. [Google Scholar]
- Higgins, P. YSI Professional Plus Water Quality Meter Specifications W14-04. Available online: https://www.xylem.com/en-za/products-services/analytical-instruments-and-equipment/monitoring-sampling-instruments-sensors-equipment/handheld-meters-instruments/professional-plus-pro-plus-multiparameter-instrument-b582f050/ (accessed on 24 July 2021).
- Aquaread Aquaprobe Specifications. Available online: www.aquaread.com (accessed on 24 July 2021).
- BOQU Water Quality Analyzer, Water Quality Sensor Manufacturer|BOQU. Available online: https://www.boquinstrument.com/ (accessed on 24 July 2021).
- Xylem Xylem Analytics|Water Quality Monitoring. Available online: https://www.xylemanalytics.com/en/products/water-quality-monitoring (accessed on 3 August 2021).
- Winmore Online Water Quality Sensor—WINMORE. Available online: https://www.winmoreltd.com/online-water-quality-sensor/ (accessed on 3 August 2021).
- Rahman, Z.; Khush, R.; Gundry, S. Aquatest: Expanding Microbial Water Quality Testing for Drinking Water Management. Drink. Water Saf. Int. 2010, 1, 15–17. [Google Scholar]
- Stauber, C.; Miller, C.; Cantrell, B.; Kroell, K. Evaluation of the compartment bag test for the detection of Escherichia coli in water. J. Microbiol. Methods 2014, 99, 66–70. [Google Scholar] [CrossRef]
- Delaire, C.; Peletz, R.; Kumpel, E.; Kisiangani, J.; Bain, R.; Khush, R. How Much Will It Cost to Monitor Microbial Drinking Water Quality in Sub-Saharan Africa? Environ. Sci. Technol. 2017, 51, 5869–5878. [Google Scholar] [CrossRef] [Green Version]
- Bain, R.; Bartram, J.; Elliott, M.; Matthews, R.; Mcmahan, L.; Tung, R.; Chuang, P.; Gundry, S. A summary catalogue of microbial drinking water tests for low and medium resource settings. Int. J. Environ. Res. Public Health 2012, 9, 1609–1625. [Google Scholar] [CrossRef]
- Crocker, J.; Bartram, J. Comparison and cost analysis of drinking water quality monitoring requirements versus practice in seven developing countries. Int. J. Environ. Res. Public Health 2014, 11, 7333–7346. [Google Scholar] [CrossRef]
- World Meteorological Organization; GEMS/Water, U. Planning of Water Quality Monitoring Systems: Technical Report No.3; CH-1211; World Meteorological Organization: Geneva, Switzerland, 2013. [Google Scholar]
- Nong, X.; Shao, D.; Zhong, H.; Liang, J. Evaluation of water quality in the South-to-North Water Diversion Project of China using the water quality index (WQI) method. Water Res. 2020, 178, 115781. [Google Scholar] [CrossRef]
- Martin, D.; Kü, N.; Satzger, G. Virtual Sensors. Bus. Inf. Syst. Eng. 2021, 63, 315–323. [Google Scholar] [CrossRef]
- Crean, C.; Mcgeough, C.; O’Kennedy, R. Wearable biosensors for medical applications. In Biosensors for Medical Applications; Séamus, H., Ed.; Woodhead Publishing: Sawston, UK, 2012; pp. 301–330. [Google Scholar]
- Bangert, P. Machine Learning and Data Science in the Oil and Gas Industry: Best Practices, Tools, and Case Studies; Bangert, P., Ed.; Gulf Professional Publishing: Oxford, UK, 2021. [Google Scholar]
- Kabadayi, S.; Pridgen, A.; Julien, C. Virtual sensors: Abstracting data from physical sensors. In Proceedings of the 2006 International Symposium on a World of Wireless, Mobile and Multimedia Networks(WoWMoM’06), Buffalo-Niagara Falls, NY, USA, 26–29 June 2006; pp. 587–592. [Google Scholar] [CrossRef] [Green Version]
- Dementjev, A.; Hensel, B.; Kabitzsch, K.; Kauschinger, B.; Schroeder, S. Virtual Sensor for Calibration of Thermal Models of Machine Tools. Adv. Artif. Neural Syst. 2014, 2014, 1–10. [Google Scholar] [CrossRef] [Green Version]
- Albertos, P.; Goodwin, G.C. Virtual sensors for control applications. Annu. Rev. Control 2002, 26, 101–112. [Google Scholar] [CrossRef]
- Souza, F.A.A.; Araújo, R.; Mendes, J. Review of soft sensor methods for regression applications. Chemom. Intell. Lab. Syst. 2016, 152, 69–79. [Google Scholar] [CrossRef]
- Wilderer, P.A. Treatise on Water Science; Elsevier Science: Amsterdam, The Netherlands; Hackensack, NJ, USA.
- Wang, X.; Kvaal, K.; Ratnaweera, H. Explicit and interpretable nonlinear soft sensor models for influent surveillance at a full-scale wastewater treatment plant. J. Process Control 2019, 77, 1–6. [Google Scholar] [CrossRef]
- Zhao, F.; Liu, M.; Wang, K.; Wang, T.; Jiang, X. A soft measurement approach of wastewater treatment process by lion swarm optimizer-based extreme learning machine. Meas. J. Int. Meas. Confed. 2021, 179, 109322. [Google Scholar] [CrossRef]
- Castrillo, M.; García, Á.L. Estimation of high frequency nutrient concentrations from water quality surrogates using machine learning methods. Water Res. 2020, 172, 115490. [Google Scholar] [CrossRef] [PubMed] [Green Version]
- Zhu, S.; Han, H.; Guo, M.; Qiao, J. A data-derived soft-sensor method for monitoring effluent total phosphorus. Chin. J. Chem. Eng. 2017, 25, 1791–1797. [Google Scholar] [CrossRef]
- Thorslund, J.; van Michelle, T.V. A global dataset of surface water and groundwater salinity measurements from 1980–2019. Sci. Data 2020, 7, 1–11. [Google Scholar] [CrossRef] [PubMed]
- Rajaee, T.; Khani, S.; Ravansalar, M. Artificial intelligence-based single and hybrid models for prediction of water quality in rivers: A review. Chemom. Intell. Lab. Syst. 2020, 200, 103978. [Google Scholar] [CrossRef]
- Han, J.; Pei, J.; Kamber, M. Data Mining: Concepts and Techniques; Elsevier: Amsterdam, The Netherlands, 2011. [Google Scholar]
- Müller, A.C.; Guido, S. Introduction to Machine Learning with Python: A Guide for Data Scientists; O’Reilly Media, Inc.: Beijing, China; Boston, MA, USA; Farnham, UK; Sebastopol, CA, USA; Tokyo, Japan, 2016. [Google Scholar]
- Brunello, A.; Urgolo, A.; Pittino, F.; Montvay, A.; Montanari, A. Virtual sensing and sensors selection for efficient temperature monitoring in indoor environments†. Sensors 2021, 21, 2728. [Google Scholar] [CrossRef]
- Loucks, D.P.; Van Beek, E. Water Resource Systems Planning and Management: An Introduction to Methods, Models, and Applications; Springer: Berlin/Heidelberg, Germany, 2017; Volume 4, ISBN 9783319442327. [Google Scholar]
- Brouwer, C.; Hoevenaars, J.P.M.; Van Bosch, B.E.; Hatcho, N.; Heibloem, M. Irrigation Water Management: Training Manual No. 6: Scheme Irrigation Water Needs and Supply; FAO: Rome, Italy, 1992. [Google Scholar]
- Harrison, J.W.; Lucius, M.A.; Farrell, J.L.; Eichler, L.W.; Relyea, R.A. Prediction of stream nitrogen and phosphorus concentrations from high-frequency sensors using Random Forests Regression. Sci. Total Environ. 2021, 763, 143005. [Google Scholar] [CrossRef]
- El Bilali, A.; Taleb, A. Prediction of irrigation water quality parameters using machine learning models in a semi-arid environment. J. Saudi Soc. Agric. Sci. 2020, 19, 439–451. [Google Scholar] [CrossRef]
- Ha, N.T.; Nguyen, H.Q.; Truong, N.C.Q.; Le, T.L.; Thai, V.N.; Pham, T.L. Estimation of nitrogen and phosphorus concentrations from water quality surrogates using machine learning in the Tri An Reservoir, Vietnam. Environ. Monit. Assess. 2020, 192, 1–20. [Google Scholar] [CrossRef]
- Hawro, P.; Kwater, T.; Pȩkala, R.; Twaróg, B. Soft sensor with adaptive algorithm for filter gain correction in the online monitoring system of a polluted river. Appl. Sci. 2019, 9, 1883. [Google Scholar] [CrossRef] [Green Version]
- Gao, Q.; Xu, H.X.; Han, H.G.; Guo, M. Soft-sensor method for surface water qualities based on fuzzy neural network. In Proceedings of the 2019 Chinese Control Conference (CCC), Guangzhou, China, 27–30 July 2019; pp. 6877–6881. [Google Scholar] [CrossRef]
- Sepahvand, A.; Singh, B.; Sihag, P.; Nazari Samani, A.; Ahmadi, H.; Fiz Nia, S. Assessment of the various soft computing techniques to predict sodium absorption ratio (SAR). ISH J. Hydraul. Eng. 2019, 1–12. [Google Scholar] [CrossRef]
- Wang, X.; Jia, J.; Su, T.; Zhao, Z.; Xu, J.; Wang, L. A fusion water quality soft-sensing method based on wasp model and its application in water eutrophication evaluation. J. Chem. 2018, 2018, 9616841. [Google Scholar] [CrossRef] [Green Version]
- Schilling, K.E.; Kim, S.; Jones, C.S. Use of water quality surrogates to estimate total phosphorus concentrations in Iowa rivers. J. Hydrol. Reg. Stud. 2017, 12, 111–121. [Google Scholar] [CrossRef]
- Wagh, V.M.; Panaskar, D.B.; Muley, A.A.; Mukate, S.V.; Lolage, Y.P.; Aamalawar, M.L. Prediction of groundwater suitability for irrigation using artificial neural network model: A case study of Nanded tehsil, Maharashtra, India. Model. Earth Syst. Environ. 2016, 2, 1–10. [Google Scholar] [CrossRef]
- Wang, Z.; Zhao, Z.; Li, D.; Cui, L. Data-driven soft sensor modeling for algal blooms monitoring. IEEE Sens. J. 2015, 15, 579–590. [Google Scholar] [CrossRef]
- Viviano, G.; Salerno, F.; Manfredi, E.C.; Polesello, S.; Valsecchi, S.; Tartari, G. Surrogate measures for providing high frequency estimates of total phosphorus concentrations in urban watersheds. Water Res. 2014, 64, 265–277. [Google Scholar] [CrossRef]
- Spackman Jones, A.; Stevens, D.K.; Horsburgh, J.S.; Mesner, N.O.; Jones, S. Surrogate Measures for Providing High Frequency Estimates of Total Suspended Solids and Total Phosphorus Concentrations1. J. Am. Water Resour. Assoc. 2011, 47, 239–253. [Google Scholar] [CrossRef] [Green Version]
- Tiyasha; Tung, T.M.; Yaseen, Z.M. A survey on river water quality modelling using artificial intelligence models: 2000–2020. J. Hydrol. 2020, 585, 124670. [Google Scholar] [CrossRef]
- Ighalo, J.O.; Adeniyi, A.G.; Marques, G. Artificial intelligence for surface water quality monitoring and assessment: A systematic literature analysis. Model. Earth Syst. Environ. 2021, 7, 669–681. [Google Scholar] [CrossRef]
- Alsulaili, A.; Refaie, A. Artificial neural network modeling approach for the prediction of five-day biological oxygen demand and wastewater treatment plant performance. Water Supply 2021, 21, 1861–1877. [Google Scholar] [CrossRef]
- Li, L.; Rong, S.; Wang, R.; Yu, S. Recent advances in artificial intelligence and machine learning for nonlinear relationship analysis and process control in drinking water treatment: A review. Chem. Eng. J. 2021, 405, 126673. [Google Scholar] [CrossRef]
- Tyralis, H.; Papacharalampous, G.; Langousis, A. A brief review of random forests for water scientists and practitioners and their recent history in water resources. Water 2019, 11, 910. [Google Scholar] [CrossRef] [Green Version]
- Grayson, R.B.; Finlayson, B.L.; Gippel, C.J.; Hart, B.T. The potential of field turbidity measurements for the computation of total phosphorus and suspended solids loads. J. Environ. Manag. 1996, 47, 257–267. [Google Scholar] [CrossRef]
- Ardabili, S.; Mosavi, A.; Várkonyi-Kóczy, A.R. Advances in Machine Learning Modeling Reviewing Hybrid and Ensemble Methods. Lect. Notes Netw. Syst. 2020, 101, 215–227. [Google Scholar] [CrossRef]
- Liu, X.; Zhang, G.; Sun, G.; Wu, Y.; Chen, Y. Assessment of Lake water quality and eutrophication risk in an agricultural irrigation area: A case study of the Chagan Lake in Northeast China. Water 2019, 11, 2380. [Google Scholar] [CrossRef] [Green Version]
- Mudaly, L.; van der Laan, M. Interactions between irrigated agriculture and surfacewater quality with a focus on phosphate and nitrate in the middle olifants catchment, South Africa. Sustainbility 2020, 12, 4370. [Google Scholar] [CrossRef]
- Tanvir Rahman, M.A.T.M.; Saadat, A.H.M.; Islam, M.S.; Al-Mansur, M.A.; Ahmed, S. Groundwater characterization and selection of suitable water type for irrigation in the western region of Bangladesh. Appl. Water Sci. 2017, 7, 233–243. [Google Scholar] [CrossRef] [Green Version]
- Asrey, R.; Kumar, S.; Meena, N.K. Influence of Water Quality on Postharvest Fruit and Vegetable Quality; Elsevier Inc.: Amsterdam, The Netherlands, 2018; ISBN 9780128098080. [Google Scholar]
- Dawson, C.W.; Wilby, R.L. Hydrological modelling using artificial neural networks. Prog. Phys. Geogr. 2001, 25, 80–108. [Google Scholar] [CrossRef]
- United Nations Economic Commission. Strategies for Monitoring and Assessment of Transboundary Rivers, Lakes and Groundwaters; United Nations Economic Commission: Geneve, Switzerland, 2006. [Google Scholar]
- Rodriguez-Galiano, V.; Mendes, M.P.; Garcia-Soldado, M.J.; Chica-Olmo, M.; Ribeiro, L. Predictive modeling of groundwater nitrate pollution using Random Forest and multisource variables related to intrinsic and specific vulnerability: A case study in an agricultural setting (Southern Spain). Sci. Total Environ. 2014, 476–477, 189–206. [Google Scholar] [CrossRef]
- Fernandez de Canete, J.; Del Saz-Orozco, P.; Baratti, R.; Mulas, M.; Ruano, A.; Garcia-Cerezo, A. Soft-sensing estimation of plant effluent concentrations in a biological wastewater treatment plant using an optimal neural network. Expert Syst. Appl. 2016, 63, 8–19. [Google Scholar] [CrossRef]
- US EPA Chapter 5 Water Quality Conditions. Available online: https://archive.epa.gov/water/archive/web/html/vms50.html (accessed on 4 September 2021).
- European Environment Agency. 2. Surface Water Quality Monitoring. Available online: https://www.eea.europa.eu/publications/92-9167-001-4/page003.html (accessed on 4 September 2021).
- Yuan, X.; Huang, B.; Wang, Y.; Yang, C.; Gui, W. Deep Learning-Based Feature Representation and Its Application for Soft Sensor Modeling with Variable-Wise Weighted SAE. IEEE Trans. Ind. Inform. 2018, 14, 3235–3243. [Google Scholar] [CrossRef]
- Millán, S.; Casadesús, J.; Campillo, C.; Moñino, M.J.; Prieto, M.H. Using soil moisture sensors for automated irrigation scheduling in a plum crop. Water 2019, 11, 2061. [Google Scholar] [CrossRef] [Green Version]
- Adeyemi, O.; Grove, I.; Peets, S.; Norton, T. Advanced monitoring and management systems for improving sustainability in precision irrigation. Sustainbility 2017, 9, 353. [Google Scholar] [CrossRef] [Green Version]
- Soulis, K.X.; Elmaloglou, S.; Dercas, N. Investigating the effects of soil moisture sensors positioning and accuracy on soil moisture based drip irrigation scheduling systems. Agric. Water Manag. 2015, 148, 258–268. [Google Scholar] [CrossRef]
- Kaneko, H.; Funatsu, K. Estimation of Predictive Accuracy of Soft Sensor Models Based on One-Class Support Vector Machine. Comput. Aided Chem. Eng. 2012, 31, 1246–1250. [Google Scholar] [CrossRef]
- Ishikawa, N.; Kim, S.; Kano, M.; Hasebe, S. Root cause analysis of estimation error of a soft-sensor. Comput. Aided Chem. Eng. 2018, 44, 2257–2262. [Google Scholar] [CrossRef]
- Hopkins, B.G.; Horneck, D.A.; Stevens, R.G.; Ellsworth, J.W.; Sullivan, D.M. Managing Irrigation Water Quality for Crop Production in the Pacific Northwest; Oregon State University Extension Service: Corvallis, OR, USA; Washington State University Extension: Pullman, WA, USA; University of Idaho Cooperative Extension System: Moscow, ID, USA; U.S. Dept. of Agriculture: Washington, DC, USA, 2007. [Google Scholar]
- Abba, S.; Namkusong, J.W.; Lee, J.A.; Crespo, M.L. Design and performance evaluation of a low-cost autonomous sensor interface for a smart iot-based irrigation monitoring and control system. Sensors 2019, 19, 3643. [Google Scholar] [CrossRef] [Green Version]
- Shafi, U.; Mumtaz, R.; Anwar, H.; Qamar, A.M.; Khurshid, H. Surface Water Pollution Detection using Internet of Things. In Proceedings of the 2018 15th International Conference on Smart Cities: Improving Quality of Life Using ICT & IoT (HONET-ICT), Islamabad, Pakistan, 8–10 October 2018; pp. 92–96. [Google Scholar] [CrossRef]
- Shang, C.; Yang, F.; Huang, D.; Lyu, W. Data-driven soft sensor development based on deep learning technique. J. Process Control 2014, 24, 223–233. [Google Scholar] [CrossRef]
- Graziani, S.; Xibilia, M.G. Deep Learning for Soft Sensor Design. Stud. Comput. Intell. 2020, 867, 31–59. [Google Scholar] [CrossRef]
- Kadlec, P. On Robust and Adaptive Soft Sensors. Ph.D. Thesis, Bournemouth University, Poole, UK, 2009. [Google Scholar]
- Pan Africa Chemistry Network. Africa’s Water Quality. A Chemical Science Perspective; A report by the Pan Africa Chemistry Network; The Royal Society of Chemistry: London, UK, 2010. [Google Scholar]
- Yan, W.; Shao, H.; Wang, X. Soft sensing modeling based on support vector machine and Bayesian model selection. Comput. Chem. Eng. 2004, 28, 1489–1498. [Google Scholar] [CrossRef]
- Desai, K.; Badhe, Y.; Tambe, S.S.; Kulkarni, B.D. Soft-sensor development for fed-batch bioreactors using support vector regression. Biochem. Eng. J. 2006, 27, 225–239. [Google Scholar] [CrossRef]
- Goodfellow, I.; Bengio, Y.; Courville, A. Deep learning. Nature 2016, 29, 1–73. [Google Scholar]
- Lemos, T.; Campos, L.F.; Melo, A.; Clavijo, N.; Soares, R.; Câmara, M.; Feital, T.; Anzai, T.; Pinto, J.C. Echo State Network Based Soft Sensor for Monitoring and Fault Detection of Industrial Processes. Comput. Chem. Eng. 2021, 155, 107512. [Google Scholar] [CrossRef]
- Patanè, L.; Xibilia, M.G. Echo-state networks for soft sensor design in an SRU process. Inf. Sci. (NY) 2021, 566, 195–214. [Google Scholar] [CrossRef]
- He, Y.L.; Tian, Y.; Xu, Y.; Zhu, Q.X. Novel soft sensor development using echo state network integrated with singular value decomposition: Application to complex chemical processes. Chemom. Intell. Lab. Syst. 2020, 200, 103981. [Google Scholar] [CrossRef]
- Yuan, X.; Qi, S.; Shardt, Y.; Wang, Y.; Yang, C.; Gui, W. Soft sensor model for dynamic processes based on multichannel convolutional neural network. Chemom. Intell. Lab. Syst. 2020, 203, 104050. [Google Scholar] [CrossRef]
- Wang, K.; Shang, C.; Liu, L.; Jiang, Y.; Huang, D.; Yang, F. Dynamic Soft Sensor Development Based on Convolutional Neural Networks. Ind. Eng. Chem. Res. 2019, 58, 11521–11531. [Google Scholar] [CrossRef]
- Wang, X.; Liu, H. Soft sensor based on stacked auto-encoder deep neural network for air preheater rotor deformation prediction. Adv. Eng. Inform. 2018, 36, 112–119. [Google Scholar] [CrossRef]
- Wang, X.; Liu, H. Data supplement for a soft sensor using a new generative model based on a variational autoencoder and Wasserstein GAN. J. Process Control 2020, 85, 91–99. [Google Scholar] [CrossRef]
- Szeląg, B.; Drewnowski, J.; Łagód, G.; Majerek, D.; Dacewicz, E.; Fatone, F. Soft sensor application in identification of the activated sludge bulking considering the technological and economical aspects of smart systems functioning. Sensors 2020, 20, 1941. [Google Scholar] [CrossRef] [Green Version]
- Ng, A. Sparse Autoencoder. CS294A Lecture Notes, 72(2011); Department of Computer Science and Department of Electrical Engineering-Stanford University: Stanford, CA, USA, 2011; pp. 1–19. [Google Scholar]
- Yuan, X.; Ou, C.; Wang, Y.A.L.I.; Yang, C. Nonlinear VW-SAE based deep learning for quality-related feature learning and soft sensor modeling. In Proceedings of the IECON 2018—44th Annual Conference of the IEEE Industrial Electronics Society, Washington, DC, USA, 21–23 October 2018; Volume 1, pp. 5400–5405. [Google Scholar] [CrossRef]
- Wang, X.; Liu, H. A new input variable selection method for soft sensor based on stacked auto-encoders. In Proceedings of the 2017 IEEE 56th Annual Conference on Decision and Control (CDC), Melbourne, Australia, 12–15 December 2017; pp. 3324–3329. [Google Scholar] [CrossRef]
- Al-jabery, K.K.; Obafemi-Ajayi, T.; Olbricht, G.R.; Wunsch, D.C., II. Selected approaches to supervised learning. Comput. Learn. Approaches Data Anal. Biomed. Appl. 2020, 101–123. [Google Scholar] [CrossRef]
- Abirami, S.; Chitra, P. Energy-efficient edge based real-time healthcare support system. Adv. Comput. 2020, 117, 339–368. [Google Scholar] [CrossRef]
- Shajun Nisha, S.; Mohamed Sathik, M.; Nagoor Meeral, M. Application, algorithm, tools directly related to deep learning. Handb. Deep Learn. Biomed. Eng. 2021, 61–84. [Google Scholar] [CrossRef]
- Zhu, W.; Ma, Y.; Zhou, Y.; Benton, M.; Romagnoli, J. Deep Learning Based Soft Sensor and Its Application on a Pyrolysis Reactor for Compositions Predictions of Gas Phase Components. Comput. Aided Chem. Eng. 2018, 44, 2245–2250. [Google Scholar] [CrossRef]
- Antonelo, E.A.; Camponogara, E. An echo state network-based soft sensor of downhole pressure for a gas-lift oil well. In Communications in Computer and Information Science; Springer: Berlin/Heidelberg, Germany, 2015; Volume 517, pp. 379–389. [Google Scholar]
- Lukoševičius, M.; Jaeger, H. Reservoir computing approaches to recurrent neural network training. Comput. Sci. Rev. 2009, 3, 127–149. [Google Scholar] [CrossRef]
- Huang, R.; Li, Z.; Cao, B. A soft sensor approach based on an echo state network optimized by improved genetic algorithm. Sensors 2020, 20, 5000. [Google Scholar] [CrossRef] [PubMed]
- Shorten, C.; Khoshgoftaar, T.M. A survey on Image Data Augmentation for Deep Learning. J. Big Data 2019, 6, 1–48. [Google Scholar] [CrossRef]
- Wang, X. Data Preprocessing for Soft Sensor Using Generative Adversarial Networks. In Proceedings of the 2018 15th International Conference on Control, Automation, Robotics and Vision, ICARCV 2018, Singapore, 18–21 November 2018; Institute of Electrical and Electronics Engineers Inc.: Piscataway, NJ, USA, 2018; pp. 1355–1360. [Google Scholar]
- Olmschenk, G.; Zhu, Z.; Tang, H. Generalizing semi-supervised generative adversarial networks to regression using feature contrasting. Comput. Vis. Image Underst. 2019, 186, 1–12. [Google Scholar] [CrossRef] [Green Version]
- Wolterink, J.M.; Kamnitsas, K.; Ledig, C.; Išgum, I. Deep Learning: Generative Adversarial Networks and Adversarial Methods; Elsevier Inc.: Amsterdam, The Netherlands, 2019; ISBN 9780128161760. [Google Scholar]


| Anion | Cation | Chemical | Physical | Biological | Heavy Metal |
|---|---|---|---|---|---|
| Chloride | Sodium | pH | EC | E. coli | Boron |
| Sulphate | Calcium | DO | |||
| Carbonate | Potassium | COD | |||
| Bicarbonate | Magnesium | ||||
| Total nitrogen |
| Water Quality Index | Symbol | Formula | References |
|---|---|---|---|
| Potential Salinity | PS | [55,56] | |
| Kelly Index | KI | [38,57] | |
| Sodium Adsorption Ratio | SAR | [38,55] | |
| Magnesium Adsorption Ratio | MAR | [55,57] | |
| Residual Sodium Carbonate | RSC | [38,55] | |
| Exchangeable Sodium Percentage | ESP | [54,55] | |
| Permeability Index | PI | [55,56] | |
| Sodium Percentage | Na% | [38,56] |
| Water Quality Index | Range | Water Class |
|---|---|---|
| Kelley Index (KI) | <1 | Good Unsuitable |
| >1 | ||
| Sodium Adsorption Ratio (SAR) | <10 | Excellent |
| 10–18 | Good/safe | |
| 18–26 | Doubtful/moderate | |
| >26 | Unsuitable | |
| Residual Sodium Carbonate (RSC) | <1.25 | Good |
| 1.25–2.5 | Doubtful | |
| >2.5 | Unsuitable | |
| Permeability Index (PI) | >75% | Good-Class I |
| 25–75% | Good-Class II | |
| <25% | Unsuitable-III | |
| Sodium Percentage (Na%) | <20 | Excellent |
| 20–40 | Good | |
| 40–60 | Permissible | |
| 60–80 | Doubtful | |
| >80 | Unsuitable |
| Potential Irrigation Problem | Units | The Degree of Restriction on the Use | ||
|---|---|---|---|---|
| None | Slight to Moderate | Severe | ||
| Electrical conductivity at 25 °C | dS/m | <0.7 | 0.7–3 | >3 |
| Boron | mg/L | <0.7 | 0.7–3 | >3 |
| NO3 | mg/L | <5 | 5–30 | >30 |
| Chloride | mg/L | <4 | 4–10 | >10 |
| Dissolved oxygen | mg/L | - | - | - |
| Chemical oxygen demand | mg/L | - | - | - |
| Escherichia coli | cfu/100 mL | - | - | - |
| pH | Normal range 6.5–8.4 | |||
| Parameter | Accuracy Ratings | ||||
|---|---|---|---|---|---|
| Target | Acceptable | Tolerable | Poor | Ref. | |
| pH | ≤±0.2 units | >±0.2–0.5 units | >±0.5–0.8 units | >±0.8 units | [62,63,64,65] |
| Electrical conductivity | ≤±3% | >±3–10% | >±10–15% | >±15% | [61,62,63,64] |
| Dissolved oxygen | ≤±5% | >±5–10% | >±10–15% | >±15% | [61,62,63,64,65] |
| Total nitrogen | ≤±5%thisreview [TR] | >±5–10% [63,64] | >±10–15% | >±15% | [TR] |
| Chloride | ≤±5% | >±5–10% [64] | >±10–15% [63] | >±15% | [TR] |
| Calcium | ≤±5% | >±5–10% [64] | >±10–15% | >±15% | [TR] |
| Sodium | ≤±5% [65] | >±5–10% | >±10–15% | >±15% | [TR] |
| Chemical oxygen demand | ≤±5% [67] | >±5–10% [65] | >±10–15% | >±15% | [TR] |
| Boron | ≤±5% | >±5–10% | >±10–15% | >±15% | [TR] |
| Sulphate | ≤±5% | >±5–10% | >±10–15% | >±15% | [TR] |
| Potassium | ≤±5% | >±5–10% | >±10–15% | >±15% | [TR] |
| Alkalinity | ≤±5% | >±5–10% | >±10–15% | >±15% | [TR] |
| Magnesium | ≤±5% | >±5–10% | >±10–15% | >±15% | [TR] |
| Escherichia coli | ≤±5% | >±5–10% | >±10–15% | >±15% | [TR] |
| Monitoring Activity | In Situ Measurement | Laboratory Analysis | ||||||||||||
|---|---|---|---|---|---|---|---|---|---|---|---|---|---|---|
| pH | EC | DO | Na | Ca | Mg | Cl | SO42 | K | B | Alkal | TN | COD | E. coli | |
| Sample preservation | 0.0 | 0.0 | 0.0 | 0.0 | 0.0 | 0.0 | 0.0 | 0.5 | 0.5 | 0.0 | 0.0 | 0.5 | 0.5 | 1.0 |
| Transportation cost | 0.0 | 0.0 | 0.0 | 1.0 | 1.0 | 1.0 | 1.0 | 1.0 | 1.0 | 1.0 | 1.0 | 1.0 | 1.0 | 1.0 |
| Labour | 0.5 | 0.5 | 0.5 | 1.0 | 1.0 | 1.0 | 1.0 | 1.0 | 1.0 | 1.0 | 1.0 | 1.0 | 1.0 | 1.0 |
| Equipment costs | 0.0 | 0.0 | 0.0 | 1.0 | 1.0 | 1.0 | 1.0 | 1.0 | 1.0 | 1.0 | 1.0 | 1.0 | 1.0 | 1.0 |
| Consumables | 0.0 | 0.0 | 0.0 | 0.5 | 0.5 | 0.5 | 0.5 | 0.5 | 0.5 | 1.0 | 0.5 | 1.0 | 1.0 | 0.5 |
| Measurement duration | 0.0 | 0.0 | 0.0 | 0.0 | 0.0 | 0.0 | 0.0 | 0.0 | 0.0 | 0.5 | 1.0 | 0.5 | 1.0 | 1.5 |
| Communication + computing | 1.0 | 1.0 | 1.0 | 1.0 | 1.0 | 1.0 | 1.0 | 1.0 | 1.0 | 1.0 | 1.0 | 1.0 | 1.0 | 1.0 |
| Total score | 1.5 | 1.5 | 1.5 | 4.5 | 4.5 | 4.5 | 4.5 | 5.0 | 5.0 | 5.5 | 5.5 | 6.0 | 6.5 | 7.0 |
| Cost estimate | L | L | L | H | H | H | H | H | H | H | H | H | VH | VH |
| Inputs 1 | Pre-Processed | Outputs 2 | Data Time Scale | Techniques 3 | Ref. |
|---|---|---|---|---|---|
| EC, pH, TD, fDOM, HP, Temp, Turb, SM | No | TP, TN | 2018–2019 (1–15 min) | RF | [94] |
| DO, Turb, pH, Temp, ORP, EC | Yes | BOD | February–April 2019 (NS) | MLR, MLP, SVM-SMO, IBK, RF | [29] |
| EC, Temp, pH | Yes | TDS, PS, SAR, ESP, MAR, RSC | 2009–2019 (NS) | ANN, MLR, RF, SVM, kNN, Adaboost | [55] |
| EC, pH | Yes | SAR, ESP, %Na, RSC, PI, KI, Cl, MAR, TDS | NS (NS) | ANN, MLR, RF, SVM, kNN, Adaboost | [95] |
| DO, Temp, TSS, N−, h NH3, pH, TOC, Turb | Yes | COD | NS (NS) | MLR, MLP, SVM, RF, kNN | [22] |
| EC, Turb, Temp, DO, pH, Chl-a, Q | Yes | TP, TN | 2009–2012 (hourly) | RF | [85] |
| TSS, TDS, Turb, EC, COD, BOD | No | TP, TN | 2009–2014 (bimonthly) | RF, MLR | [96] |
| NS | NS | BOD, DO | NS (NS) | NM | [97] |
| Temp, NH4-N, DO, DLS, pH | Yes | WQ | January 2010–December 2012 (monthly) | FNN, HK-FNN | [98] |
| EC, pH, TDS, Ca, K, CO3, Na, Mg, HCO3, Cl, SO4 | No | SAR | 1971–2017 (NS) | RF, GMDH | [99] |
| NS | NS | Eutrophication | NS (NS) | NM | [100] |
| Turb, OP, Chl-a, Cl | No | TP | NS (monthly) | MLR | [101] |
| EC, pH, Na, Ca, Mg, K, CO3, HCO3, NO3, | No | SAR, RSC, MAR, KI, %Na, SO4, TDS, TH, Cl | 2012 (NS) | ANN | [102] |
| Temp, pH, DO, EC, TN | Yes | Algal blooms | May 2010–August 2010 (6 times/hour) | GPR, MLP, BNN, MLR | [103] |
| Turb, Temp, pH, EC | No | TP | April 2010–September 2013 (hourly) | MLR | [104] |
| Turb, Temp, DY, HD, SS, SE | No | TP, TSS | August 2005–April 2008 (30 min) | MLR | [105] |
| Monitoring Activity | In Situ Measurement | Laboratory Analysis | ||||||||||||
|---|---|---|---|---|---|---|---|---|---|---|---|---|---|---|
| pH | EC | DO | Na | Ca | Mg | Cl− | SO42− | K | B | Alkal | TN | COD | E. coli | |
| Sample preservation | 0 | 0 | 0 | 0 | 0 | 0 | 0 | 0.5 | 0.5 | 0 | 0 | 0 | 0 | 0 |
| Transportation cost | 0 | 0 | 0 | 0 | 0 | 0 | 1 | 1 | 1 | 1 | 0 | 0 | 0 | 0 |
| Labour | 0.5 | 0.5 | 0.5 | 0 | 0 | 0 | 1 | 1 | 1 | 1 | 0 | 0 | 0 | 0 |
| Equipment costs | 0 | 0 | 0 | 0 | 0 | 0 | 1 | 1 | 1 | 1 | 0 | 0 | 0 | 0 |
| Consumables | 0 | 0 | 0 | 0 | 0 | 0 | 0.5 | 0.5 | 0.5 | 1 | 0 | 0 | 0 | 0 |
| Measurement duration | 0 | 0 | 0 | 0 | 0 | 0 | 0 | 0 | 0 | 0.5 | 0 | 0 | 0 | 0 |
| Communication + computing | 1 | 1 | 1 | 1 | 1 | 1 | 1 | 1 | 1 | 1 | 1 | 1 | 1 | 1 |
| Total score | 1.5 | 1.5 | 1.5 | 1 | 1 | 1 | 4.5 | 5 | 5 | 5.5 | 1 | 1 | 1 | 1 |
| Cost estimate | L | L | L | L | L | L | H | H | H | H | L | L | L | L |
Publisher’s Note: MDPI stays neutral with regard to jurisdictional claims in published maps and institutional affiliations. |
© 2021 by the authors. Licensee MDPI, Basel, Switzerland. This article is an open access article distributed under the terms and conditions of the Creative Commons Attribution (CC BY) license (https://creativecommons.org/licenses/by/4.0/).
Share and Cite
Paepae, T.; Bokoro, P.N.; Kyamakya, K. From Fully Physical to Virtual Sensing for Water Quality Assessment: A Comprehensive Review of the Relevant State-of-the-Art. Sensors 2021, 21, 6971. https://doi.org/10.3390/s21216971
Paepae T, Bokoro PN, Kyamakya K. From Fully Physical to Virtual Sensing for Water Quality Assessment: A Comprehensive Review of the Relevant State-of-the-Art. Sensors. 2021; 21(21):6971. https://doi.org/10.3390/s21216971
Chicago/Turabian StylePaepae, Thulane, Pitshou N. Bokoro, and Kyandoghere Kyamakya. 2021. "From Fully Physical to Virtual Sensing for Water Quality Assessment: A Comprehensive Review of the Relevant State-of-the-Art" Sensors 21, no. 21: 6971. https://doi.org/10.3390/s21216971