Article

A Medium-Frequency Fiber Bragg Grating Accelerometer Based on Flexible Hinges

National Engineering Laboratory for Fiber Optic Sensing Technology, Wuhan University of Technology, Wuhan 430070, China
*
Author to whom correspondence should be addressed.
Sensors 2021, 21(21), 6968; https://doi.org/10.3390/s21216968
Submission received: 6 September 2021 / Revised: 13 October 2021 / Accepted: 17 October 2021 / Published: 20 October 2021
(This article belongs to the Special Issue Fiber Bragg Grating Sensors: Recent Advances and Future Perspectives)

Abstract

:
Mediumfrequency fiber Bragg grating (FBG) acceleration sensors are used in important applications in mechanical, aerospace and weapon equipment, and have strict requirements in terms of resonance frequency and sensitivity. A novel medium-frequency accelerometer, based on fiber Bragg grating and flexible hinges, is proposed in this paper. The differential structure doubles the sensitivity of the sensor while avoiding temperature effects. The structure model and principle for the sensor are introduced, the sensor’s sensing characteristics are theoretically analyzed, and the structure parameters for the sensor are determined through numerical analysis. The sensing experiments show that the resonance frequency of the sensor is approximately 2800 Hz, the sensitivity is 21.8 pm/g in the flat frequency range of 50–1000 Hz, and the proposed sensor has a good temperature self-compensation function and lateral anti-interference capability.

1. Introduction

Electronic acceleration sensor technology is relatively mature, and it is widely used in the field of mechanical fault diagnosis [1,2,3]. Compared with traditional electronic sensors, FBG sensors have many advantages, including anti-electromagnetic interference, corrosion resistance, long-distance transmission, and distributed measurement. FBG sensors are widely used in important fields, such as railways [4], bridges [5], the oil industry [6], and aerospace [7,8]. Up until the present day, FBG acceleration sensors have been widely used in vibration measurement, playing an important role in structural health monitoring [9,10,11,12,13]. A packaged FBG acceleration sensor is composed of a spring-mass system with one or several FBGs. Various elastic elements have been studied to form FBG acceleration sensors, including cantilever type [14,15,16,17,18], diaphragm type [19,20,21], and flexure hinge type [22,23,24,25,26,27]. In flexure hingebased acceleration sensors [23,24,25], the two sides of a flexure hinge are connected with the mass and the base, respectively, and the FBG is placed between the base and the inertial mass to realize the acceleration measurement. Wei et al. [26] arranged two couple FBGs to eliminate the influence of temperature and double the sensitivity of the sensor. The acceleration sensitivity reached 40 pm/g, but its resonance frequency is as low as 814.3 Hz. Wang et al. [27] realized the measurement of three-dimensional acceleration based on a composite flexible hinge. The sensor’s z-axis sensitivity is 20.3 pm/g, and the measurement frequency range is only 0–250 Hz, which is unable to measure medium–high-frequency acceleration.
In recent years, many scholars proposed various structures for medium–high-frequency FBG acceleration sensors [28,29,30,31,32]. In [28], Stefani et al. proposed an FBG accelerometer based on polymer fiber and a flexible hinge structure. The sensor’s resonance frequency is approximately 3 kHz, and the sensitivity is up to 19 pm/g. The study pointed out that polymer FBGs can increase the sensitivity of an accelerometer by more than four times, compared with silica FBGs. In [29], based on the flexible hinge structure, Dai et al. discussed the influence of hinge structure parameters on the sensor’s sensitivity and resonance frequency, and reported an accelerometer with a resonance frequency of about 3000 Hz. Their experiments showed that the sensor sensitivity is 13.82 pm/g at an excitation frequency of 100 Hz. In [30], Guo et al. introduced a welding-packaged accelerometer based on a metal-coated FBG; the resonance frequency and sensitivity of the sensor are 3.6 kHz and 1.7 pm/g, respectively. In [31], based on the elastic structure of a steel tube and a mass block, Wang et al. designed a high-frequency FBG accelerometer. Embedded with two FBGs for axial vibration sensing, the resonance frequency and sensitivity are 3806 Hz and 4.01 pm/g, respectively. According to [32], Wu et al. reported a high-frequency FBG accelerometer with an isosceles triangular cantilever beam and a mass block. In this sensor, one FBG is pasted onto the cantilever beam for measurement and the other FBG is used as a reference. Adopting light intensity demodulation, the resonance frequency and sensitivity of the sensor are 8193 Hz and 0.46 pm/g, respectively.
For FBG acceleration sensors, the resonance frequency and sensitivity restrict each other, which is also mentioned in some related studies [21]. In existing reports about mediumhigh frequency FBG acceleration sensors, the sensitivities are often low, which leads to low resolution. A possible way to improve the sensor performance is to use FBGs in polymer optical fiber, but polymer optical fiber will bring higher transmission losses. Therefore, we try to broaden the frequency measurement range and increase the sensitivity by improving the structure of the sensor.
In this work, we propose a novel medium-frequency FBG accelerometer based on two FBGs, three flexible hinges, and two inertial mass blocks, where the three straight circular flexure hinges connect the two masses and the base into a whole. Two FBGs are then arranged symmetrically at both ends of the two masses. Such a hingemasshinge structure can improve the overall rigidity of the sensor compared with the common masshingebase structure. Meanwhile, two FBGs suspended between two masses not only doubles the sensitivity of the sensor, but also leads to a temperature self-compensation capability. In the following sections, the sensing characteristics of the sensor are analyzed theoretically, the structural parameters are determined by numerical analysis, and, finally, the sensor is experimentally studied.

2. Materials and Methods

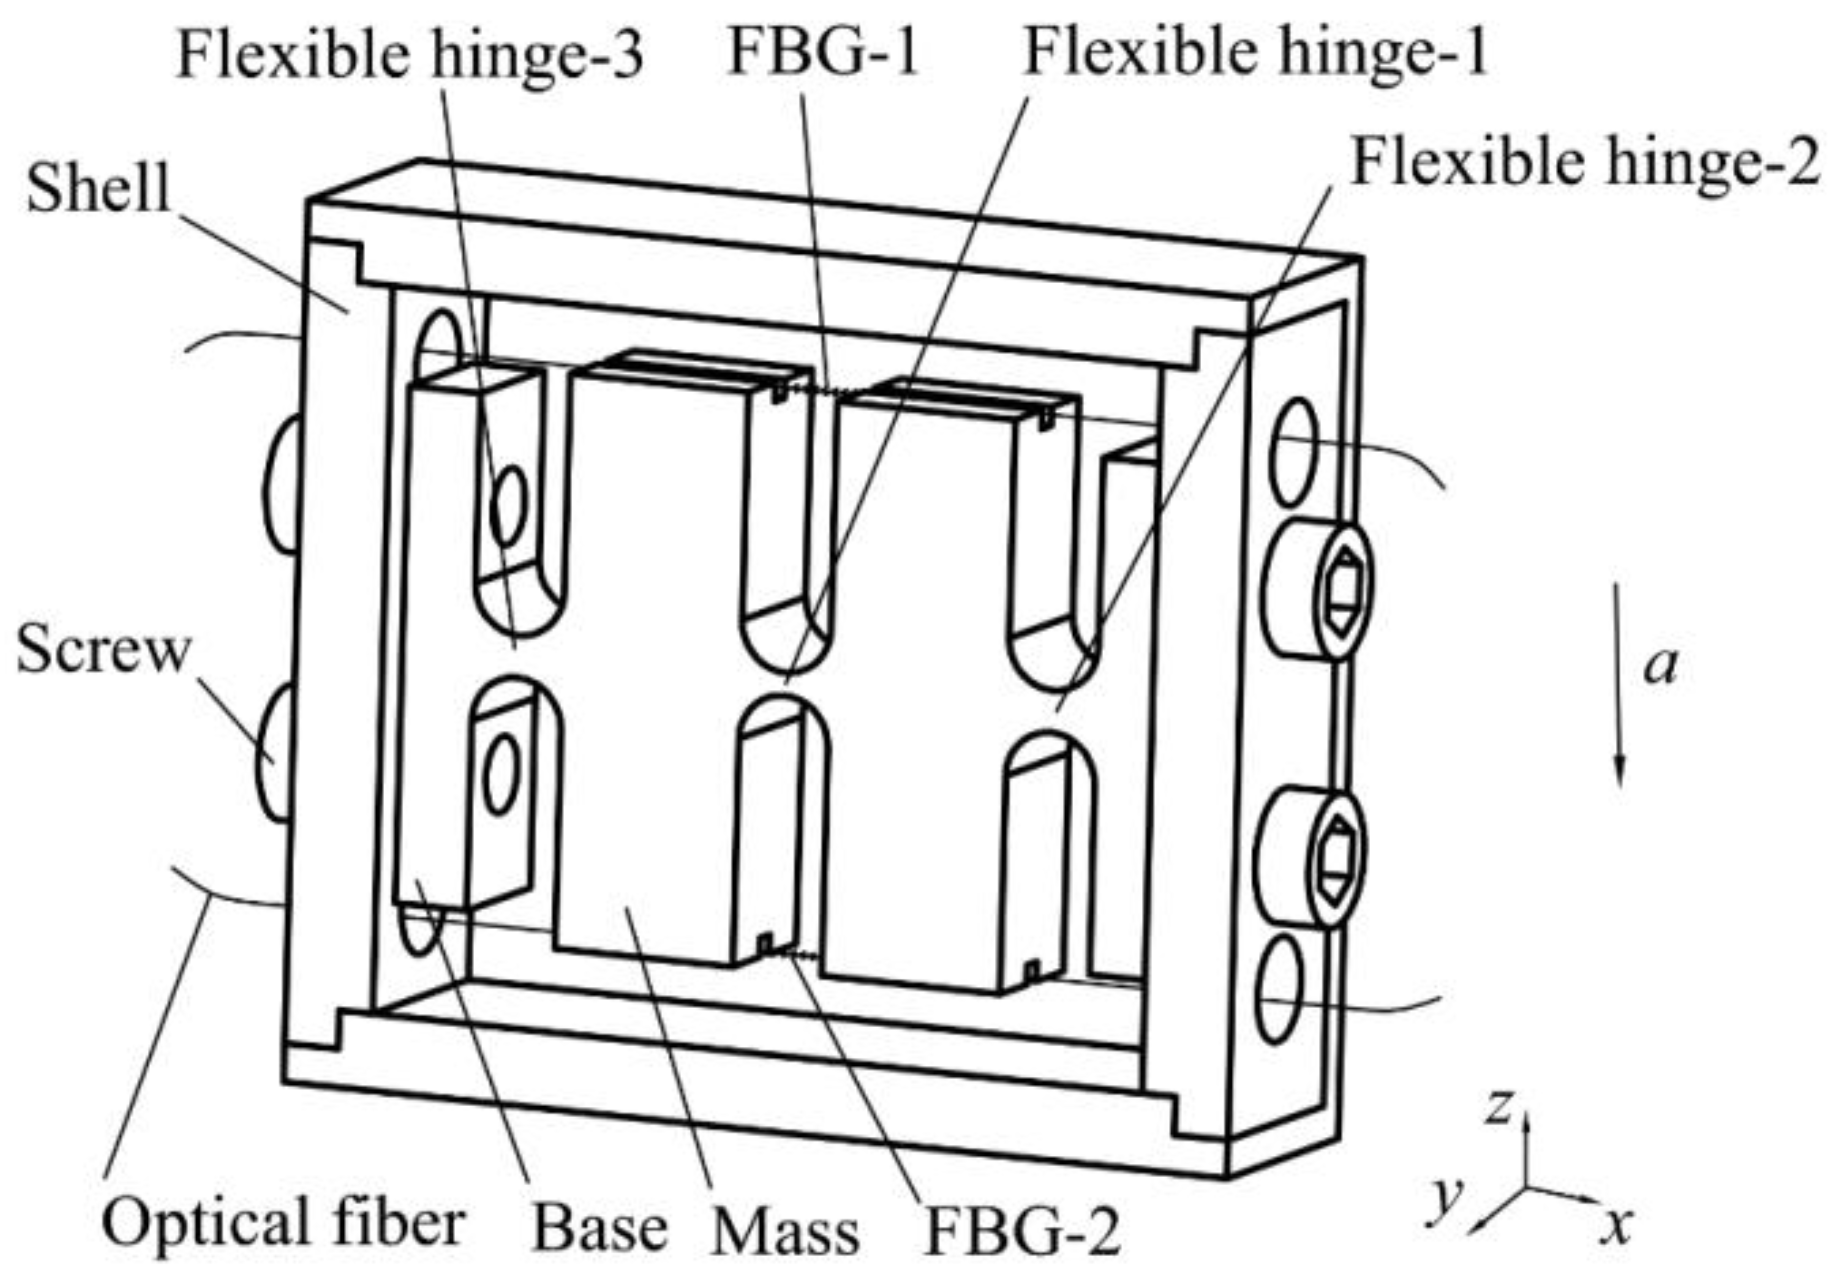
2.1. Structure Model and Principle of the Sensor
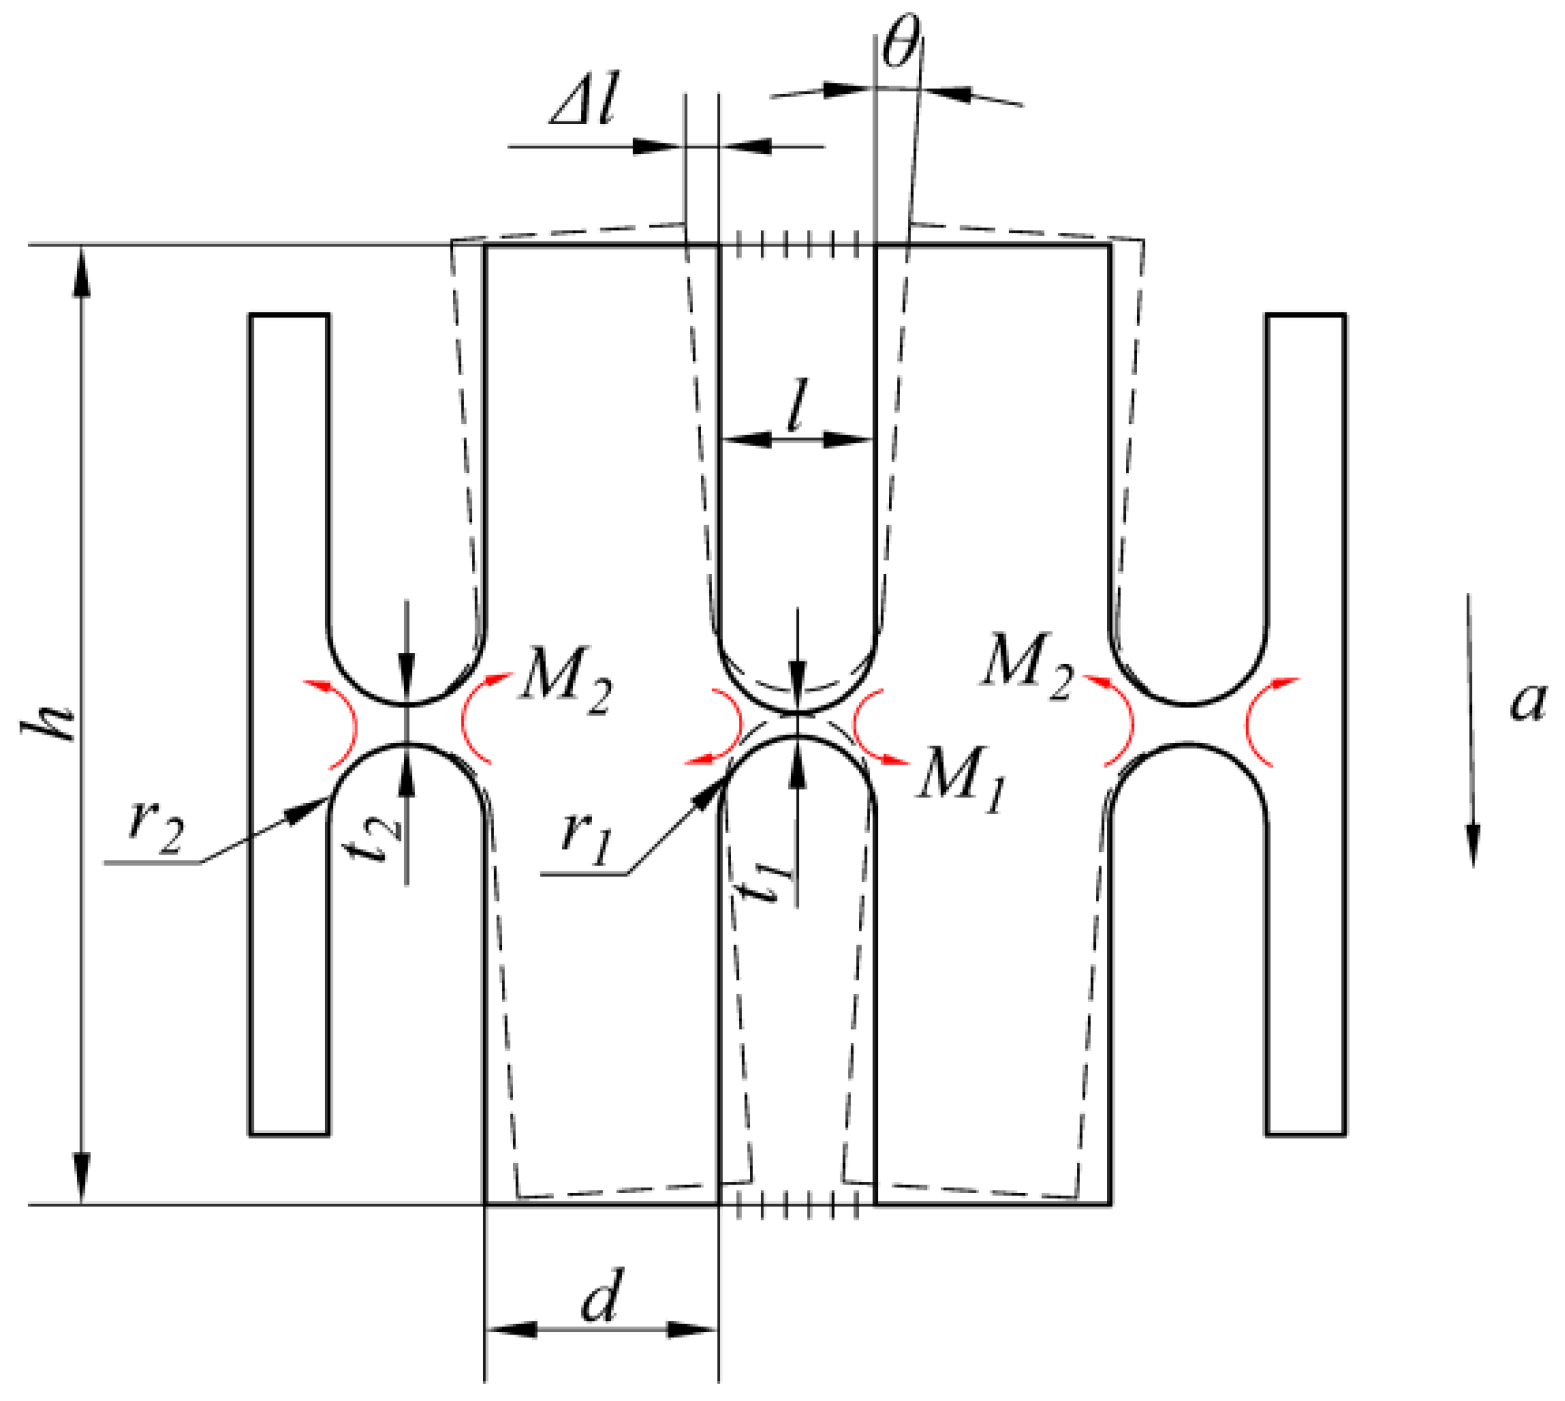
The detailed design of the proposed medium-frequency FBG accelerometer is illustrated in Figure 1. This sensor is mainly composed of two inertial masses, three straight circular flexure hinges, two FBGs and a base. The sensor is symmetrical, the sizes of flexure hinge-2 and flexure hinge-3 are exactly the same. The two ends of the masses are provided with optical fiber grooves. The two ends of the pre-stretched FBG are fixed in the grooves by glue. The FBG is suspended above the flexible hinge, and the base and the package shell are connected by threads.
When an acceleration excitation along the measurement direction is generated externally, the two masses will rotate slightly around the center of flexible hinge-2 and flexible hinge-3, respectively, driving the FBGs to stretch or compress and converting the vibration acceleration into the strains and wavelength shifts of two FBGs. Vibration signals can be obtained from the wavelength shifts of the two FBGs. In this design, three straight round flexible hinges connect the two masses and the base into a whole. The hinge–mass–hinge structure can improve the overall rigidity of the sensor compared with the hinge-mass structure. Meanwhile, two FBGs designs double the sensor’s sensitivity while realizing temperature self-compensation.

2.2. Sensitivity

When an external acceleration acts on the sensitive direction of the sensor, the two masses will rotate slightly around the center of flexible hinge-2 and flexible hinge-3, respectively, under the action of inertial force. The mechanical model of the sensor is shown in Figure 2.
According to the principle of virtual displacement, the general dynamics equation for the system can be expressed as follows:
( 2 M 1 2 M 2 ) δ θ + 2 m a δ z 4 F f δ Δ l = 0
where θ is the rotation angle of the mass relative to flexible hinge-2, m is the mass of the mass block, a is the vibration acceleration in the z-axis of the sensor, z is the displacement of the mass center of the mass in the z-axis, Ff is the tensile force generated by the optical fiber, l is the optical fiber pasting span, and Δl is the displacement of the bonding point at one end of the optical fiber in the x-axis.
The magnitude of the moment Mi is proportional to the stiffness Ki of the straight circular flexure hinge, which can be expressed as follows:
M i = K i θ   ( i = 1 , 2 )
Here, the stiffness of the straight round flexure hinge is given by [33].
K = EwR 2 24 / [ s 3 ( 6 s 2 + 4 s + 1 ) ( 2 s + 1 ) ( 4 s + 1 ) 2 + 6 s 4 ( 2 s + 1 ) ( 4 s + 1 ) 5 / 2 arctan 4 s + 1 ]
s = r t
where E is the elastic modulus of the flexible hinge, r is the radius of the straight circular flexible hinge, t is the thickness of the hinge waist, and w is the width of the hinge.
In Equation (1), the magnitude of the pulling force can be obtained by the following:
F f = 2 k f Δ l
where the following is the elastic coefficient of the optical fiber:
k f = A f E f l
where l is the bonding span of the optical fiber, and Af and Ef are the cross-sectional area and elastic modulus of the optical fiber, respectively.
Since θ is very small, we can take sinθθ. From the geometric relationship, we have the following:
z = ( r 2 + d 2 ) θ
Δ l = h 2 θ
When deformation occurs between spans, the strain ε corresponding to the grating can be described as follows:
ε = 2 Δ l l
When the incident light passes through the FBG, part of light that meets the Bragg central wavelength condition will be reflected. External strain and temperature load will result in a shift of the Bragg central wavelength. The effects of strain and temperature on the Bragg wavelength shift can be expressed as follows:
Δ λ λ = ( 1 P e ) ε + ( α f + ξ f ) Δ T
where λ is the Bragg central wavelength for the FBG, Δλ is the Bragg wavelength shift of the FBG, αf is the thermal expansion coefficient, ζf is the thermo-optical coefficient, and Pe is the photoelastic coefficient (theoretical value = 0.22).
For FBG-1 and FBG-2, the following apply:
Δ λ 1 λ 1 = ( 1 P e ) ε 1 + ( α f + ξ f ) Δ T
Δ λ 2 λ 2 = ( 1 P e ) ε 2 + ( α f + ξ f ) Δ T
where λ1 and λ2 represent the central wavelengths for FBG-1 and FBG-2 after prestretching, Δλ1 and Δλ2 represent the central wavelength shifts for FBG-1 and FBG-2 after prestretching, respectively, and ε1 and ε2 represent the strain amounts for FBG-1 and FBG-2 after prestretching, respectively.
FBG-1 and FBG-2 are symmetrically arranged at both ends of the mass block. When FBG-1 is stretched, FBG-2 is compressed, with ε1 = ε and ε2 = −ε. The temperature sensitivity coefficients for the selected gratings are the same, and the central wavelengths are approximately equal, with λ1 = λ2 = λ.
By combining Equations (11) and (12) to eliminate the influence of temperature on the wavelength shift of the grating, we can obtain the following:
Δ λ = Δ λ 1 Δ λ 2 = 2 ( 1 P e ) ε
Combining Equations (1), (7), (8) and (13), the sensitivity of the sensor can be expressed as follows:
S = Δ λ a = 4 λ ( 1 P e ) Δ l a l = λ ( 1 P e ) l 2 m h ( r 2 + d 2 ) k f h 2 + K 1 + K 2

2.3. Resonance Frequency

The resonance frequency is an important indicator to account for the performance of an accelerometer. Suppose J is the inertia moment of the mass around the center of hinge-2 and θ is the generalized coordinate for obtaining the Lagrangian function, as follows:
L = T m V f V J
The strain potential energy of the optical fiber can be expressed as follows:
V f = 2 × 1 2 k f ( h θ ) 2
The elastic potential energy of the hinge can be obtained by the following:
V J = 2 × 1 2 ( K 1 + K 2 ) θ 2
The kinetic energy of the mass block can be described as follows:
T m = 2 × 1 2 J θ ˙ 2
The Lagrangian equation for the conservative force can be written as follows:
t ( L θ ˙ ) L θ = 0
Substituting Equation (15) to (18) into Equation (19), the dynamic equation for the system can be described as follows:
2 J θ ¨ + ( 2 k f h 2 + 2 ( K 1 + K 2 ) ) θ = 0
The resonance frequency of the system can be expressed as follows:
f = 1 2 π k f h 2 + ( K 1 + K 2 ) J
According to the moment of inertia formula and the parallel axis theorem, the moment of inertia can be obtained by the following:
J = m d 2 + h 2 12 + m ( r 2 + d 2 ) 2

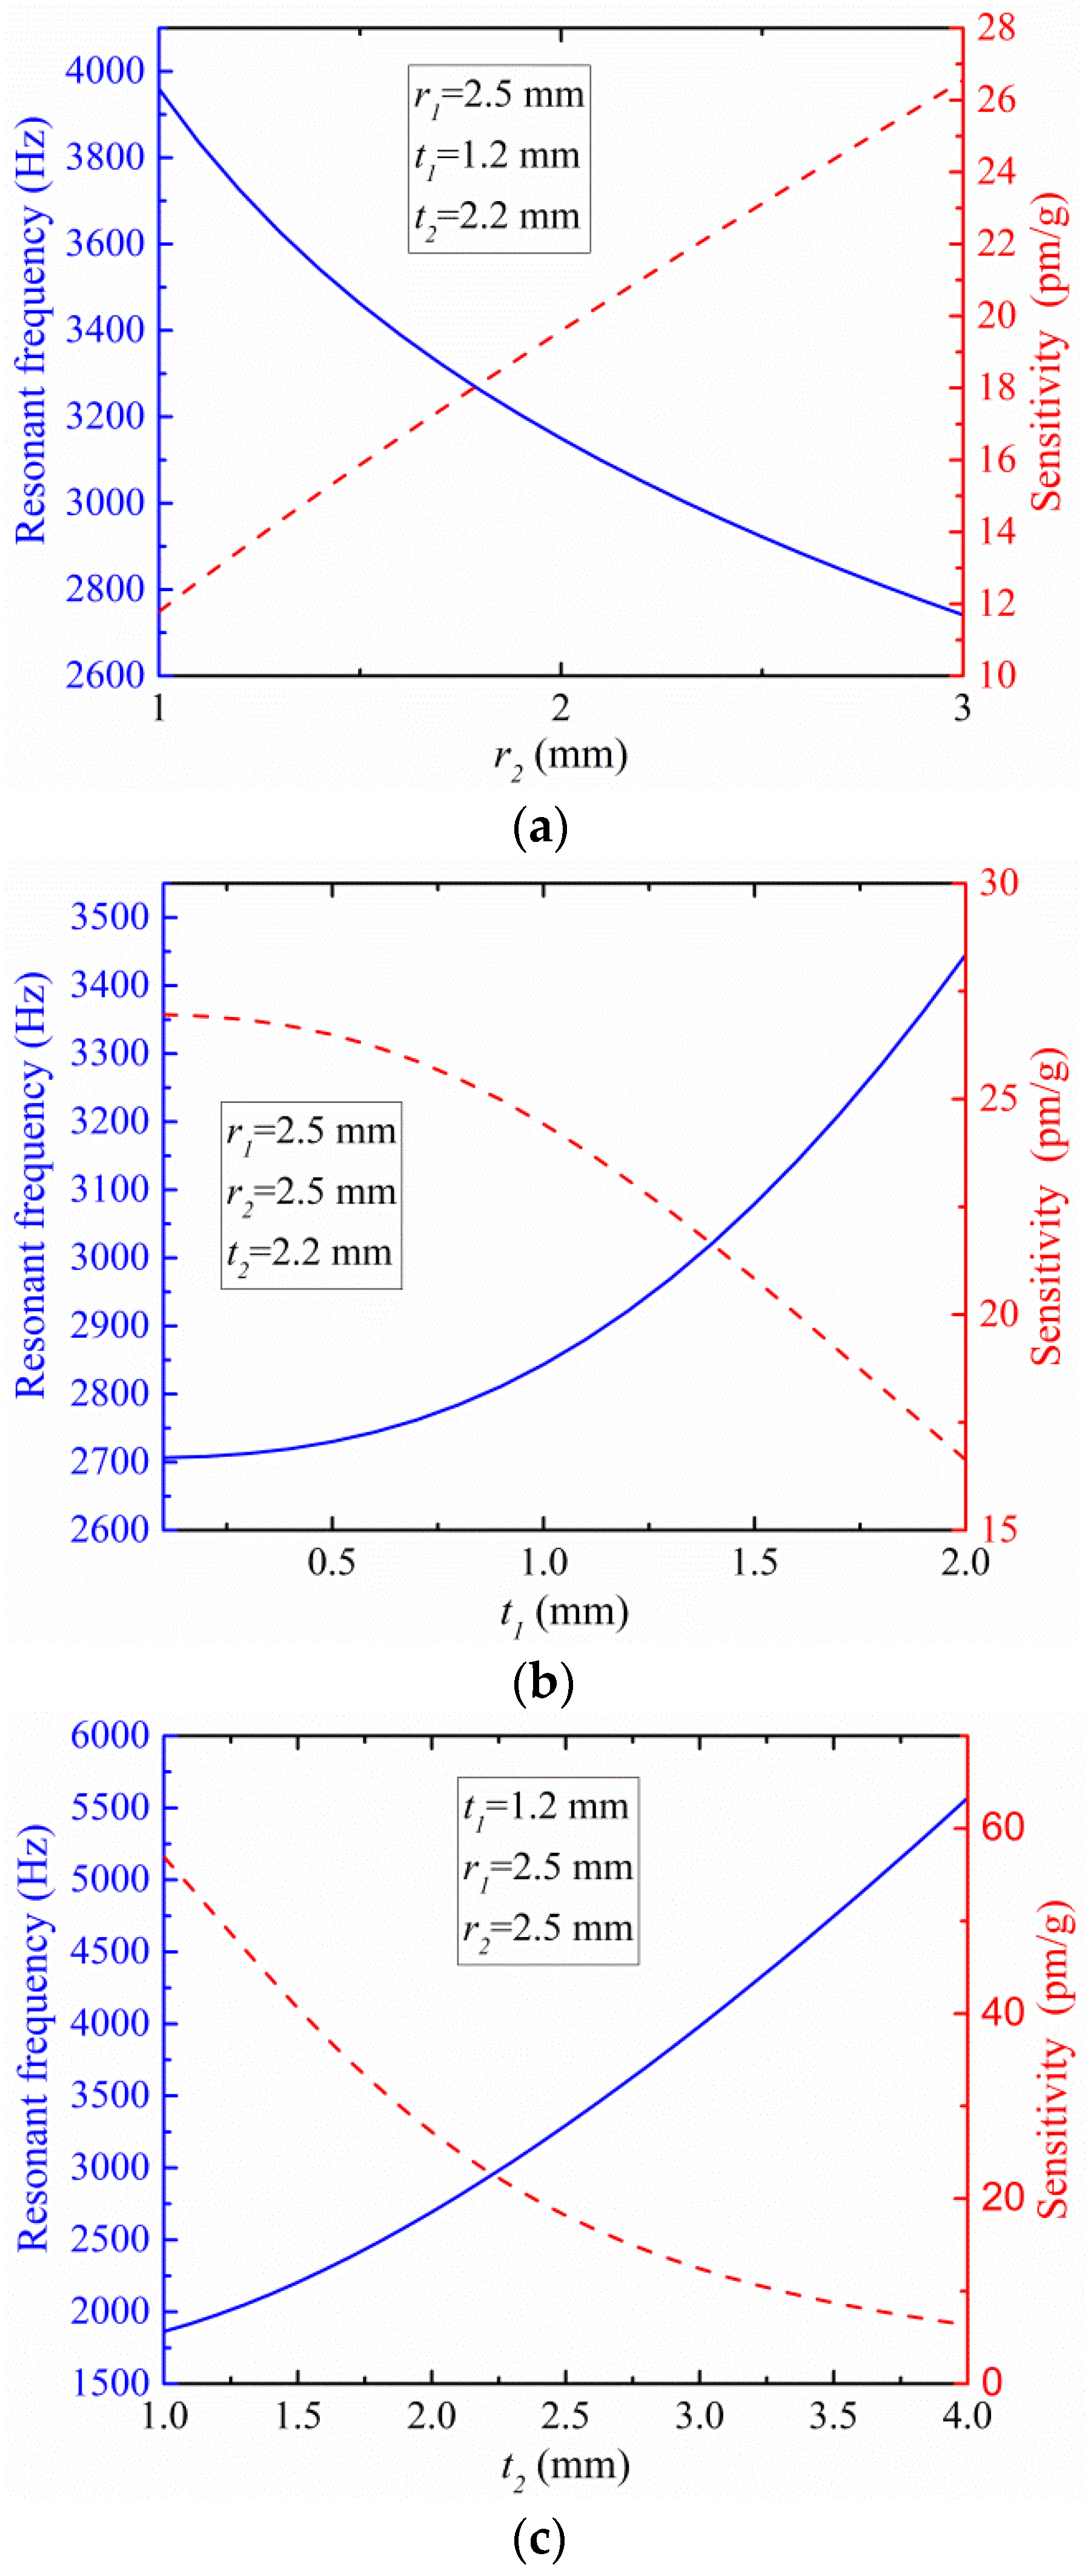
2.4. Dimensional Parameter Optimization

Since the sensor is symmetrical, only the influence of flexible hinge-1 and flexible hinge-2 on the resonance frequency and sensitivity of the sensor is discussed. It can be seen from Equations (14) and (21) that the radius (r1) and waist thickness (t1) of hinge-1, the radius (r2) and the waist thickness (t2) of hinge-2, the thickness of hinge (w), and the width (d) and height (h) of the mass block are seven key parameters that affect the resonance frequency and sensitivity of the sensor. To obtain a higher resonance frequency and greater sensitivity, the structural parameters of the sensor need to be optimized.
Since the length of the FBG grating used is 5 mm, to increase the sensitivity, the radius r1 is set to 2.5 mm. To ensure reliable fixation at both ends of the optical fiber, the width of mass block d is set to 10 mm. To limit the sizes of the sensor, the height h is set to 30 mm, and the thickness w is 8 mm. The sensor adopts wire-cutting integrated processing. The material characteristic parameters are shown in Table 1.
So, we have investigated the influence of r2, t1, and t2 on the sensor’s resonance frequency and sensitivity to determine the optimal size parameters. The dependence relationships of the resonance frequency and sensitivity on three dimensional parameters (r2, t1, t2) are shown in Figure 3a–c.
As shown in Figure 3a, the resonance frequency decreases with increasing radius of flexible hinge-2. When 1 mm ≤ r2 ≤ 3 mm, the resonance frequency has a larger variation range, which can be used to adjust the working frequency range of the sensor. Compared with t1 and t2, r2 has a greater impact on the size of the sensor, and r2 should not be too large.
As shown in Figure 3b, the resonance frequency increases as the thickness of the thinnest part of flexure hinge-1 t1 increases. When 0.5 mm ≤ t1 ≤ 2 mm, the resonance frequency changes in a smaller range.
As shown in Figure 3c, the resonance frequency increases as the thickness of the thinnest part of flexure hinge-2 t2 increases. When 1 mm ≤ t2 ≤ 4 mm, the resonance frequency shows a large variation range, which can be used to adjust the operating frequency range. In addition, t2 should not be too small, and sufficient connection strength between the mass and the base should be maintained. When 1 mm ≤ t2 ≤ 2.5 mm, the sensitivity range is also very large, and the mutual restriction of sensitivity and resonance frequency is obvious. To obtain a higher resonance frequency and greater sensitivity, 2 mm ≤ t2 ≤ 2.5 mm was selected.
This paper aims to design a medium-frequency accelerometer with a resonance frequency of about 3000 Hz. While ensuring that the sensor obtains a higher resonance frequency and greater sensitivity, we determined the structure size parameters. The structure and material characteristics of the FBG accelerometer are shown in Table 1. Based on the data in Table 1, the theoretical resonance frequency and sensitivity of the sensor are 2922.1 Hz and 23.1 pm/g, respectively.

3. Simulation Analysis of the Sensor
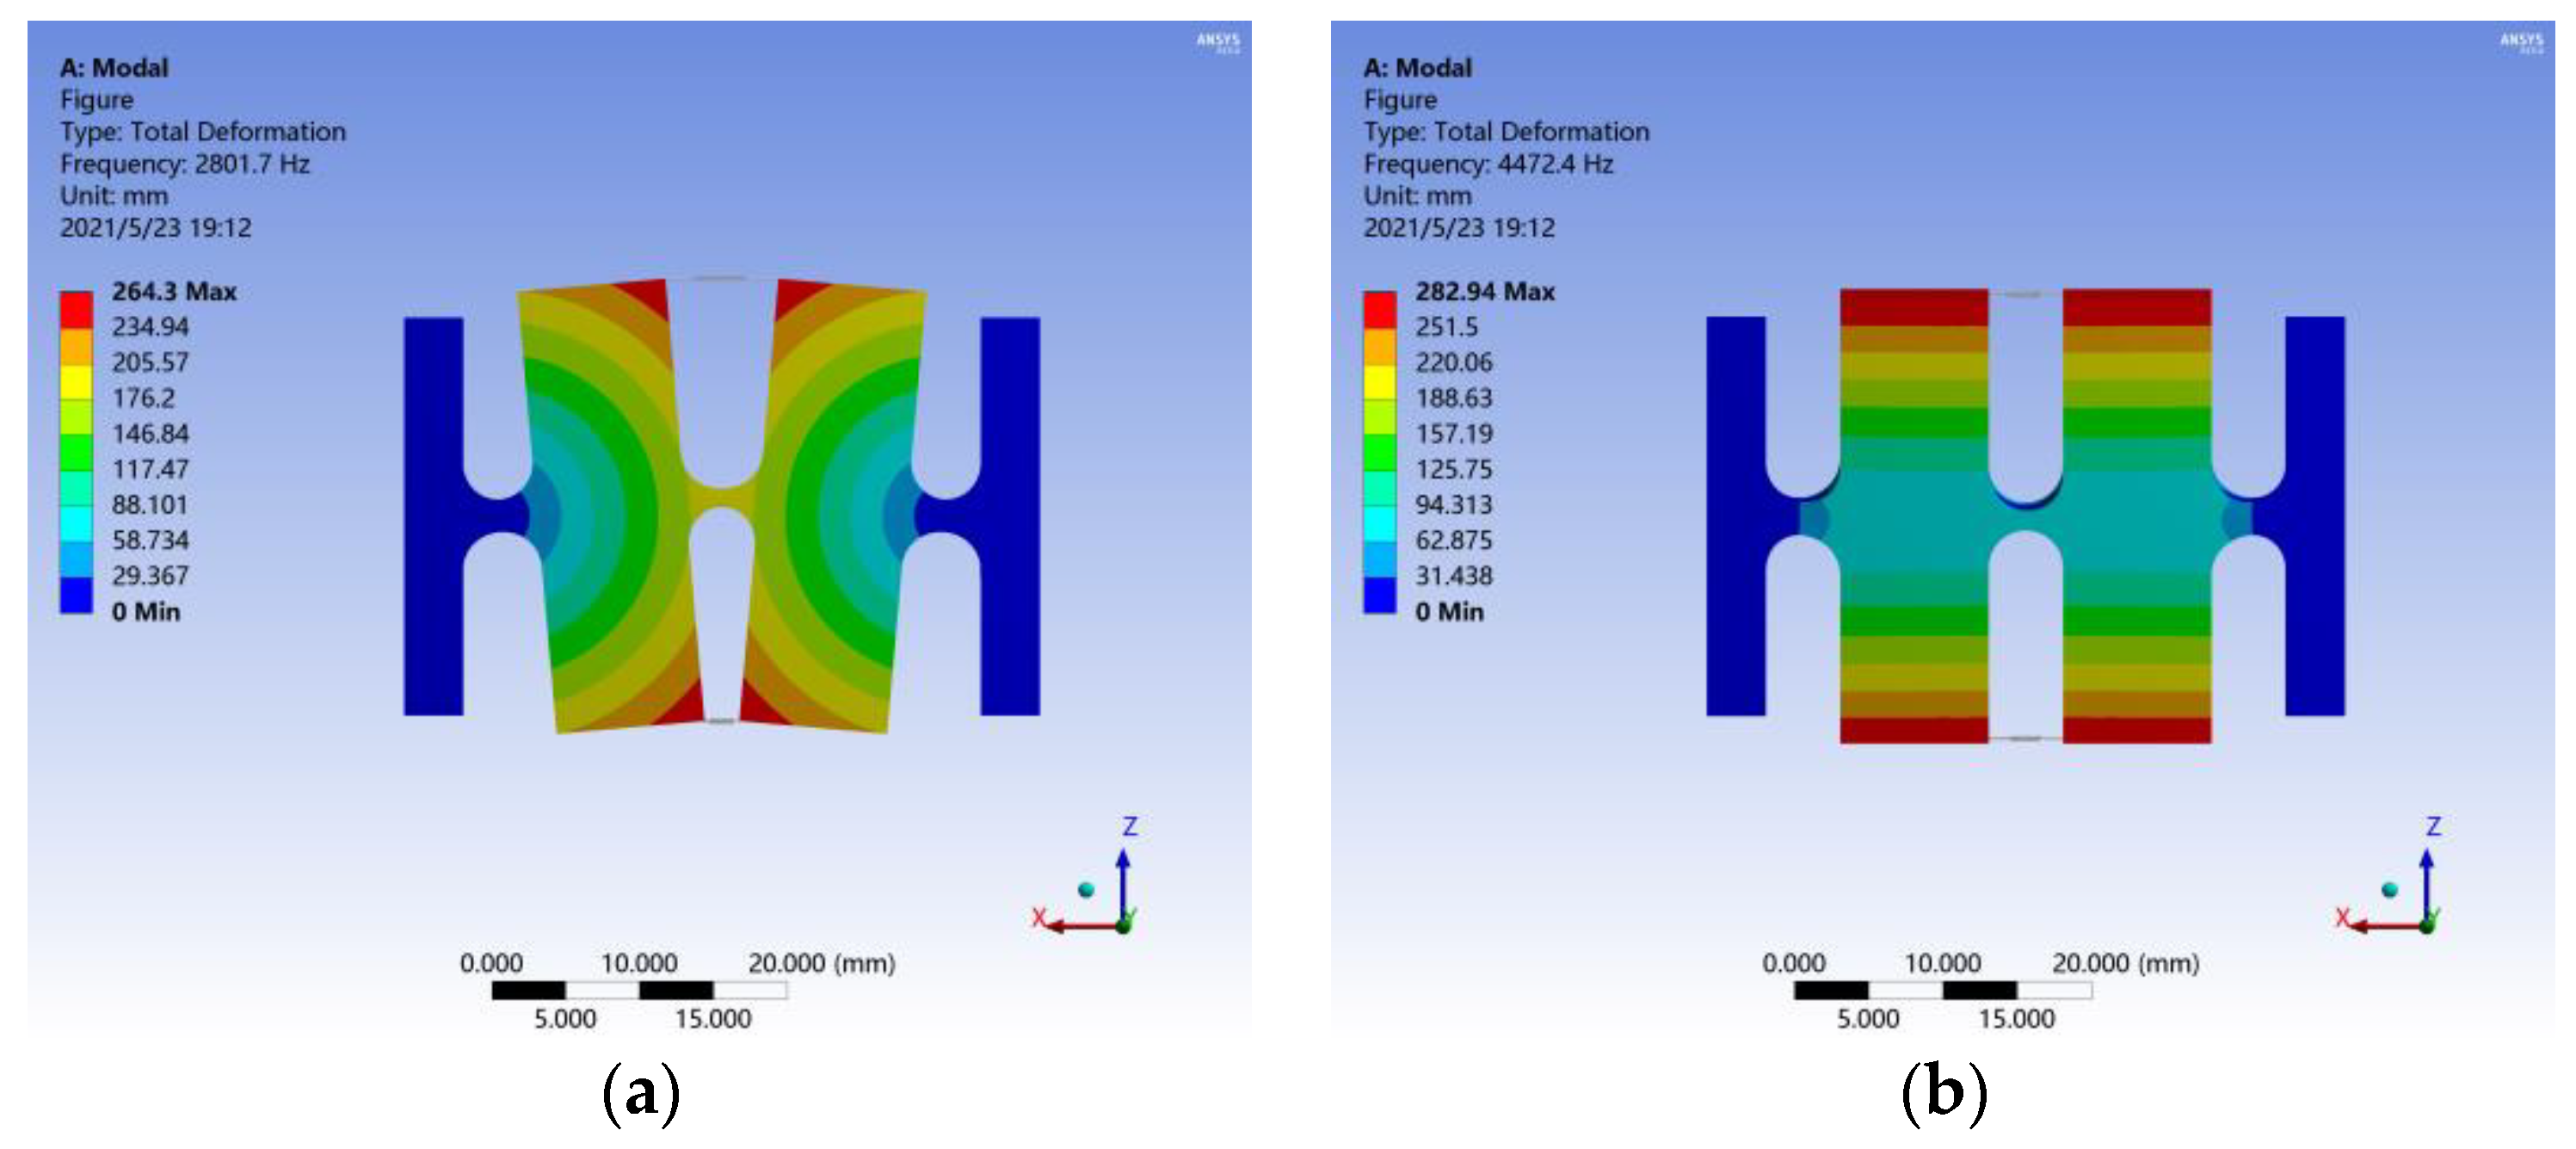
To further study the dynamic characteristics of the sensor, ANSYS software was used to perform analysis for the sensor model. According to the size parameters given in Table 1, a three-dimensional model of the sensor was established through SOILDWORKS software and imported into ANSYS software. The material properties of the model were set according to the material characteristic parameters in Table 1. The hexdominant grid division was complete, with the grid element size being equal to 0.3 mm. Fixed support constraints were imposed on the bases at both ends of the sensor. The optical fiber was modeled by spring constraints with the same elastic coefficient, suspended above and below flexible hinge-1.

3.1. Model Analysis

The model was solved to obtain the sensor’s deformation cloud diagram. As shown in Figure 4a, the first-order model shape involves two masses rotating slightly around the center of the flexible hinge connected to the base. The first-order resonance frequency is 2801.7 Hz, which is quite consistent with the theoretical value (2922.1 Hz). As shown in Figure 4b, the second-order model shape of the sensor involves a lateral vibration of two masses along the y-axis, and the second-order resonance frequency is 4472.4 Hz. These data show that the resonance frequency of the lateral vibration is 59% higher than the main resonance frequency, indicating that the sensor has a strong ability to resist lateral interference.

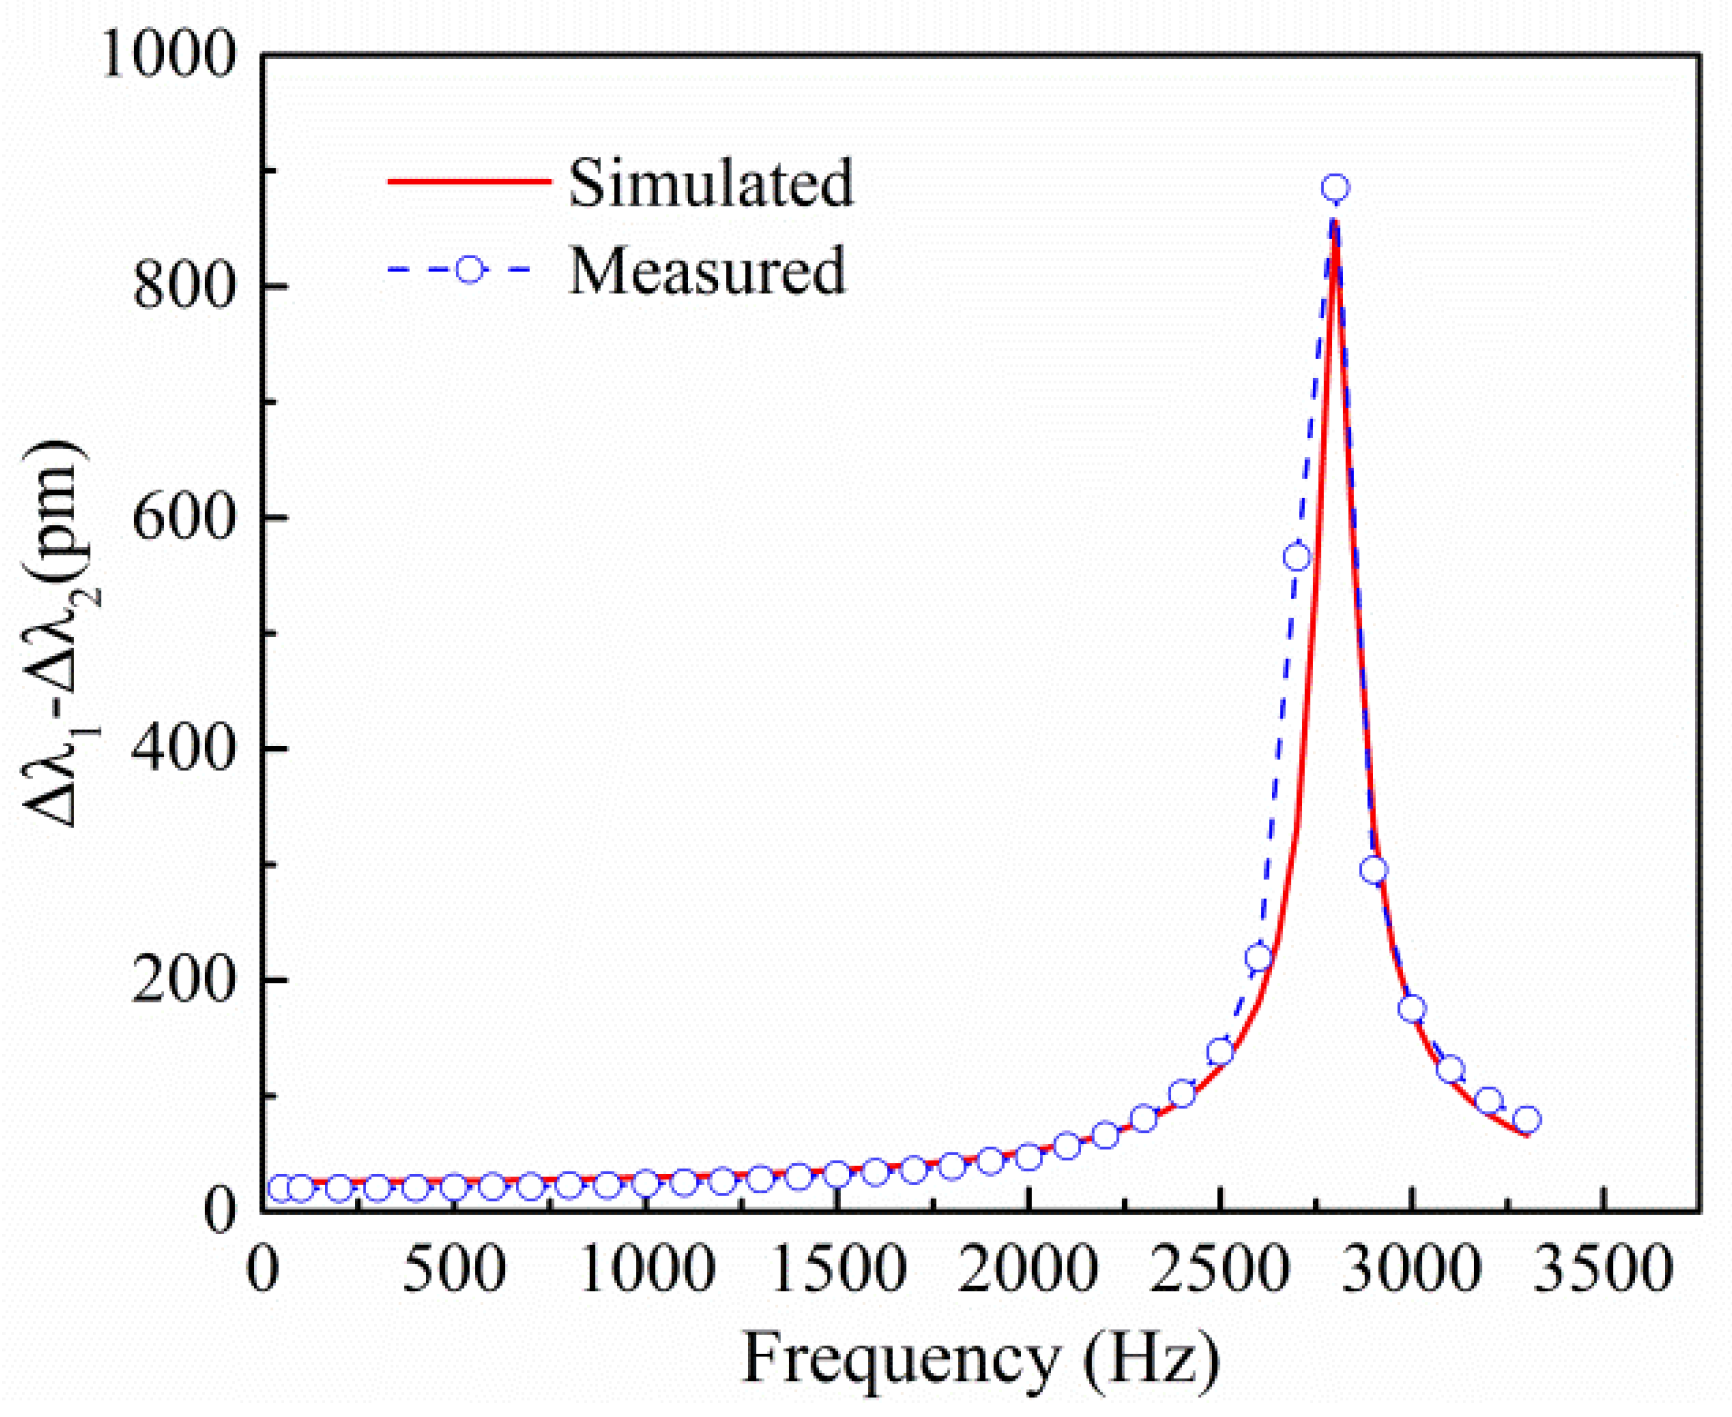
3.2. Harmonic Response Analysis

An excitation acceleration of 1 g was applied along the z-axis of the sensor. The constant damping ratio was set to 0.015. The excitation frequency varied in the range from 50 Hz to 3300 Hz, with a step length of 50 Hz. The maximum displacements of the fiber’s fixed points on top of the masses were calculated and converted into two FBG wavelength shifts (Δλ1–Δλ2). The simulated curve in Figure 5 shows the harmonic response of the sensor, and the first-order resonance frequency is approximately 2800 Hz, which is basically consistent with the theoretical value (2922.1 Hz). At an excitation signal frequency of 50 Hz, the sensor’s sensitivity is 25.7 pm/g, which is basically consistent with the theoretical value (23.1 pm/g).

4. Experimental Characterization of the Sensing Properties

4.1. Fabrication of Sensor

According to the sensor’s structure shown in Figure 1 and the parameters shown in Table 1, the sensor was directly processed into a one-piece structure by a piece of 304 stainless steel, using the slow wire electrical discharge machining (EDM) method. The machining surface of the slow wire EDM method is smooth, and the machining accuracy is high. Two FBGs (silica fiber with an outer diameter of 125 μm, Shenzhen AtGrating., Ltd., Shenzhen, China; 1545.785 nm, 1546.025 nm; 5 mm length, >70% reflectivity) were used. Adhesive 353ND (Epoxy Technology, USA) is a high-temperature-resistant epoxy designed for semiconductor, hybrid, optical fiber and medical applications. To obtain a better paste effect, firstly, about 5 mm of coating was removed at the two sides of the FBG before pasting. Then, the peeled parts were placed on the optical fiber grooves tightly. At the same time, pre-tension was applied to the FBG by hanging a weight of 300 g. When the temperature increased to 120 °C, 353ND epoxy adhesive was applied evenly to the peeled parts on both sides of the FBG, and curing was achieved by heating the epoxy at 120 °C for 15 min. After fabrication, annealing was carried out at 80 °C in an oven before the experiment.

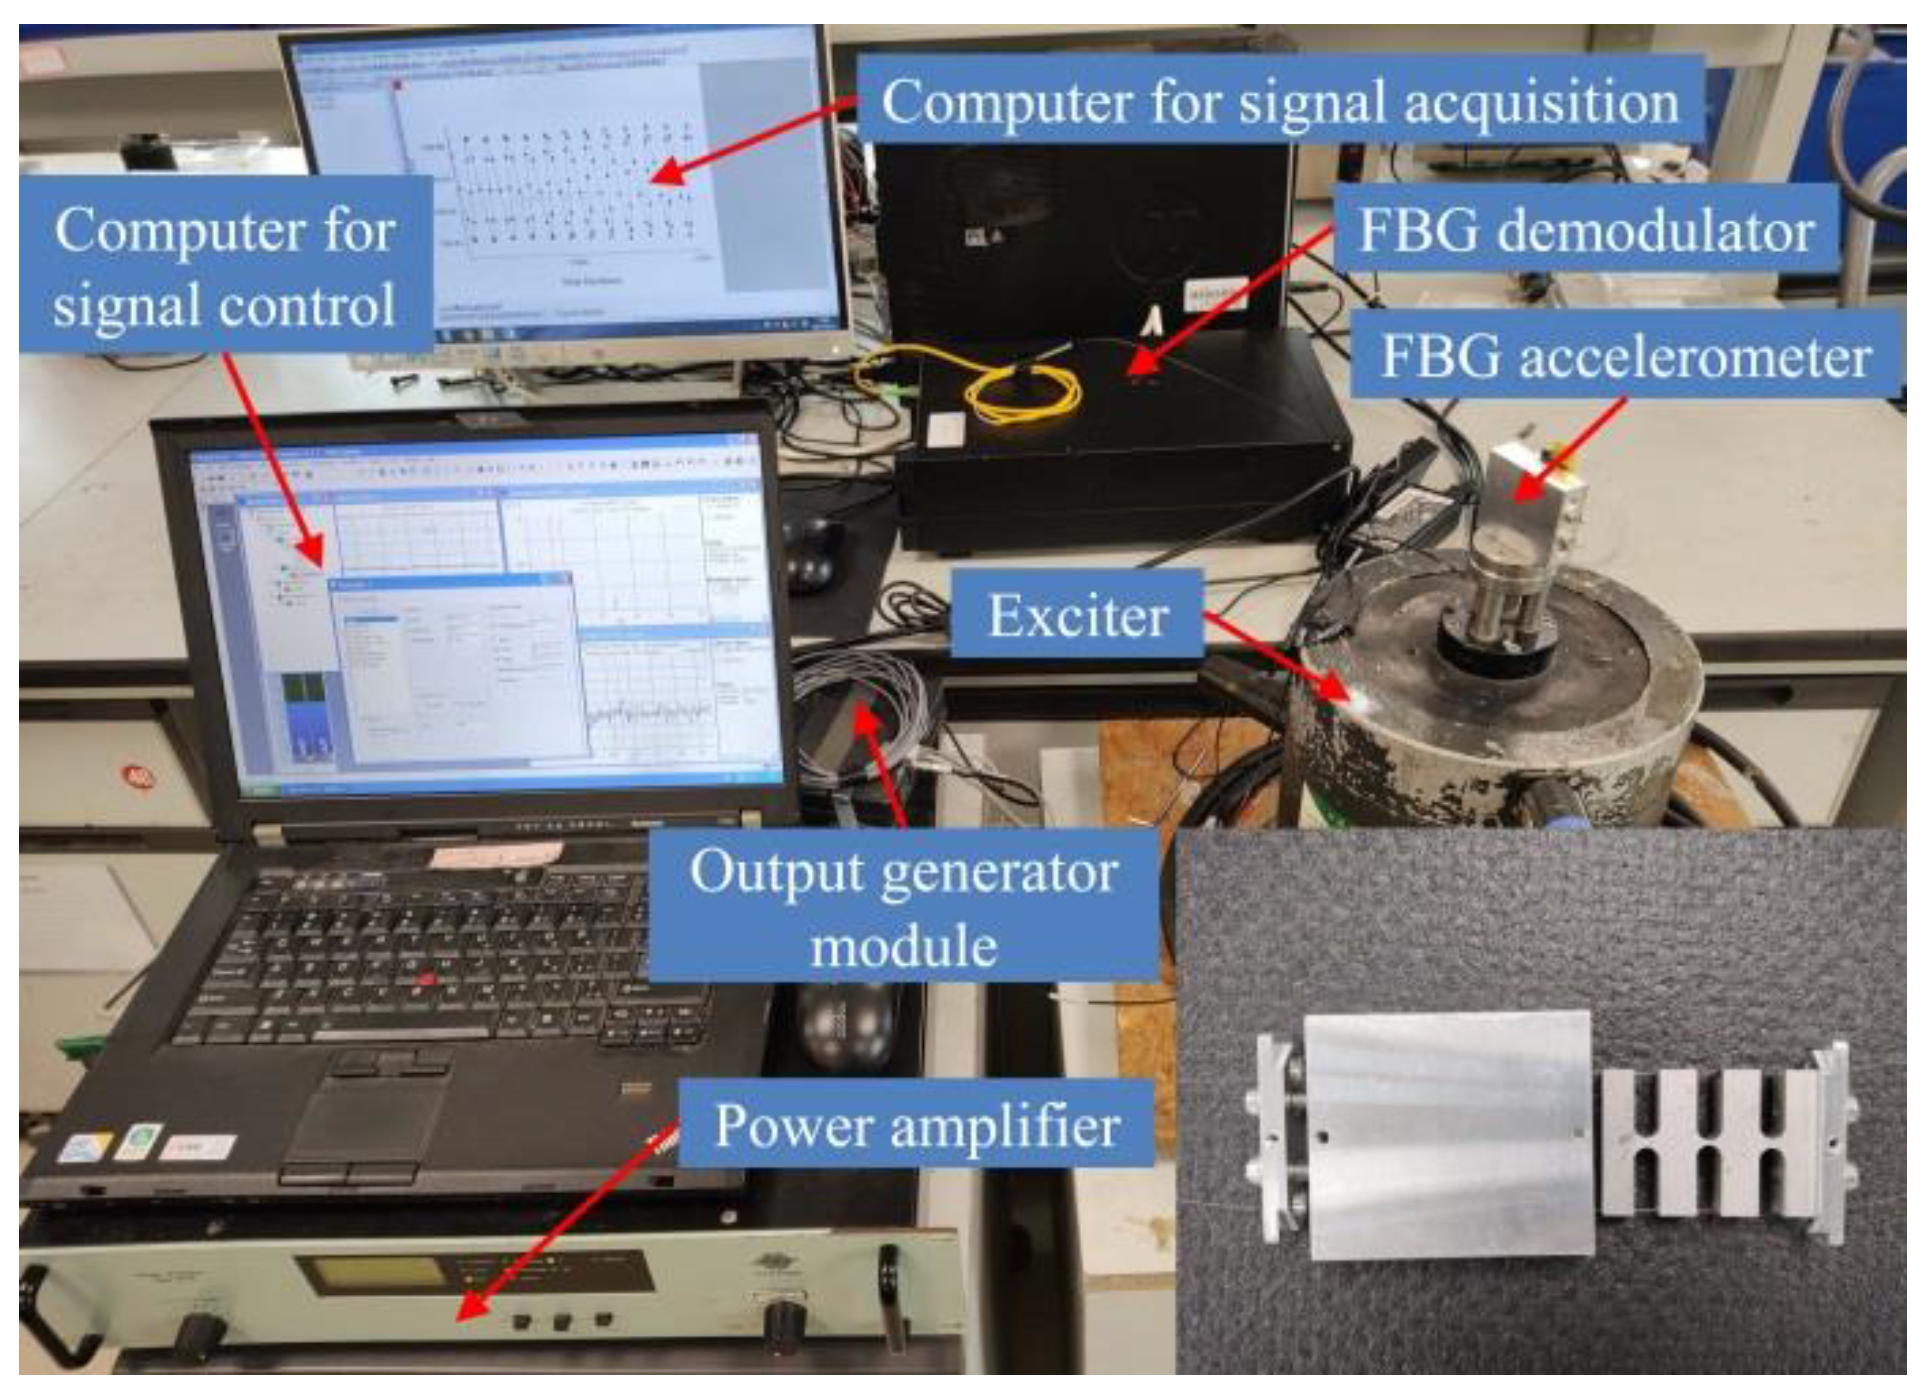
4.2. Experimental System Compositions

The experimental system for the FBG accelerometer is shown in Figure 6. The experimental system consists of the following two parts: a vibration sensing system and a demodulation system. The vibration sensing system (LAN-XI, made by the B&K Company, Copenhagen, Denmark) includes an FBG accelerometer, a vibration exciter, a power amplifier, a standard reference acceleration sensor, and a computer. The computer is responsible for controlling the frequency and amplitude of the vibration exciter. The demodulation system consists of the FBG demodulator and signal acquisition software. The FBG demodulator was self-developed, based on an FPGA-IRS demodulation module produced by BaySpec Inc. The maximum sampling frequency was 8 kHz, and the resolution was 1 pm. The demodulation system is responsible for collecting the central wavelength signal of the reflected light from the sensor grating. The proposed accelerometer was fixed onto the vibration axis of the vibration exciter, and the two FBGs in this accelerometer were connected to the demodulator through an optical fiber. The experiment was carried out at room temperature (25 °C).

4.3. Amplitude-Frequency Response
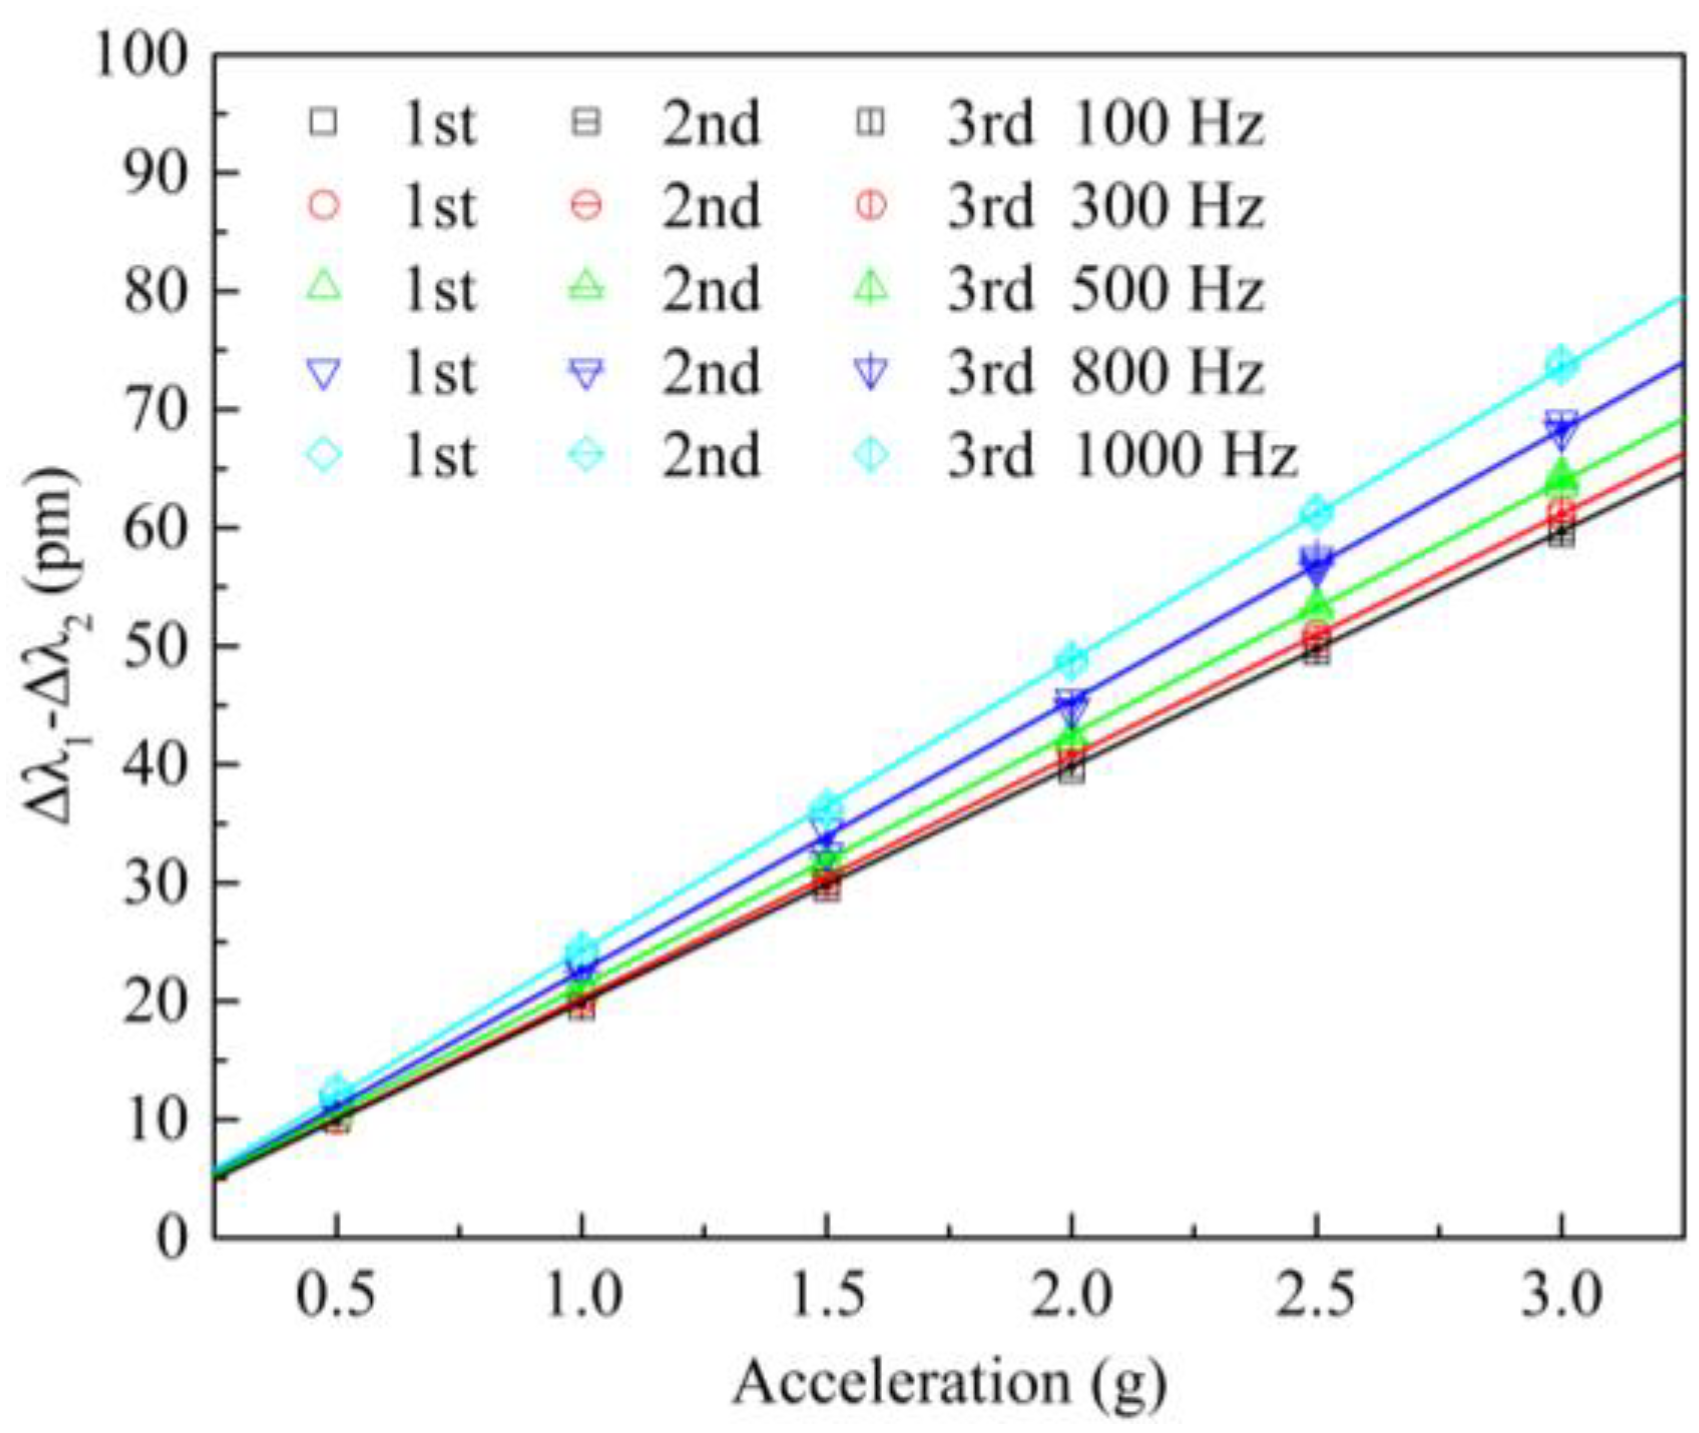
To study the amplitude-frequency characteristics of the sensor, the amplitude of the excitation acceleration was kept at 1 g, and the excitation frequency was varied in the range of 50 Hz to 3300 Hz, with a step of 100 Hz. The relationship between the central wavelength difference (Δλ1–Δλ2) of the two FBGs and the frequency under different excitation frequencies was measured, and the amplitude-frequency response curve is shown in Figure 5. The response curve shows that the resonance frequency of the accelerometer is approximately 2800 Hz, which is basically consistent with the theoretical value (2922.1 Hz) and the finite element simulation data (2801.7 Hz). The amplitude-frequency curve has better flatness below 1000 Hz, and the operating frequency range of the sensor is 50–1000 Hz.

4.4. Sensitivity

In the sensitivity experiment, since the sensor adopts a dual FBG differential structure, the wavelength shift difference (Δλ1–Δλ2) for the two FBGs was selected as the output response. Through the vibration exciter, sinusoidal excitation signals of 100 Hz, 300 Hz, 500 Hz, 800 Hz, and 1000 Hz were given to the sensor, and the acceleration amplitude increased from 0.5 g to 3 g, with a step length of 0.5 g. Each group of experiments was repeated three times. The variations for the wavelength shift difference, with acceleration at different frequencies, are shown in Figure 7—by open square, circles, up-triangles, down-triangles, and diamonds.
The average values of the three sets of experimental data at different frequencies are denoted by solid circles. Progressively, for the average values at each frequency, the least-square fitting method was used to acquire its linear fitting line, which was denoted by solid lines (black, red, green, blue, and cyan). At excitation frequencies of 100 Hz, 300 Hz, 500 Hz, 800 Hz, and 1000 Hz, their slopes, meaning the sensitivities of the sensor, are 19.9 pm/g, 20.4 pm/g, 21.3 pm/g, 22.8 pm/g, and 24.6 pm/g, respectively. These experimental data show that the wavelength shift difference for the sensor has a good linear relationship with the acceleration amplitude. Within the working frequency of 50–1000 Hz, the sensor obtained an average sensitivity of 21.8 pm/g. The main reasons for the difference between theoretical sensitivity and experimental sensitivity are dimensional deviations in the sensor, in its slow wire EDM and packaging.
The Bessel formula was used to calculate the standard deviation. First, all the subsamples’ standard deviations σi were calculated, where i = 1, 2 … N, and N = 6 is the number of calibration points. Then, the standard deviation of the sensor was calculated using σ = 1 N i = 1 N σ i 2 . Finally, the repeatability error was calculated as eR = ησ/λFS, where η = 3, which is the coverage factor, and λFS is the maximum wavelength shift. As shown in Figure 7, when the frequency of the excitation signal is 100 Hz, 300 Hz, 500 Hz, 800 Hz, and 1000 Hz, the repeatability errors for the sensor are 2.7%, 2.4%, 2.7%, 3.3%, and 2.2%, respectively.

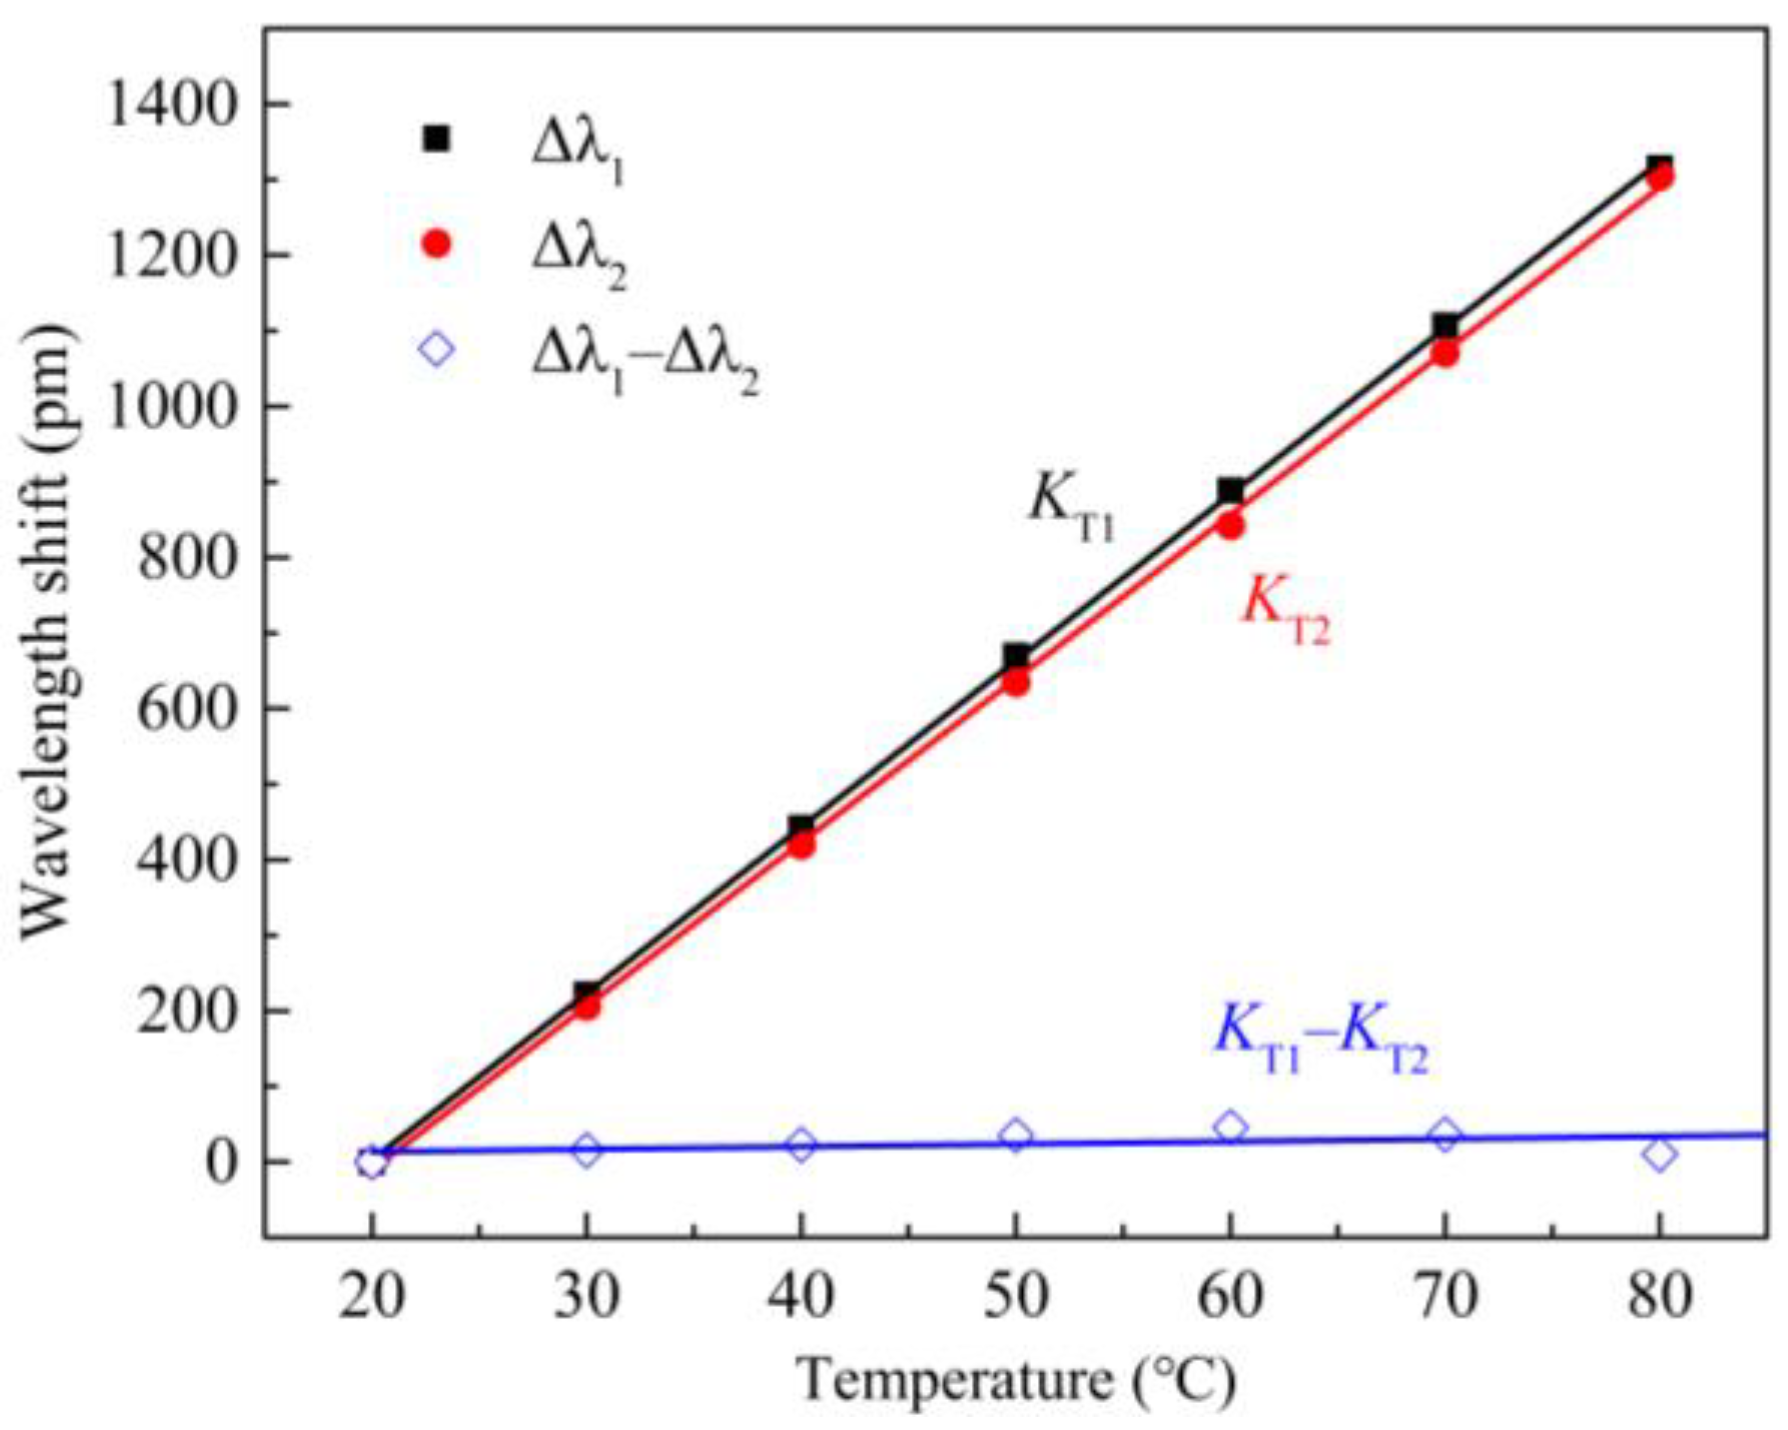
4.5. Temperature Self-Compensation

Since FBGs are sensitive to both strain and temperature, to study the temperature self-compensation performance of the sensor, a temperature control box (SDEI, SDJ402F, adjustment range of 10–200 °C, resolution of 0.01 °C, measurement accuracy of 0.05 °C) was used to test the sensor. The sensor was placed in the temperature control box, and the temperature was adjusted from 20 °C to 80 °C, in steps of 10 °C. The central wavelength shift was measured for the two FBGs at different temperatures, and the temperature response curves obtained for Δλ1, Δλ2, and Δλ1–Δλ2 are shown in Figure 8. The temperature sensitivity coefficients for FBG-1 and FBG-2 are KT1 = 22.01 pm/°C and KT2 = 21.67 pm/°C, respectively, and their linear correlation coefficients are 0.999. The experimental results show that the sensitivity coefficients for the two FBGs are basically the same, and the sensor has good temperature self-compensation capability.

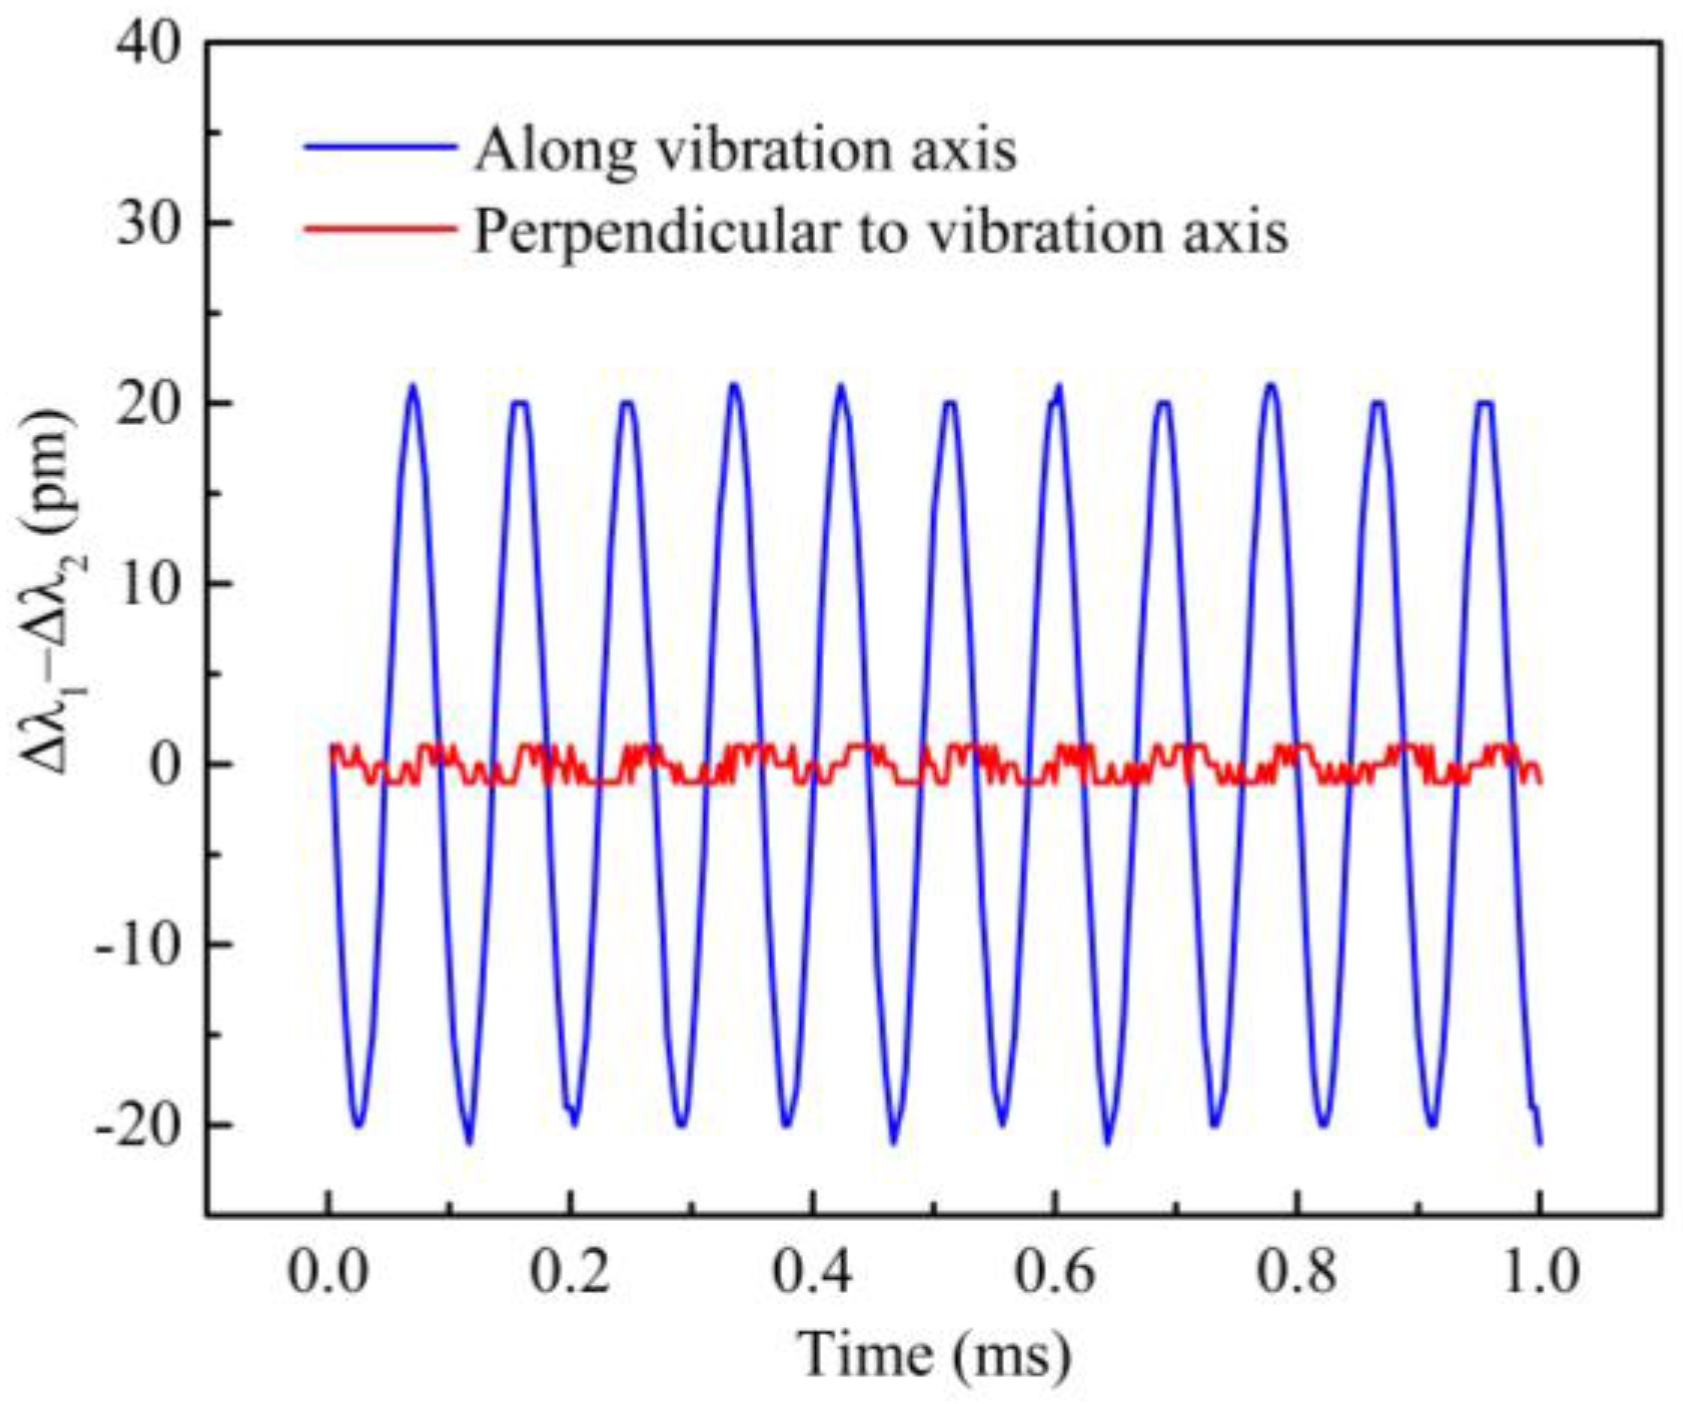
4.6. Cross-Interference Characteristic

Anti-interference ability is also an important indicator for accelerometers, so an anti-interference experiment was also finished, where the sensor was fixed onto the vibration exciter along the main axis of the vibration exciter and in its vertical direction, respectively. A sinusoidal excitation signal, with frequency of 300 Hz and amplitude of 1 g, was applied to the sensor. The wavelength shift differences of the sensor were obtained in the main and lateral directions, as shown in Figure 9. The peak–peak value of the central wavelength difference for the sensing in the main direction is about 41 pm, but the peak–peak value in the lateral direction does not exceed 2 pm; therefore, the lateral interference degree for the sensor is less than 5%, which shows that the designed sensor has a good anti-interference ability.
Table 2 gives a characteristics comparison of the proposed medium–high-frequency FBG accelerometer with other FBG accelerometers, based on different structures, including resonance frequency, sensitivity, FBG type, and temperature self-compensation capabilities.

5. Conclusions

A novel medium-frequency FBG accelerometer, based on two FBGs, three flexible hinges, and two inertial mass blocks, was designed and prepared. Theoretical analysis and finite element simulation were used to determine the optimal parameters of the sensor. The sensing experiments show that the proposed sensor had a resonance frequency of about 2800 Hz and a sensitivity of 21.8 pm/g in the flat frequency range of 50–1000 Hz. The sensor’s resonance frequency and sensitivity, given by theoretical analysis, finite element simulation, and sensing experiments, are basically consistent. In addition, the experiments also show that the sensor has a good temperature self-compensation function (temperature sensitivity KT1KT2 ≈ 0.34 pm/°C) and lateral anti-interference capability (lateral interference degree is less than 5%). These performances provide a novel and reliable method for the engineering application of medium-frequency FBG acceleration sensors.

Author Contributions

Conceptualization and methodology, Z.L.; validation and formal analysis, Z.L.; data curation, Z.L. and Z.S.; writing—original draft preparation, Z.L.; writing—review and editing, L.L., H.W., S.D. and K.J. All authors have read and agreed to the published version of the manuscript.

Funding

This work was supported in part by the Provincial Science and Technology Innovation Strategy Project of Zhongshan under Grant 2019sdr001 and in part by the Optical Fiber Sensing Submarine Cable System for Deep-Sea Riser Safety Monitoring under Grant SKJC-2020-01-016.

Institutional Review Board Statement

Not applicable.

Informed Consent Statement

Not applicable.

Data Availability Statement

Not applicable.

Conflicts of Interest

The authors declare no conflict of interest.

References

  1. Baccarini, L.M.R.; Silva, V.V.R.; Menezes, B.R.; Caminhas, W.M. SVM practical industrial application for mechanical faults diagnostic. Expert Syst. Appl. 2011, 38, 6980–6984. [Google Scholar] [CrossRef]
  2. Li, P.; Kong, F.; He, Q.; Liu, Y. Multiscale slope feature extraction for rotating machinery fault diagnosis using wavelet analysis. Measurement 2013, 46, 497–505. [Google Scholar] [CrossRef]
  3. Safizadeh, M.S.; Latifi, S.K. Using multi-sensor data fusion for vibration fault diagnosis of rolling element bearings by accelerometer and load cell. Inf. Fusion. 2014, 18, 1–8. [Google Scholar] [CrossRef]
  4. Catalano, A.; Bruno, F.A.; Pisco, M.; Cutolo, A.; Cusano, A. An Intrusion Detection System for the Protection of Railway Assets Using Fiber Bragg Grating Sensors. Sensors 2014, 14, 18268–18285. [Google Scholar] [CrossRef] [PubMed]
  5. Ye, X.W.; Su, Y.H.; Xi, P.S. Statistical Analysis of Stress Signals from Bridge Monitoring by FBG System. Sensors 2018, 18, 491. [Google Scholar] [CrossRef] [Green Version]
  6. Qiao, X.; Shao, Z.; Bao, W.; Rong, Q. Fiber Bragg Grating Sensors for the Oil Industry. Sensors 2017, 17, 429. [Google Scholar] [CrossRef] [PubMed]
  7. Shen, J.; Zeng, X.; Luo, Y.; Cao, C.; Wang, T. Research on Strain Measurements of Core Positions for the Chinese Space Station. Sensors 2018, 18, 1834. [Google Scholar] [CrossRef] [PubMed] [Green Version]
  8. Goossens, S.; Pauw, B.D.; Geernaert, T.; Salmanpour, M.S.; Khodaei, Z.S.; Karachalios, E.; Castillo, D.S.; Thienpont, H.; Berghmans, F. Aerospace-grade surface mounted optical fibre strain sensor for structural health monitoring on composite structures evaluated against in-flight conditions. Smart Mater. Struct. 2019, 28, 065008. [Google Scholar] [CrossRef]
  9. Antunes, P.; Lima, H.; Varum, H.; André, P. Optical fiber sensors for static and dynamic health monitoring of civil engineering infrastructures: Abode wall case study. Measurement 2012, 45, 1695–1705. [Google Scholar] [CrossRef]
  10. Linessio, R.P.; Sousa, K.D.; Silva, T.D.; Bavastri, C.A.; Antunes, P.F.D.; Silva, J.C.C. Induction Motors Vibration Monitoring Using a Biaxial Optical Fiber Accelerometer. IEEE Sens. J. 2016, 16, 8075–8082. [Google Scholar] [CrossRef]
  11. Zhang, Z.; Liu, C.; Li, H.; He, Z.; Zhao, X. Optical fiber grating vibration sensor for vibration monitoring of hydraulic pump. Photonic Sens. 2018, 7, 140–147. [Google Scholar] [CrossRef] [Green Version]
  12. Yüksel, K.; Kinet, D.; Moeyaert, V.; Kouroussis, G.; Caucheteur, C. Railway monitoring system using optical fiber grating accelerometers. Smart Mater. Struct. 2018, 27, 105033. [Google Scholar] [CrossRef]
  13. Lim, K.S.; Zaini, M.K.A.; Ong, Z.C.; Abas, F.Z.M.; Salim, M.A.B.M.; Ahmad, H. Vibration Mode Analysis for a Suspension Bridge by Using Low-Frequency Cantilever-Based FBG Accelerometer Array. IEEE Trans. Instrum. Meas. 2021, 70, 1–8. [Google Scholar] [CrossRef]
  14. Liu, Q.; Jia, Z.; Fu, H.; Yu, D.; Gao, H.; Qiao, X. Double Cantilever Beams Accelerometer Using Short Fiber Bragg Grating for Eliminating Chirp. IEEE Sens. J. 2016, 16, 6611–6616. [Google Scholar] [CrossRef]
  15. Parida, O.P.; Thomas, J.; Nayak, J.; Asokan, S. Double-L Cantilever-Based Fiber Bragg Grating Accelerometer. IEEE Sens. J. 2019, 19, 11247–11254. [Google Scholar] [CrossRef]
  16. Udos, W.; Lee, Y.-S.; Lim, K.-S.; Ong, Z.-C.; Zaini, M.K.A.; Ahmad, H. Signal enhancement of FBG-based cantilever accelerometer by resonance suppression using magnetic damper. Sens. Actuators A 2020, 304, 111895. [Google Scholar] [CrossRef]
  17. Li, S.; Feng, Z.; Ma, Q.; Wang, R.; Zhou, R.; Qiao, X. Fiber Bragg grating accelerometer based on symmetrical tilting cantilever beams and solder glass packaging for harsh environment. Opt. Fiber Technol. 2021, 65, 102579. [Google Scholar] [CrossRef]
  18. Zhao, X.; Jia, Z.; Fan, W.; Liu, W.; Gao, H.; Yang, K.; Yu, D. A Fiber Bragg Grating acceleration sensor with temperature compensation. Optik 2021, 241, 166993. [Google Scholar] [CrossRef]
  19. Liu, Q.; He, X.; Qiao, X.; Sun, T.; Grattan, K.T.V. Design and Modeling of a High Sensitivity Fiber Bragg Grating-Based Accelerometer. IEEE Sens. J. 2019, 19, 5439–5445. [Google Scholar] [CrossRef]
  20. Li, T.; Tan, Y.; Han, X.; Zheng, K.; Zhou, Z. Diaphragm Based Fiber Bragg Grating Acceleration Sensor with Temperature Compensation. Sensors 2017, 17, 218. [Google Scholar] [CrossRef] [Green Version]
  21. Zhang, F.; Jiang, S.; Wang, C.; Ni, J.; Zhao, Q. Broadband and High Sensitivity FBG Accelerometer Based on Double Diaphragms and h-Shaped Hinges. IEEE Sens. J. 2021, 21, 353–359. [Google Scholar] [CrossRef]
  22. Qiu, L.; Liang, L.; Li, D.; Xu, G. Theoretical and experimental study on FBG accelerometer based on multi-flexible hinge mechanism. Opt. Fiber Technol. 2017, 38, 142–146. [Google Scholar] [CrossRef]
  23. Zhang, Y.; Zhang, W.; Zhang, Y.; Chen, L.; Yan, T.; Wang, S.; Yu, L.; Li, Y.P. 2-D Medium–High Frequency Fiber Bragg Gratings Accelerometer. IEEE Sens. J. 2017, 17, 614–618. [Google Scholar] [CrossRef]
  24. Song, H.; Wang, Q.; Liu, M.; Cai, Q. A Novel Fiber Bragg Grating Vibration Sensor Based on Orthogonal Flexure Hinge Structure. IEEE Sens. J. 2020, 20, 5277–5285. [Google Scholar] [CrossRef]
  25. Yan, B.; Liang, L. A Novel Fiber Bragg Grating Accelerometer Based on Parallel Double Flexible Hinges. IEEE Sens. J. 2020, 20, 4713–4718. [Google Scholar] [CrossRef]
  26. Wei, L.; Yu, L.; Wang, J.; Jiang, D.; Liu, Q.; Liu, Z. An FBG-Sensing Two-Dimensional Vibration Sensor Based on Multi-Axis Flexure Hinge. IEEE Sens. J. 2019, 19, 3698–3710. [Google Scholar] [CrossRef]
  27. Wang, H.; Liang, L.; Zhou, X.; Tu, B. New Fiber Bragg Grating Three-Dimensional Accelerometer Based on Composite Flexure Hinges. Sensors 2021, 21, 4715. [Google Scholar] [CrossRef]
  28. Stefani, A.; Andresen, S.; Yuan, W.; Herholdt-Rasmussen, N.; Bang, O. High sensitivity polymer optical fiber-Bragg-grating-based accelerometer. IEEE Sens. J. 2012, 24, 763–765. [Google Scholar] [CrossRef]
  29. Dai, Y.; Yin, G.; Liu, B.; Xu, G.; Karanja, J.M. Medium-high frequency FBG accelerometer with integrative matrix structure. Appl. Opt. 2015, 54, 3115–3121. [Google Scholar] [CrossRef]
  30. Guo, Y.; Zhang, D.; Zhou, Z.; Xiong, L.; Deng, X. Welding-packaged accelerometer based on metal-coated FBG. Chin. Opt. Lett. 2013, 11, 070604. [Google Scholar]
  31. Wang, X.; Guo, Y.; Xiong, L.; Wu, H. High-Frequency Optical Fiber Bragg Grating Accelerometer. IEEE Sens. J. 2018, 18, 4954–4960. [Google Scholar] [CrossRef]
  32. Wu, H.; Lin, Q.; Han, F.; Zhao, L.; Jiang, Z. Design and analysis of high-frequency fiber Bragg grating vibration sensor. Meas. Sci. Technol. 2021, 32, 025108. [Google Scholar] [CrossRef]
  33. Wu, Y.F.; Zhou, Z.Y. Design of flexure hinges. Eng. Mech. 2002, 19, 136–140. [Google Scholar]
Figure 1. Structural diagram of the FBG accelerometer.
Sensors 21 06968 g001
Figure 2. Mechanical model of the FBG accelerometer.
Sensors 21 06968 g002
Figure 3. Dependence relationship of the resonance frequency and sensitivity on the (a) radius of hinge-2 (r2), (b) waist thickness of hinge-1 (t1), and (c) waist thickness of hinge-2 (t2).
Sensors 21 06968 g003
Figure 4. Model analysis results for the FBG accelerometer: (a) first-order and (b) second-order.
Sensors 21 06968 g004
Figure 5. Amplitude-frequency response curves for the sensor.
Sensors 21 06968 g005
Figure 6. FBG accelerometer experimental system.
Sensors 21 06968 g006
Figure 7. Wavelength shift difference versus acceleration amplitude at different excitation frequencies.
Sensors 21 06968 g007
Figure 8. Temperature responses and self-compensation for the FBG accelerometer.
Sensors 21 06968 g008
Figure 9. Wavelength shift difference of the sensor when the vibration is along or perpendicular to the vibration axis of exciter.
Sensors 21 06968 g009
Table 1. Parameters for the FBG accelerometer structure and material properties.
ParameterParameter DescriptionValue (Units)
r1Radius of hinge-12.5 mm
t1Waist thickness of hinge-11.2 mm
r2Radius of hinge-22.5 mm
t2Waist thickness of hinge-22.2 mm
dWidth of mass block10 mm
hHeight of mass block30 mm
wWidth of hinges8 mm
lFiber pasting span5 mm
AfSection area of optical fiber1.227 × 10−8 m2
EfYoung’s modulus of optical fiber70 GPa
EYoung’s modulus of 304 steel210 GPa
ρDensity of 304 steel7850 kg·m−3
μPoisson’s ratio of 304 steel0.3
gGravitational acceleration9.8 m·s−2
Table 2. Summary of the characteristics of reported medium–highfrequency FBG accelerometers.
RefResonance FrequencySensitivityFiber TypeTemperature Self-Compensation
Stefani [28]3000 Hz19 pm/gPolymer FBGNo
Dai [29]2918 Hz13.82 pm/gSilica FBGNo
Guo [30]3600 Hz1.7 pm/gMetalized FBGNo
Wang [31]3806 Hz4.01 pm/gSilica FBGYes
Wu [32]8356 Hz0.46 pm/gSilica FBGYes
This article2800 Hz21.8 pm/gSilica FBGYes
Publisher’s Note: MDPI stays neutral with regard to jurisdictional claims in published maps and institutional affiliations.

