
Characterization of Leg Push Forces and Their Relationship to Velocity in On-Water Sprint Kayaking


Abstract
:1. Introduction
2. Materials and Methods
2.1. Participants
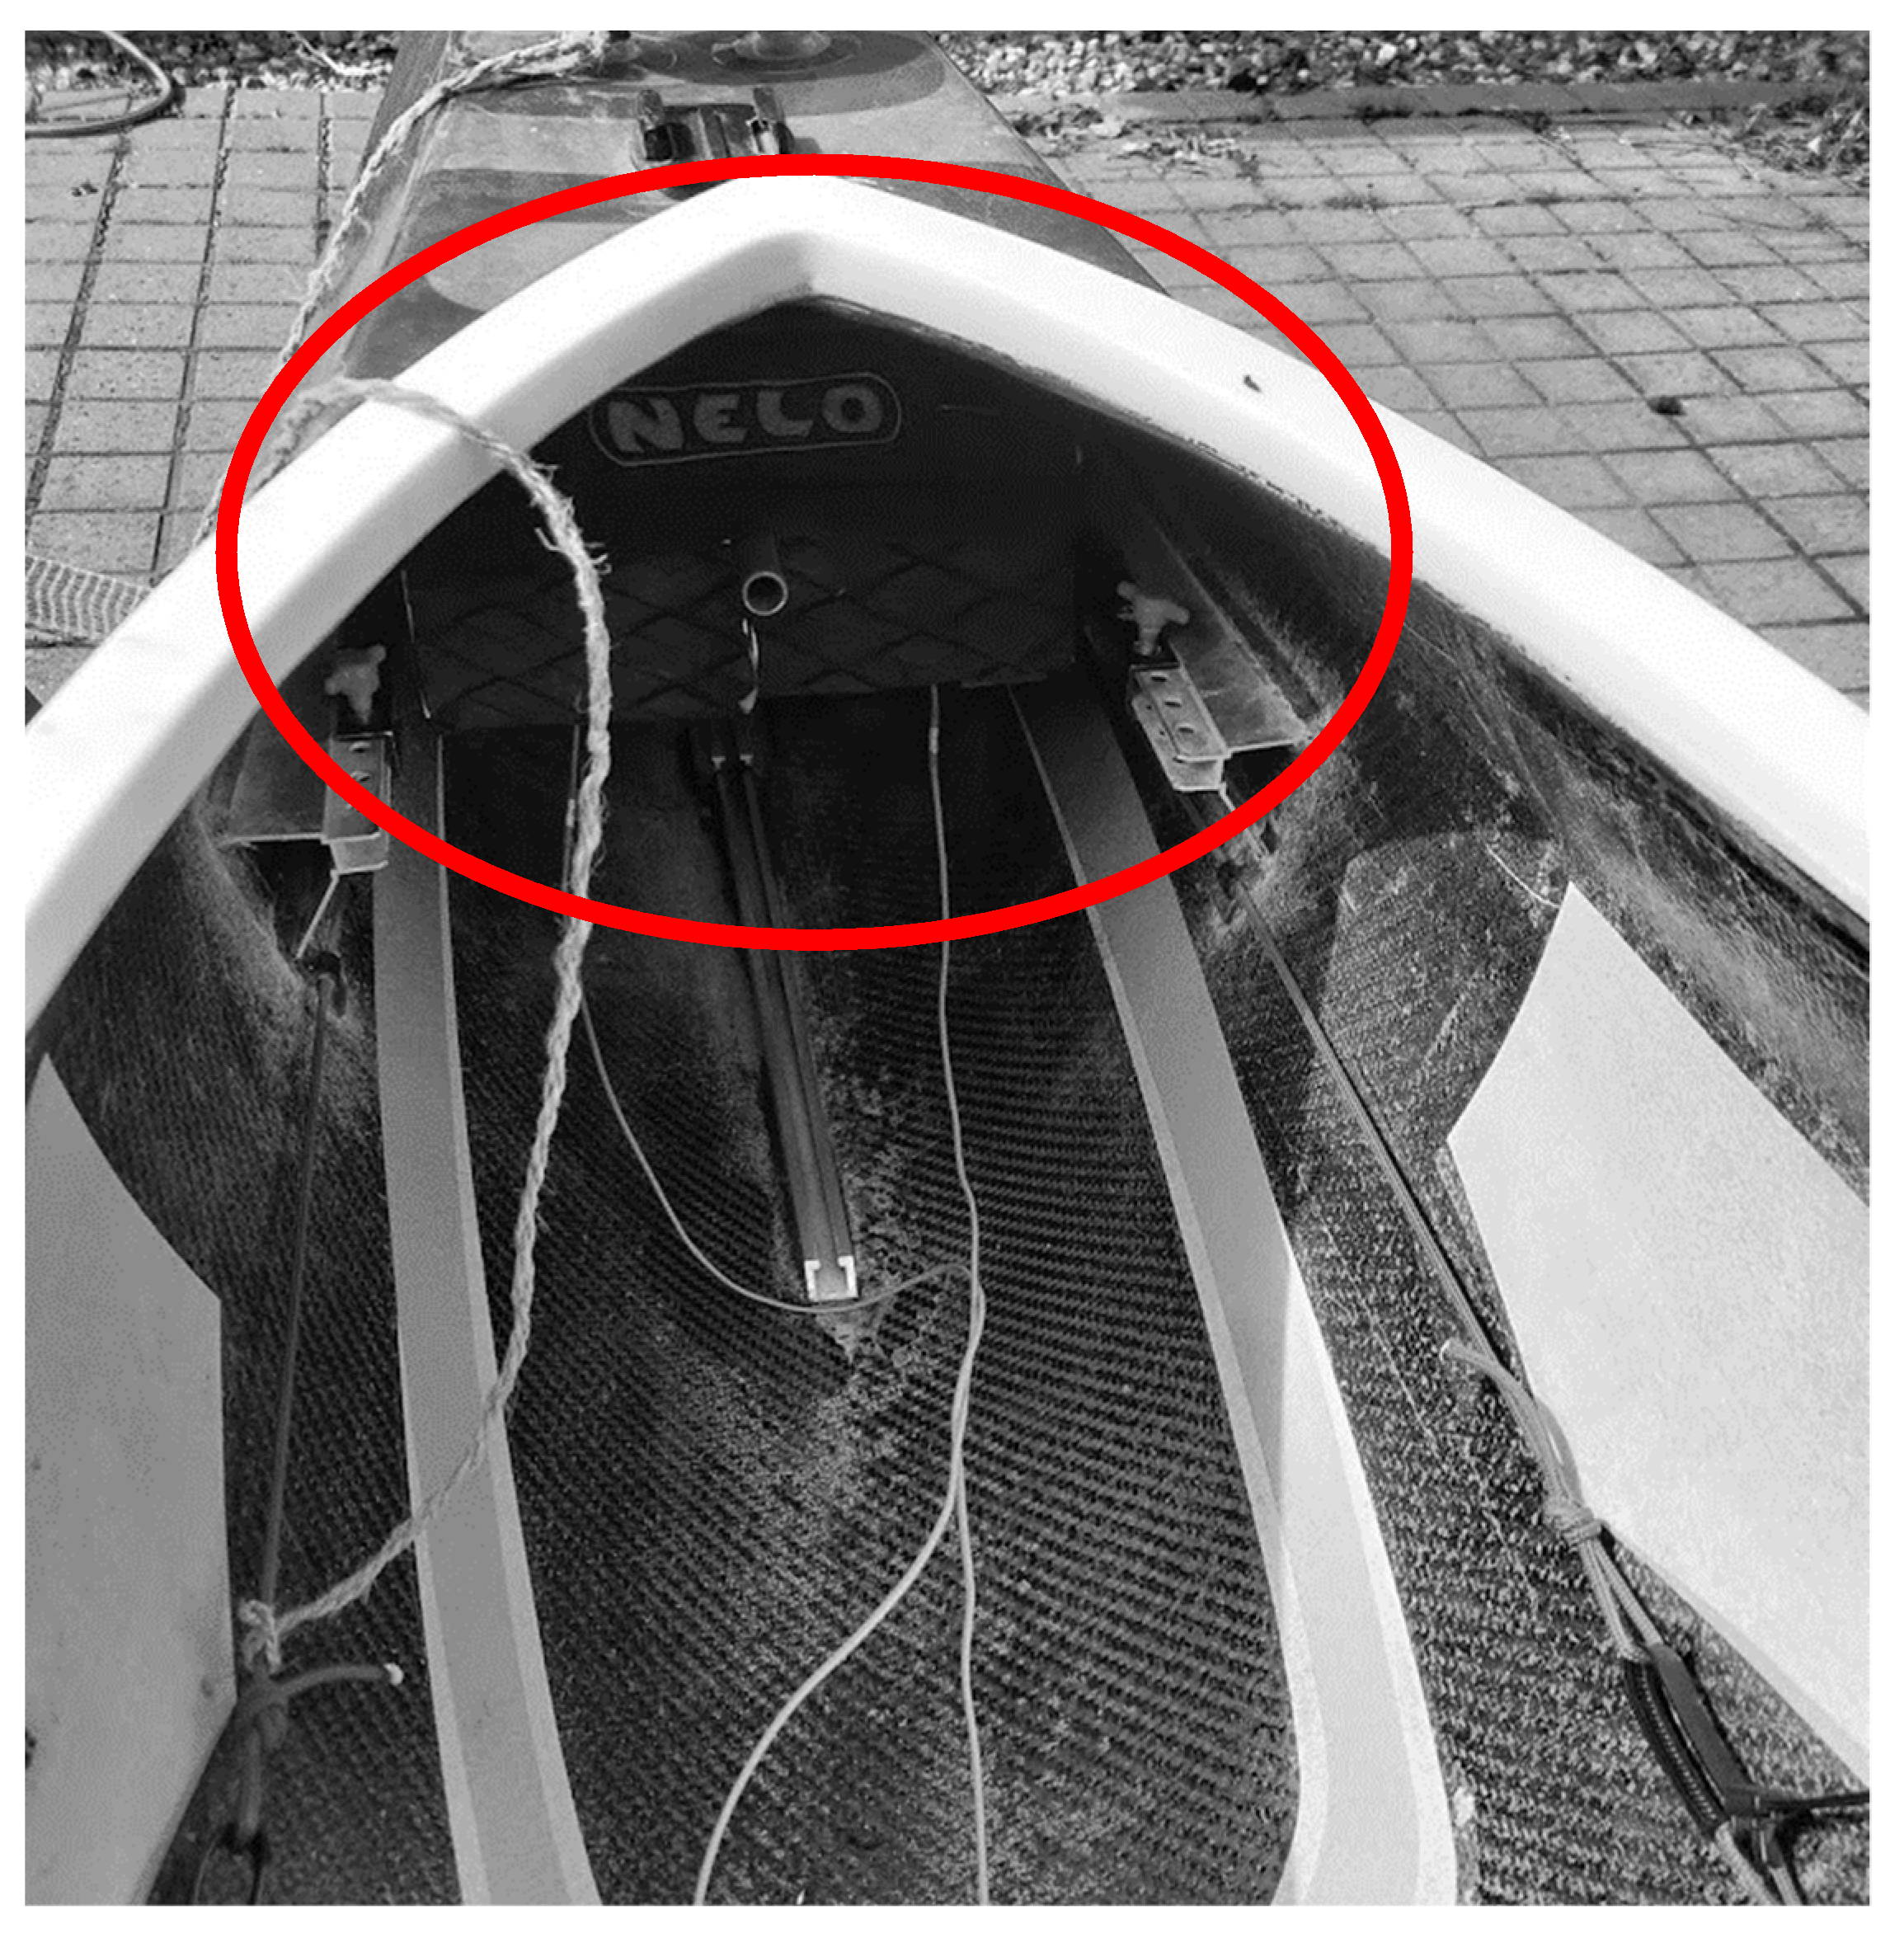
2.2. Equipment
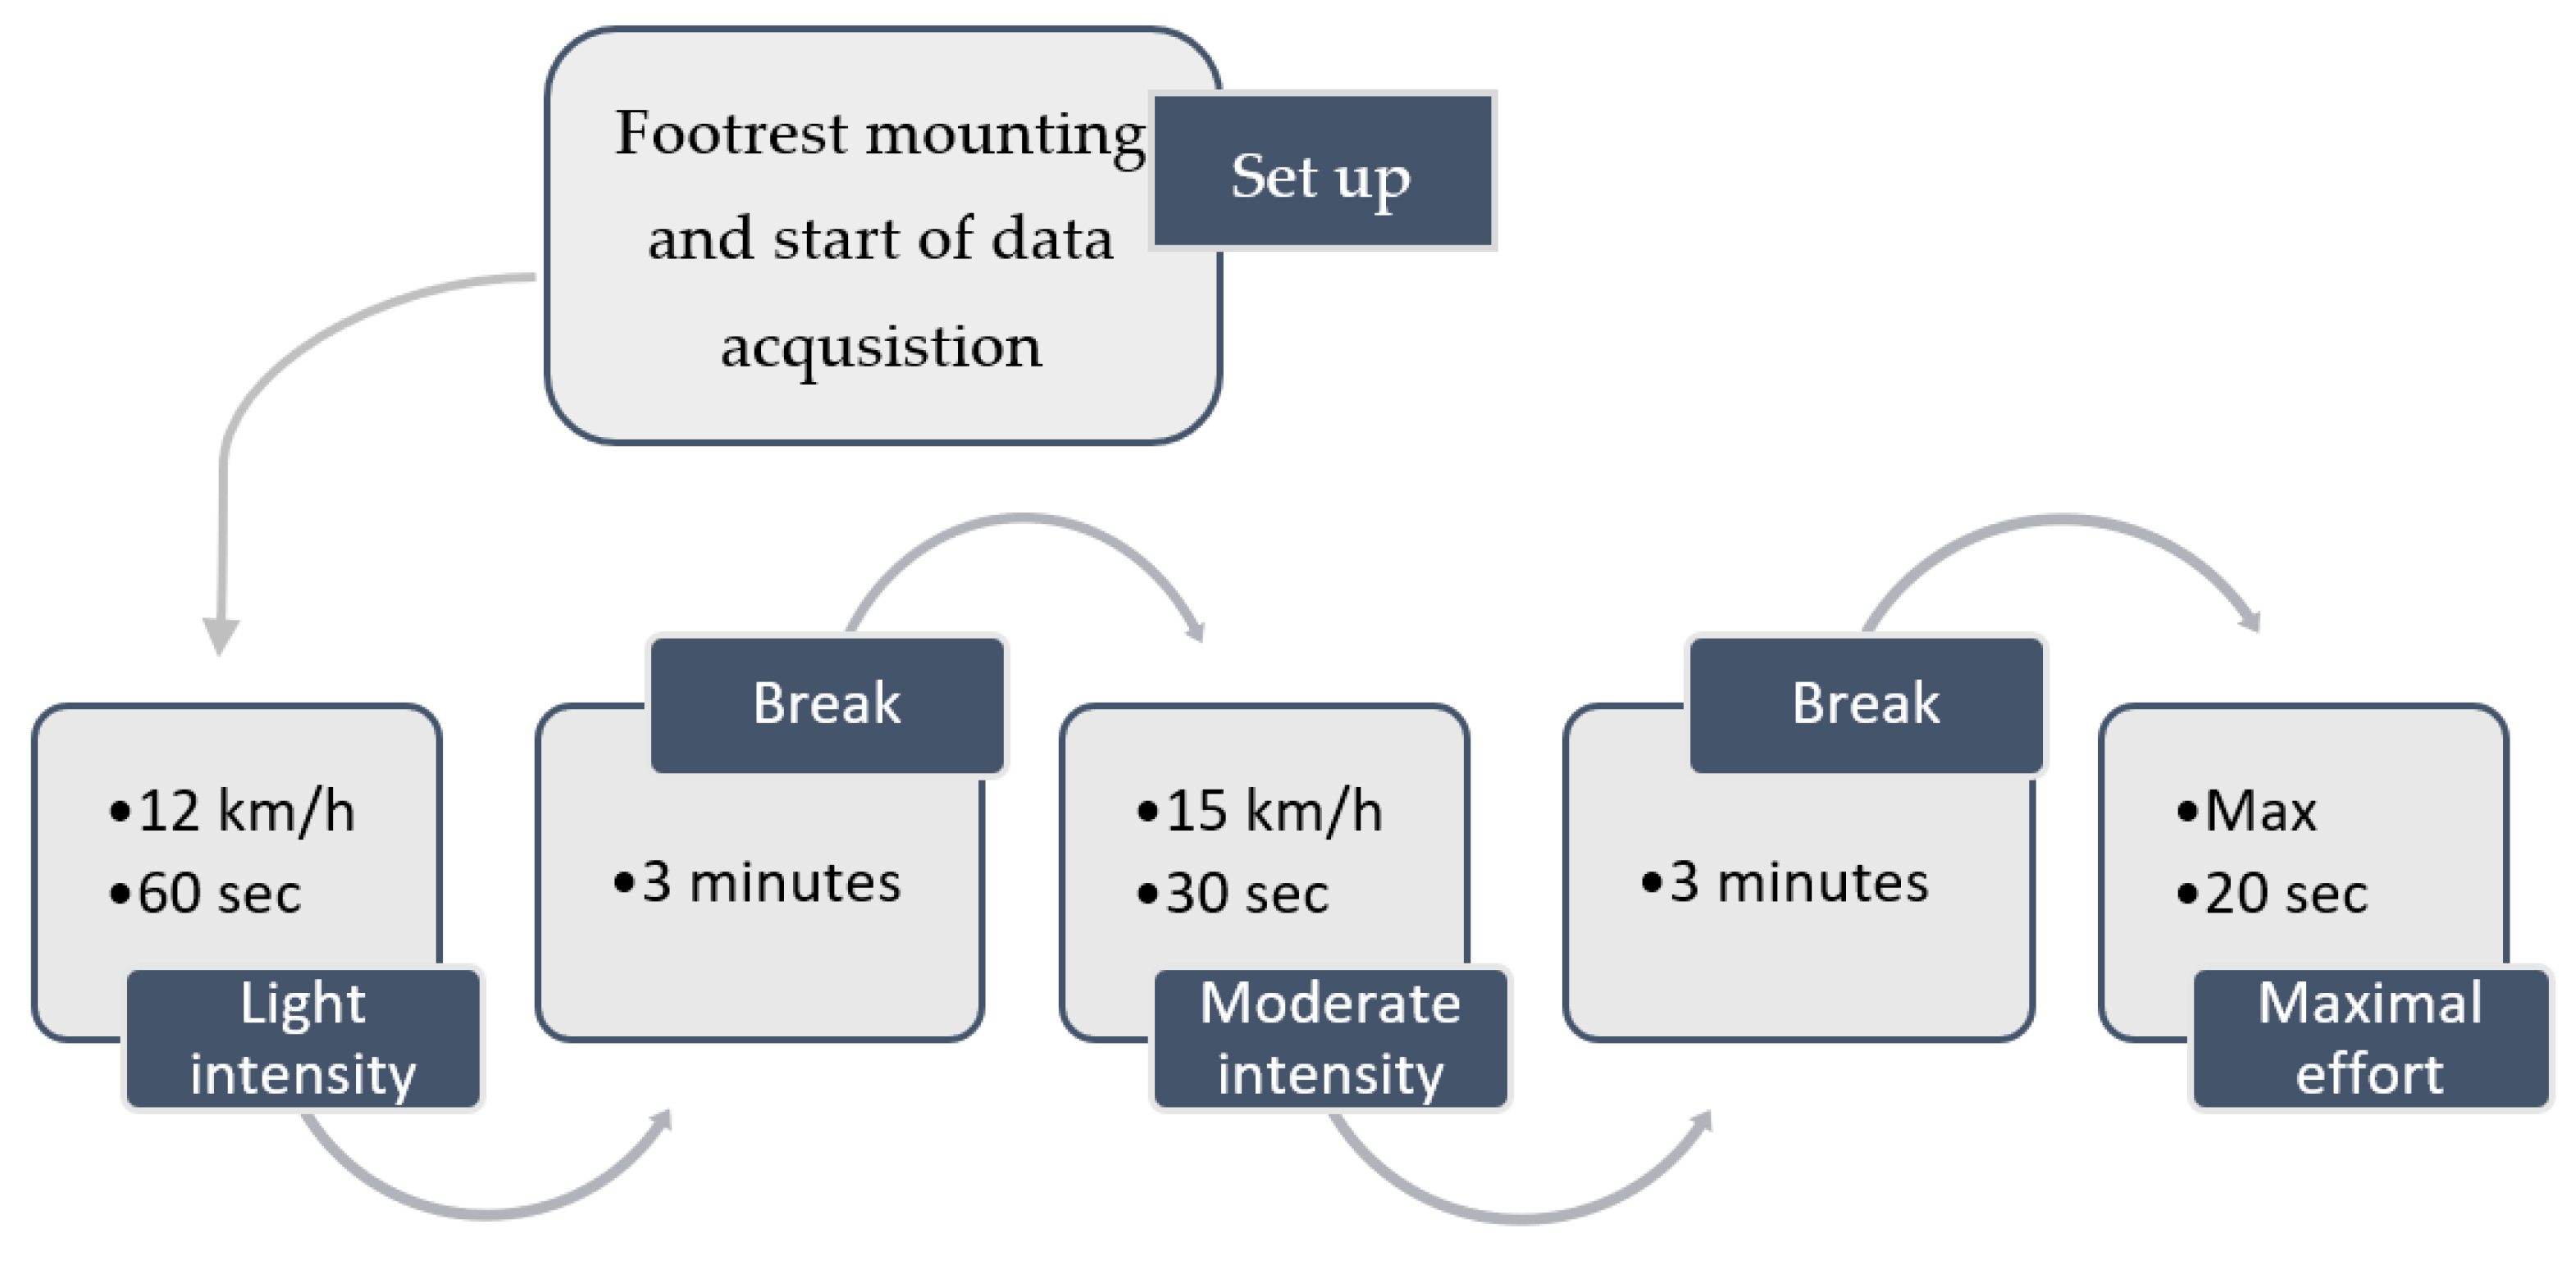
2.3. Protocol
2.4. Data Analysis and Statistics
2.4.1. Descriptive Analysis
2.4.2. Explanatory Analysis
3. Results
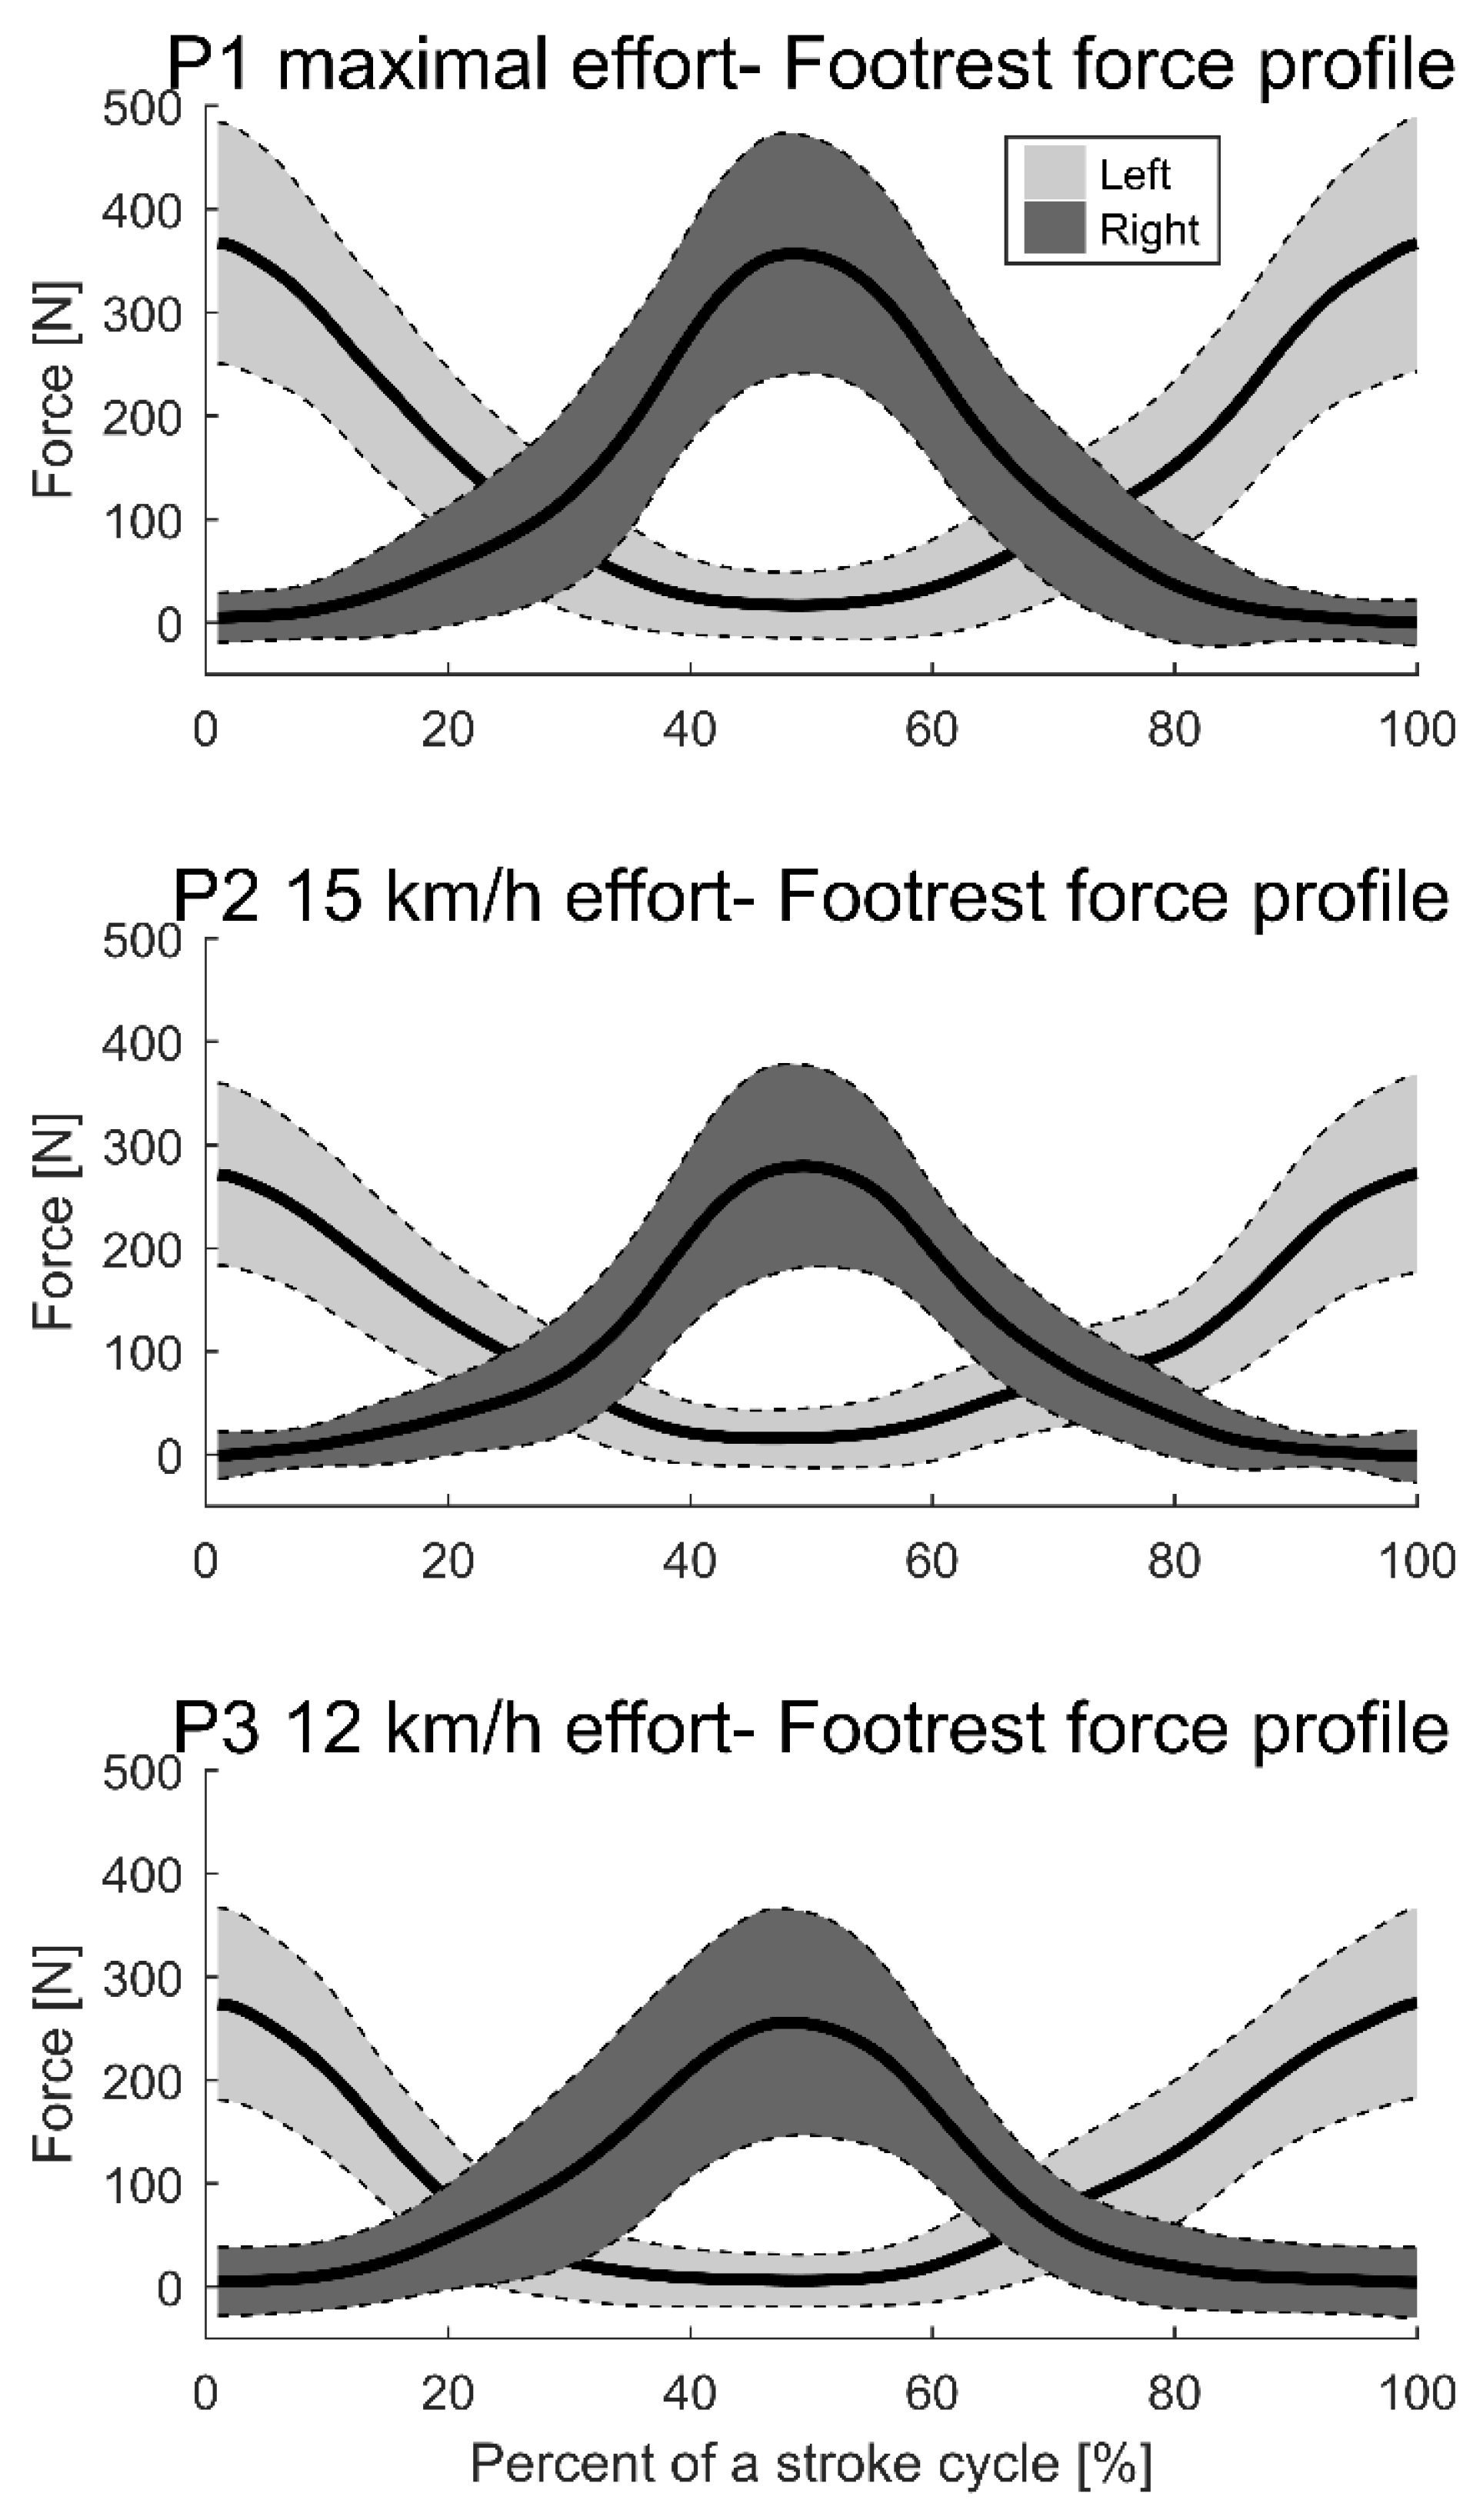
3.1. Descriptive Results
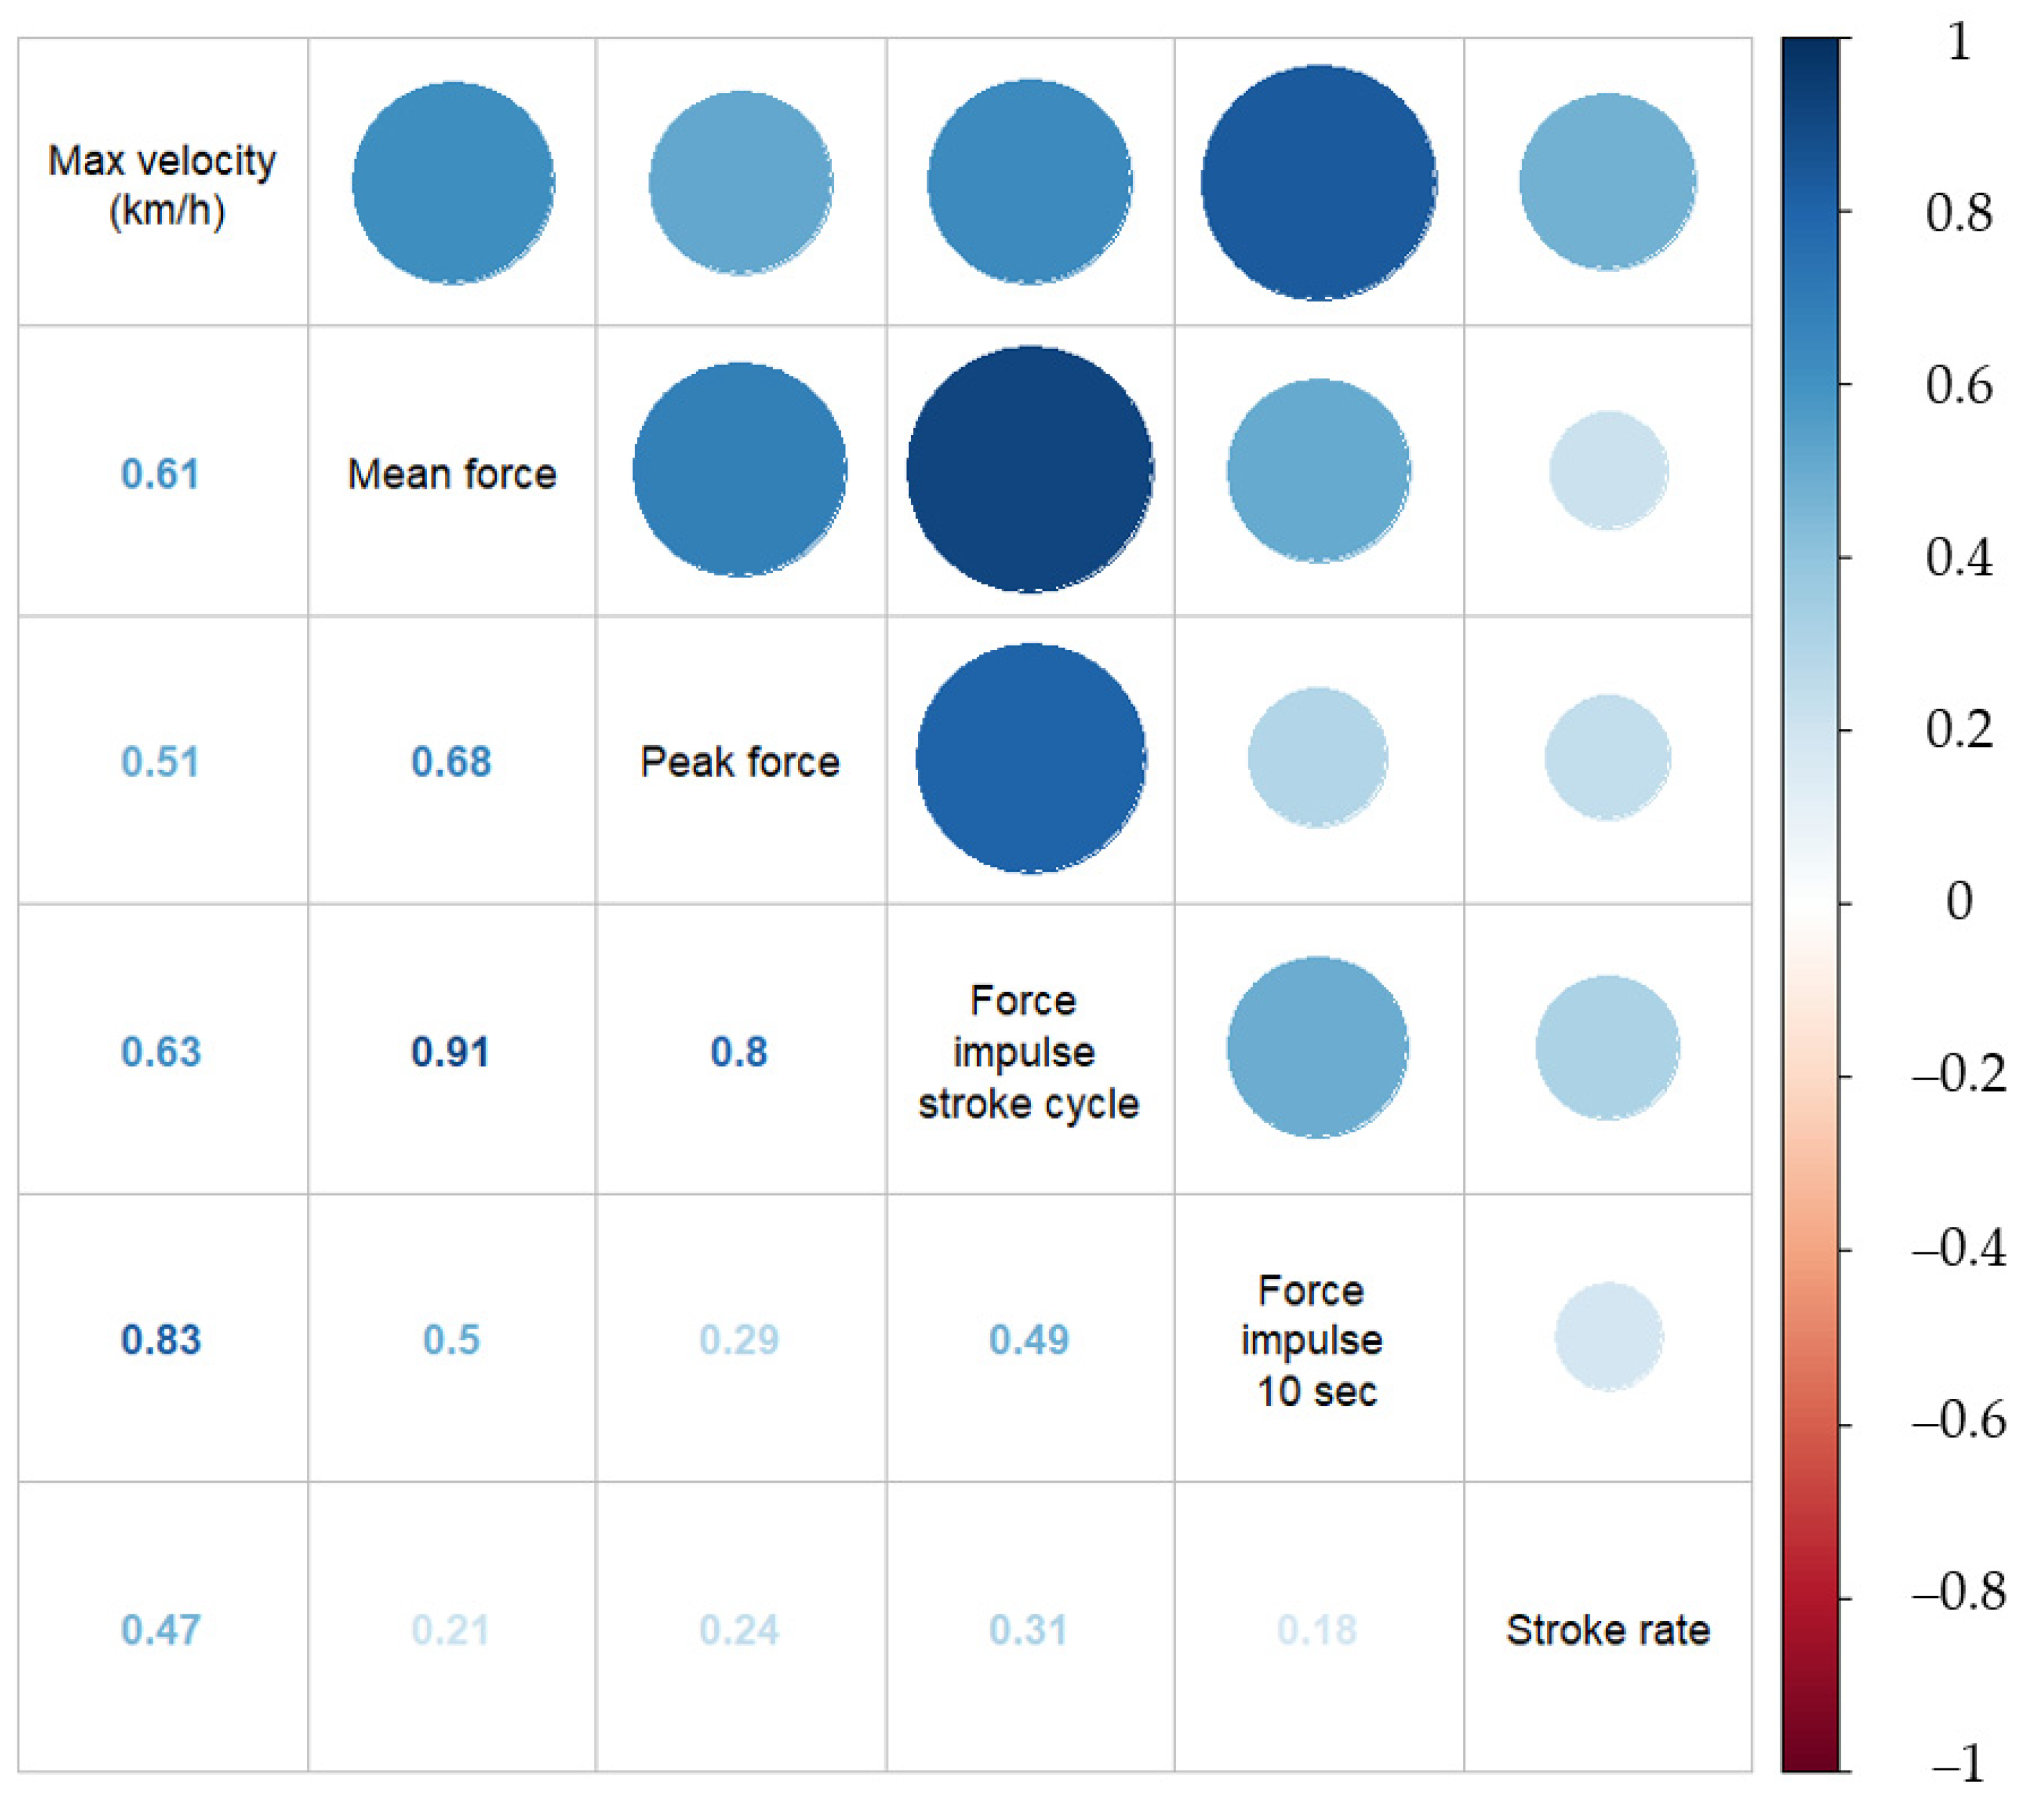
3.2. Explanatory Results
4. Discussion
4.1. Descriptive Findings
4.2. Explanatory Findings
4.2.1. Relationship between Maximal Velocity and Leg Forces
4.2.2. Correlation between Different Velocities and Leg Pushing Forces
4.2.3. Predictive Model
4.3. Limitations
5. Conclusions
Author Contributions
Funding
Institutional Review Board Statement
Informed Consent Statement
Data Availability Statement
Conflicts of Interest
References
- Pendergast, D.; Zamparo, P.; Di Prampero, P.E.; Capelli, C.; Cerretelli, P.; Termin, A.; Craig, A.; Bushnell, D.; Paschke, D.; Mollendorf, J. Energy balance of human locomotion in water. Graefe’s Arch. Clin. Exp. Ophthalmol. 2003, 90, 377–386. [Google Scholar] [CrossRef]
- Pendergast, D.; Mollendorf, J.; Zamparo, P.; Termin, A.; Bushnell, D.; Paschke, D. The influence of drag on human locomotion in water. Undersea Hyperb. Med. 2005, 32, 45. [Google Scholar] [PubMed]
- Logan, S.M.; Holt, L.E. The flatwater kayak stroke. Natl. Strength Cond. Assoc. J. 1985, 7, 4–9. [Google Scholar] [CrossRef]
- McDonnell, L.K.; Hume, P.A.; Nolte, V. An observational model for biomechanical assessment of sprint kayaking technique. Sports Biomech. 2012, 11, 507–523. [Google Scholar] [CrossRef]
- Michael, J.S.; Smith, R.; Rooney, K.B. Determinants of kayak paddling performance. Sports Biomech. 2009, 8, 167–179. [Google Scholar] [CrossRef] [PubMed]
- Sanders, R.H.; Kendal, S.J. A desciption of Olympic flatwater kayak stroke technique. Aust. J. Sci. Med. Sport 1992, 24, 25–30. [Google Scholar]
- Tornberg, Å.B.; Håkansson, P.; Svensson, I.; Wollmer, P. Forces applied at the footrest during ergometer kayaking among female athletes at different competing levels—A pilot study. BMC Sports Sci. Med. Rehabil. 2019, 11, 1–6. [Google Scholar] [CrossRef] [PubMed]
- Gomes, B.B.; Conceição, F.A.V.; Pendergast, D.R.; Sanders, R.H.; Vaz, M.A.P.; Vilas-Boas, J.P. Is passive drag dependent on the interaction of kayak design and paddler weight in flat-water kayaking? Sports Biomech. 2015, 14, 394–403. [Google Scholar] [CrossRef]
- Gomes, B.; Viriato, N. Analysis of the on-water paddling force profile of an elite kayaker. Biomech. Sports 2011, 259, 262. [Google Scholar]
- Gomes, B.B.; Ramos, N.V.; Conceição, F.A.V.; Sanders, R.H.; Vaz, M.A.; Vilas-Boas, J.P. Paddling force profiles at different stroke rates in elite sprint kayaking. J. Appl. Biomech. 2015, 31, 258–263. [Google Scholar] [CrossRef]
- Kong, P.W.; Tay, C.S.; Pan, J.W. Application of Instrumented Paddles in Measuring On-Water Kinetics of Front and Back Paddlers in K2 Sprint Kayaking Crews of Various Ability Levels. Sensors 2020, 20, 6317. [Google Scholar] [CrossRef]
- Nilsson, J.E.; Rosdahl, H.G. New devices for measuring forces on the kayak foot bar and on the seat during flat-water kayak paddling: A technical report. Int. J. Sports Physiol. Perform. 2014, 9, 365–370. [Google Scholar] [CrossRef]
- Nilsson, J.E.; Rosdahl, H. Contribution of leg muscle forces to paddle force and kayak speed during maximal effort flat-water paddling. Int. J. Sports Physiol. Perform. 2016, 11, 22–27. [Google Scholar] [CrossRef] [PubMed]
- Aitken, D.A.; Neal, R.J. An on-water analysis system for quantifying stroke force characteristics during kayak events. Int. J. Sport Biomech. 1992, 8, 165–173. [Google Scholar] [CrossRef]
- Sturm, D. Wireless Multi-Sensor Feedback Systems for Sports Performance Monitoring; Technology and Health KTH Royal Institute of Technology Stockholm: Stockholm, Sweden, 2012. [Google Scholar]
- Helmer, R.J.N.; Farouil, A.; Baker, J.; Blanchonette, I. Instrumentation of a kayak paddle to investigate blade/water interactions. Procedia Eng. 2011, 13, 501–506. [Google Scholar] [CrossRef] [Green Version]
- Niu, L.; Kong, P.W.; Tay, C.S.; Lin, Y.; Wu, B.; Ding, Z.; Chan, C.C. Evaluating On-Water Kayak Paddling Performance Using Optical Fiber Technology. IEEE Sens. J. 2019, 19, 11918–11925. [Google Scholar] [CrossRef]
- Stothart, J.; Reardon, F.; Thoden, J. A system for the evaluation of onwater stroke force development during canoe and kayak events. Int. Soc. Biomech. Sports 2008, 1, 14–15. [Google Scholar]
- McDonnell, L.K.; Hume, P.A.; Nolte, V. A deterministic model based on evidence for the associations between kinematic variables and sprint kayak performance. Sports Biomech. 2013, 12, 205–220. [Google Scholar] [CrossRef]
- Kendal, S.J.; Sanders, R.H. The technique of elite flatwater kayak paddlers using the wing paddle. Int. J. Sport Biomech. 1992, 8, 233–250. [Google Scholar] [CrossRef]
- Klitgaard, K.K.; Hansen, J.; de Zee, M. A new device for measuring forces in the footrest during on-water kayaking. Proc. Inst. Mech. Eng. Part P J. Sports Eng. Technol. 2021, 228, 24–32. [Google Scholar]
- Galit, S. To Explain or to Predict? Stat. Sci. 2010, 25, 289–310. [Google Scholar]
- Mason, C.H.; Perreault, W.D. Collinearity, power, and interpretation of multiple regression analysis. J. Mark. Res. 1991, 28, 268. [Google Scholar] [CrossRef]
- Picard, R.R.; Cook, R.D. Cross-Validation of Regression Models. J. Am. Stat. Assoc. 1984, 79, 575–583. [Google Scholar] [CrossRef]
- Bangdiwala, S.I. Understanding significance and p-values. Nepal J. Epidemiol. 2016, 6, 522–524. [Google Scholar] [CrossRef] [PubMed]
- Greenland, S.; Senn, S.J.; Rothman, K.J.; Carlin, J.B.; Poole, C.; Goodman, S.N.; Altman, D.G. Statistical tests, p values, confidence intervals, and power: A guide to misinterpretations. Eur. J. Epidemiol. 2016, 31, 337–350. [Google Scholar] [CrossRef] [PubMed] [Green Version]
- Begon, M.; Begon, M.; Colloud, F.; Colloud, F.; Lacouture, P.; Lacouture, P. Measurement of contact forces on a kayak ergometer with a sliding footrest–seat complex. Sports Eng. 2009, 11, 67–73. [Google Scholar] [CrossRef]
- Bonaiuto, V.; Gatta, G.; Romagnoli, C.; Boatto, P.; Lanotte, N.; Annino, G. A Pilot Study on the e-Kayak System: A Wireless DAQ Suited for Performance Analysis in Flatwater Sprint Kayaks. Sensors 2020, 20, 542. [Google Scholar] [CrossRef] [Green Version]


| Girls under 16 (n = 4) | Boys under 18 (n = 8) | Senior Women (n = 8) | Senior Men (n = 8) | |
|---|---|---|---|---|
| Age (years) | 14.2 ± 1.2 | 16 ± 0.8 | 18.8 ± 1.7 | 20 ± 1 |
| Weight (kg) | 56.7 ± 8.2 | 73.1 ± 7 | 63.4 ± 3.9 | 80.6 ± 7.3 |
| Height (cm) | 165.5 ± 6.1 | 181.7 ± 4.4 | 167.9 ± 3.2 | 181.2 ± 6.8 |
| 200 m time (s) | 52.5 ± 2.3 | 39.5 ± 2.1 | 44 ± 1.2 | 38.8 ± 1.4 |
| 500 m time (s) | 142.2 ± 6.1 | 120 ± 4.4 | 133.45 ± 3.2 | 112.5 ± 6.8 |
| Biomechanical Variables | 12 km/h | 15 km/h | Maximal Effort |
|---|---|---|---|
| Velocity (km/h) | 12.3 ± 0.5 | 15.1 ± 0.3 | 19.7 ± 2 |
| Mean stroke rate (SPM) | 74.6 ± 10.6 | 93.2 ± 11.7 | 125.0 ± 12 |
| Mean peak force (N) | 328.0 ± 108.7 | 347.3 ± 91.6 | 398.2 ± 106.2 |
| Mean force (N) | 201.3 ± 67.7 | 217.7 ± 78 | 289.5 ± 82.7 |
| Impulse (N⋅s) over 1 stroke cycle | 397.2 ± 16.5 | 467.4 ± 15.6 | 554.8 ± 17.4 |
| Impulse (N⋅s) over 10 s | 1812.2 ± 72.7 | 1756.8 ± 69.8 | 2383.6 ± 86.9 |
| Biomechanical Variables | Univariate Model (95% CI) | Mutually Adjusted Model (95% CI) |
|---|---|---|
| Mean force (N) * | 14.13 (9.15; 19.08) | 13.25 (8.38; 18.12) |
| Peak force (N) * | 11.93 (5.15; 18.71) | 9.69 (3.31; 16.08) |
| Impulse 1 stroke cycle (N⋅s) * | 2.540 (1.471; 3.608) | 2.421 (1.342; 3.500) |
| Impulse 10 s (N⋅s) * | 110.889 (60.849; 160.929) | 104.216 (24.072; 152.226) |
Publisher’s Note: MDPI stays neutral with regard to jurisdictional claims in published maps and institutional affiliations. |
© 2021 by the authors. Licensee MDPI, Basel, Switzerland. This article is an open access article distributed under the terms and conditions of the Creative Commons Attribution (CC BY) license (https://creativecommons.org/licenses/by/4.0/).
Share and Cite
Klitgaard, K.K.; Rosdahl, H.; Brund, R.B.K.; Hansen, J.; de Zee, M. Characterization of Leg Push Forces and Their Relationship to Velocity in On-Water Sprint Kayaking. Sensors 2021, 21, 6790. https://doi.org/10.3390/s21206790
Klitgaard KK, Rosdahl H, Brund RBK, Hansen J, de Zee M. Characterization of Leg Push Forces and Their Relationship to Velocity in On-Water Sprint Kayaking. Sensors. 2021; 21(20):6790. https://doi.org/10.3390/s21206790
Chicago/Turabian StyleKlitgaard, Kent K., Hans Rosdahl, Rene B. K. Brund, John Hansen, and Mark de Zee. 2021. "Characterization of Leg Push Forces and Their Relationship to Velocity in On-Water Sprint Kayaking" Sensors 21, no. 20: 6790. https://doi.org/10.3390/s21206790