
Classification and Automated Interpretation of Spinal Posture Data Using a Pathology-Independent Classifier and Explainable Artificial Intelligence (XAI)

 ,
,  , , , and
Abstract
:1. Introduction
2. Materials and Methods
2.1. Measuring Method, Data, and Subjects
2.2. Data Preprocessing and Model Evaluation
2.3. Pathology-Independent and Binary Classifier
2.4. Validation
2.5. XAI Interpretations
2.6. Evaluation Metrics and Calculations
3. Results
4. Discussion
5. Conclusions
Author Contributions
Funding
Institutional Review Board Statement
Informed Consent Statement
Data Availability Statement
Acknowledgments
Conflicts of Interest
Appendix A

| Variable | Plane | Description |
|---|---|---|
| VP/C7 (Vertebra prominens/7. cervical vertebral body) T1–T12 (Thoracic spine) L1–L4 (Lumbar spine) | Sagittal: Vertebral sagittal Flexion and Extension (°) | The parameter describes the inclination of the calculated vertebra in space (relative to a plumb/gravity line) as seen from a left view. The angle (in degrees) is calculated from the projection of the vertebra in a sagittal plane (rotation and lateral flexion are ignored). A positive value means a forward tilt of the vertebra (flexion). |
| Frontal: Vertebral Lateral Flexion (°) | The parameter describes the lateral inclination of the vertebra in space (relative to a plumb/gravity line) as seen from a posterior–anterior view. The angle (in degrees) is calculated from the projection of the vertebra in the coronal plane (rotation and sagittal extension/flexion are ignored). A positive value means a tilt of the vertebra to the left (lateral flexion left). | |
| Transversal: Vertebral Rotation (°) | The vertebral rotation describes the rotation of a vertebra in the transversal plane (relative to the neutral pelvis). A positive value means a vertebra is rotated to the left (counterclockwise) when seen from behind. The rotation of vertebral bodies happens in situ and, therefore, the direction of rotation between the surface and vertebral rotation changes. Hence, a surface rotation to the right, mathematically represented with a +, becomes a vertebral body rotation to the left. This is due to the calculation process in which a vector is used that points from the Processus spinosus towards the middle of the vertebral body, meaning that the surface rotation changes its direction within the vertebral body. | |
| Pelvis | Pelvic Obliquity (°) | A line is drawn from DL to DR (left and right dimple) and is compared to a horizontal line representing the horizon. The angle (in degrees) between them is measured. A positive value means that the right pelvis is elevated. |
| Pelvic Torsion (dimples) (°) | The parameter describes the torsion of the surface normals on the two lumbar dimples. | |
| Pelvic Inclination (dimples) (°) | The parameter describes the mean vertical torsion of the two surface normals on DL and DR. | |
| Pelvic Inclination (symmetry line) (°) | The parameter describes the angle of the vertical components of the surface normals on point DM (dimple midpoint) based on the horizontal. | |
| Pelvic Rotation (°) | The pelvic rotation is the rotation in the transversal plane of the right dimple relative to a reference coronal plane that is defined from the system setup, perpendicular to the camera-projection axis. A positive value means the pelvis is rotated to the left when seen from behind (the value is corrected * (−1)). |
References
- Robert Koch Institut. Gesundheit in Deutschland. Gesundheitsberichterstattung des Bundes Gemeinsam Getragen von RKI und Destatis; Robert Koch Institut: Berlin, Germany, 2015. [Google Scholar]
- Hartvigsen, J.; Hancock, M.; Kongsted, A.; Louw, Q.; Ferreira, M.L.; Genevay, S.; Hoy, D.; Karppinen, J.; Pransky, G.; Sieper, J.; et al. What low back pain is and why we need to pay attention. Lancet 2018, 391, 2356–2367. [Google Scholar] [CrossRef] [Green Version]
- Schmidt, C.O.; Raspe, H.; Pfingsten, M.; Hasenbring, M.I.; Basler, H.D.; Eich, W.; Kohlmann, T. Back Pain in the German Adult Population. Spine 2007, 32, 2005–2011. [Google Scholar] [CrossRef]
- Von der Lippe, E.; Krause, L.; Prost, M.; Wengler, A.; Leddin, J.; Müller, A.; Zeisler, M.-L.; Anton, A.; Rommel, A.; BURDEN Study Group. Prävalenz von Rücken- und Nackenschmerzen in Deutschland. Ergebnisse der Krankheitslast-Studie BURDEN 2020. J. Health Monit. 2021, 6, 1–14. [Google Scholar] [CrossRef]
- Urits, I.; Burshtein, A.; Sharma, M.; Testa, L.; Gold, P.A.; Orhurhu, V.; Viswanath, O.; Jones, M.; Sidransky, M.A.; Spektor, B.; et al. Low Back Pain, a Comprehensive Review: Pathophysiology, Diagnosis, and Treatment. Curr. Pain Headache Rep. 2019, 23, 23. [Google Scholar] [CrossRef]
- Casser, H.-R.; Seddigh, S.; Rauschmann, M. Acute Lumbar Back Pain: Investigation, Differential Diagnosis, and Treatment. Dtsch. Aerzteblatt Online 2016, 113, 223–234. [Google Scholar] [CrossRef] [Green Version]
- Koes, B.W.; van Tulder, M.; Thomas, S. Diagnosis and treatment of low back pain. BMJ 2006, 332, 1430–1434. [Google Scholar] [CrossRef] [PubMed] [Green Version]
- Götz-Neumann, K. Gehen Verstehen. Ganganalyse in der Physiotherapie; Thieme: Stuttgart, Germany, 2016; ISBN 9783131323743. [Google Scholar]
- Deyo, R.A. Fusion surgery for lumbar degenerative disc disease: Still more questions than answers. Spine J. 2015, 15, 272–274. [Google Scholar] [CrossRef] [PubMed]
- Rajaee, S.S.; Bae, H.W.; Kanim, L.E.; Delamarter, R.B. Spinal Fusion in the United States. Spine 2012, 37, 67–76. [Google Scholar] [CrossRef] [PubMed] [Green Version]
- Chan, C.-W.; Peng, P. Failed Back Surgery Syndrome. Pain Med. 2011, 12, 577–606. [Google Scholar] [CrossRef] [PubMed] [Green Version]
- Brox, J.I.; Reikerås, O.; Nygaard, Ø.; Sørensen, R.; Indahl, A.; Holm, I.; Keller, A.; Ingebrigtsen, T.; Grundnes, O.; Lange, J.E.; et al. Lumbar instrumented fusion compared with cognitive intervention and exercises in patients with chronic back pain after previous surgery for disc herniation: A prospective randomized controlled study. Pain 2006, 122, 145–155. [Google Scholar] [CrossRef] [PubMed]
- Papi, E.; Koh, W.S.; McGregor, A.H. Wearable technology for spine movement assessment: A systematic review. J. Biomech. 2017, 64, 186–197. [Google Scholar] [CrossRef]
- Rast, F.M.; Labruyère, R. Systematic review on the application of wearable inertial sensors to quantify everyday life motor activity in people with mobility impairments. J. Neuroeng. Rehabil. 2020, 17, 1–19. [Google Scholar] [CrossRef]
- Lau, H.-Y.; Tong, K.-Y.; Zhu, H. Support vector machine for classification of walking conditions of persons after stroke with dropped foot. Hum. Mov. Sci. 2009, 28, 504–514. [Google Scholar] [CrossRef]
- Wahid, F.; Begg, R.K.; Hass, C.J.; Halgamuge, S.; Ackland, D. Classification of Parkinson’s Disease Gait Using Spatial-Temporal Gait Features. IEEE J. Biomed. Health Inform. 2015, 19, 1794–1802. [Google Scholar] [CrossRef]
- Dindorf, C.; Teufl, W.; Taetz, B.; Becker, S.; Bleser, G.; Fröhlich, U. Feature extraction and gait classification in hip replacement patients on the basis of kinematic waveform data. Biomed. Hum. Kinet. 2021, 13, 177–186. [Google Scholar] [CrossRef]
- Horst, F.; Lapuschkin, S.; Samek, W.; Müller, K.-R.; Schöllhorn, W.I. Explaining the unique nature of individual gait patterns with deep learning. Sci. Rep. 2019, 9, 1–13. [Google Scholar] [CrossRef] [Green Version]
- Phinyomark, A.; Petri, G.; Ibáñez-Marcelo, E.; Osis, S.T.; Ferber, R. Analysis of Big Data in Gait Biomechanics: Current Trends and Future Directions. J. Med. Biol. Eng. 2018, 38, 244–260. [Google Scholar] [CrossRef] [PubMed] [Green Version]
- Halilaj, E.; Rajagopal, A.; Fiterau, M.; Hicks, J.L.; Hastie, T.J.; Delp, S.L. Machine learning in human movement biomechanics: Best practices, common pitfalls, and new opportunities. J. Biomech. 2018, 81, 1–11. [Google Scholar] [CrossRef] [PubMed]
- Bzdok, D.; Altman, N.; Krzywinski, M. Statistics versus machine learning. Nat. Methods 2018, 15, 233–234. [Google Scholar] [CrossRef]
- Arnaout, R.; Curran, L.; Zhao, Y.; Levine, J.C.; Chinn, E.; Moon-Grady, A.J. An ensemble of neural networks provides expert-level prenatal detection of complex congenital heart disease. Nat. Med. 2021, 27, 882–891. [Google Scholar] [CrossRef] [PubMed]
- Hu, L.; Bell, D.; Antani, S.; Xue, Z.; Yu, K.; Horning, M.P.; Gachuhi, N.; Wilson, B.; Jaiswal, M.S.; Befano, B.; et al. An Observational Study of Deep Learning and Automated Evaluation of Cervical Images for Cancer Screening. J. Natl. Cancer Inst. 2019, 111, 923–932. [Google Scholar] [CrossRef]
- Luo, H.; Xu, G.; Li, C.; He, L.; Luo, L.; Wang, Z.-X.; Jing, B.; Deng, Y.; Jin, Y.; Li, Y.; et al. Real-time artificial intelligence for detection of upper gastrointestinal cancer by endoscopy: A multicentre, case-control, diagnostic study. Lancet Oncol. 2019, 20, 1645–1654. [Google Scholar] [CrossRef]
- Laroche, D.; Tolambiya, A.; Morisset, C.; Maillefert, J.; French, R.; Ornetti, P.; Thomas, E. A classification study of kinematic gait trajectories in hip osteoarthritis. Comput. Biol. Med. 2014, 55, 42–48. [Google Scholar] [CrossRef]
- Teufl, W.; Taetz, B.; Miezal, M.; Lorenz, M.; Pietschmann, J.; Jöllenbeck, T.; Fröhlich, M.; Bleser, G. Towards an Inertial Sensor-Based Wearable Feedback System for Patients after Total Hip Arthroplasty: Validity and Applicability for Gait Classification with Gait Kinematics-Based Features. Sensors 2019, 19, 5006. [Google Scholar] [CrossRef] [PubMed] [Green Version]
- Adadi, A.; Berrada, M. Peeking Inside the Black-Box: A Survey on Explainable Artificial Intelligence (XAI). IEEE Access 2018, 6, 52138–52160. [Google Scholar] [CrossRef]
- Samek, W.; Müller, K.-R. Towards Explainable Artificial Intelligence. In Explainable AI: Interpreting, Explaining and Visualizing Deep Learning, 1st ed.; Samek, W., Montavon, G., Vedaldi, A., Hansen, L.K., Muller, K.-R., Eds.; Springer: Cham, Switzerland, 2019; pp. 5–22. [Google Scholar]
- European Union. Regulation (EU) 2016/679 of the european parliament and of the council of 27 april 2016 on the protection of natural persons with regard to the processing of personal data and on the free movement of such data, and repealing directive 95/46/ec (General Data Protection Regulation). Off. J. Eur. Union 2016, L 119, 1–88. [Google Scholar]
- Holzinger, A.; Biemann, C.; Pattichis, C.S.; Kell, D.B. What Do We Need to Build Explainable AI Systems for The Medical Domain? Available online: http://arxiv.org/pdf/1712.09923v1 (accessed on 20 February 2020).
- Dindorf, C.; Teufl, W.; Taetz, B.; Bleser, G.; Fröhlich, M. Interpretability of Input Representations for Gait Classification in Patients after Total Hip Arthroplasty. Sensors 2020, 20, 4385. [Google Scholar] [CrossRef] [PubMed]
- Horst, F.; Slijepcevic, D.; Lapuschkin, S.; Raberger, A.-M.; Zeppelzauer, M.; Samek, W.; Breiteneder, C.; Schöllhorn, W.I.; Horsak, B. On the Understanding and Interpretation of Machine Learning Predictions in Clinical Gait Analysis Using Explainable Artificial Intelligence. Available online: http://arxiv.org/pdf/1912a.07737v1 (accessed on 10 March 2020).
- Ribeiro, M.T.; Singh, S.; Guestrin, C. “Why Should I Trust You?”: Explaining the Predictions of Any Classifier. In Proceedings of the 22nd ACM SIGKDD International Conference on Knowledge Discovery and Data Mining (KDD’16), San Francisco, CA, USA, 13–17 August 2016; pp. 1135–1144. [Google Scholar]
- Lundberg, S.M.; Lee, S.-I. A Unified Approach to Interpreting Model Predictions. In Proceedings of the 31st Conference on Neural Information Processing Systems (NIPS 2017), Long Beach, CA, USA, 4–9 December 2017. [Google Scholar]
- Shrikumar, A.; Greenside, P.; Kundaje, A. Learning important features through propagating activation differences. In Proceedings of the 34th International Conference on Machine Learning, Sydney, Australia, 6–11 August 2017; pp. 3145–3153. [Google Scholar]
- Teufl, W.; Taetz, B.; Miezal, M.; Dindorf, C.; Fröhlich, M.; Trinler, U.; Hogam, A.; Bleser, G. Automated detection of pathological gait patterns using a one-class support vector machine trained on discrete parameters of IMU based gait data. Clin. Biomech. 2021, 89, 105452. [Google Scholar] [CrossRef]
- Dindorf, C.; Konradi, J.; Wolf, C.; Taetz, B.; Bleser, G.; Huthwelker, J.; Drees, P.; Fröhlich, M.; Betz, U. General method for automated feature extraction and selection and its application for gender classification and biomechanical knowledge discovery of sex differences in spinal posture during stance and gait. Comput. Methods Biomech. Biomed. Eng. 2021, 24, 299–307. [Google Scholar] [CrossRef]
- Dindorf, C.; Konradi, J.; Wolf, C.; Taetz, B.; Bleser, G.; Huthwelker, J.; Werthmann, F.; Drees, P.; Fröhlich, M.; Betz, U. Machine learning techniques demonstrating individual movement patterns of the vertebral column: The fingerprint of spinal motion. Comput. Methods Biomech. Biomed. Eng. 2021, 24. [Google Scholar] [CrossRef]
- Wolf, C.; Betz, U.; Huthwelker, J.; Konradi, J.; Westphal, R.; Cerpa, M.; Lenke, L.; Drees, P. Evaluation of 3D Vertebral and Pelvic Position by Surface Topography in Asymptomatic Females: Presentation of Normative Reference Data. Available online: https://www.researchsquare.com/article/rs-612767/v1 (accessed on 17 September 2021).
- Liu, F.T.; Ting, K.M.; Zhou, Z.-H. Isolation-Based Anomaly Detection. ACM Trans. Knowl. Discov. Data (TKDD) 2012, 6, 1–39. [Google Scholar] [CrossRef]
- Dreiseitl, S.; Osl, M.; Scheibböck, C.; Binder, M. Outlier Detection with One-Class SVMs: An Application to Melanoma Prognosis. AMIA Annu. Symp. Proc. 2010, 172–176. [Google Scholar]
- Pedregosa, F.; Varoquaux, G.; Gramfort, A.; Michel, V.; Thirion, B.; Grisel, O.; Blondel, M.; Prettenhofer, P.; Weiss, R.; Dubourg, V.; et al. Scikit-learn: Machine Learning in Python. J. Mach. Learn. Res. 2011, 12, 2825–2830. [Google Scholar]
- Platt, J.C. Probabilistic Outputs for Support Vector Machines and Comparisons to Regularized Likelihood Methods. In Advances in Large Margin Classifiers; MIT Press: Cambridge, MA, USA, 1999; pp. 61–74. [Google Scholar]
- Breiman, L. Random Forests. Mach. Learn. 2001, 45, 5–32. [Google Scholar] [CrossRef] [Green Version]
- Ferro, C.A.T.; Fricker, T.E. A bias-corrected decomposition of the Brier score. Q. J. R. Meteorol. Soc. 2012, 138, 1954–1960. [Google Scholar] [CrossRef] [Green Version]
- Dindorf, C.; Konradi, J.; Wolf, C.; Taetz, B.; Bleser, G.; Kniepert, J.; Drees, P.; Fröhlich, M.; Betz, U. Towards a better understanding of spinal differences between healthy subjects and subjects with back pain using Explainable Artificial Intelligence (XAI). In Proceedings of the 9th International Performance Analysis Workshop and Conference & 5th IACSS Conference, Vienna, Austria, 30–31 August 2021; pp. 1–3. [Google Scholar]
- Ract, I.; Meadeb, J.-M.; Mercy, G.; Cueff, F.; Husson, J.-L.; Guillin, R. A review of the value of MRI signs in low back pain. Diagn. Interv. Imaging 2015, 96, 239–249. [Google Scholar] [CrossRef] [PubMed] [Green Version]
- Weng, W.-J.; Wang, W.-J.; Wu, M.-D.; Xu, Z.-H.; Xu, L.-L.; Qiu, Y. Characteristics of sagittal spine–pelvis–leg alignment in patients with severe hip osteoarthritis. Eur. Spine J. 2014, 24, 1228–1236. [Google Scholar] [CrossRef]
- Kechagias, V.A.; Grivas, T.B.; Papagelopoulos, P.J.; Kontogeorgakos, V.A.; Vlasis, K. Truncal Changes in Patients Suffering Severe Hip or Knee Osteoarthritis: A Surface Topography Study. Clin. Orthop. Surg. 2021, 13, 185–195. [Google Scholar] [CrossRef]
- Scheidt, S.; Endres, S.; Gesicki, M.; Hofmann, U.K. Using video rasterstereography and treadmill gait analysis as a tool for evaluating postoperative outcome after lumbar spinal fusion. Gait Posture 2018, 64, 18–24. [Google Scholar] [CrossRef]
- Hackenberg, L.; Hierholzer, E.; Pötzl, W.; Götze, C.; Liljenqvist, U. Rasterstereographic back shape analysis in idiopathic scoliosis after anterior correction and fusion. Clin. Biomech. 2003, 18, 1–8. [Google Scholar] [CrossRef]
- Leirós-Rodríguez, R.; Arce-Fariña, M.E.; Álvarez, C.M.M.; Garcia-Soidan, J.L. Definition of the proper placement point for balance assessment with accelerometers in older women. Rev. Andal. Med. Deport. 2016, 9, 1–6. [Google Scholar] [CrossRef]
- Ben Brahim, A.; Limam, M. Ensemble feature selection for high dimensional data: A new method and a comparative study. Adv. Data Anal. Classif. 2018, 12, 937–952. [Google Scholar] [CrossRef]
- Shahrjooihaghighi, A.; Frigui, H.; Zhang, X.; Wei, X.; Shi, B.; Trabelsi, A. An ensemble feature selection method for biomarker discovery. In Proceedings of the 2017 IEEE International Symposium on Signal Processing and Information Technology (ISSPIT), Bilbao, Spain, 18–20 December 2017; Volume 2017, pp. 416–421. [Google Scholar]
- Molnar, C. Interpretable Machine Learning: A Guide for Making Black Box Models Explainable; Leanpub: Victoria, BC, Canada, 2018. [Google Scholar]
- Schlegel, J.D.; Smith, J.A.; Schleusener, R.L. Lumbar motion segment pathology adjacent to thoracolumbar, lumbar, and lumbosacral fusions. Spine 1996, 21, 970–981. [Google Scholar] [CrossRef] [PubMed]
- Bredow, J.; Löhrer, L.; Oppermann, J.; Scheyerer, M.J.; Sobottke, R.; Eysel, P.; Siewe, J. Pathoanatomic Risk Factors for Instability and Adjacent Segment Disease in Lumbar Spine: How to Use Topping Off? Biomed. Res. Int. 2017, 2017, 2964529. [Google Scholar] [CrossRef] [PubMed] [Green Version]
- Krott, N.L.; Wild, M.; Betsch, M. Meta-analysis of the validity and reliability of rasterstereographic measurements of spinal posture. Eur. Spine J. 2020, 29, 2392–2401. [Google Scholar] [CrossRef] [PubMed]
- Janssen, M.M.A.; Vincken, K.L.; Kemp, B.; Obradov, M.; de Kleuver, M.; Viergever, M.A.; Castelein, R.M.; Bartels, L.W. Pre-existent vertebral rotation in the human spine is influenced by body position. Eur. Spine J. 2010, 19, 1728–1734. [Google Scholar] [CrossRef] [Green Version]
- Kouwenhoven, J.-W.M.; Vincken, K.L.; Bartels, L.W.; Castelein, R.M. Analysis of preexistent vertebral rotation in the normal spine. Spine 2006, 31, 1467–1472. [Google Scholar] [CrossRef]
- Chevillotte, T.; Coudert, P.; Cawley, D.; Bouloussa, H.; Mazas, S.; Boissière, L.; Gille, O. Influence of posture on relationships between pelvic parameters and lumbar lordosis: Comparison of the standing, seated, and supine positions. A preliminary study. Orthop. Traumatol. Surg. Res. 2018, 104, 565–568. [Google Scholar] [CrossRef]
- Gunning, D.; Stefik, M.; Choi, J.; Miller, T.; Stumpf, S.; Yang, G.-Z. XAI—Explainable artificial intelligence. Sci. Robot. 2019, 4, eaay7120. [Google Scholar] [CrossRef] [Green Version]
- Arendt-Nielsen, L.; Graven-Nielsen, T.; Svarrer, H.; Svensson, P. The influence of low back pain on muscle activity and coordination during gait: A clinical and experimental study. Pain 1996, 64, 231–240. [Google Scholar] [CrossRef]
- Lamoth, C.J.C.; Meijer, O.G.; Daffertshofer, A.; Wuisman, P.I.J.M.; Beek, P.J. Effects of chronic low back pain on trunk coordination and back muscle activity during walking: Changes in motor control. Eur. Spine J. 2006, 15, 23–40. [Google Scholar] [CrossRef] [PubMed] [Green Version]
- Weinberger, K.Q.; Saul, L.K. Distance Metric Learning for Large Margin Nearest Neighbor Classification. J. Mach. Learn. Res. 2009, 10, 207–244. [Google Scholar]
- Gao, J.; Cheng, H.; Tan, P.-N. Semi-supervised outlier detection. In Proceedings of the 2006 ACM Symposium on Applied Computing—SAC’06, Dijon, France, 27 April 2006; Haddad, H.M., Ed.; ACM Press: New York, NY, USA, 2006; p. 635. [Google Scholar]
- Conforti, I.; Mileti, I.; Del Prete, Z.; Palermo, E. Measuring Biomechanical Risk in Lifting Load Tasks Through Wearable System and Machine-Learning Approach. Sensors 2020, 20, 1557. [Google Scholar] [CrossRef] [PubMed] [Green Version]
- Picerno, P. An Enhanced Planar Linked Segment Model for Predicting Lumbar Spine Loads during Symmetric Lifting Tasks. Appl. Sci. 2020, 10, 6700. [Google Scholar] [CrossRef]

| Subjects (n) | Male (n); Female (n) | Age (SD) | Hight cm (SD) | BMI (SD) | Further Information | |
|---|---|---|---|---|---|---|
| Healthy 1 (asymptomatic) | 25 | 12; 13 | 34.68 (12.07) | 176.28 (8.83) | 24.01 (3.45) | Repeated measurements at three points in time; walking without walking aids and pain; no acute or chronic diseases; no pregnancy; BMI < 30; WHO register (INT: DRKS00014325) |
| Back pain | 32 | 14; 18 | 44.53 (14.84) | 174.00 (11.00) | 26.01 (4.79) | Area of pain: 6% thoracic spine (TS), 72% lumbar spine (LS), and 22% TS + LS; no acute fractures, walking aids, or acute/chronic illnesses that prevent safe walking; WHO register (INT: DRKS00013145) |
| Spinal fusion | 34 | 20; 14 | 56.26 (15.40) | 171.00 (11.00) | 26.95 (4.43) | Spinal fusion somewhere between C7 and L5; no acute fractures, walking aids, or acute/chronic illnesses that prevent safe walking; WHO register (INT: DRKS00013145) |
| Osteoarthritis 2 | 60 | 29; 31 | 64.00 (11.27) | 171.00 (9.15) | 25.68 (2.35) | 30 knee osteoarthritis and 30 hip osteoarthritis; walking without walking aids; no walking impairments that prevent safe walking; no acute or chronic diseases; no pelvic or spinal surgery; no pregnancy; BMI < 30; WHO register (INT: DRKS00017240) |
| One Class SVM | Binary RF Classifier | ||||||||||
|---|---|---|---|---|---|---|---|---|---|---|---|
| Data | F1 | MCC | BSS | CM | F1 | MCC | BSS | CM | |||
| Synthetic | S1 | 0.96 ± 0.05 | 0.92 ± 0.1 | 0.84 ± 0.12 | 220 | 2 | 1.0 ± 0.0 | 1.0 ± 0.01 | 0.93 ± 0.02 | 239 | 0 |
| 20 | 238 | 1 | 240 | ||||||||
| S2 | 0.99 ± 0.01 | 0.99 ± 0.02 | 0.95 ± 0.02 | 237 | 0 | 0.98 ± 0.03 | 0.96 ± 0.07 | 0.88 ± 0.05 | 230 | 1 | |
| 3 | 240 | 10 | 239 | ||||||||
| S3 | 0.89 ± 0.03 | 0.77 ± 0.05 | 0.61 ± 0.12 | 203 | 19 | 0.95 ± 0.04 | 0.90 ± 0.09 | 0.79 ± 0.12 | 223 | 6 | |
| 37 | 221 | 17 | 234 | ||||||||
| S4 | 0.82 ± 0.09 | 0.65 ± 0.19 | 0.46 ± 0.23 | 192 | 38 | 0.90 ± 0.04 | 0.82 ± 0.06 | 0.65 ± 0.09 | 217 | 23 | |
| 48 | 202 | 23 | 217 | ||||||||
| Real | BP | 0.54 ± 0.13 | 0.13 ± 0.19 | 0.02 ± 0.10 | 149 | 165 | 0.62 ± 0.17 | 0.08 ± 0.34 | –0.08 ± 0.35 | 98 | 113 |
| 91 | 155 | 142 | 207 | ||||||||
| Spinal fusion | 0.80 ± 0.12 | 0.57 ± 0.23 | 0.33 ± 0.28 | 194 | 78 | 0.74 ± 0.25 | 0.45 ± 0.25 | 0.36 ± 0.31 | 171 | 86 | |
| 46 | 262 | 69 | 254 | ||||||||
| Osteoarthritis | 0.69 ± 0.04 | 0.21 ± 0.12 | 0.35 ± 0.30 | 138 | 230 | 0.78 ± 0.09 | 0.19 ± 0.21 | 41.28 ± 0.35 | 73 | 107 | |
| 102 | 370 | 167 | 493 | ||||||||
| Subject ID | OCSVM Mean Prediction Probability | RF Mean Prediction Probability | Location of Spinal Fusion | LIME OCSVM | LIME RF |
|---|---|---|---|---|---|
| 1962247 | 1.00 ± 0.00 | 0.92 ± 0.00 | L1–S1 | T8, T9, P | T9, T10, T7 |
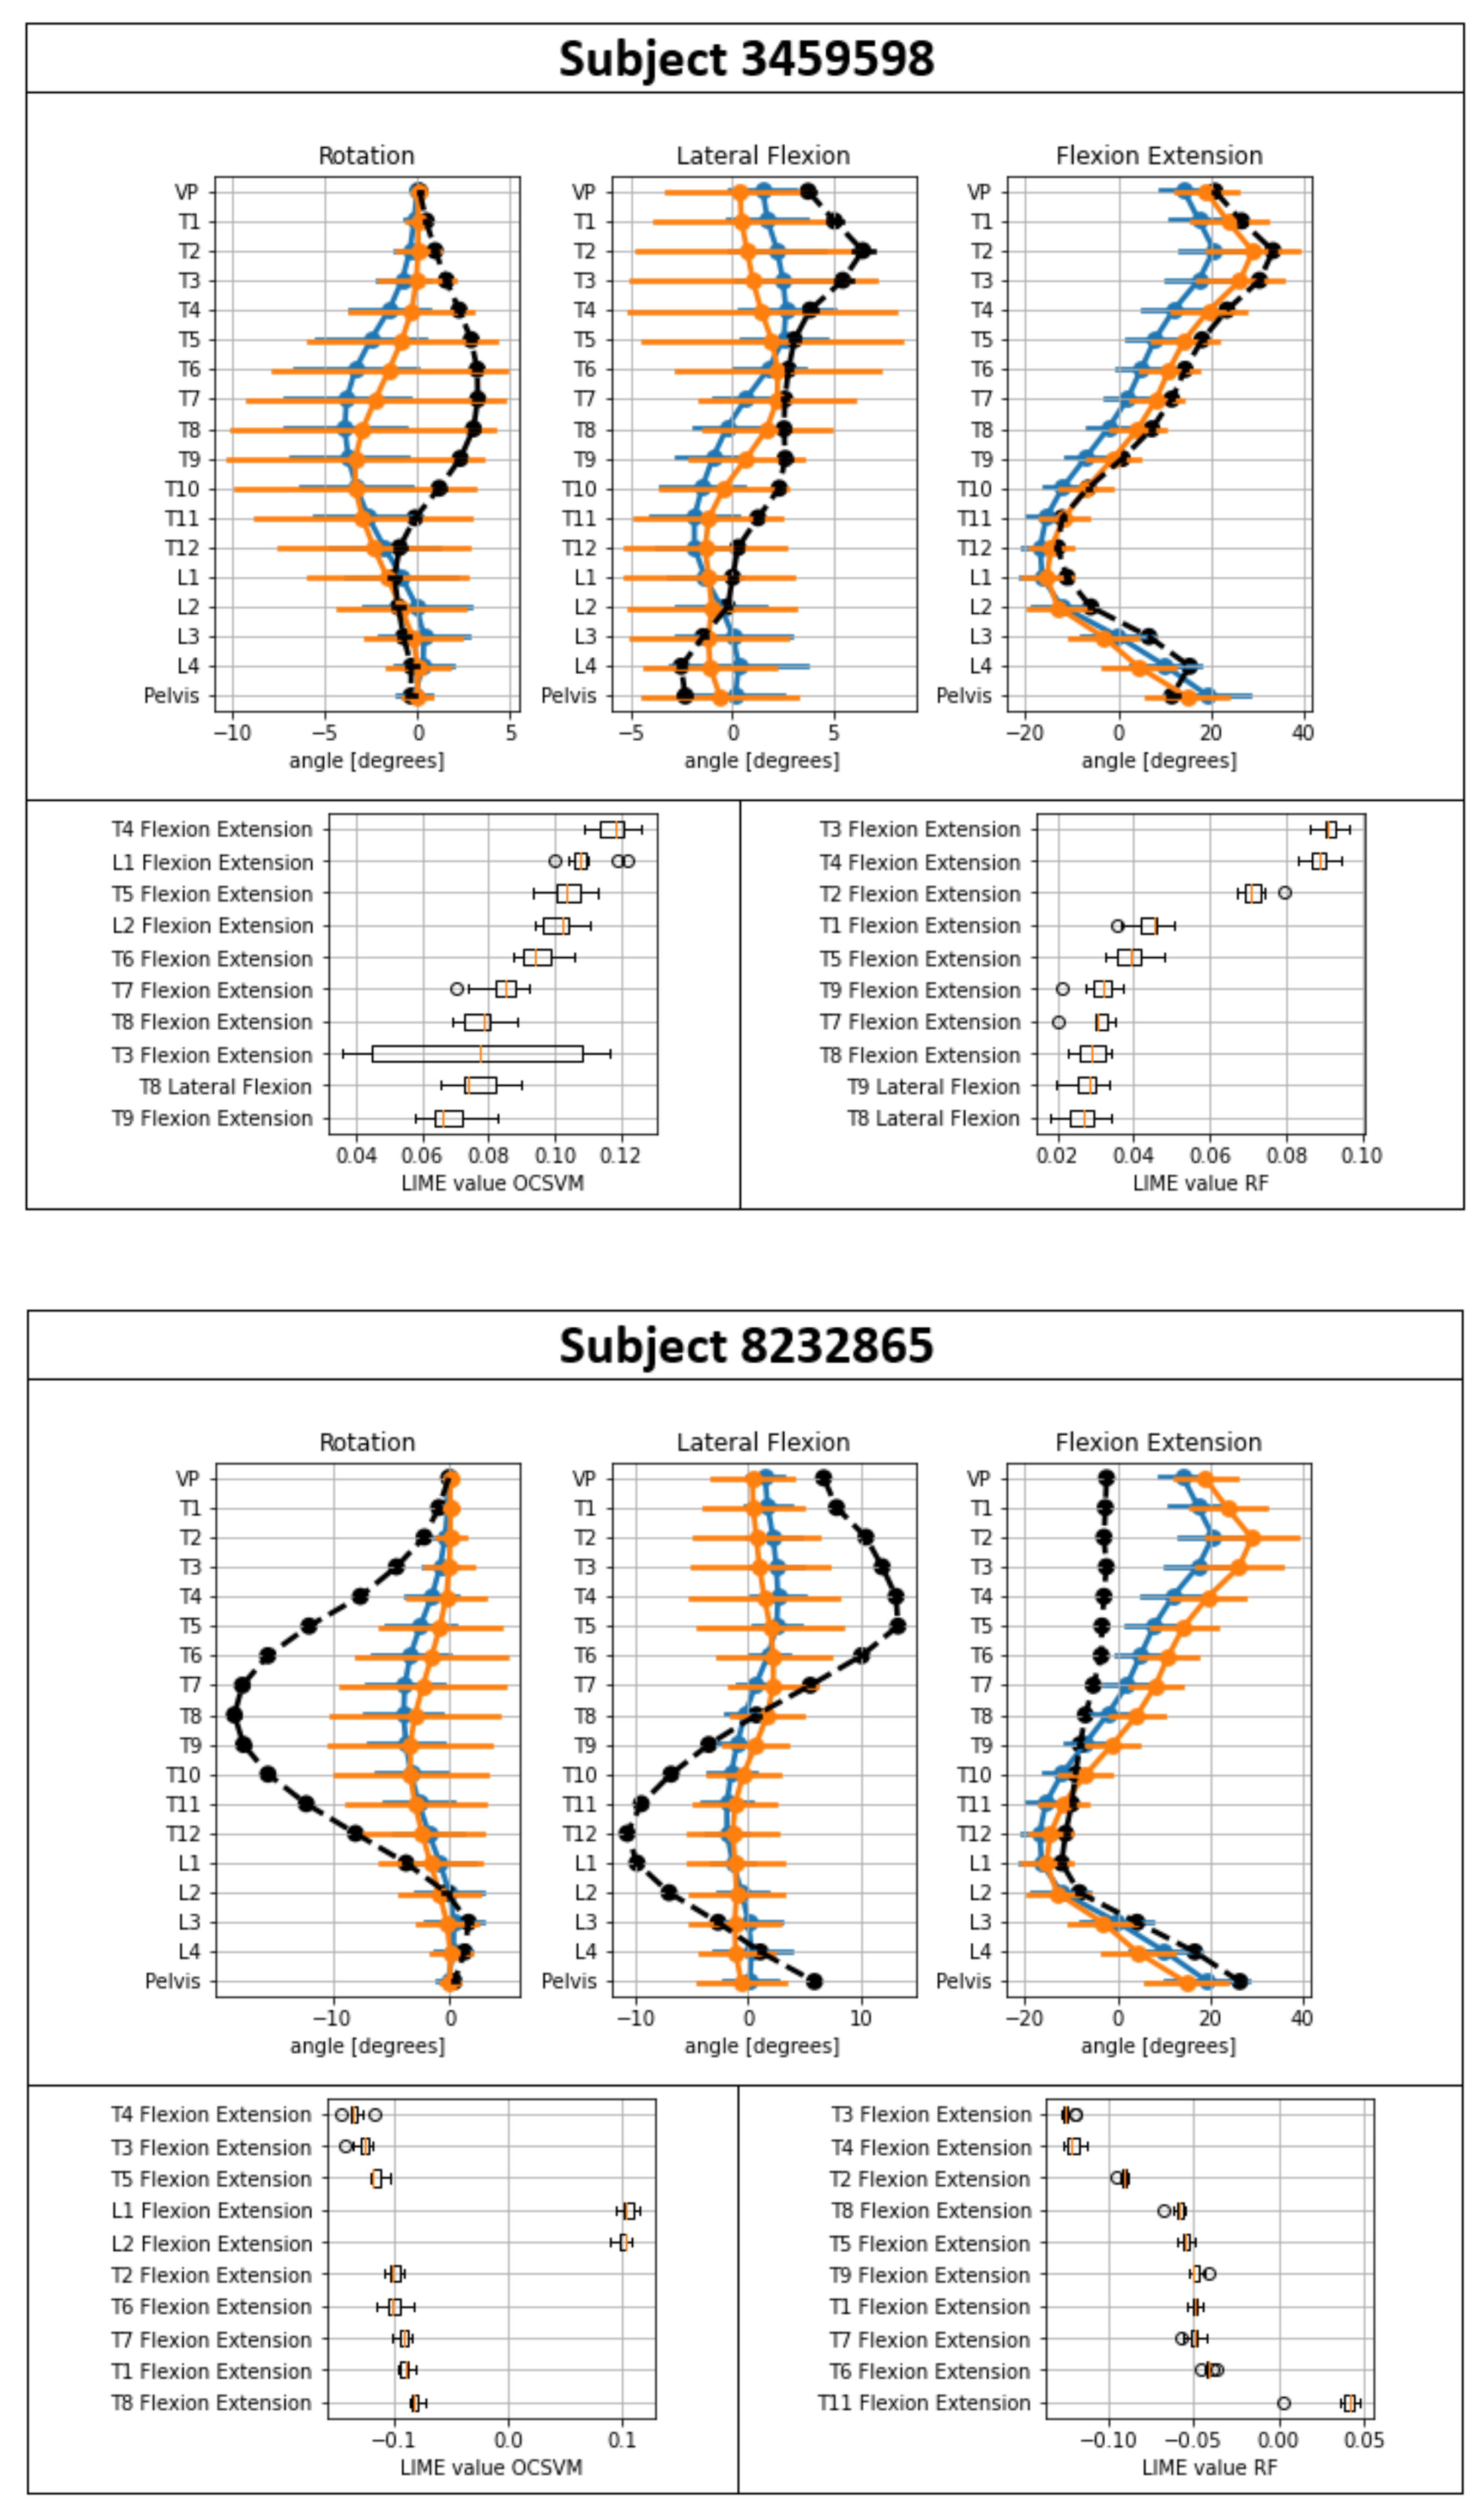
| 3459598 | 1.00 ± 0.00 | 0.93 ± 0.00 | T10–L2 | T4, L1, T5 | T3, T4, T2 |
| 7741511 | 0.99 ± 0.00 | 0.90 ± 0.01 | L5–S1 | T9, P, T3 | T9, T10, T7 |
| 5777016 | 0.98 ± 0.01 | 0.92 ± 0.00 | T10–L3 | L4, P, P | T9, T7, T5 |
| 7475130 | 0.96 ± 0.01 | 0.73 ± 0.01 | L3–S1 | T4, T5, T6 | T4, T3, T2 |
| 9342653 | 0.96 ± 0.01 | 0.80 ± 0.04 | L4–L5 | L4, P, L1 | T9, T7, T8 |
| 3729138 | 0.90 ± 0.01 | 0.87 ± 0.02 | L2–L3 | P, P, T8 | T3, T4, T7 |
| 5536002 | 0.87 ± 0.02 | 0.71 ± 0.03 | T6–L3 | L4, P, T2 | T3, T4, T7 |
| 6705867 | 0.87 ± 0.02 | 0.84 ± 0.01 | L5–S1 | P, T12, L4 | T3, T4, T12 |
| 5247355 | 0.83 ± 0.03 | 0.88 ± 0.02 | L5–S1 | P, L4, T8 | T4, T5, T8 |
| 5297873 | 0.81 ± 0.03 | 0.80 ± 0.02 | L4–L5 | P, P, T7 | T8, T7, T5 |
| 5408449 | 0.80 ± 0.02 | 0.71 ± 0.02 | T4–L1 | T7, T8, T12 | T5, T4, L1 |
| 3336746 | 0.78 ± 0.02 | 0.93 ± 0.01 | L3–L5 | P, T8, P | T4, T5, T8 |
| 9747703 | 0.77 ± 0.01 | 0.94 ± 0.01 | L3–L5 | P, L4, T3 | T4, T5, T8 |
| 2324908 | 0.76 ± 0.06 | 0.90 ± 0.01 | T11–L3 | P, L4, L3 | T3, T4, T7 |
| 8398276 | 0.75 ± 0.05 | 0.43 ± 0.03 | T10–L2 | L4, P, T11 | T3, T4, T7 |
| 3012624 | 0.70 ± 0.07 | 0.83 ± 0.07 | L4–L5 | P, T8, T12 | T3, T4, T7 |
| 7767875 | 0.62 ± 0.02 | 0.82 ± 0.02 | C6–T2 | P, P, L4 | T5, T4, T6 |
| 5815929 | 0.60 ± 0.03 | 0.92 ± 0.00 | T12–L2 | P, L4, P | T4, T5, T8 |
| 9621669 | 0.56 ± 0.09 | 0.34 ± 0.05 | T12–L2 | T4, T3, T5 | T3, T4, T2 |
| 1082776 | 0.55 ± 0.00 | 0.43 ± 0.05 | L2–L4 | L4, T4, T5 | T3, T11, L4 |
| 649887 | 0.53 ± 0.01 | 0.82 ± 0.01 | L4–L5 | VP, T3, T9 | T3, T3, T4 |
| 7550216 | 0.53 ± 0.00 | 0.82 ± 0.02 | T10–L5 | VP, T3, T9 | T3, T9, T6 |
| 3943929 | 0.51 ± 0.00 | 0.88 ± 0.01 | L3–L4 | L4, T9, L3 | T9, T3, T4 |
| 5584179 | 0.51 ± 0.01 | 0.89 ± 0.01 | L4–L5 | T9, T4, VP | T9, T3, T8 |
| 6777530 | 0.51 ± 0.01 | 0.86 ± 0.01 | L2–L4 | VP, T3, L3 | T3, T9, T6 |
| 9299446 | 0.50 ± 0.01 | 0.32 ± 0.03 | T5–T10 | L3, VP, T12 | T3, T7, T3 |
| 632814 | 0.45 ± 0.01 | 0.76 ± 0.06 | L4–S1 | L4, VP, T3 | T3, T9, T6 |
| 3035442 | 0.42 ± 0.00 | 0.71 ± 0.02 | T11–L2 | L4, VP, T3 | T3, T9, T8 |
| 6683738 | 0.41 ± 0.09 | 0.11 ± 0.01 | L4–L5 | T3, L1, T2 | T3, T2, T10 |
| 2064644 | 0.31 ± 0.06 | 0.19 ± 0.05 | L4–S1 | P, T7, T11 | T10, T9, T7 |
| 9664225 | 0.08 ± 0.04 | 0.44 ± 0.13 | T6–T11 | T12, L4, T11 | T3, T4, T12 |
| 1084868 | 0.03 ± 0.00 | 0.08 ± 0.01 | T6–T10 | T8, T9, P | T9, T10, T8 |
| 8232865 | 0.00 ± 0.00 | 0.37 ± 0.02 | T1–L1 | T4, T3, T5 | T3, T4, T2 |
Publisher’s Note: MDPI stays neutral with regard to jurisdictional claims in published maps and institutional affiliations. |
© 2021 by the authors. Licensee MDPI, Basel, Switzerland. This article is an open access article distributed under the terms and conditions of the Creative Commons Attribution (CC BY) license (https://creativecommons.org/licenses/by/4.0/).
Share and Cite
Dindorf, C.; Konradi, J.; Wolf, C.; Taetz, B.; Bleser, G.; Huthwelker, J.; Werthmann, F.; Bartaguiz, E.; Kniepert, J.; Drees, P.; et al. Classification and Automated Interpretation of Spinal Posture Data Using a Pathology-Independent Classifier and Explainable Artificial Intelligence (XAI). Sensors 2021, 21, 6323. https://doi.org/10.3390/s21186323
Dindorf C, Konradi J, Wolf C, Taetz B, Bleser G, Huthwelker J, Werthmann F, Bartaguiz E, Kniepert J, Drees P, et al. Classification and Automated Interpretation of Spinal Posture Data Using a Pathology-Independent Classifier and Explainable Artificial Intelligence (XAI). Sensors. 2021; 21(18):6323. https://doi.org/10.3390/s21186323
Chicago/Turabian StyleDindorf, Carlo, Jürgen Konradi, Claudia Wolf, Bertram Taetz, Gabriele Bleser, Janine Huthwelker, Friederike Werthmann, Eva Bartaguiz, Johanna Kniepert, Philipp Drees, and et al. 2021. "Classification and Automated Interpretation of Spinal Posture Data Using a Pathology-Independent Classifier and Explainable Artificial Intelligence (XAI)" Sensors 21, no. 18: 6323. https://doi.org/10.3390/s21186323