
Use of Multiple Low Cost Carbon Dioxide Sensors to Measure Exhaled Breath Distribution with Face Mask Type and Wearing Behaviour

 , , , , and
Abstract
:1. Introduction
- CO2 concentration with proper and improper wearing of face masks.
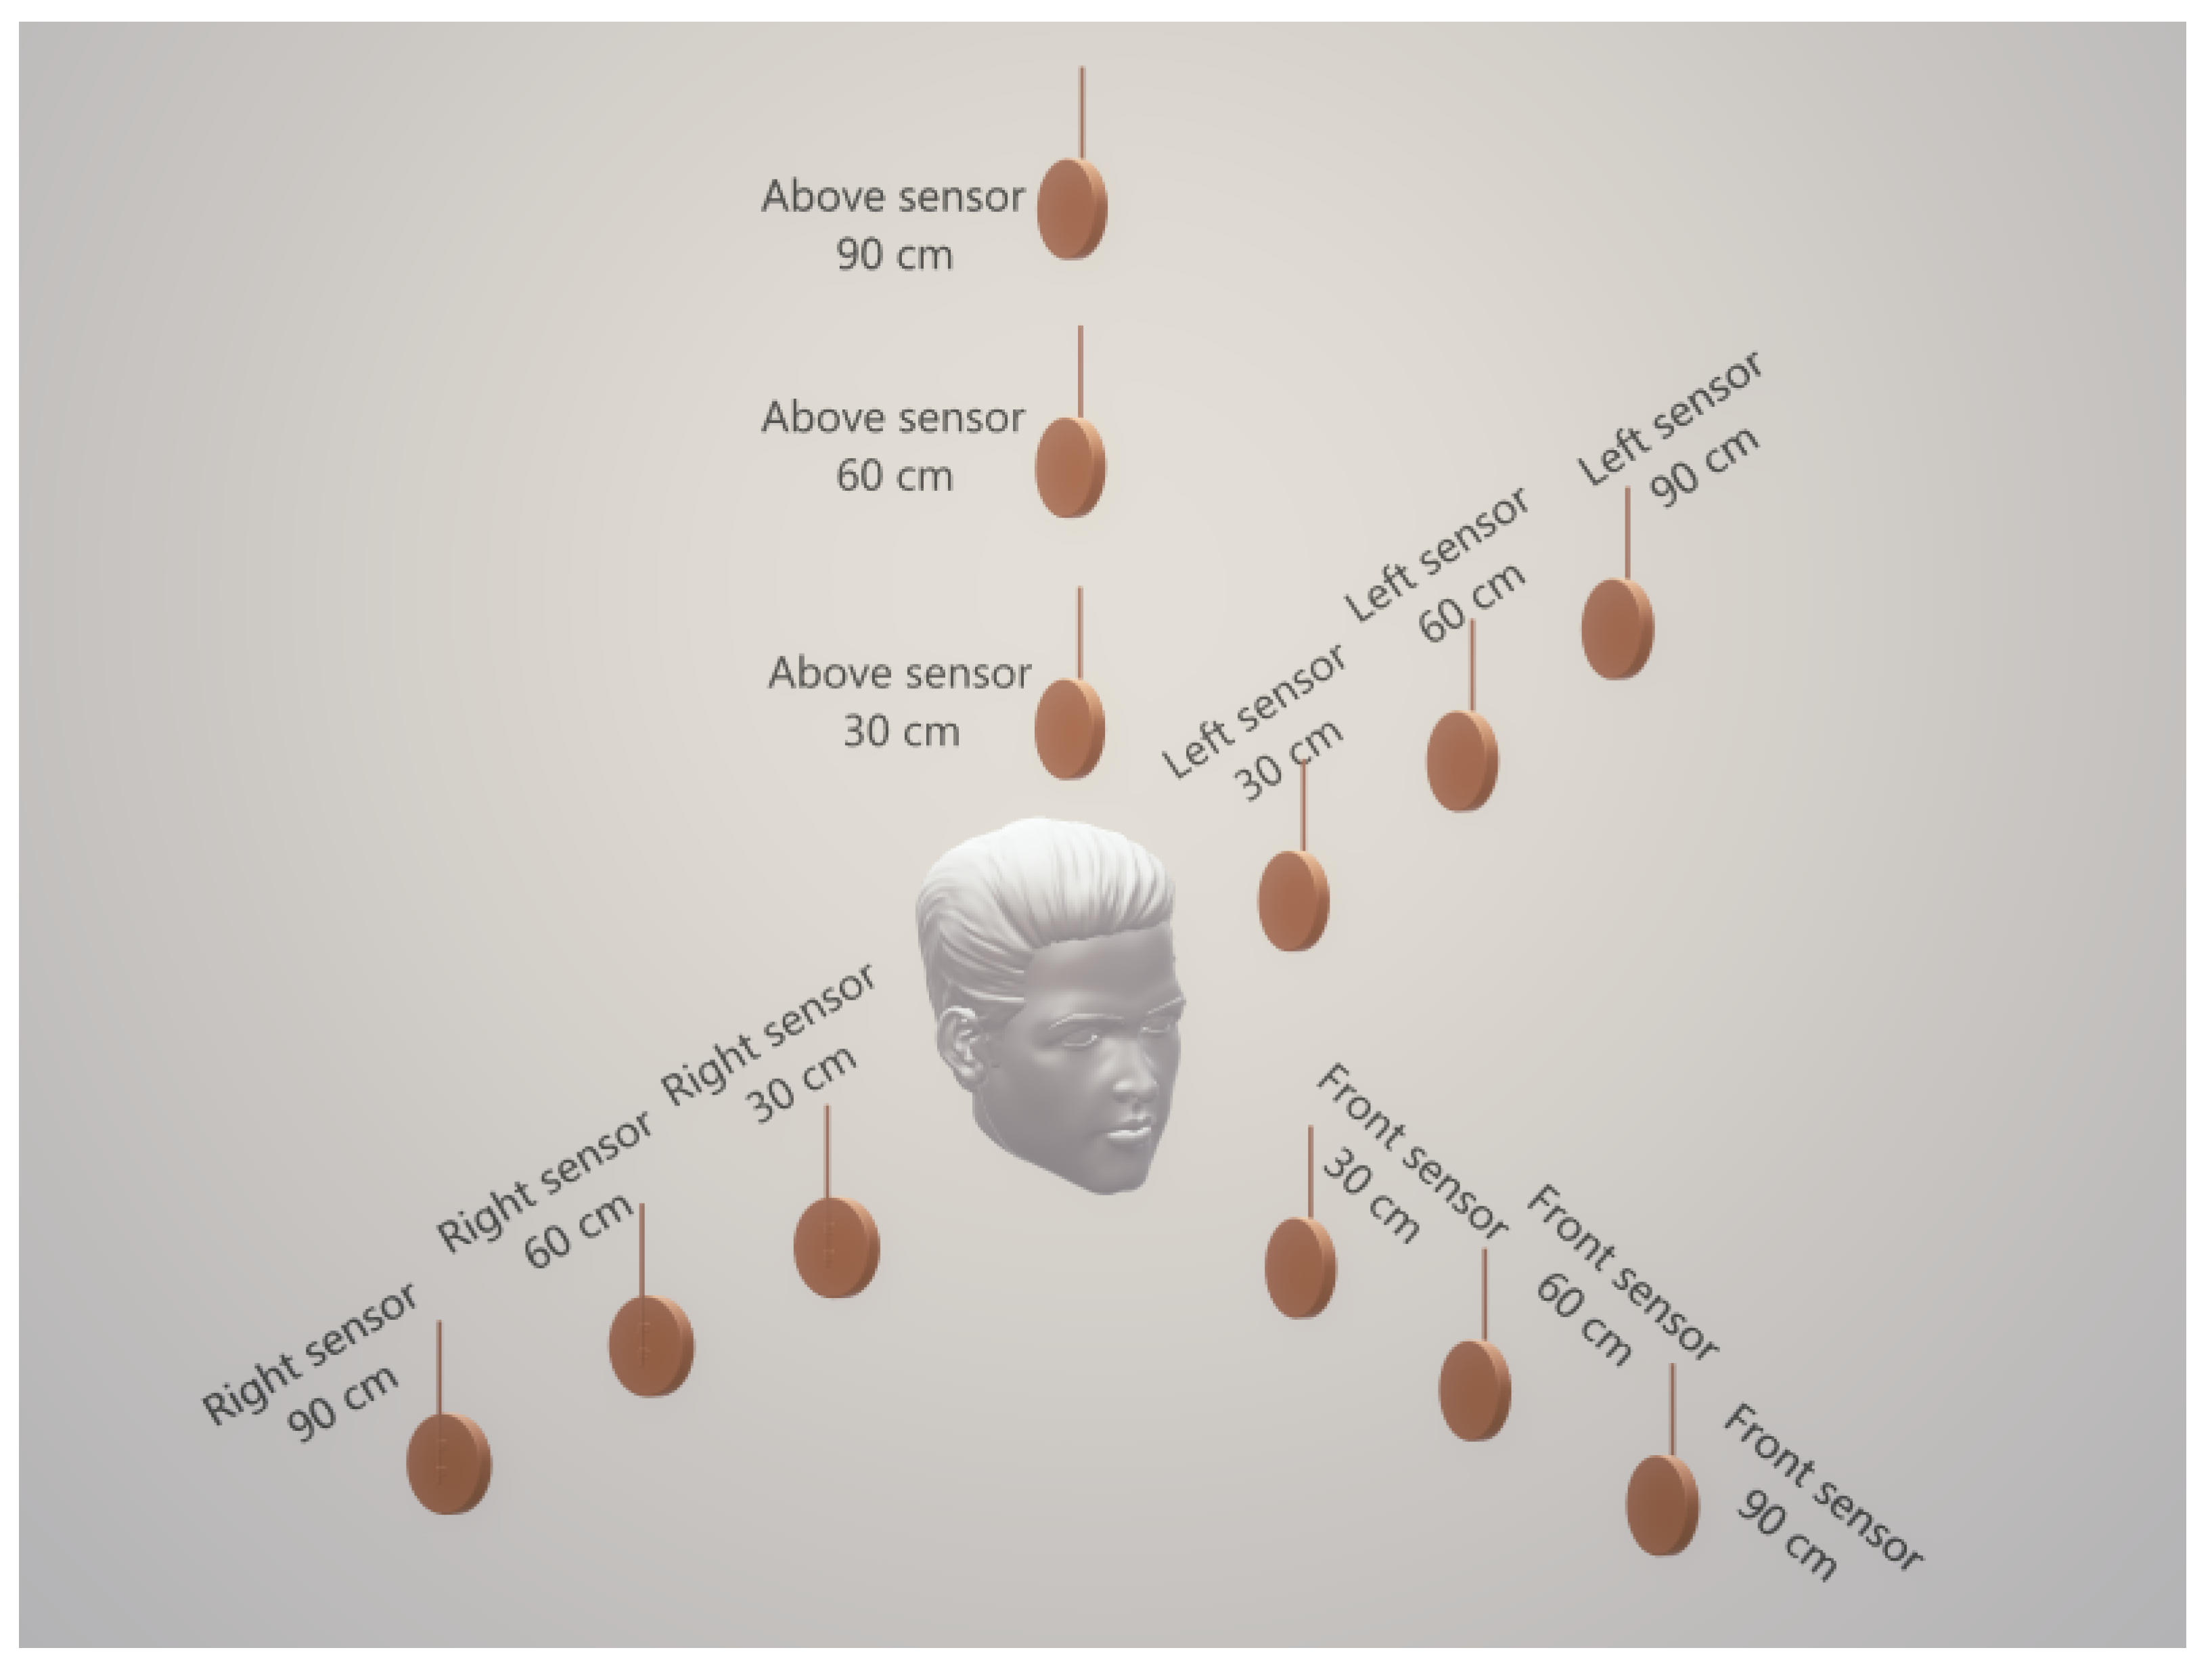
- CO2 concentration at different distances from the face.
- CO2 concentration in different directions of the face.
- CO2 concentration in an unventilated and naturally ventilated room.
2. Methodology
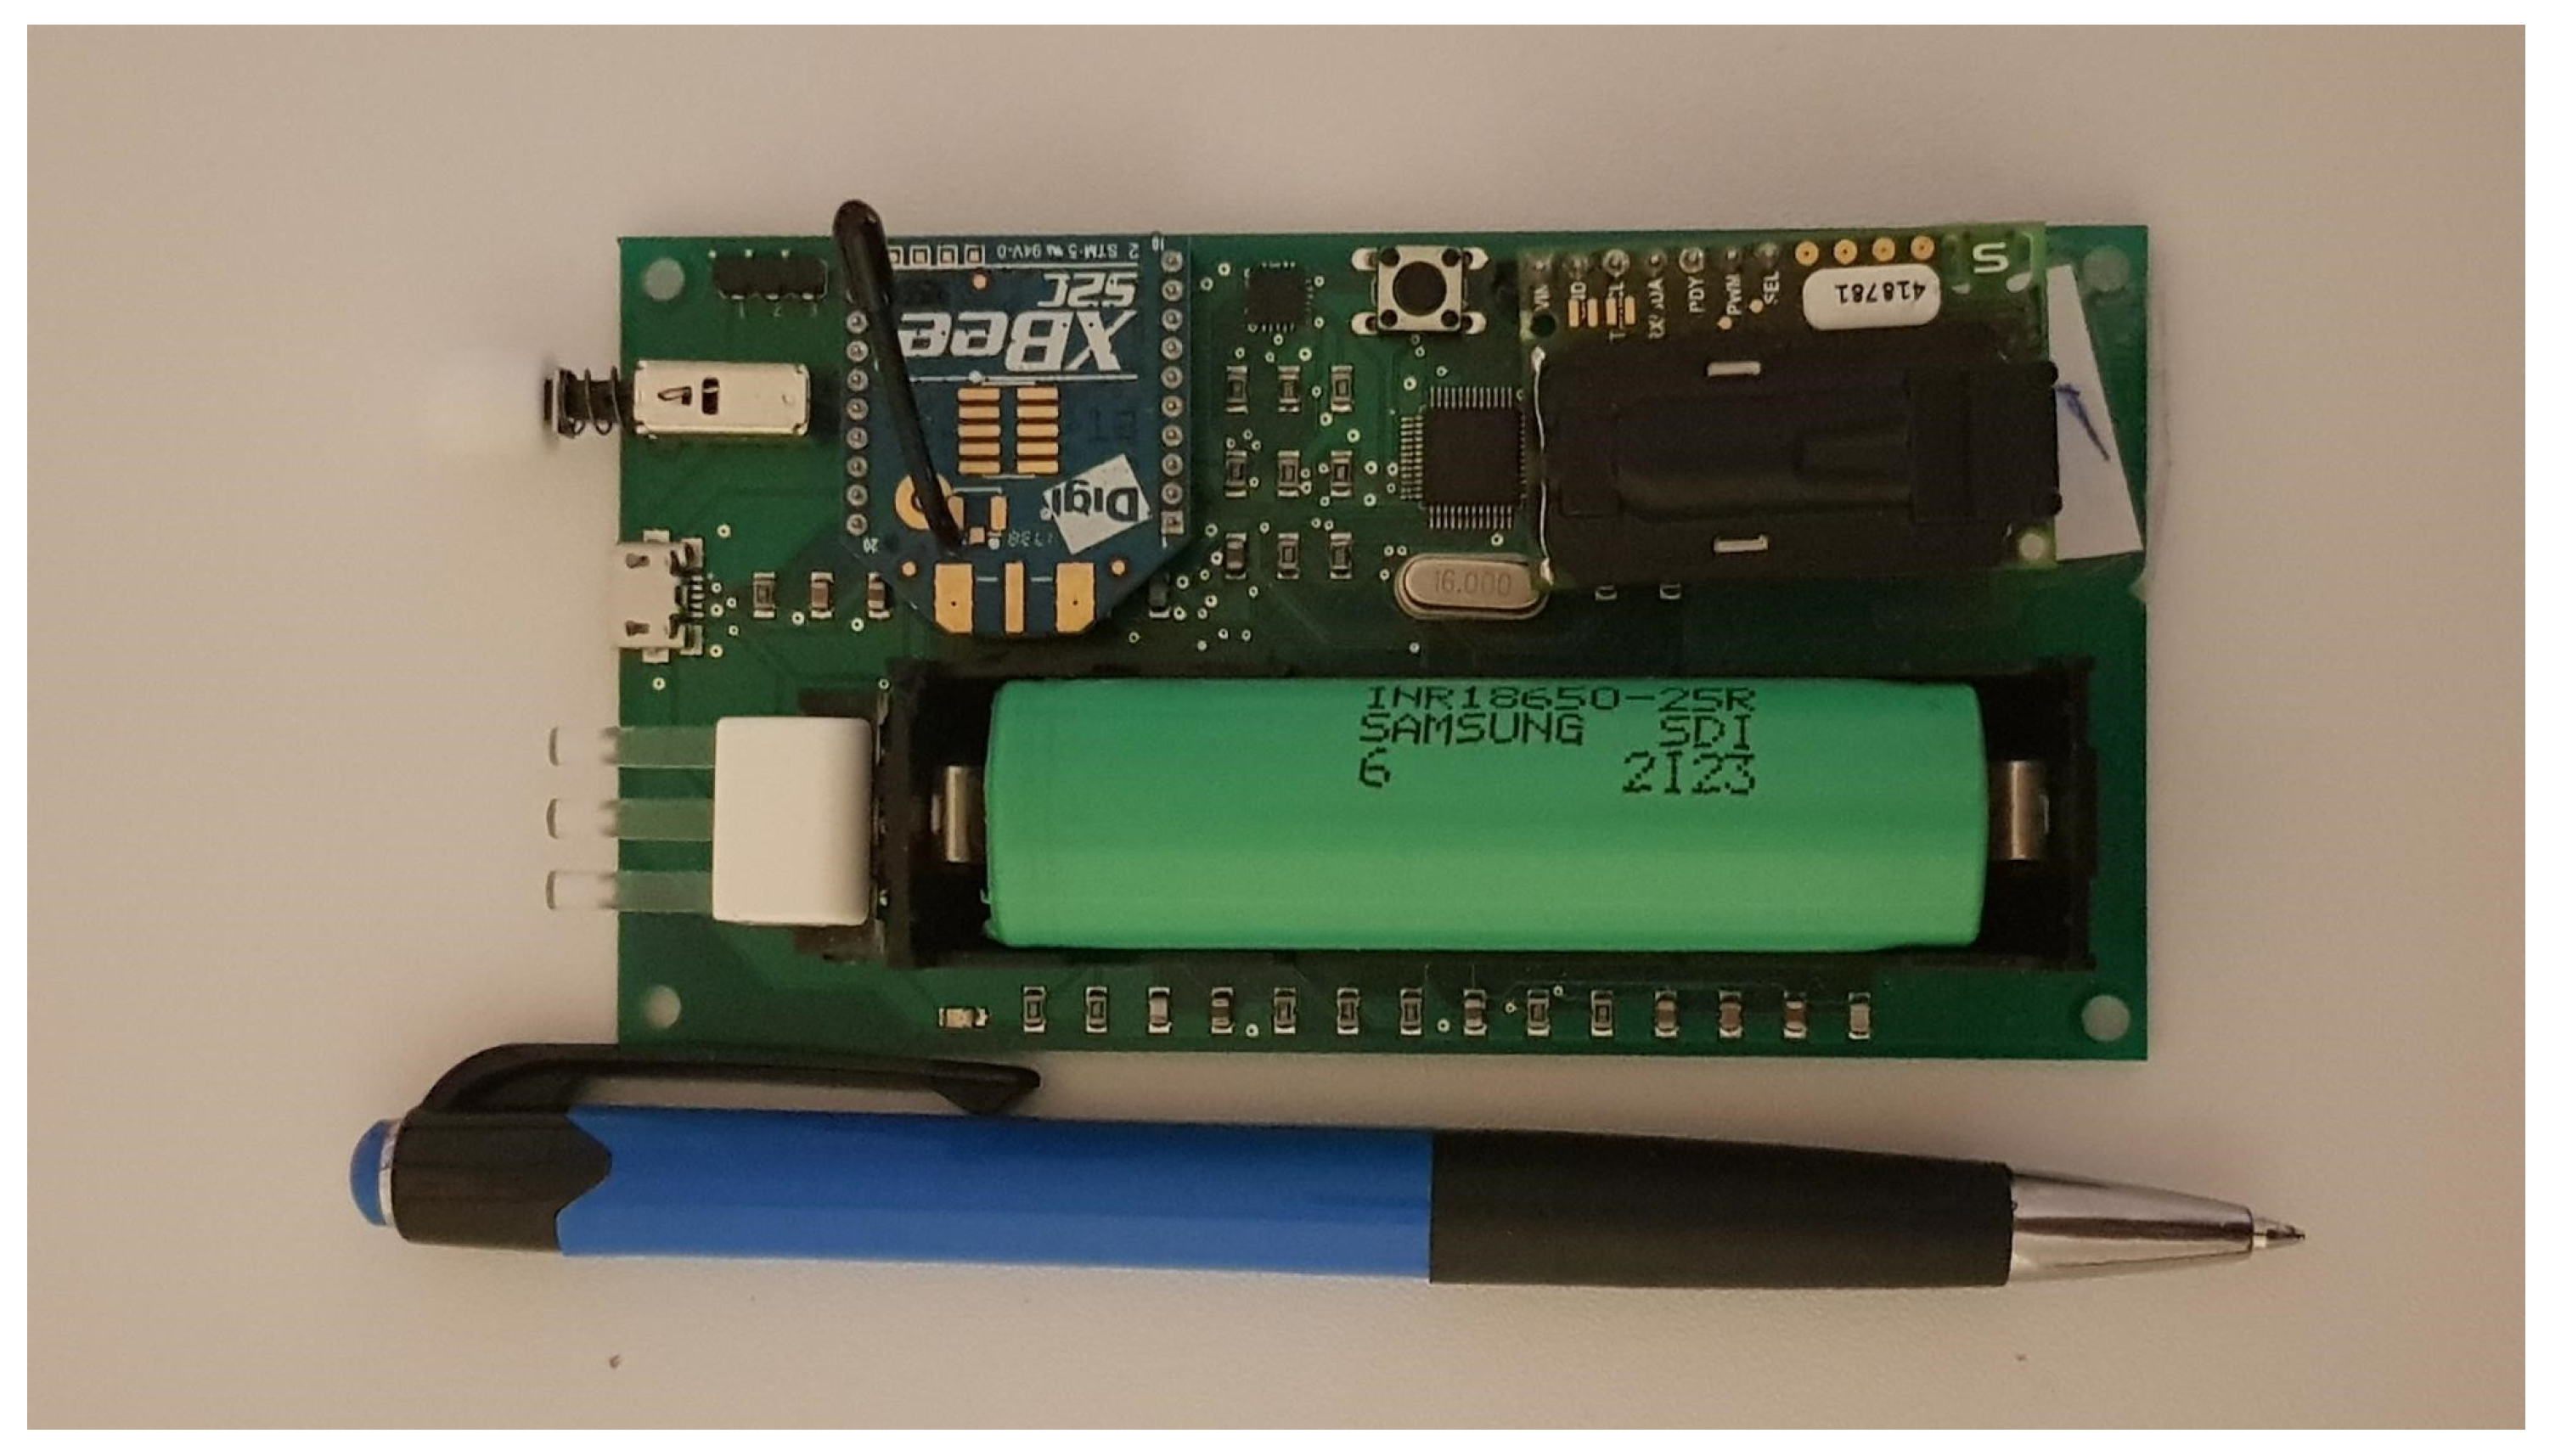
2.1. Hardware
2.1.1. Sensing
2.1.2. Communication
2.1.3. Data Processing
2.1.4. Power
2.1.5. Calibration
2.2. Test Conditions
3. Results
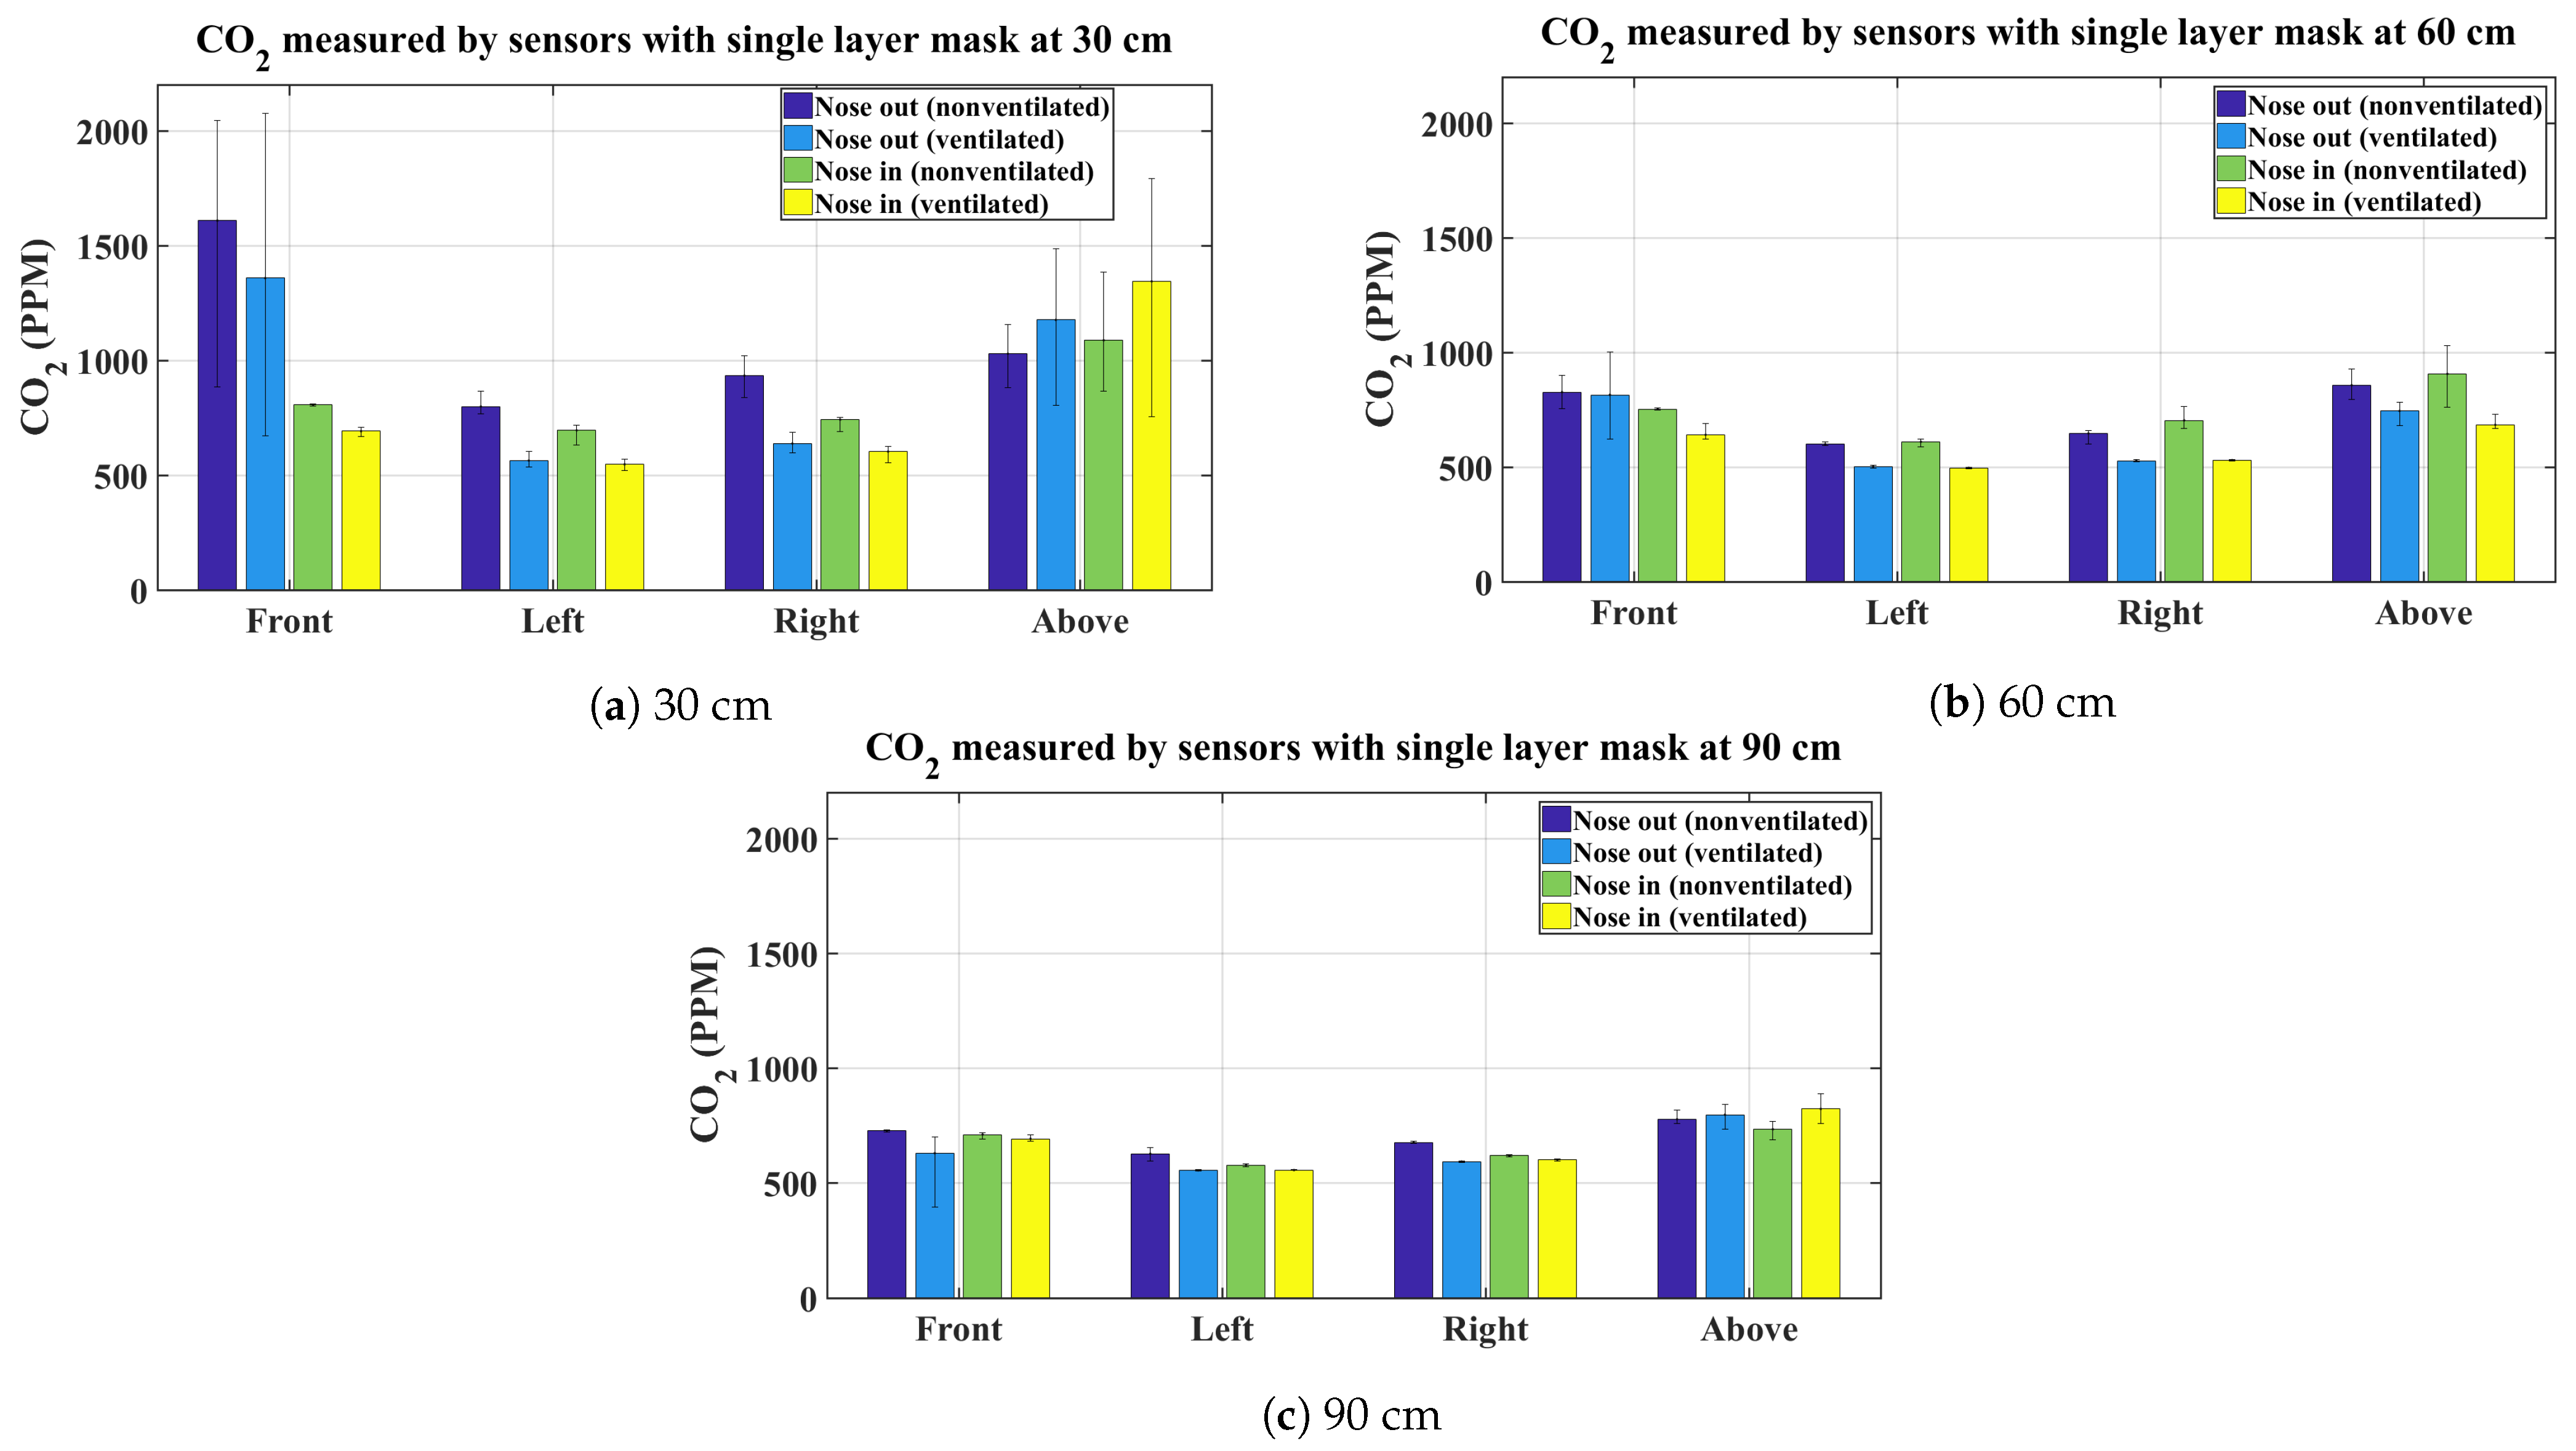
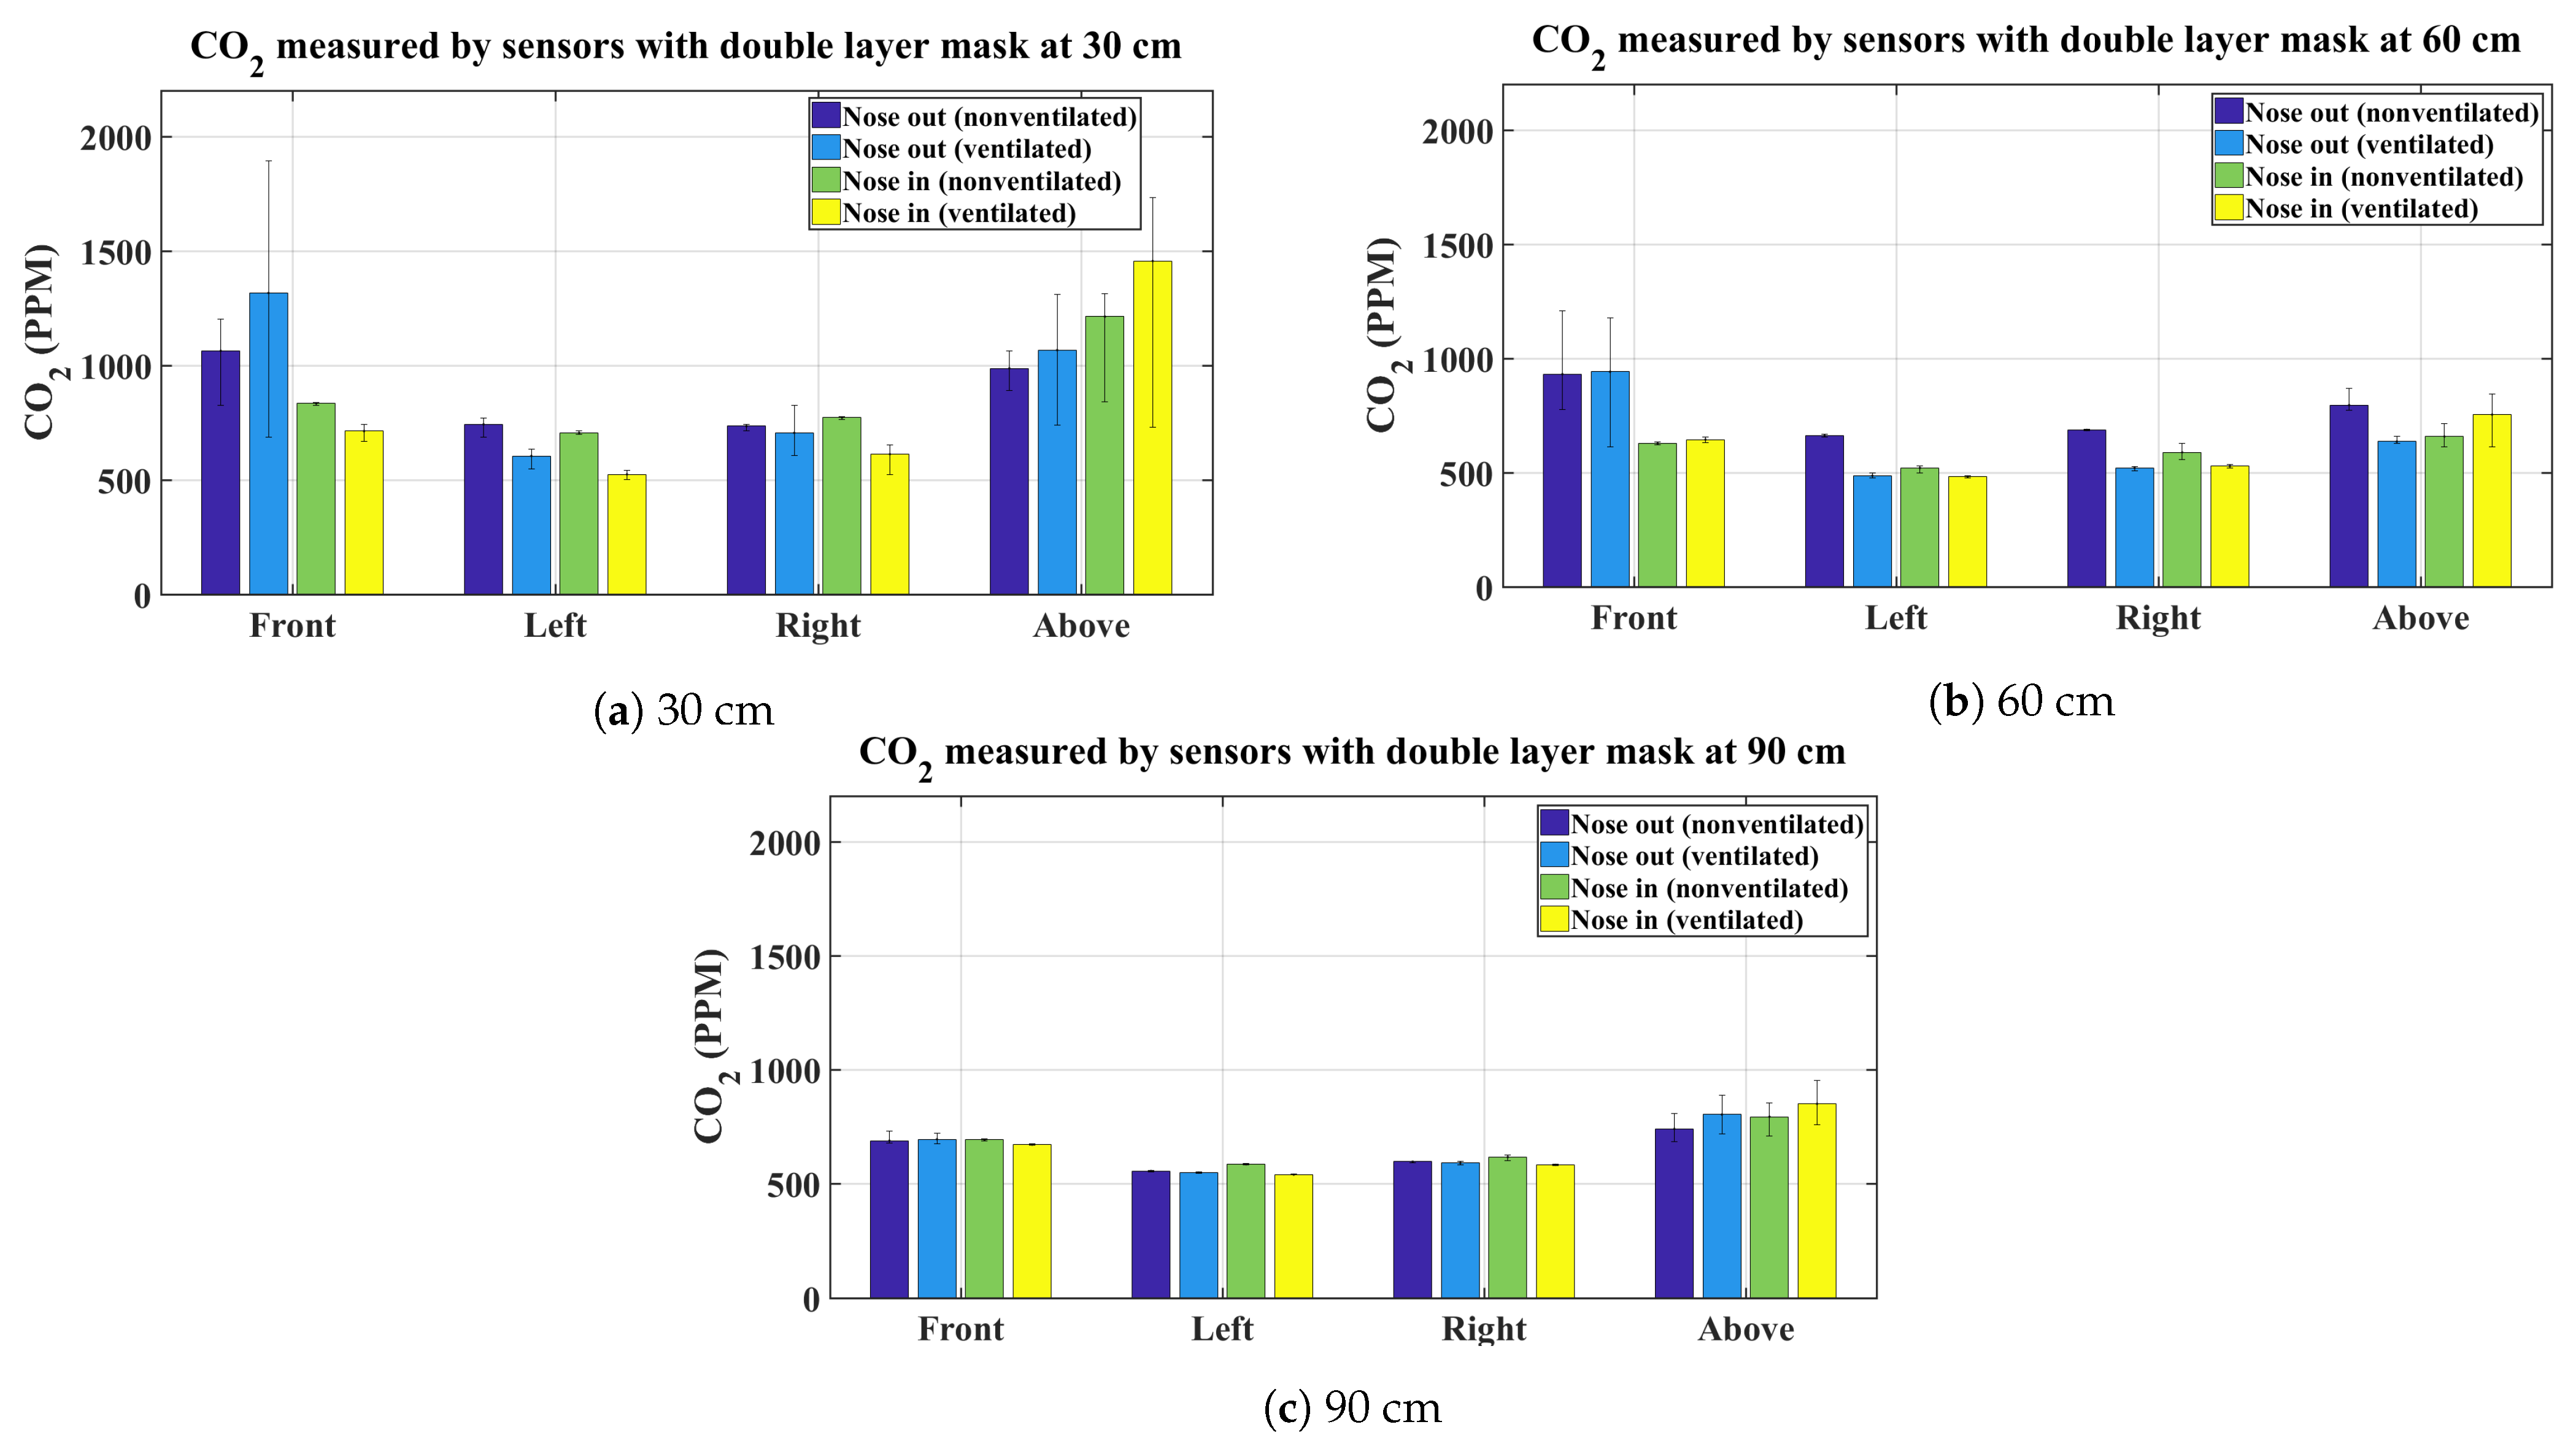
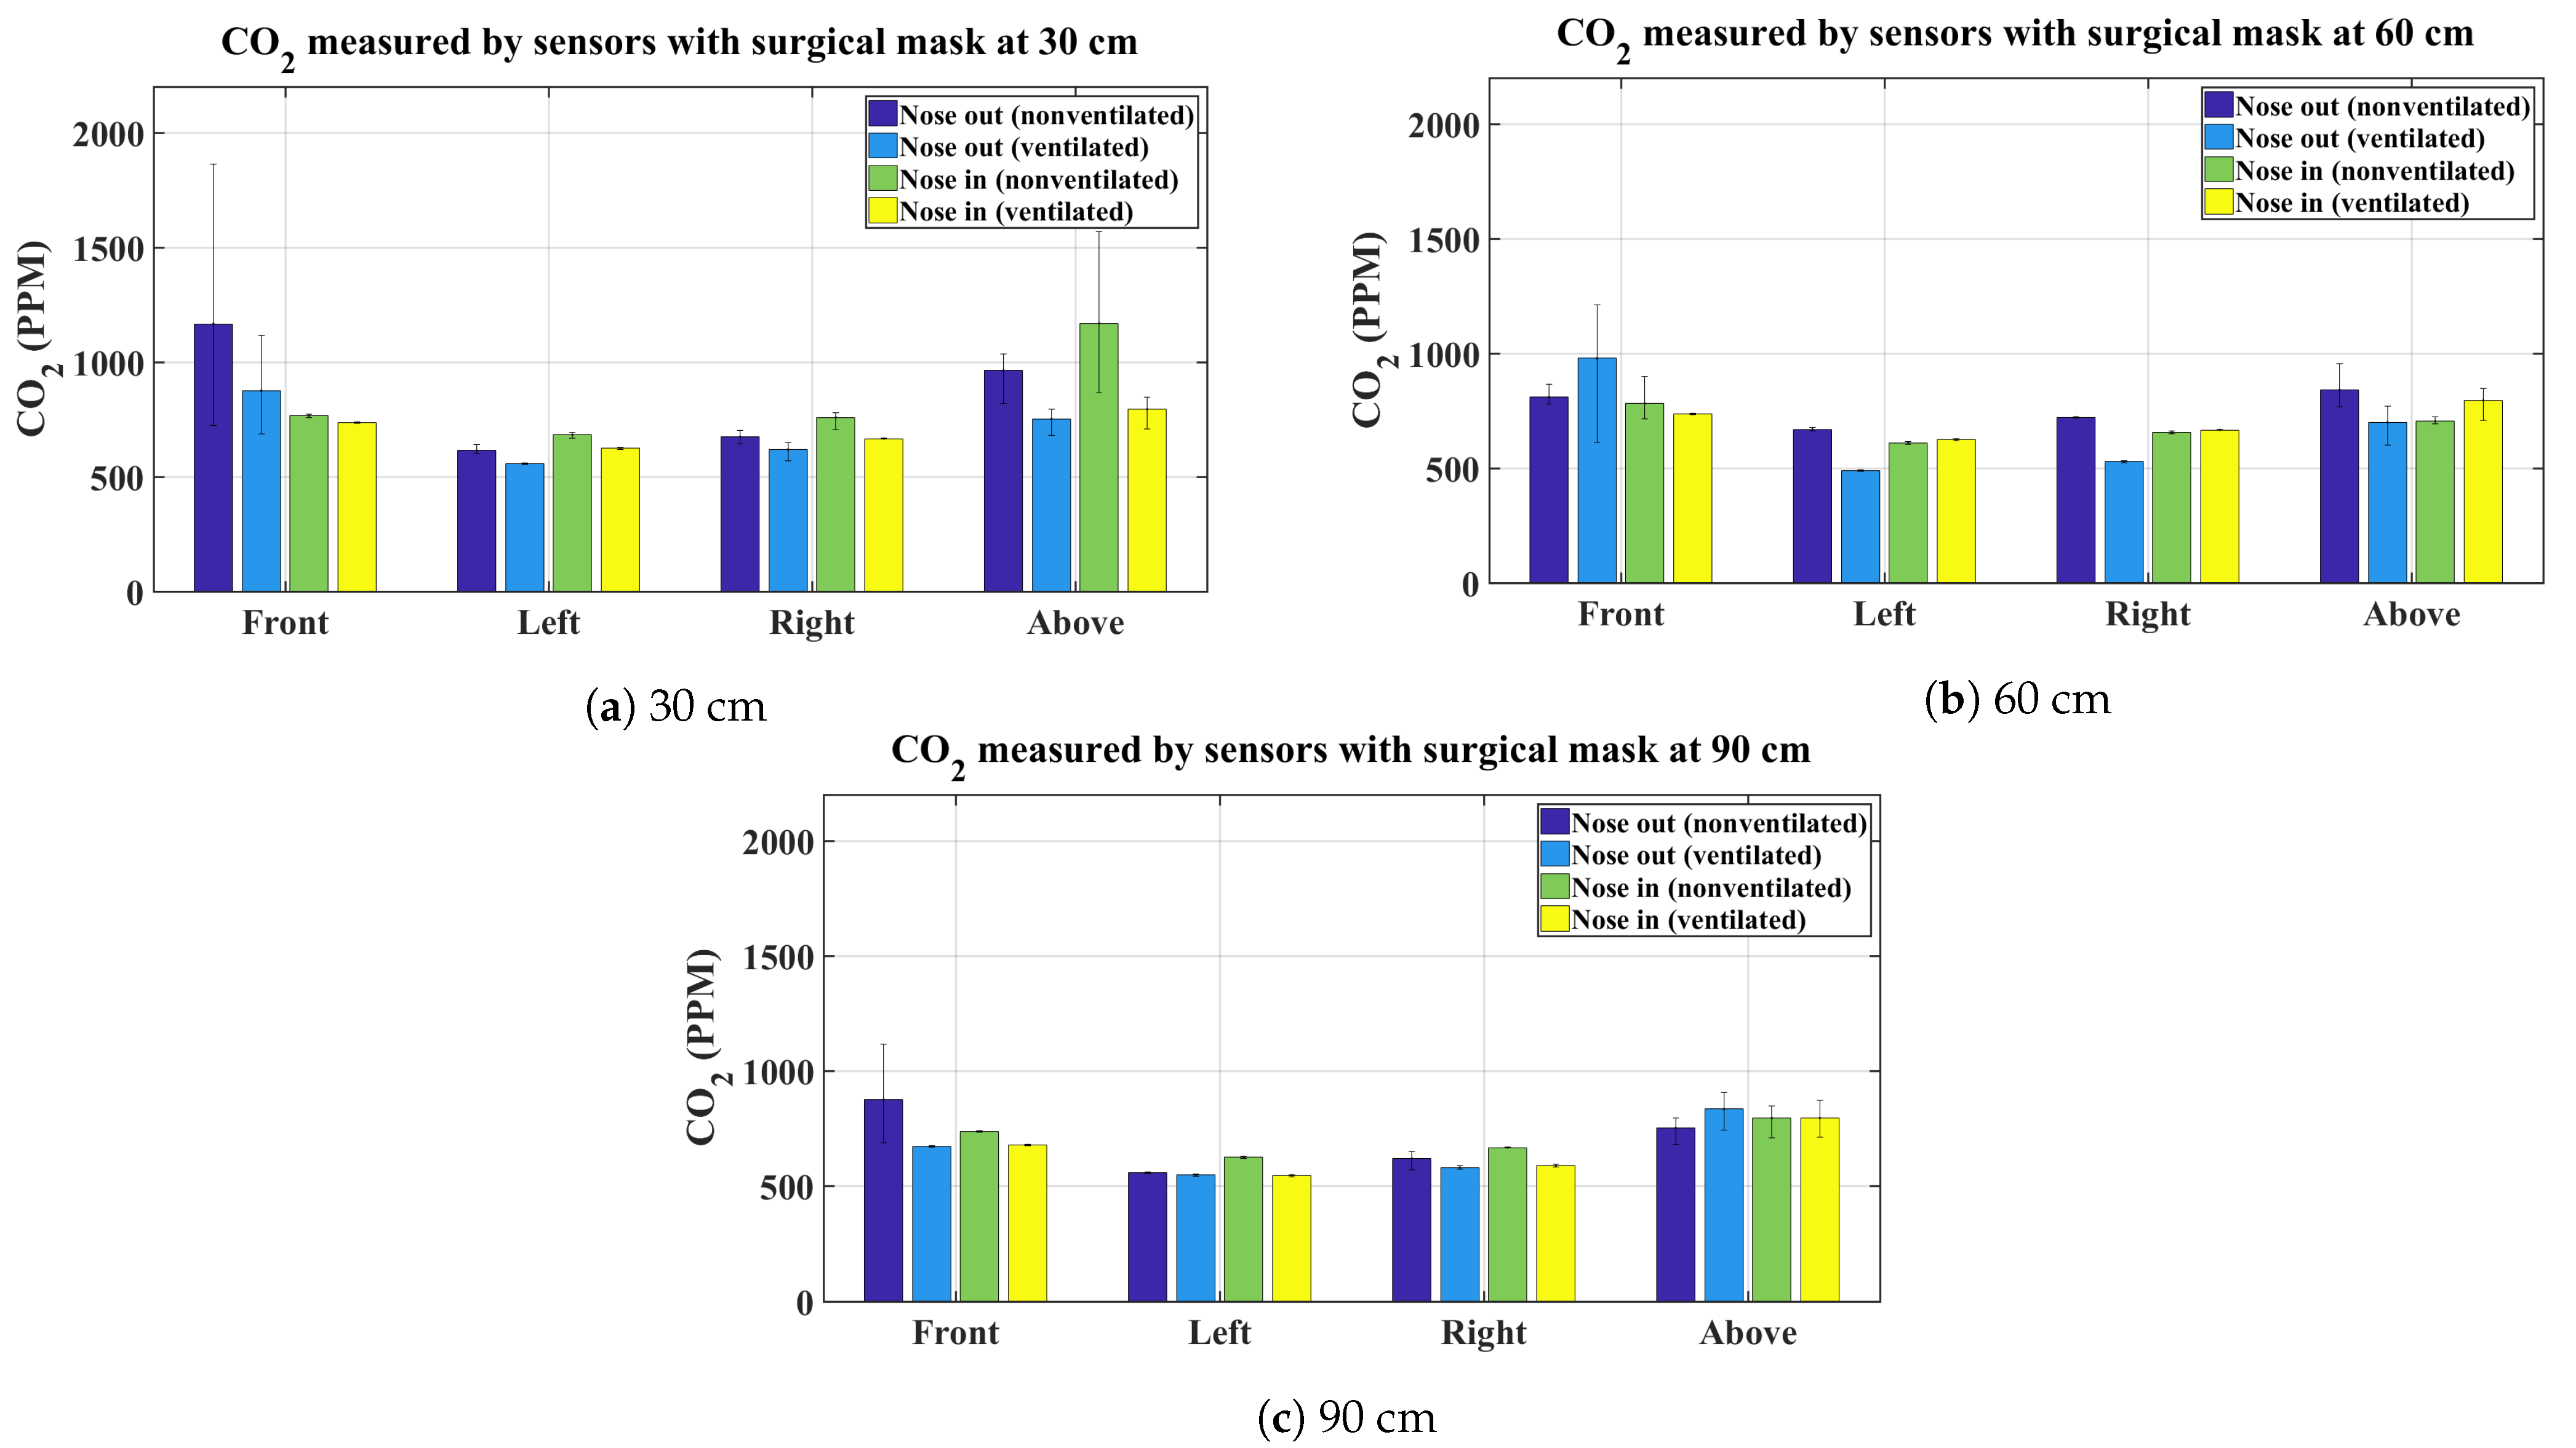
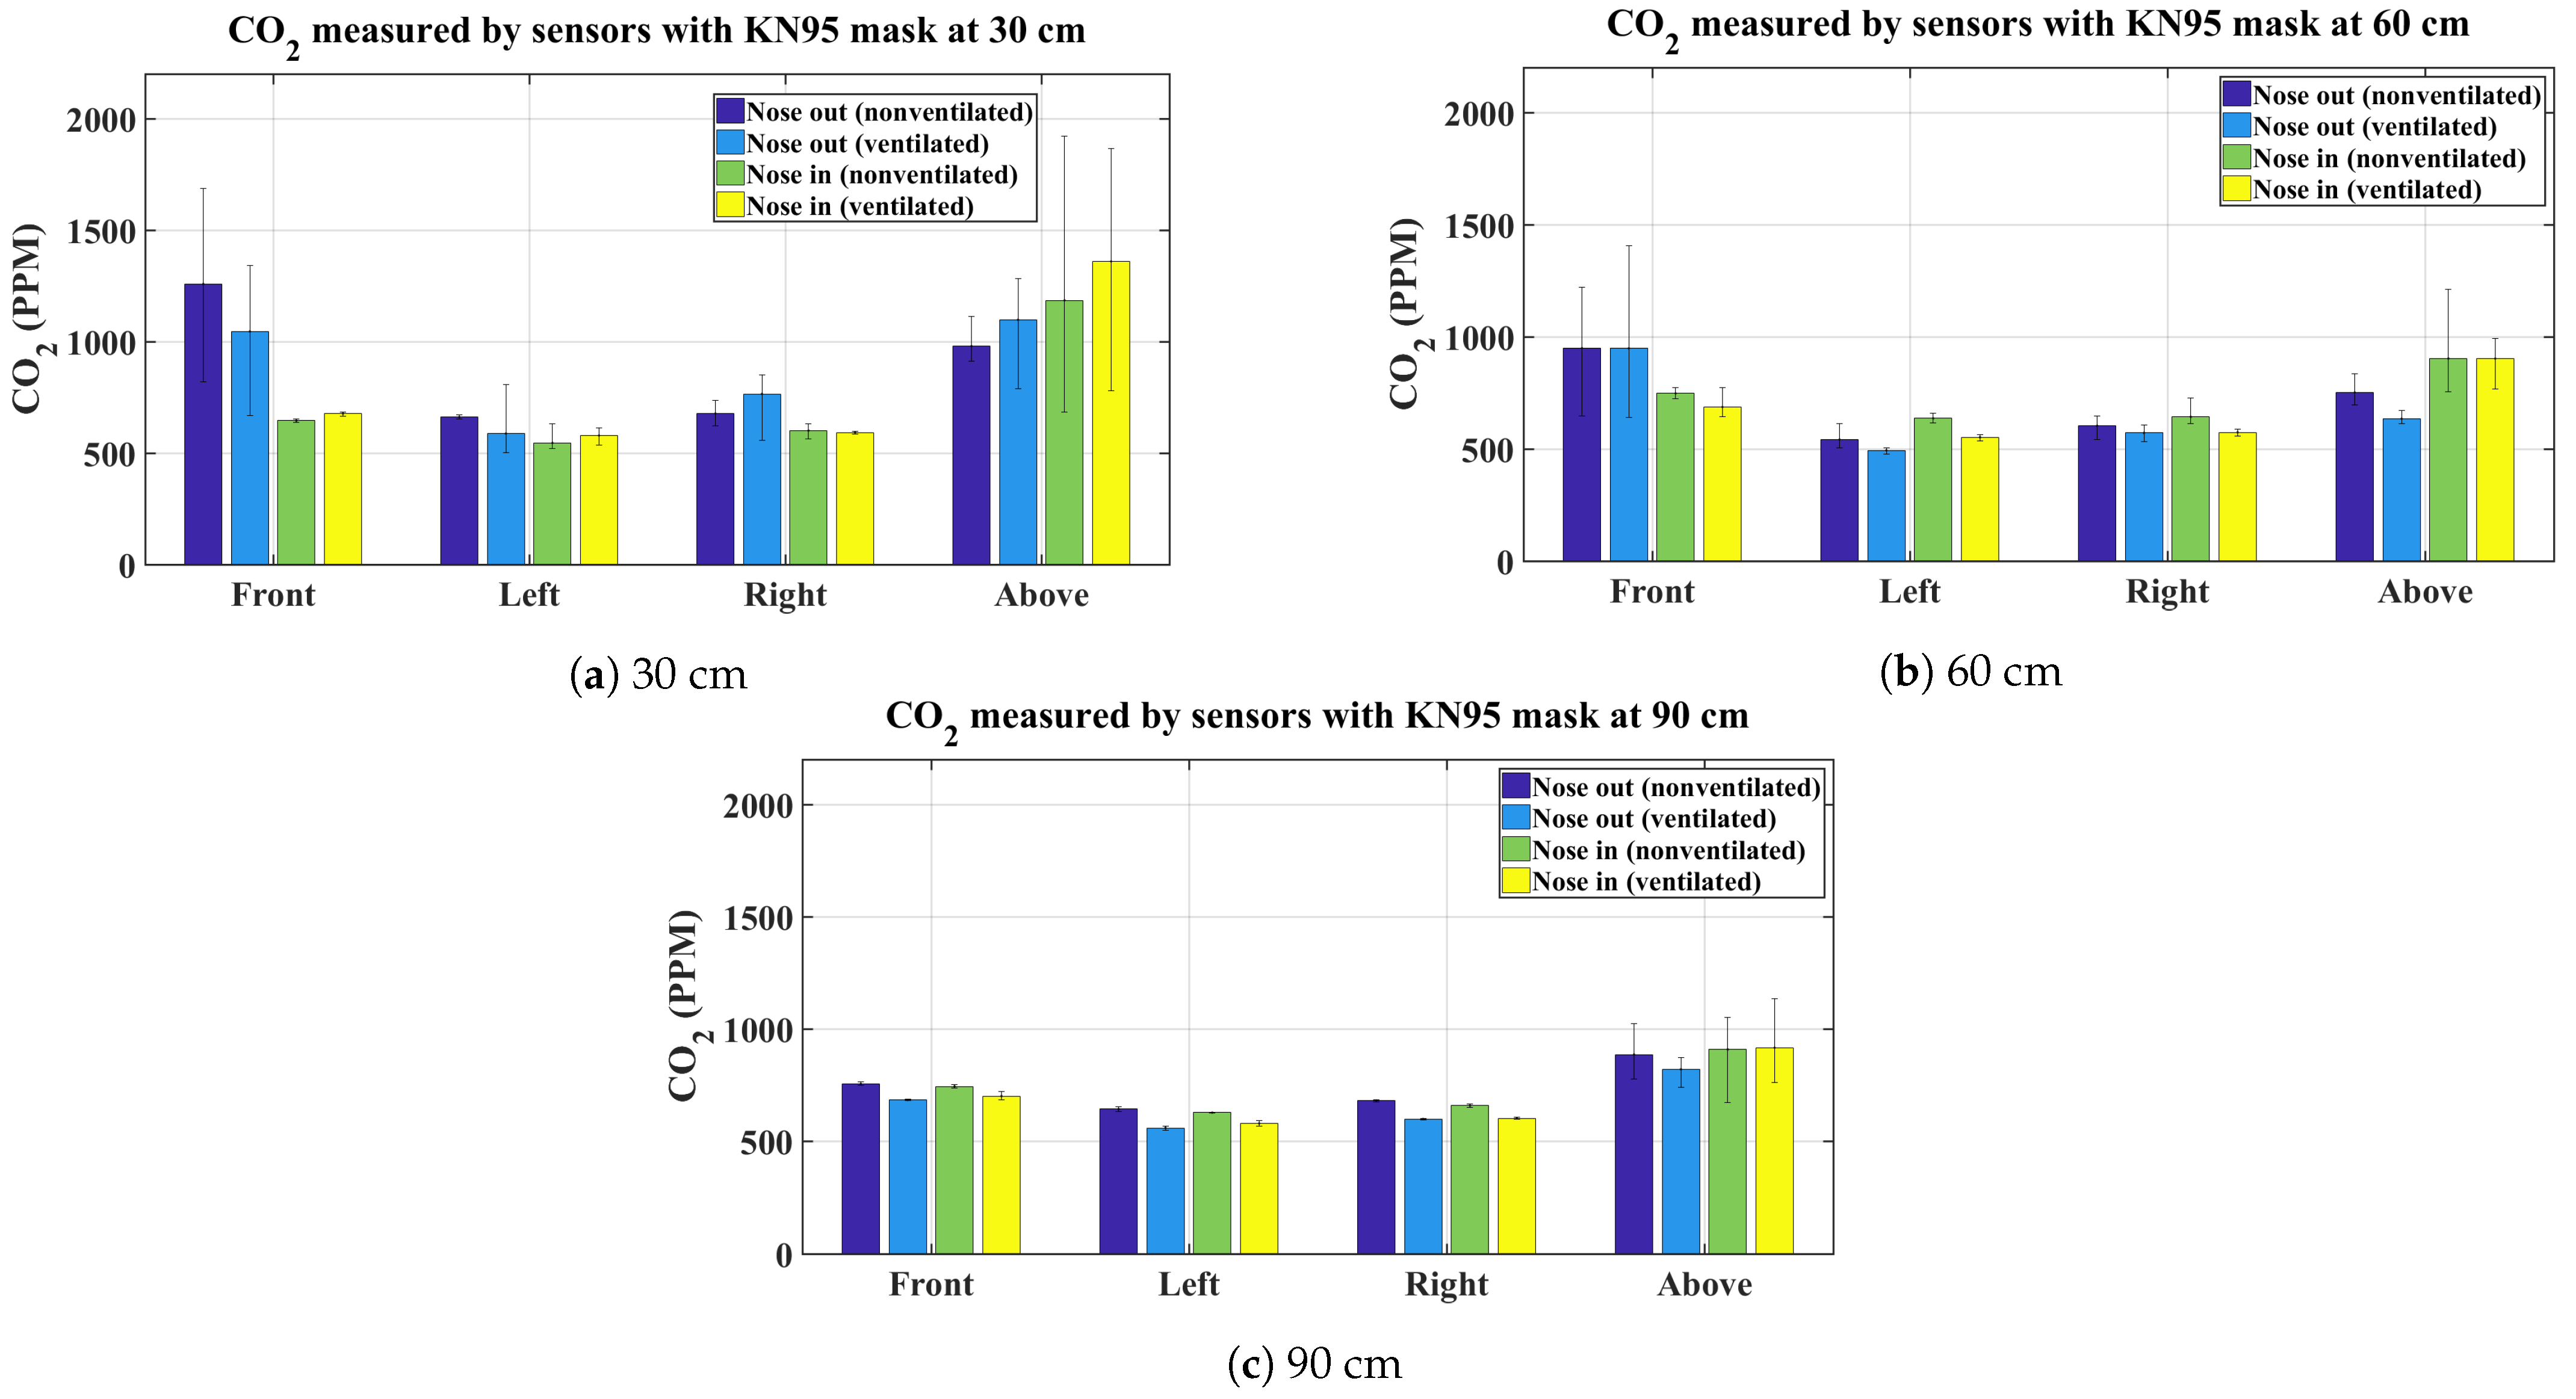
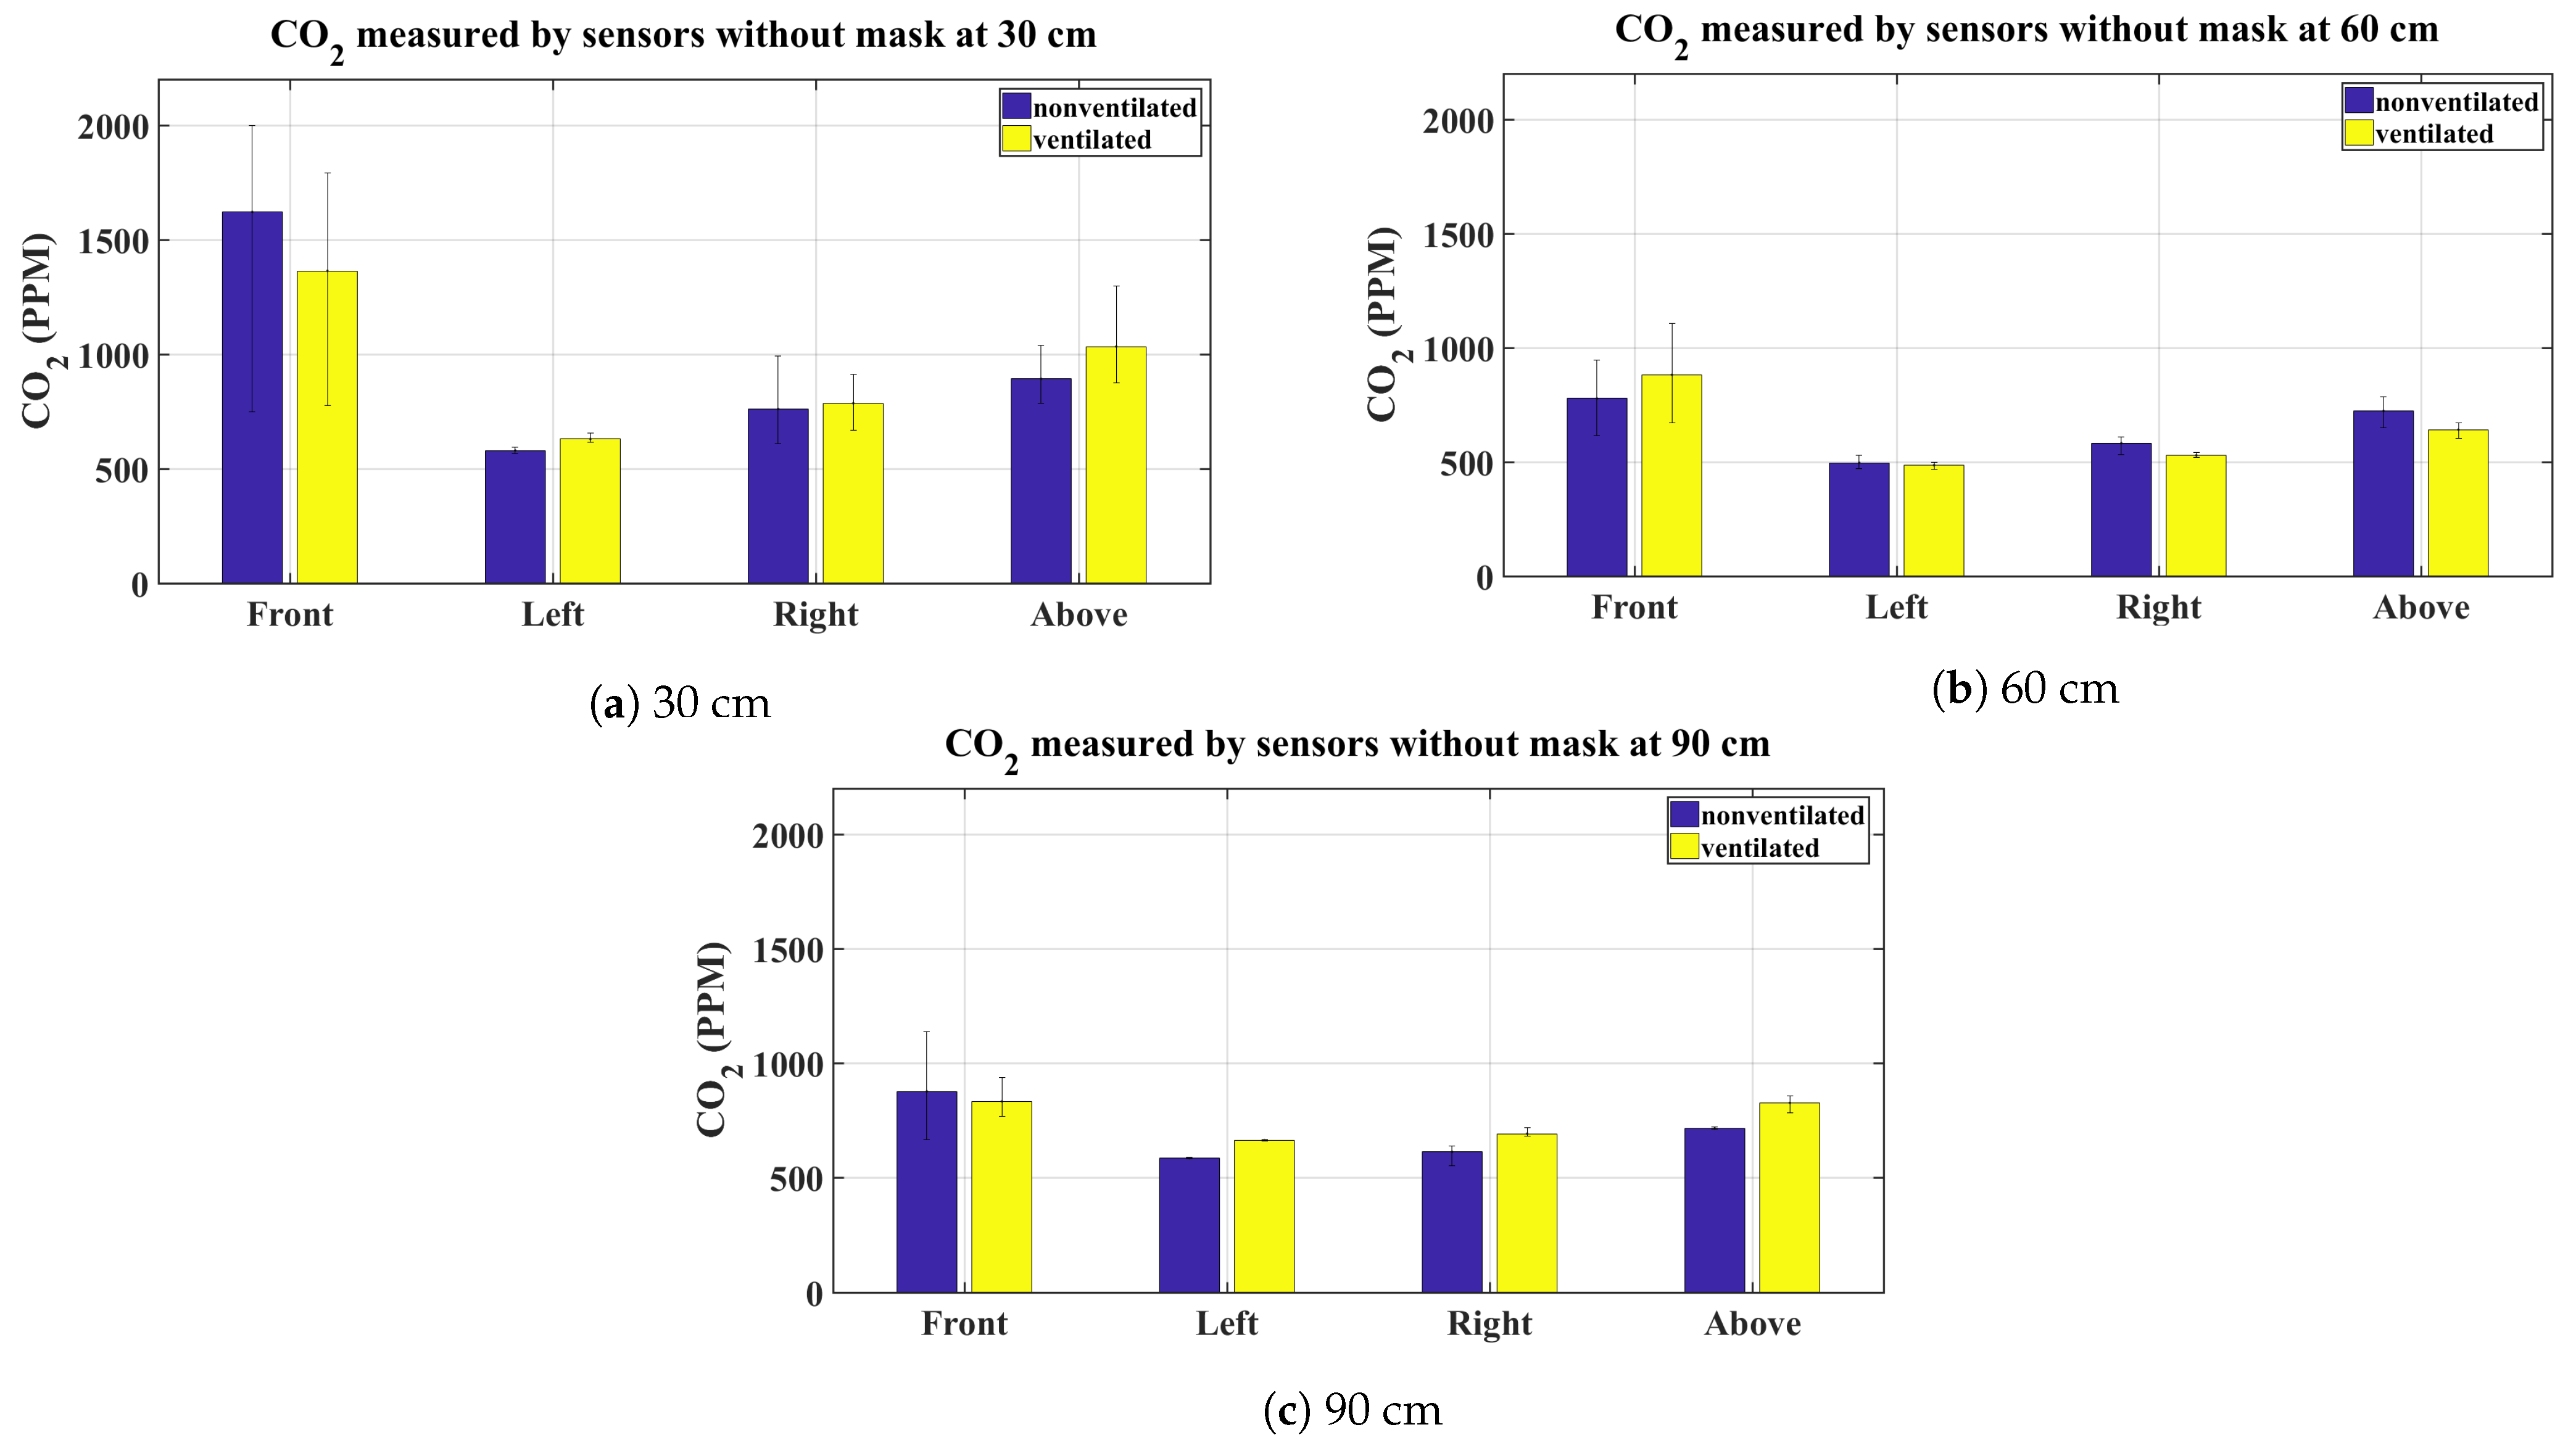
3.1. Summary of CO2 Measurements
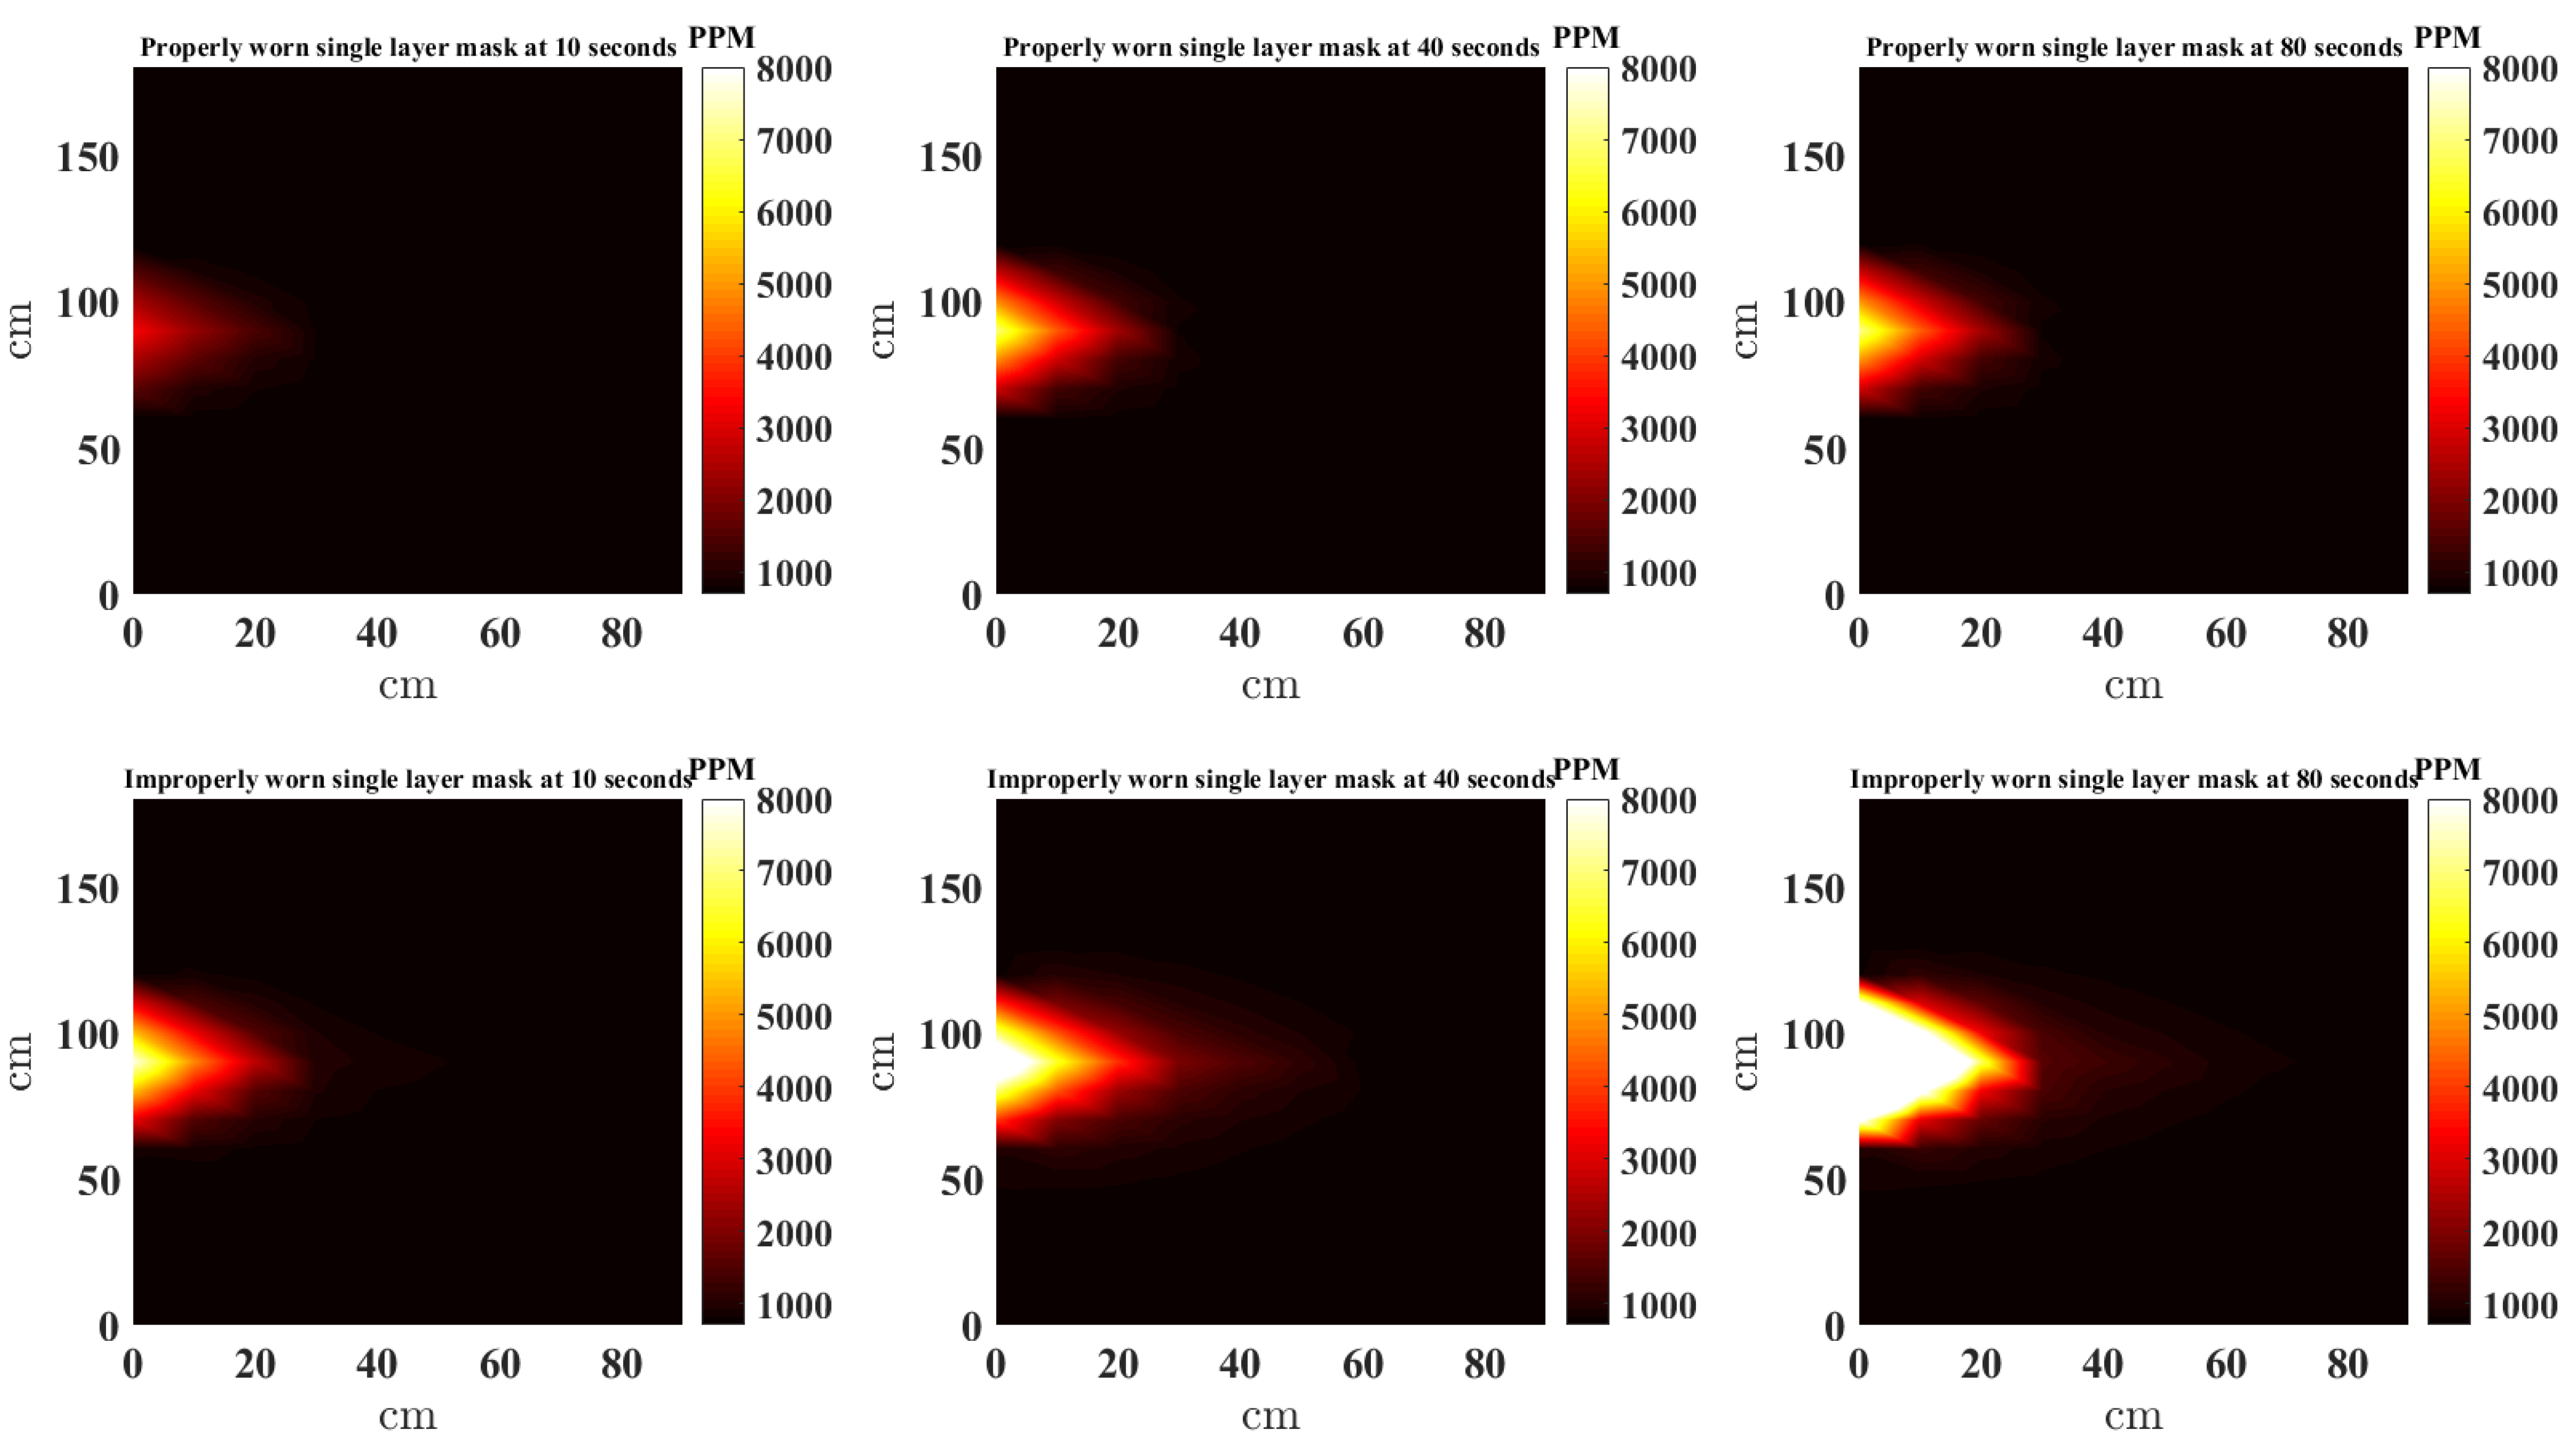
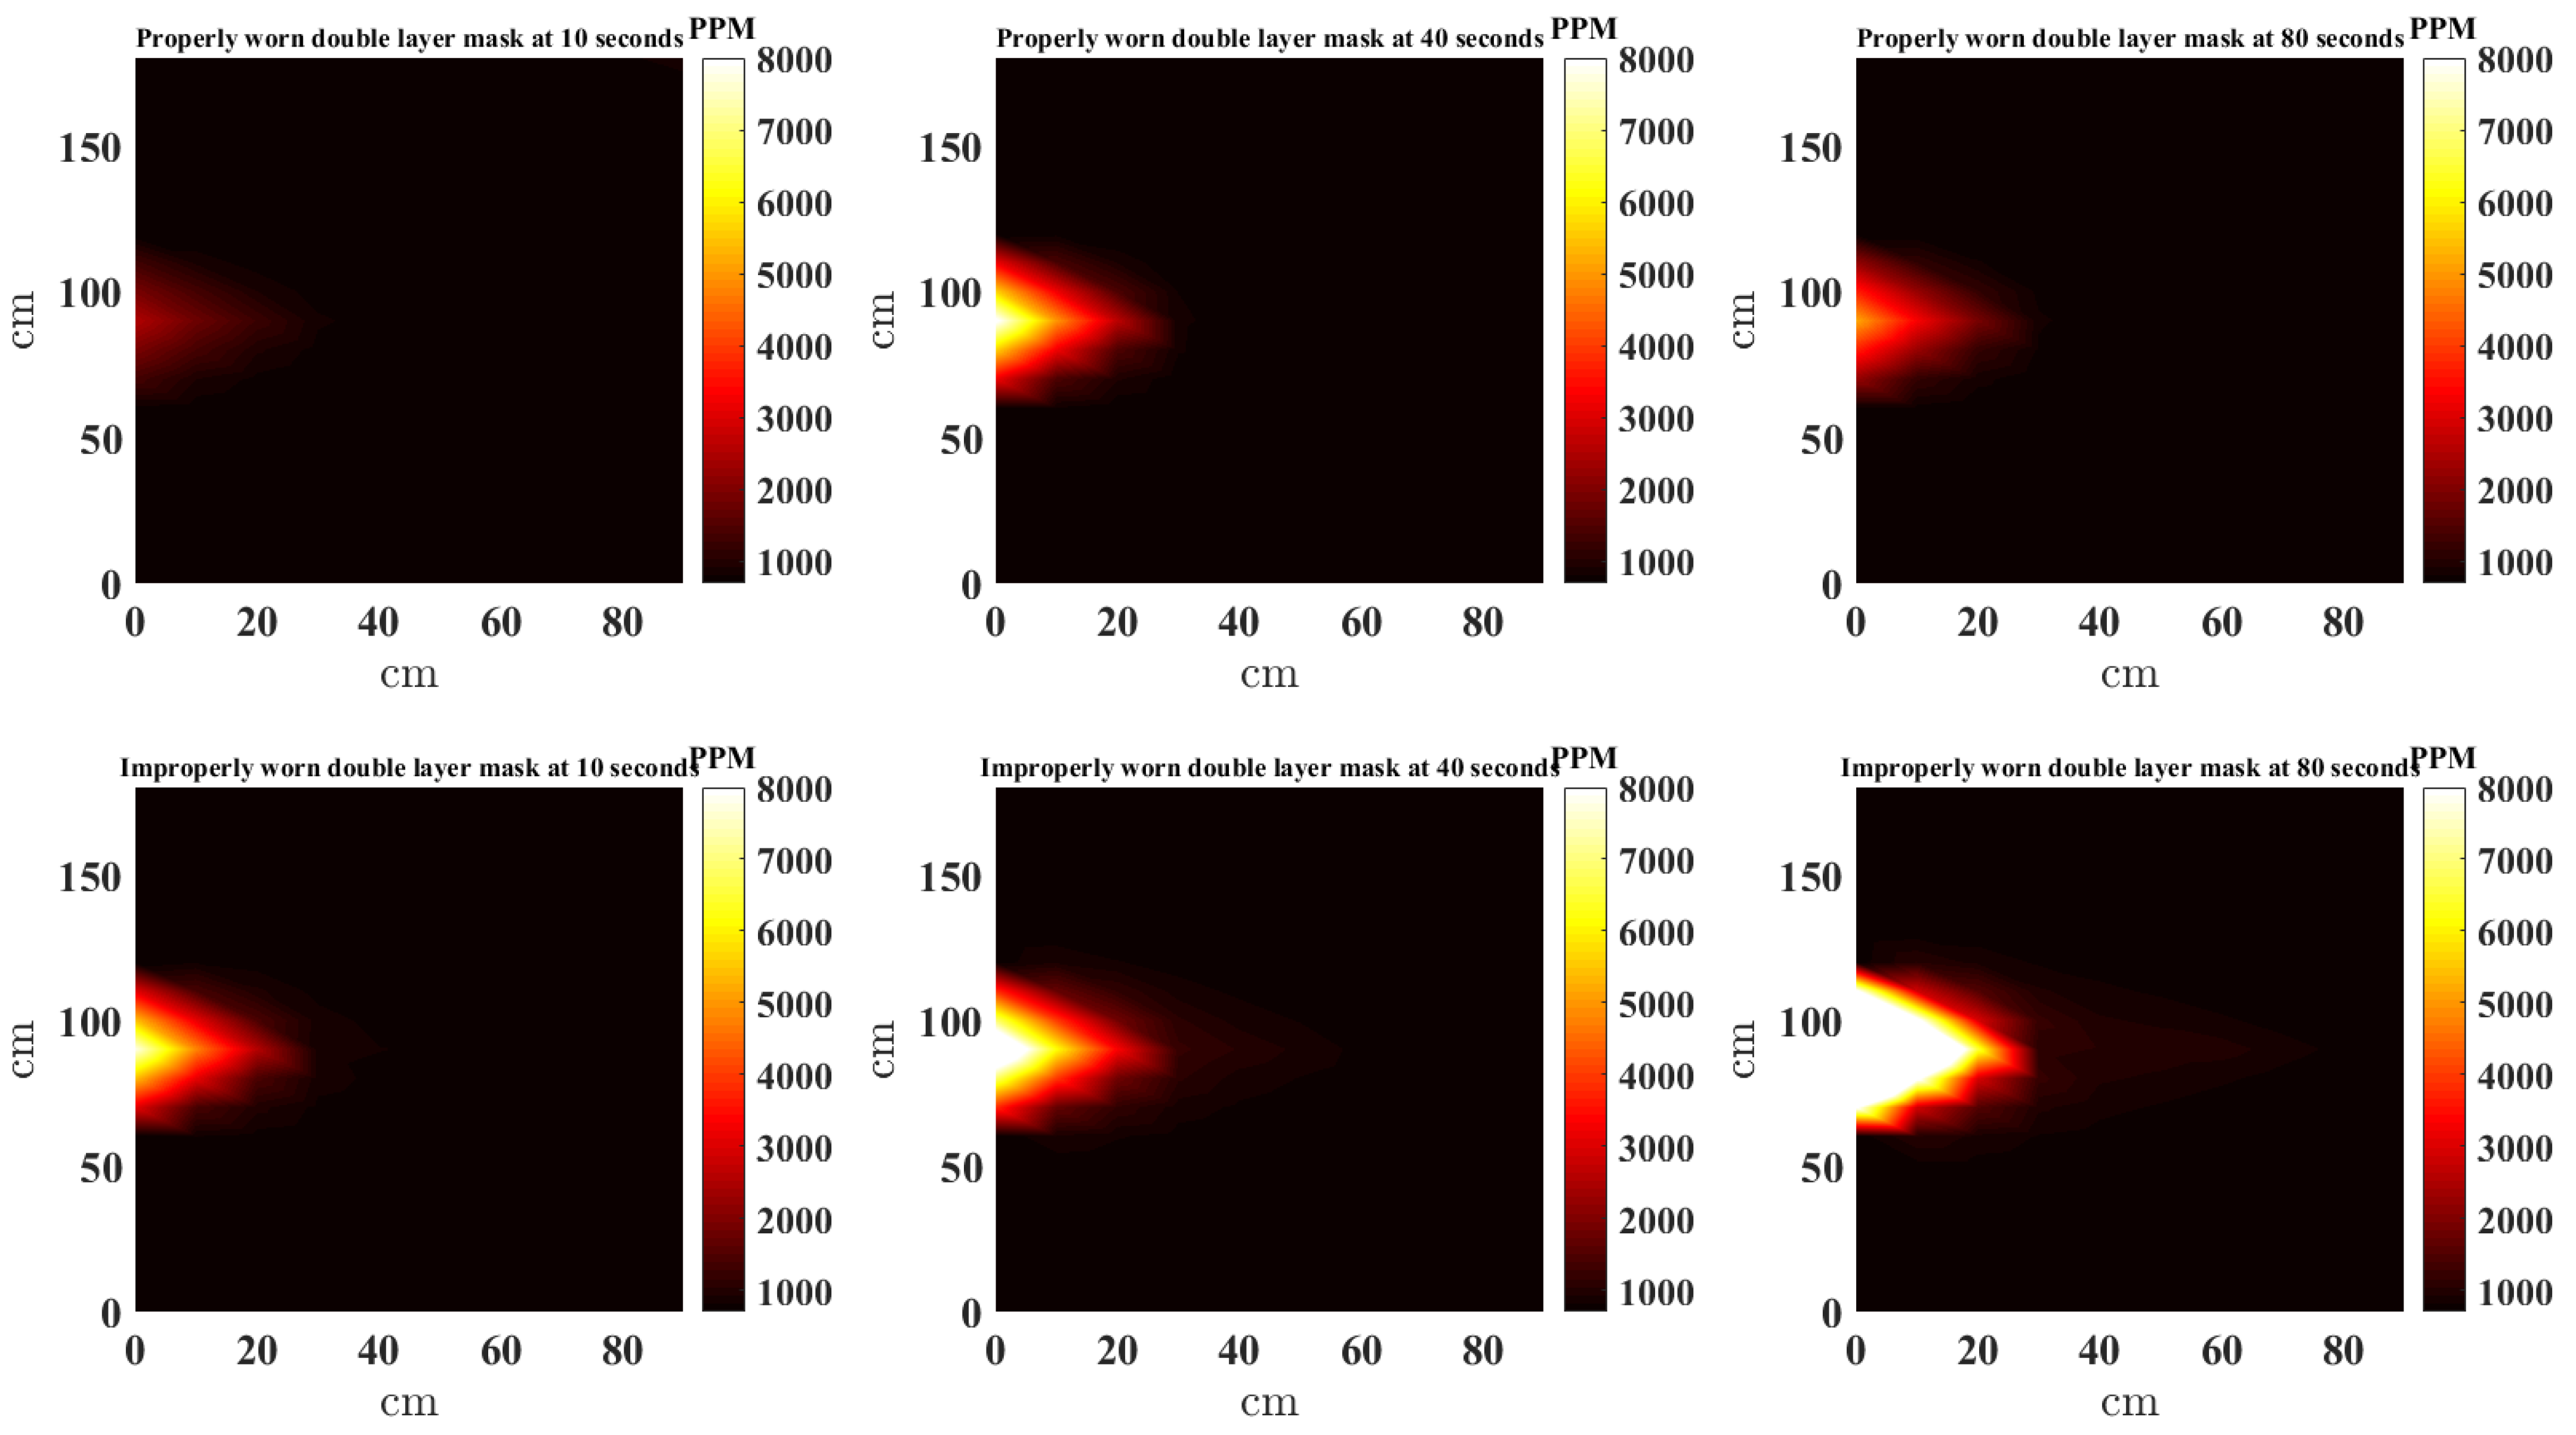
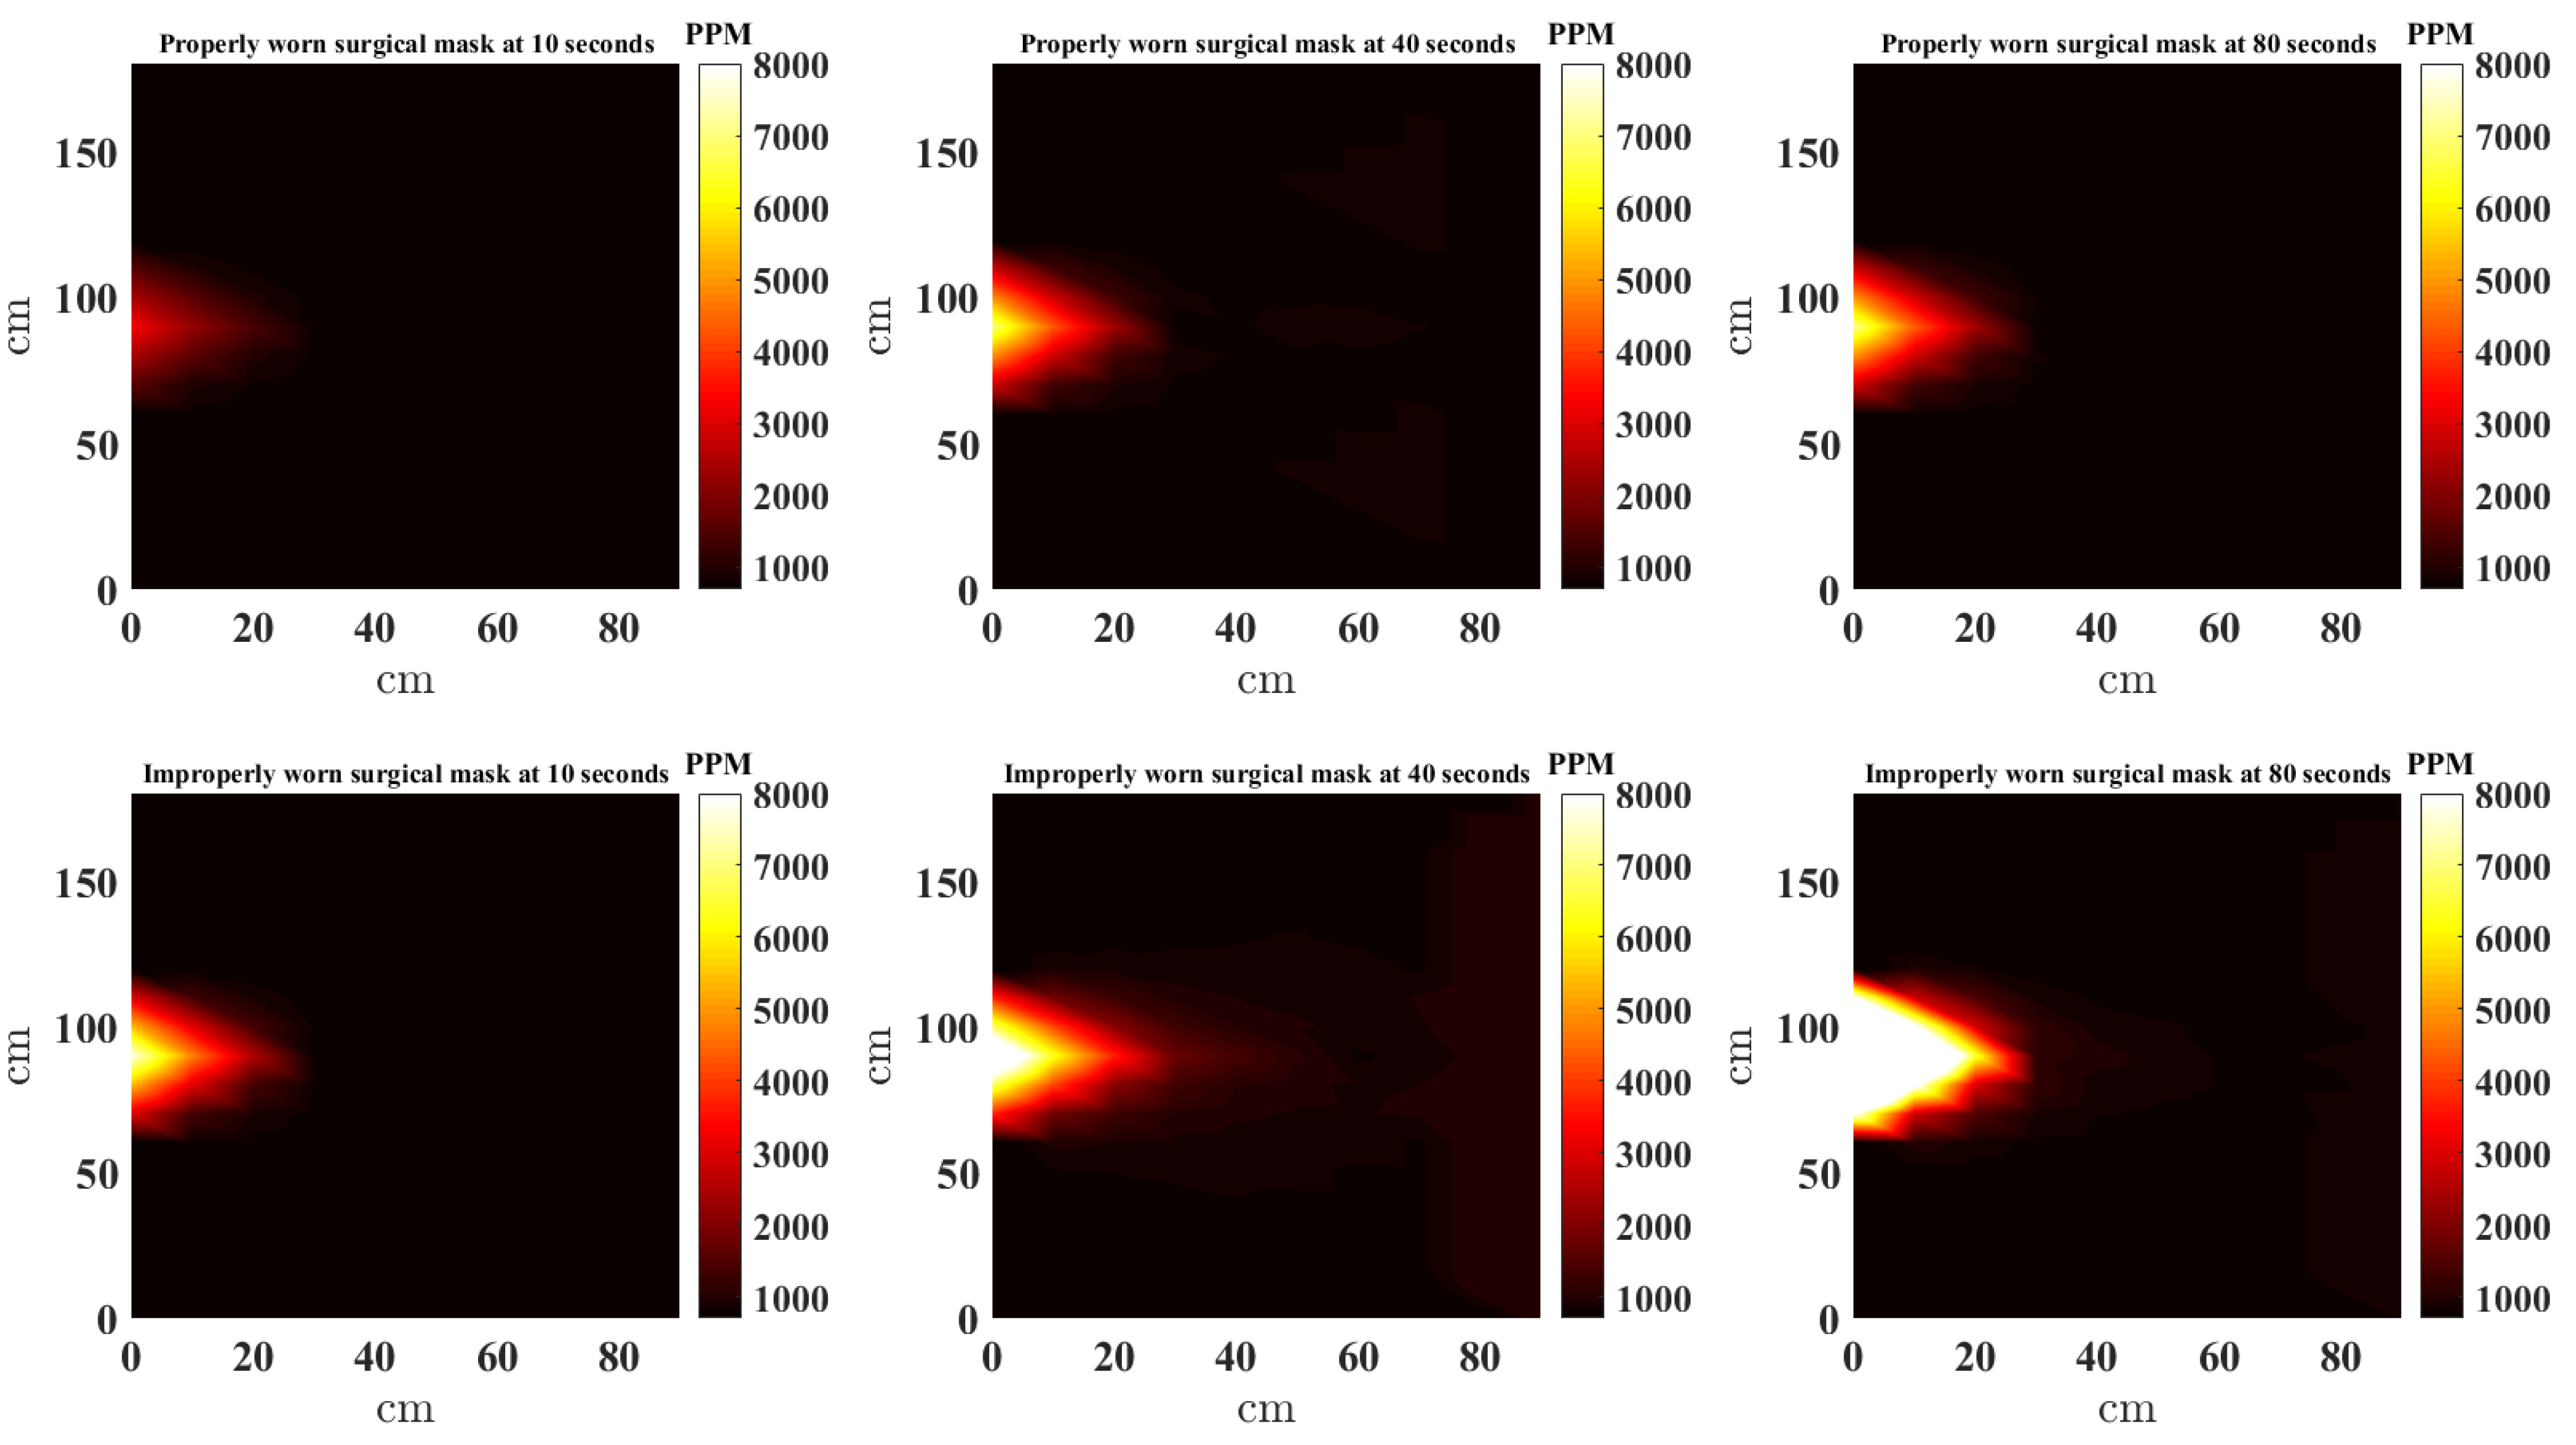
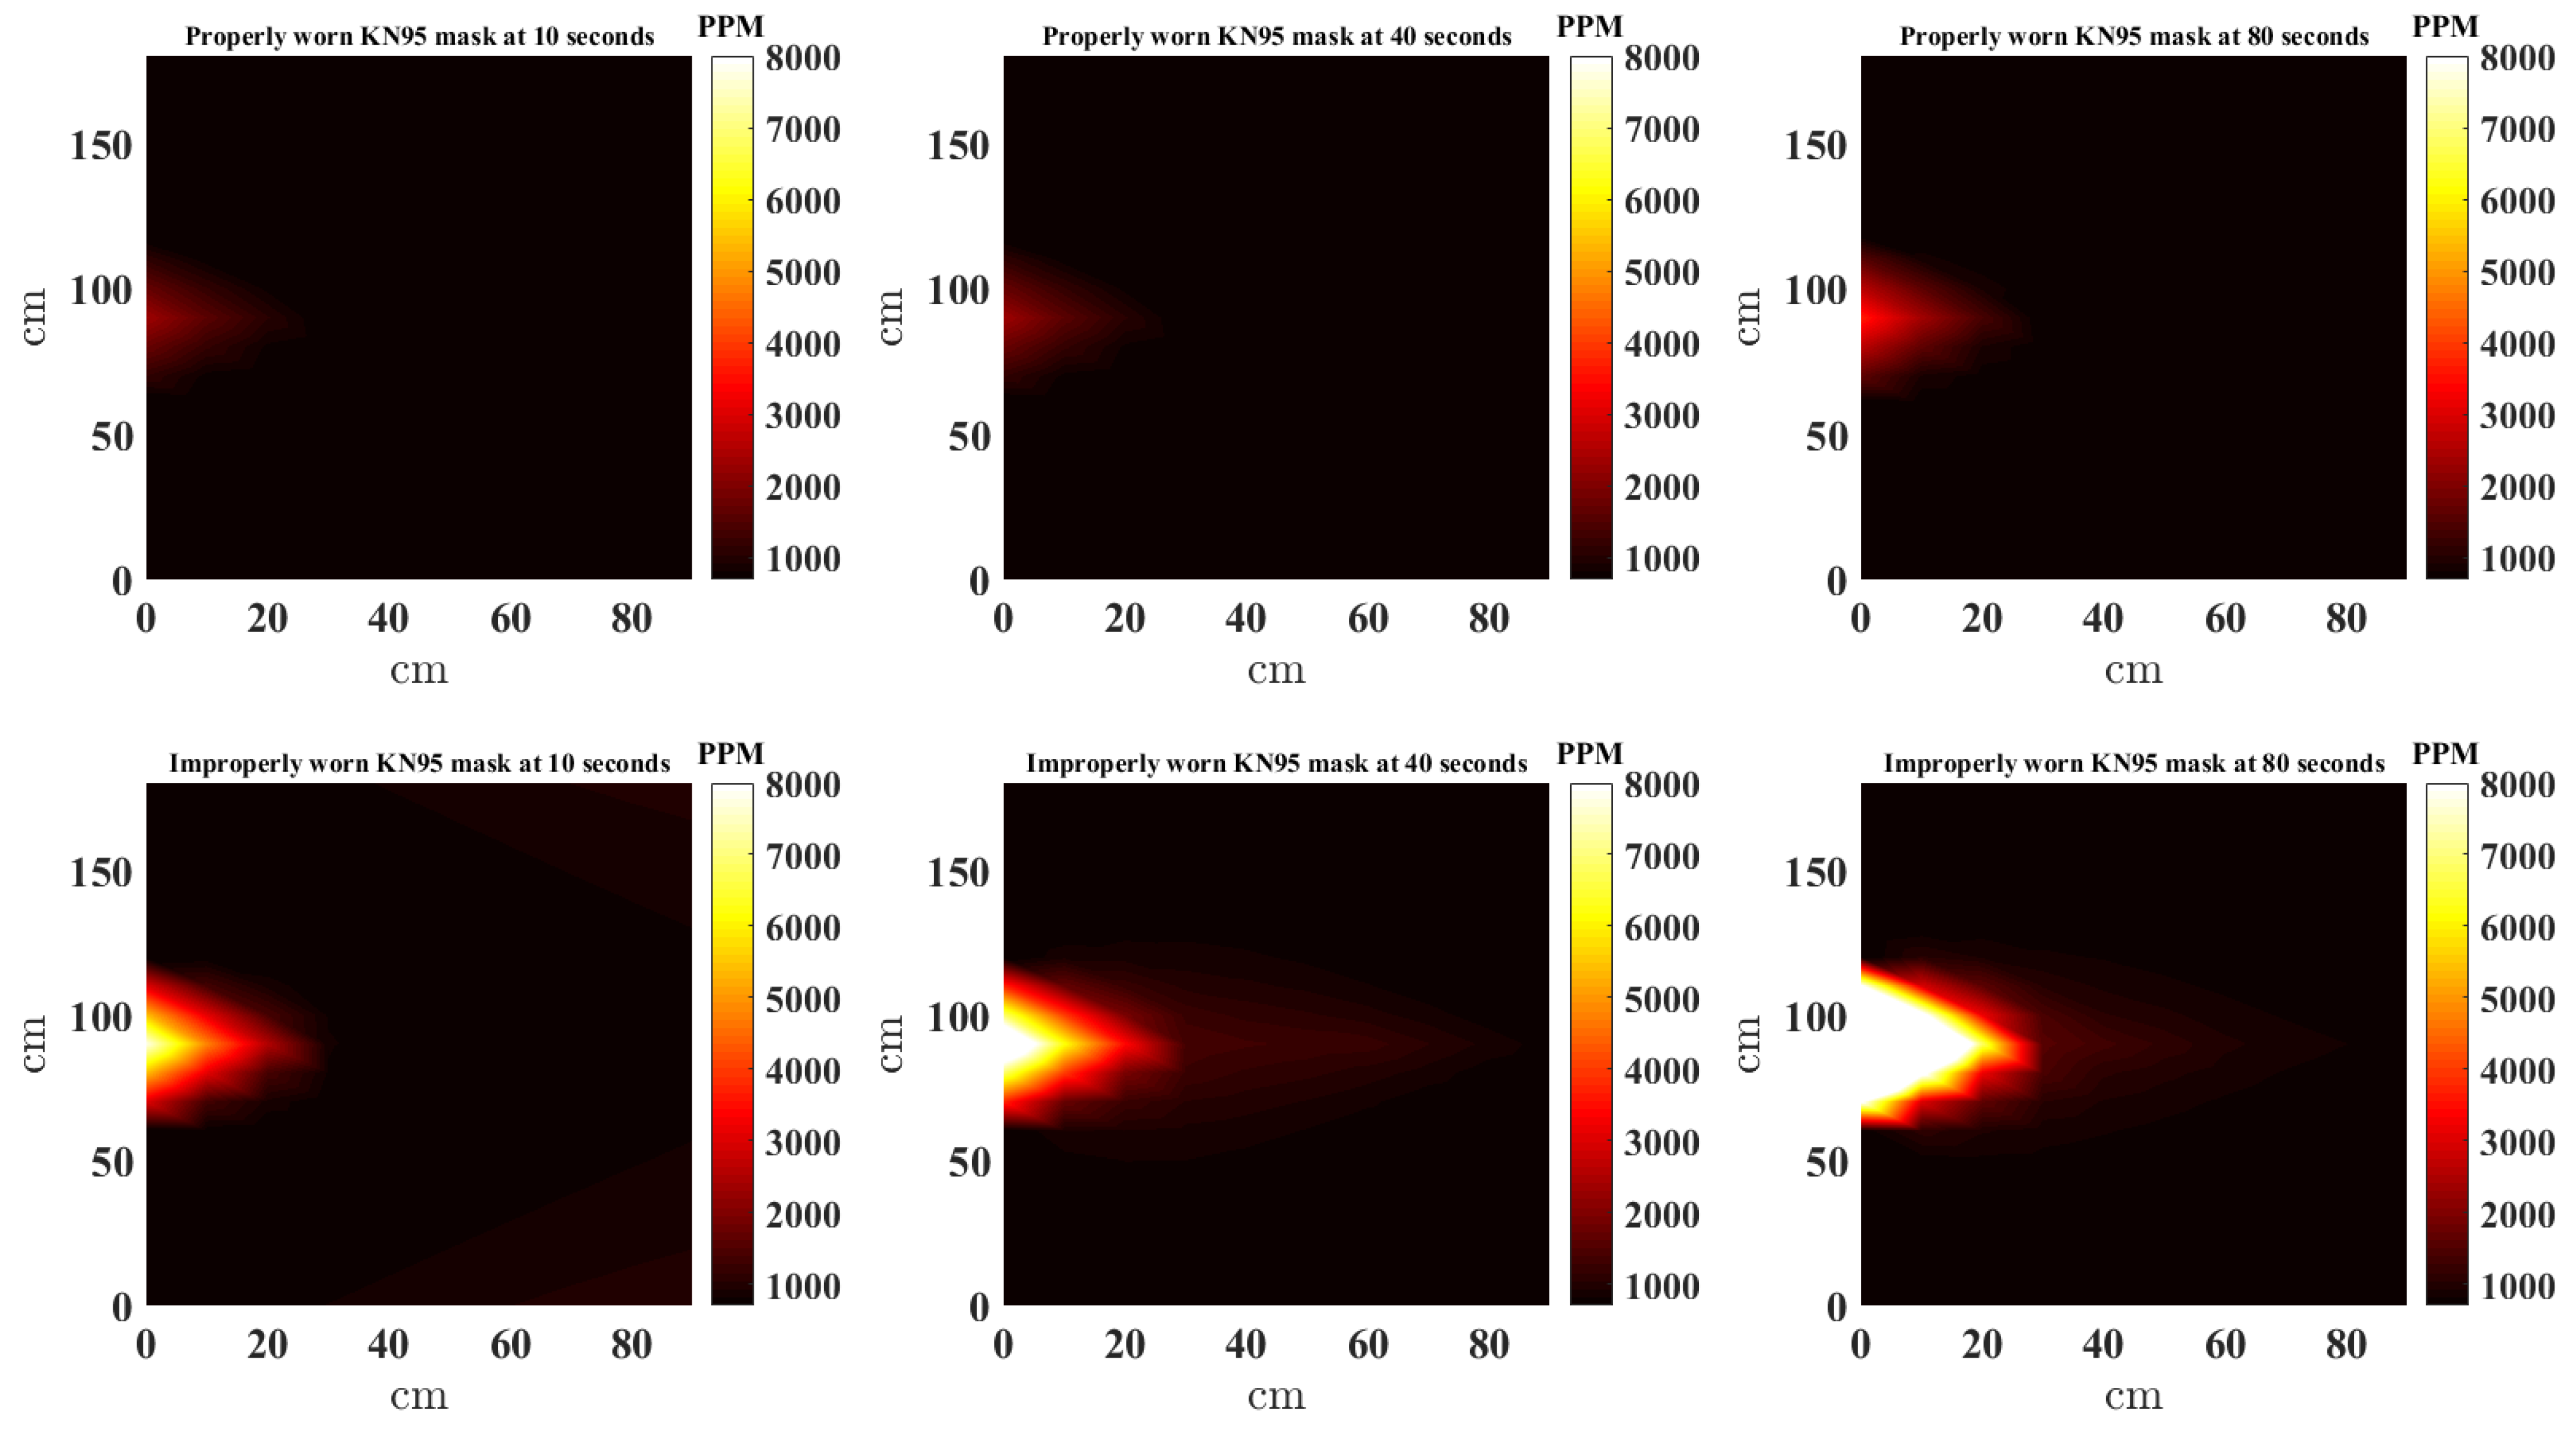
3.2. Spatially Interpolated CO2 Concentrations
3.3. Statistical Analysis
Friedman’s ANOVA Test
4. Discussion and Conclusions
- There is a significant difference in the CO2 concentration when the face mask is used properly compared to when the nose is out during normal speech in the front and above the face.
- The type of mask used in this study had little to no affect on the CO2 concentration distribution.
- The CO2 concentration to the left and right of the face does not noticeably change from baseline values.
- CO2 rises above the face during normal speech, this is more pronounced when the mask is properly worn; however, CO2 at the front of the face is considerably reduced.
- At shorter distances to the speaker, the ventilation of the indoor environment does not impact CO2 concentrations.
Author Contributions
Funding
Informed Consent Statement
Data Availability Statement
Conflicts of Interest
Abbreviations
| NDIR | NonDispersive InfraRed |
| ANOVA | analysis of variance |
| PCB | printed circuit board |
| API | Application Programming Interface |
| NNI | natural neighbor interpolation |
| ISM | Industrial Scientific Medical |
| Ah | Ampere hour |
| CO2 | Carbon dioxide |
| GHz | Giga Hertz |
| ppm | parts per million |
| cm | centimeter |
References
- Cowling, B.J.; Leung, G.M. Face masks and COVID-19: Don’t let perfect be the enemy of good. Euro Surveill. Eur. Commun. Dis. Bull. 2020, 25, 2001998. [Google Scholar]
- Howard, J.; Huang, A.; Li, Z.; Tufekci, Z.; Zdimal, V.; Westhuizen, H.M.; Delft, A.V.; Price, A.; Fridman, L.; Tang, L.H.; et al. Face masks against COVID-19: An evidence review. Proc. Natl. Acad. Sci. USA 2021, 118, e2014564118. [Google Scholar] [CrossRef] [PubMed]
- Li, T.; Liu, Y.; Li, M.; Qian, X.; Dai, Y. Mask or no mask for COVID-19: A public health and market study. PLoS ONE 2020, 15, e0237691. [Google Scholar] [CrossRef] [PubMed]
- Wong, S.H.; Teoh, J.Y.C.; Leung, C.-H.; Wu, W.K.K.; Yip, B.H.K.; Wong, M.C.S.; Hui, D.S.C. COVID-19 and Public Interest in Face Mask Use. Am. J. Respir. Crit. Care Med. 2020, 202, 453–455. [Google Scholar] [CrossRef] [PubMed]
- Hendrix, M.J.; Walde, C.; Findley, K.; Trotman, R. Absence of Apparent Transmission of SARS-CoV-2 from Two Stylists After Exposure at a Hair Salon with a Universal Face Covering Policy. MMWR Morb. Mortal. Wkly. Rep. 2020, 69, 930–932. [Google Scholar] [CrossRef] [PubMed]
- Leffler, C.T.; Ing, E.; Lykins, J.D.; Hogan, M.C.; McKeown, C.A.; Grzybowski, A. Association of Country-wide Coronavirus Mortality with Demographics, Testing, Lockdowns, and Public Wearing of Masks. Am. J. Trop. Med. Hyg. 2020, 103, 2400–2411. [Google Scholar] [CrossRef] [PubMed]
- Lyu, W.; Wehby, G.L. Community Use of Face Masks and COVID-19: Evidence from a Natural Experiment of State Mandates the US. Health Aff. 2020, 39, 1419–1425. [Google Scholar] [CrossRef] [PubMed]
- Chan, J.F.; Yuan, S.; Zhang, A.J.; Poon, V.K.; Chan, C.C.; Lee, A.C.; Fan, Z.; Li, C.; Liang, R.; Cao, J.; et al. Surgical Mask Partition Reduces the Risk of Noncontact Transmission in a Golden Syrian Hamster Model for Coronavirus Disease 2019 (COVID-19). Clin. Infect. Dis. Off. Publ. Infect. Dis. Soc. Am. 2020, 71, 2139–2149. [Google Scholar] [CrossRef] [PubMed]
- Verma, S.; Dhanak, M.; Frankenfield, J. Visualizing droplet dispersal for face shields and masks with exhalation valves. Phys. Fluids 2020, 32, 091701. [Google Scholar] [CrossRef] [PubMed]
- Cui, S.; Cohen, M.; Stabat, P.; Marchio, D. CO2 tracer gas concentration decay method for 526 measuring air change rate. Build. Environ. 2015, 84, 162–169. [Google Scholar] [CrossRef]
- Rudnick, S.N.; Milton, D.K. Risk of indoor airborne infection transmission estimated from carbon dioxide concentration. Indoor Air 2003, 13, 237–245. [Google Scholar] [CrossRef] [PubMed]
- Richardson, E.T.; Morrow, C.D.; Kalil, D.B.; Bekker, L.G.; Wood, R. Shared Air: A Renewed Focus on Ventilation for the Prevention of Tuberculosis Transmission. PLoS ONE 2014, 9, e96334. [Google Scholar] [CrossRef] [PubMed] [Green Version]
- Azuma, K.; Kagi, N.; Yanagi, U.; Osawa, H. Effects of low-level inhalation exposure to carbon dioxide in indoor environments: A short review on human health and psychomotor performance. Environ. Int. 2018, 121 Pt 1, 51–56. [Google Scholar] [CrossRef] [PubMed]
- Vehvilainen, T.; Lindholm, H.; Rintamaki, H.; Paaakkonen, R.; Hirvonen, A.; Niemi, O.; Vinha, J. High indoor CO2 concentrations in an office environment increases the transcutaneous CO2 level and sleepiness during cognitive work. J. Occup. Environ. Hyg. 2016, 13, 19–29. [Google Scholar] [CrossRef] [PubMed]
- Snow, S.; Boyson, A.; Felipe-King, M.; Malik, O.; Coutts, L.; Noakes, C.J.; Gough, H.; Barlow, J.; Schraefel, M. Using EEG to characterise drowsiness during short duration exposure to elevated indoor Carbon Dioxide concentrations. BioRxiv 2018, 483750. [Google Scholar] [CrossRef]
- AirNodes. Available online: https://www.iqair.com/air-quality-monitors/airvisual-pro (accessed on 31 July 2021).
- Rotronic. Available online: https://www.rotronic.com (accessed on 31 July 2021).
- Sensirion SCD30. Available online: https://www.sensirion.com/en/environmental-sensors/carbon-dioxide-sensors/carbon-dioxide-sensors-scd30/ (accessed on 31 July 2021).
- Salman, N.; Rasool, I.; Kemp, A.H. Overview of the IEEE 802.15.4 standards family for Low Rate Wireless Personal Area Networks. In Proceedings of the 7th International Symposium on Wireless Communication Systems (ISWCS), York, UK, 19–22 September 2010; pp. 701–705. [Google Scholar]
- STM32f103x. Available online: https://www.st.com/en/microcontrollers-microprocessors/stm32f103.html (accessed on 31 July 2021).
- Amidror, I. Scattered data interpolation methods for electronic imaging systems: A survey. J. Electron. Imaging 2002, 11, 57–176. [Google Scholar] [CrossRef]
- MATLAB Scatteredinterpolant Function. Available online: https://uk.mathworks.com/help/matlab/ref/scatteredinterpolant.html (accessed on 31 July 2021).
- Hollander, M.; Wolfe, D.A. Nonparametric Statistical Methods; John Wiley & Sons, Inc.: Hoboken, NJ, USA, 1999. [Google Scholar]


| Treatment | Blocks | Environment | Direction | Distance | p-Value | Null Hypothesis |
|---|---|---|---|---|---|---|
| Nose in/out | All masks | Not ventilated | Front | 30 cm | Rejected | |
| Nose in/out | All masks | Not ventilated | Above | 30 cm | Rejected | |
| Nose in/out | All masks | Not ventilated | Left | 30 cm | Rejected | |
| Nose in/out | All masks | Not ventilated | Right | 30 cm | 1 | Not rejected |
| Nose in/out | All masks | Not ventilated | Front | 60 cm | Rejected | |
| Nose in/out | All masks | Not ventilated | Above | 60 cm | Rejected | |
| Nose in/out | All masks | Not ventilated | Left | 60 cm | Not rejected | |
| Nose in/out | All masks | Not ventilated | Right | 60 cm | Not rejected | |
| Nose in/out | All masks | Not ventilated | Front | 90 cm | Rejected | |
| Nose in/out | All masks | Not ventilated | Above | 90 cm | Rejected | |
| Nose in/out | All masks | Not ventilated | Left | 90 cm | 1 | Not rejected |
| Nose in/out | All masks | Not ventilated | Right | 90 cm | 1 | Not Rejected |
| Nose in/out | All masks | Ventilated | Front | 30 cm | Rejected | |
| Nose in/out | All masks | Ventilated | Above | 30 cm | Rejected | |
| Nose in/out | All masks | Ventilated | Left | 30 cm | Not rejected | |
| Nose in/out | All masks | Ventilated | Right | 30 cm | Rejected | |
| Nose in/out | All masks | Ventilated | Front | 60 cm | Rejected | |
| Nose in/out | All masks | Ventilated | Above | 60 cm | Rejected | |
| Nose in/out | All masks | Ventilated | Left | 60 cm | Rejected | |
| Nose in/out | All masks | Ventilated | Right | 60 cm | Rejected | |
| Nose in/out | All masks | Ventilated | Front | 90 cm | Rejected | |
| Nose in/out | All masks | Ventilated | Above | 90 cm | Rejected | |
| Nose in/out | All masks | Ventilated | Left | 90 cm | Rejected | |
| Nose in/out | All masks | Ventilated | Right | 90 cm | Rejected |
Publisher’s Note: MDPI stays neutral with regard to jurisdictional claims in published maps and institutional affiliations. |
© 2021 by the authors. Licensee MDPI, Basel, Switzerland. This article is an open access article distributed under the terms and conditions of the Creative Commons Attribution (CC BY) license (https://creativecommons.org/licenses/by/4.0/).
Share and Cite
Salman, N.; Khan, M.W.; Lim, M.; Khan, A.; Kemp, A.H.; Noakes, C.J. Use of Multiple Low Cost Carbon Dioxide Sensors to Measure Exhaled Breath Distribution with Face Mask Type and Wearing Behaviour. Sensors 2021, 21, 6204. https://doi.org/10.3390/s21186204
Salman N, Khan MW, Lim M, Khan A, Kemp AH, Noakes CJ. Use of Multiple Low Cost Carbon Dioxide Sensors to Measure Exhaled Breath Distribution with Face Mask Type and Wearing Behaviour. Sensors. 2021; 21(18):6204. https://doi.org/10.3390/s21186204
Chicago/Turabian StyleSalman, Naveed, Muhammad Waqas Khan, Michael Lim, Amir Khan, Andrew H. Kemp, and Catherine J. Noakes. 2021. "Use of Multiple Low Cost Carbon Dioxide Sensors to Measure Exhaled Breath Distribution with Face Mask Type and Wearing Behaviour" Sensors 21, no. 18: 6204. https://doi.org/10.3390/s21186204