1. Introduction
The need for oxygen analysis led to the inevitable search for more efficient, robust and low-cost technologies to detect in a variety of media and applications. The analysis of DOC (dissolved oxygen concentration) is required in several areas, namely in biology, oceanography, chemistry, the food and pharmaceutical industries, among others. This work focuses on in situ ocean applications, particularly for low oxygen zones. This technology uses standard PDMS fabrication processes and could be potentially useful to analyze oxygen in microfluidic channels, for medical devices, biology and chemistry applications, marine research and other lab-on-a-chip devices.
The most available oxygen sensors are based on electrochemical or optical detection methods. The former, despite providing low-cost and label-free-based sensors, need periodic calibration adjustments and regular maintenance whenever external conditions change. Additionally, they consume oxygen in their reading process, invalidating the results, which require a constant flow of fluid so that oxygen is not completely consumed. Furthermore, they can be affected by the presence of different gaseous species influencing the basic readings. The substances that most influence the readings are hydrogen sulphide, sulphur dioxide, chlorine, carbon monoxide, nitrous oxide, nitric oxide, halogen, hydrogen, ozone and strong substances such as acids and alkaline solutions [
1]. In contrast, the optical sensing methodologies do not need periodic calibration, maintaining the reliable readings for a long time, and do not consume oxygen in the reading process, giving independence from the flow [
2]. Additionally, one of the biggest advantages of optical sensors for long-term applications is their minimal maintenance. For the ones based on a membrane with an oxygen indicator, the maintenance is practically restricted to the renewal of the luminescent indicator through the annual change of the membrane. However, despite optical oxygen sensors overcoming some of the greatest inconveniences of the electrochemical sensors, they use a recent and innovative principle and they have not yet been able to establish themselves in force in the market [
3]. Nevertheless, due to the described advantages of optical sensing methodologies, the herein proposed oxygen sensor is based on an optical approach. Therefore, in the subsequent subsection a background about this sensing methodology is described. In this work we introduce a study about the influence of concentration, of thickness and of solvent on the membrane response. This is paired with a hardware/software developed to optimize cost.
1.1. Optical Sensing Principle for Oxygen Quantification
Optical sensors for oxygen quantification are usually based on the physical phenomenon of luminescence, namely fluorescence and phosphorescence [
4]. Fluorescence is obtained by the absorption and excitation of sensitive molecules (present in the indicator) and subsequent transfer of energy, resulting in emission at a higher wavelength.
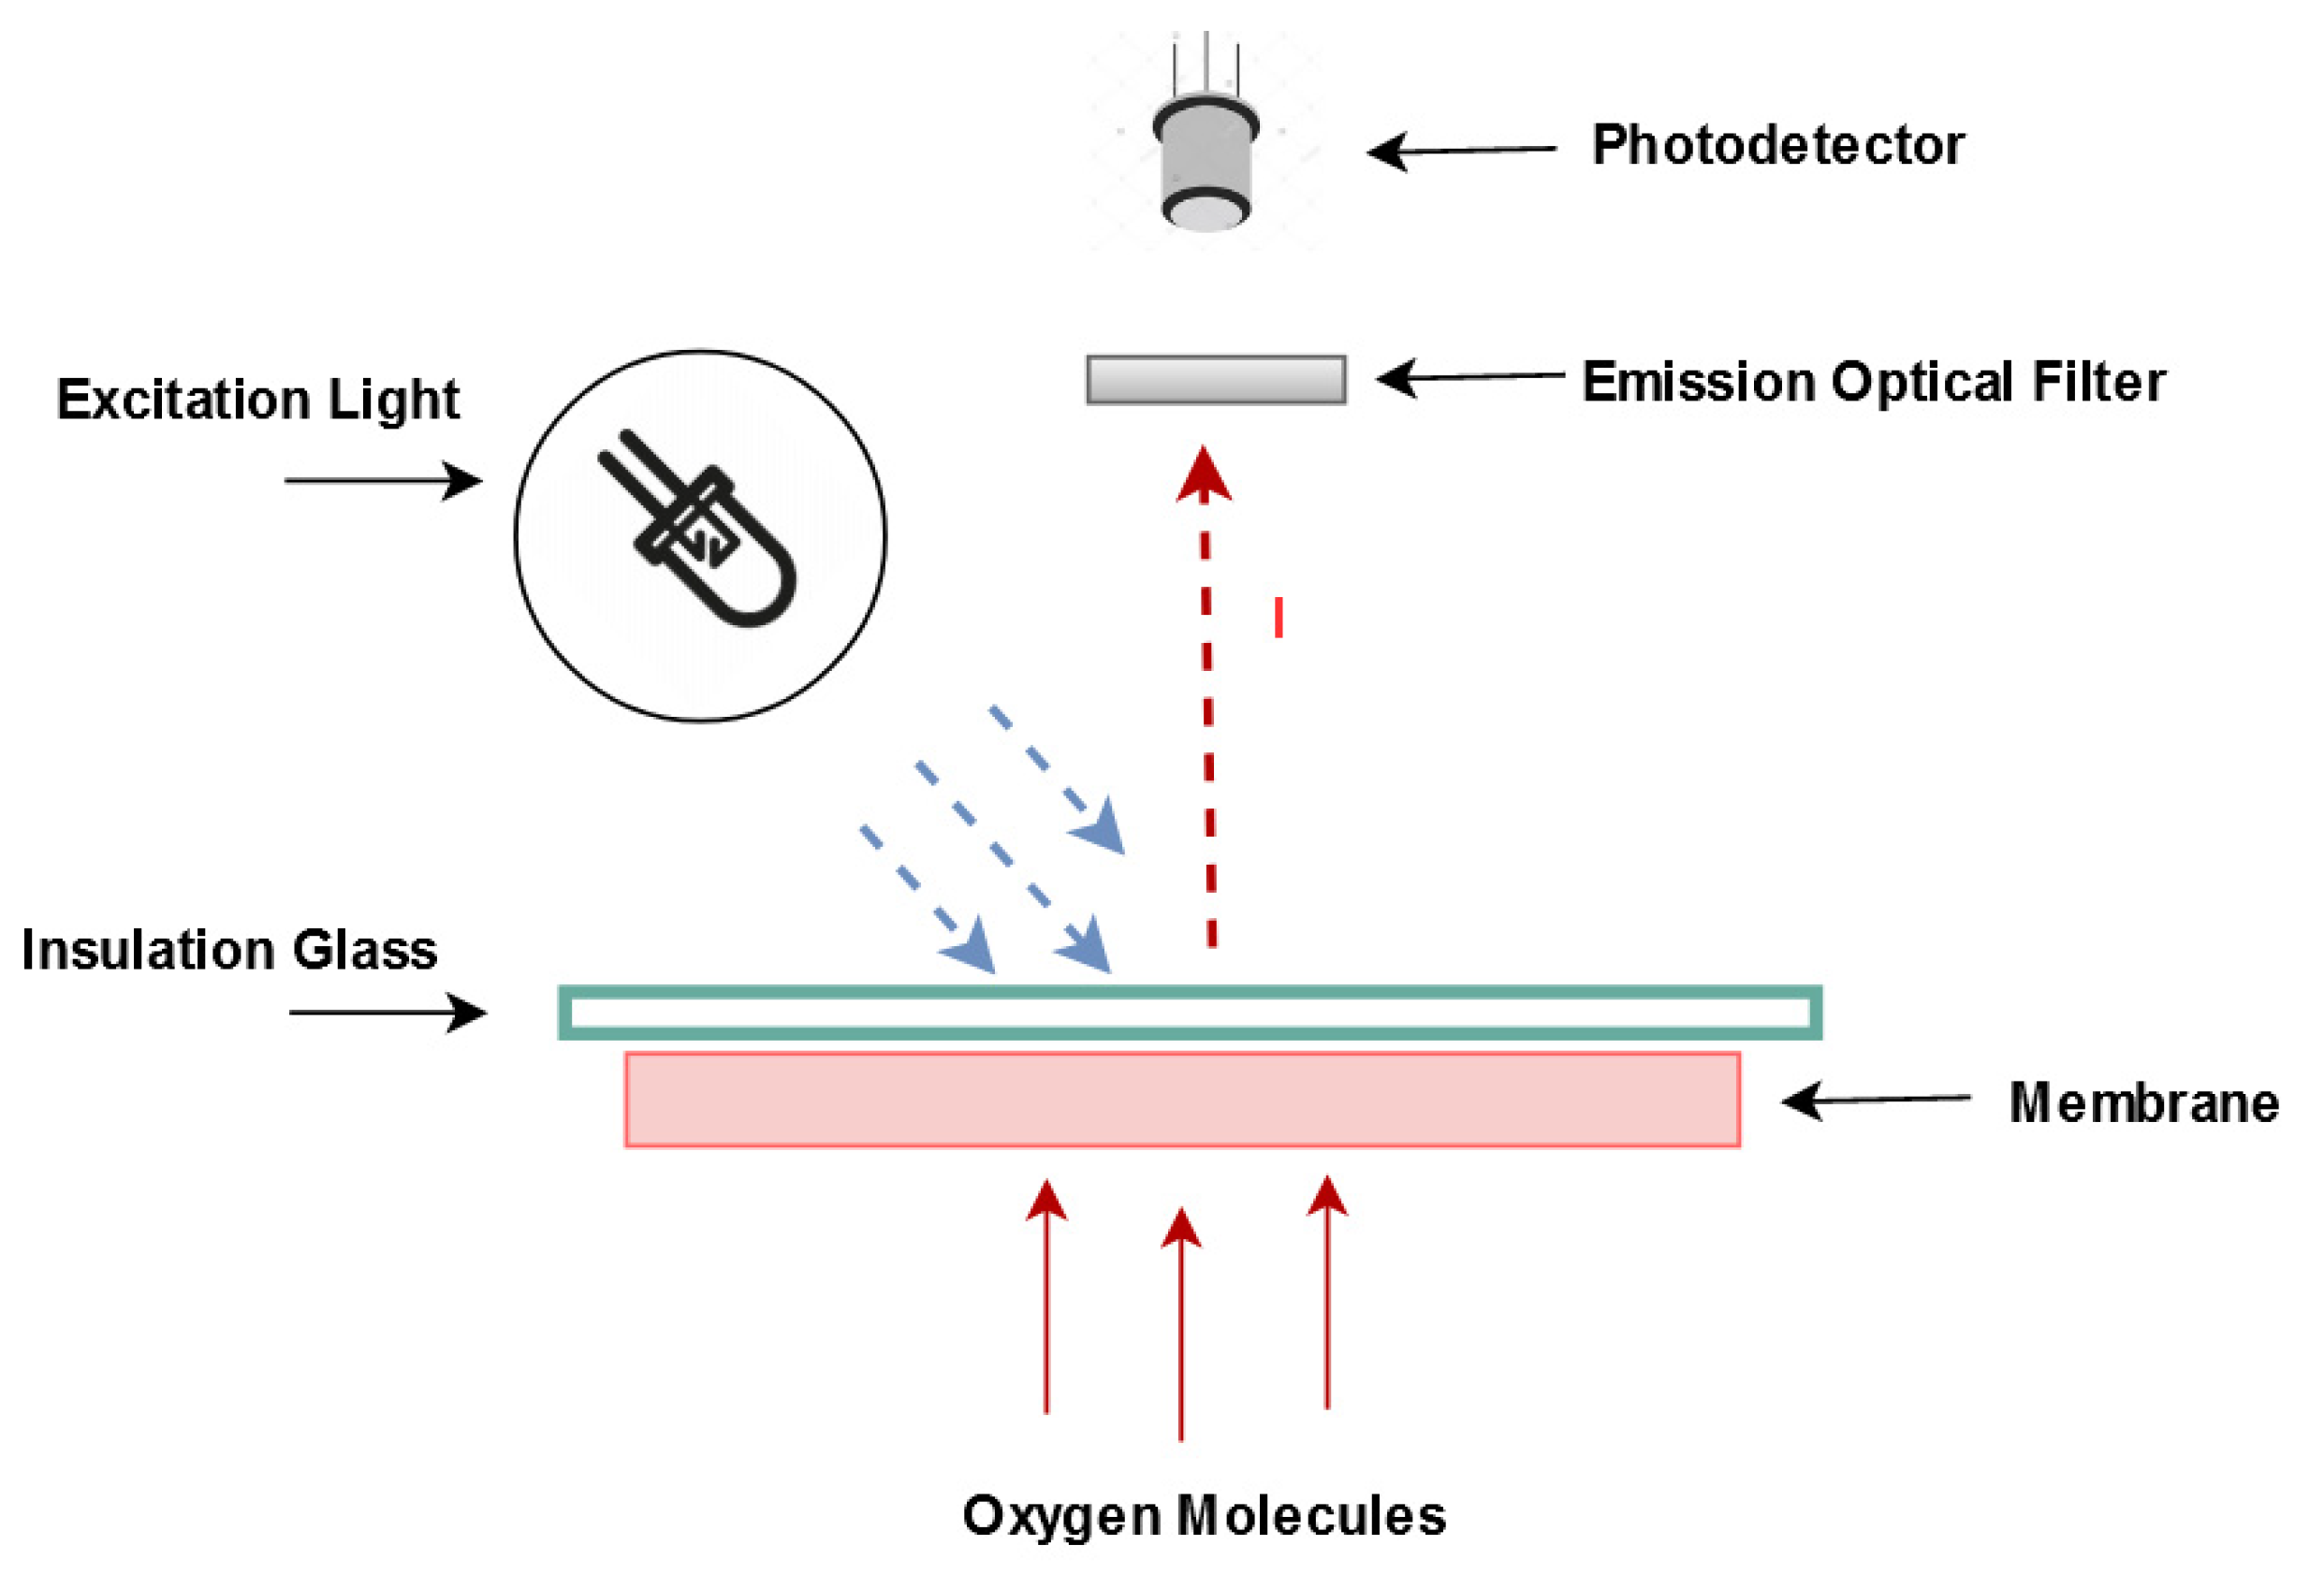
Figure 1 presents a typical optical oxygen sensor, where the membrane is excited with a light source and the luminescence is detected with a photodetector. Optical oxygen sensors are based on the dependence of fluorescence intensity on the concentration of dissolved oxygen. In such sensors, besides the fluorescence of the indicator (doped in the membrane matrix), the membrane needs to be able to diffuse oxygen, in such a way that oxygen will rapidly reach many of the active indicator molecules.
To determine the oxygen concentration in a homogeneous matrix (ideal matrix) where the oxygen accesses all the polymer molecules in an equal way and the indicator has a uniform concentration, Stern–Volmer equations are used, as shown in Equations (1)–(3) [
5].
where
is the maximum intensity of the membrane luminescence (in an oxygen-free environment),
corresponds to the intensity of the membrane in the sample,
corresponds to the excitation lifetime in a sample without oxygen,
is the lifetime of excitation of the test sample,
corresponds to the Stern–Volmer constant,
corresponds to the partial pressure of oxygen in the sample and
is the quenching response constant. The variables
—solubility constant and
—oxygen diffusion constant represent the properties of the membrane matrix. When it is used an heterogeneous membrane, it is necessary to resort to more complex mathematical equations [
6]. As a result of these equations, a linear relation is obtained between the intensity—
(or lifetime—
τ) and oxygen concentration, describing the distribution of the indicator as homogeneous and uniform; that is, all the indicator molecules are equally accessible throughout the entire membrane.
We present an optical sensor for dissolved oxygen, based on a LED membrane (PtOEP-PDMS) photodiode system to detect low oxygen concentrations for in situ applications. We demonstrate that the signals obtained from the sensor can be used for oxygen measurements in the range from 0.5% up to 20% for gaseous media, and from 0.5 mg/L up to 3.3 mg/L for liquid media at 1 atm, 25 °C.
1.2. PtOEP Indicator
A full review on luminescent indicators is found in [
7]. They can be classified as polycyclic, aromatic hydrocarbons, polypyridyl complexes, metal porphyrins, cyclometallated complexes and complexes with rarely used central atoms.
In this work, a metalloporphyrin indicator dye, platinum octaethylporphyrin (PtOEP) is used, due to their strong room-temperature phosphorescence with a quantum yield (φ) of about 0.5 [
8]. This indicator has been widely used in optical oxygen sensors and was immobilized in various oxygen-permeable polymeric matrices such as polystyrene [
9], poly(aryl etherketone) [
10], ethyl cellulose, cellulose acetate butyrate and polyvinylchloride [
11] styrene-pentafuorostyrene copolymer film [
12], PDMS [
13] and poly(1-trimethylsilyl-1-propyne) [
14]. A general disadvantage of this indicator is its rather low photostability [
7]. However, Platinum tetrakis (pentafuorophenyl)-porphyrin (PtTFPP) can replace PtOEP for higher photostability [
9], but its synthesis is more complex and it performs a lower quantum yield (0.21) [
15].
1.3. PDMS-Based Membranes
To protect the indicator from interactions with the external environment and preserve its integrity and optical characteristics, it is usual, in the literature and in commercially available sensors, to use membranes where indicators are dispersed and immobilized in matrices. However, this membrane should be permeable enough to oxygen, so it can reach the indicator. Depending on the indicator to be used, there are several polymers that can be used to immobilize indicators. The environment (matrix) where the indicator is dispersed has a great influence on the sensitivity of the sensor. Thus, it is common to find indicators that, when immobilized in different matrices, result in highly different sensors, with different sensitivities and ranges.
When choosing the matrix polymer, some factors that should be maximized are the permeability of the matrix to oxygen (
P), the dispersion (
D) of the indicator in the polymer homogeneously, the solubility of the oxygen in the polymer (
S), the compatibility of the indicator solvent with the selected polymer and issues related to the commercial availability of the polymer. The permeability of the matrix to oxygen is given by the following Equation (4).
Polydimethylsiloxane, also called PDMS, has excellent properties as a dispersion polymer, as shown in
Table 1, where several dispersion polymers are compared [
16,
17,
18].
PDMS is an interesting polymer that, in addition to completing the chemical and physical requirements discussed above, it is easily synthesized in the laboratory, has great commercial availability at low prices, is non-toxic, is relatively inert and non-flammable, is hydrophobic and wide used in microfluidic systems [
19]. PDMS is also impermeable to liquids, thus isolating the sensor electronics.
2. Materials and Methods
2.1. Membrane Fabrication
The PDMS solution was prepared considering manufacturer instructions. This solution results from the mixing of 1 g of curing agent (cross-linker) with 10 g of pre-polymer, (Sylgard 184, Ellsworth Adhesives Ibérica, Madrid, Spain) mixed manually with a spatula in a glass beaker. The mixture was vacuumed several times until it became homogeneous, transparent and without air bubbles. Subsequently, 10 mL of the solvent (toluene or THF, Sigma-Aldrich Co. Ltd., Schnelldorf, Germany) was mixed with indicator (PtOEP, Sigma -Aldrich Co. Ltd., Schnelldorf, Germany). A magnet bead was added, the recipient was covered with parafilm and stirred for 15 min. Afterwards, the beaker was uncovered, allowing the solvent to evaporate at room temperature (22 °C, 50%RH) for an additional 15 min in the stirrer.
The PDMS mixture was added to the indicator, mixed with a spatula and followed by magnetic stirring for 15 min, uncovered. The mixture was covered with perforated parafilm, and ultrasound mixing was carried out for 20 min (maximum effective power) at 26 °C.
The membranes were fabricated by molding (to obtain thicker films), resulting in thicknesses of 0.1 mm to 2.5 mm. All membranes were placed in the oven for 24 h at 80 °C, to cure PDMS and to remove the solvent. The equipment used for this procedure were: ultrasound Martin Walter Powersonic D, magnetic Stirrer MSH 300, spin-coating Polos SPS Spin 150 and Hot Plate Prazitherm PZ28-2 Heating plate. The thickness of the membranes was measured and non-uniformity in thickness was found (up to 15%) in the membranes area, as a result of the molding process.
2.2. Sensor Design and Electronics
The sensor structure was fabricated by additive manufacturing, using ABS (Acrylonitrile Butadiene Styrene) as raw material, with accurate dimensions to support and immobilize the photodiode, filter and LED. The external encapsulation is made of PVC (Polyvinyl chloride). Furthermore, the interior of PVC was painted with conductive paint and connected to the ground of the circuit. Shielded coaxial cables were used to connect both the LED and the photodiode to the electronic circuit. These two strategies will allow noise reduction and protection from external activity (such as movement and capacity changes that interferes with the low photodiode current).
Figure 2 represents the sensor section design and
Figure 3 a photograph of the fabricated device.
The sensor includes two electronic circuits: one for signal conditioning (a transimpedance amplifier—TIA) and other for LED excitation (current sink) that included a current sink circuit ensuring a constant current in the LED, thus a constant light intensity. A microcontroller (STM32F767) is used for data acquisition and control. It controls the LED excitation and computes the oxygen concentration, using an internal Analog Digital Converter ADC (12 bits) to convert the voltage output of the signal conditioning circuit. An average of ten readings is realized, and the correspondent oxygen concentrations are calculated and sent by the UART of the microcontroller every 10 s. To reduce energy consumption and to increase the photostability of the membrane, the LED is only turned on to perform the measurement. The hardware is briefly described in
Figure 4.
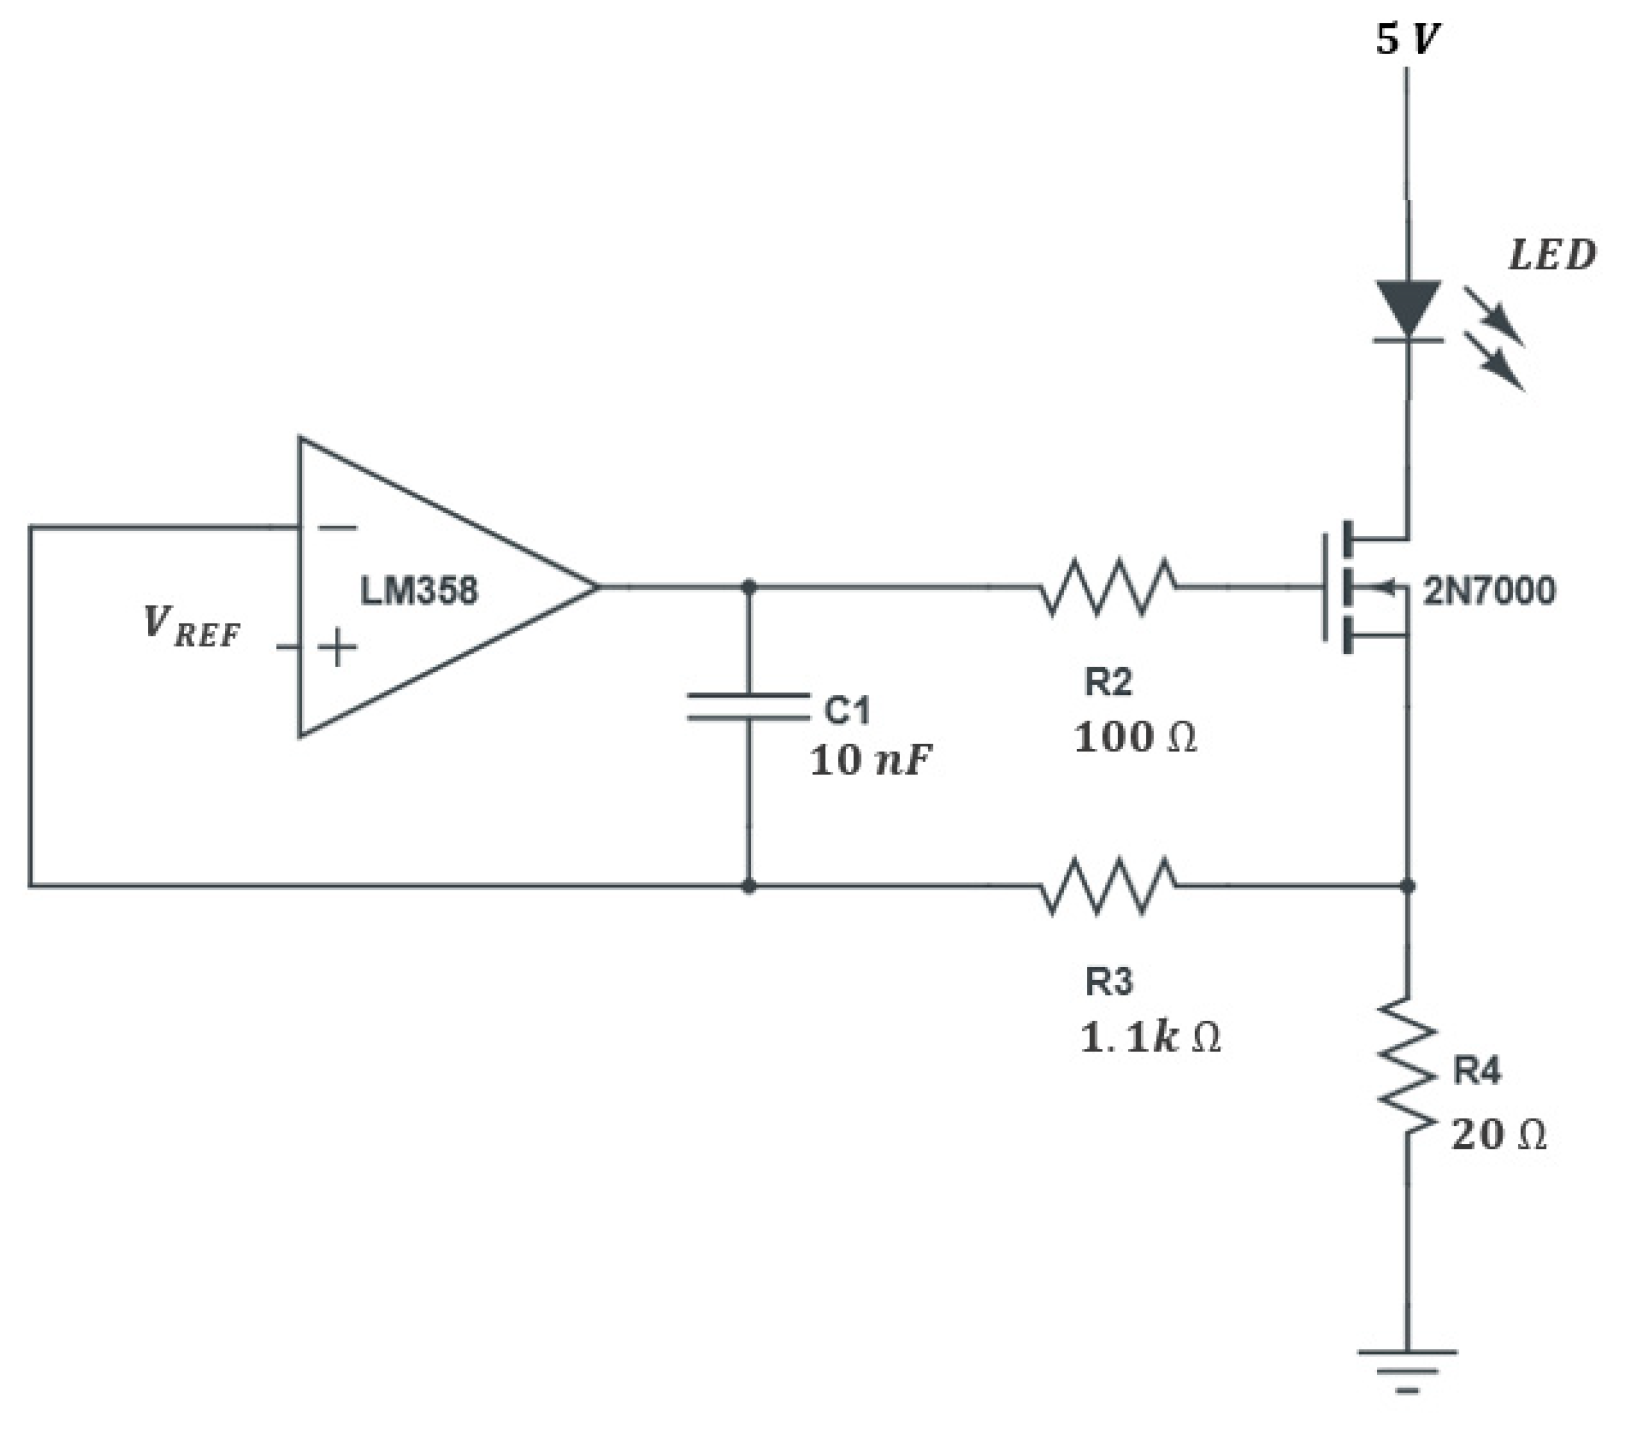
The intensity of the LED light needs to be precise and stable to avoid error in the oxygen reading. For this purpose, a current sink circuit was developed (
Figure 5), capable of supplying a constant current independently of the supply voltage fluctuations from the power supply. For the excitation, the UV LED Bivar UV5TZ-385-30 was selected because it has an emission peak at a wavelength (385 nm) close to the maximum absorption of the indicator.
The voltage in
R4 is proportional to the current of the LED and is compared with a reference voltage (
VREF), at the positive input of the amplifier. This comparison result is used to control the gate of the N mosfet (2N7000) and, consequently, the current in the LED in a closed-loop cycle. The LED current is given by Equation (5), whereas
R4 is a precision resistor.
C1 and R3 allow compensating for unwanted oscillations of the amplifier (loop compensation). The value of R3 must be much higher than R4, and the R3C1 time constant should allow a settling time for the desired switching speed. It was defined at a maximum frequency of approximately 10 kHz, with R3 of 1.1 kΩ and C1 of 10 nF. The LED current was defined as the maximum recommended current (20 mA), and a maximum direct voltage of 3.6 V is expected.
The transistor has a drain-source resistance of less than 10 Ω when turned on, which represents a drain-source voltage below 0.2 V. Using a reference of 400 mV (NCP135BMT040TBG), a supply voltage greater than 4.2 V is necessary, so 5.0 V is used.
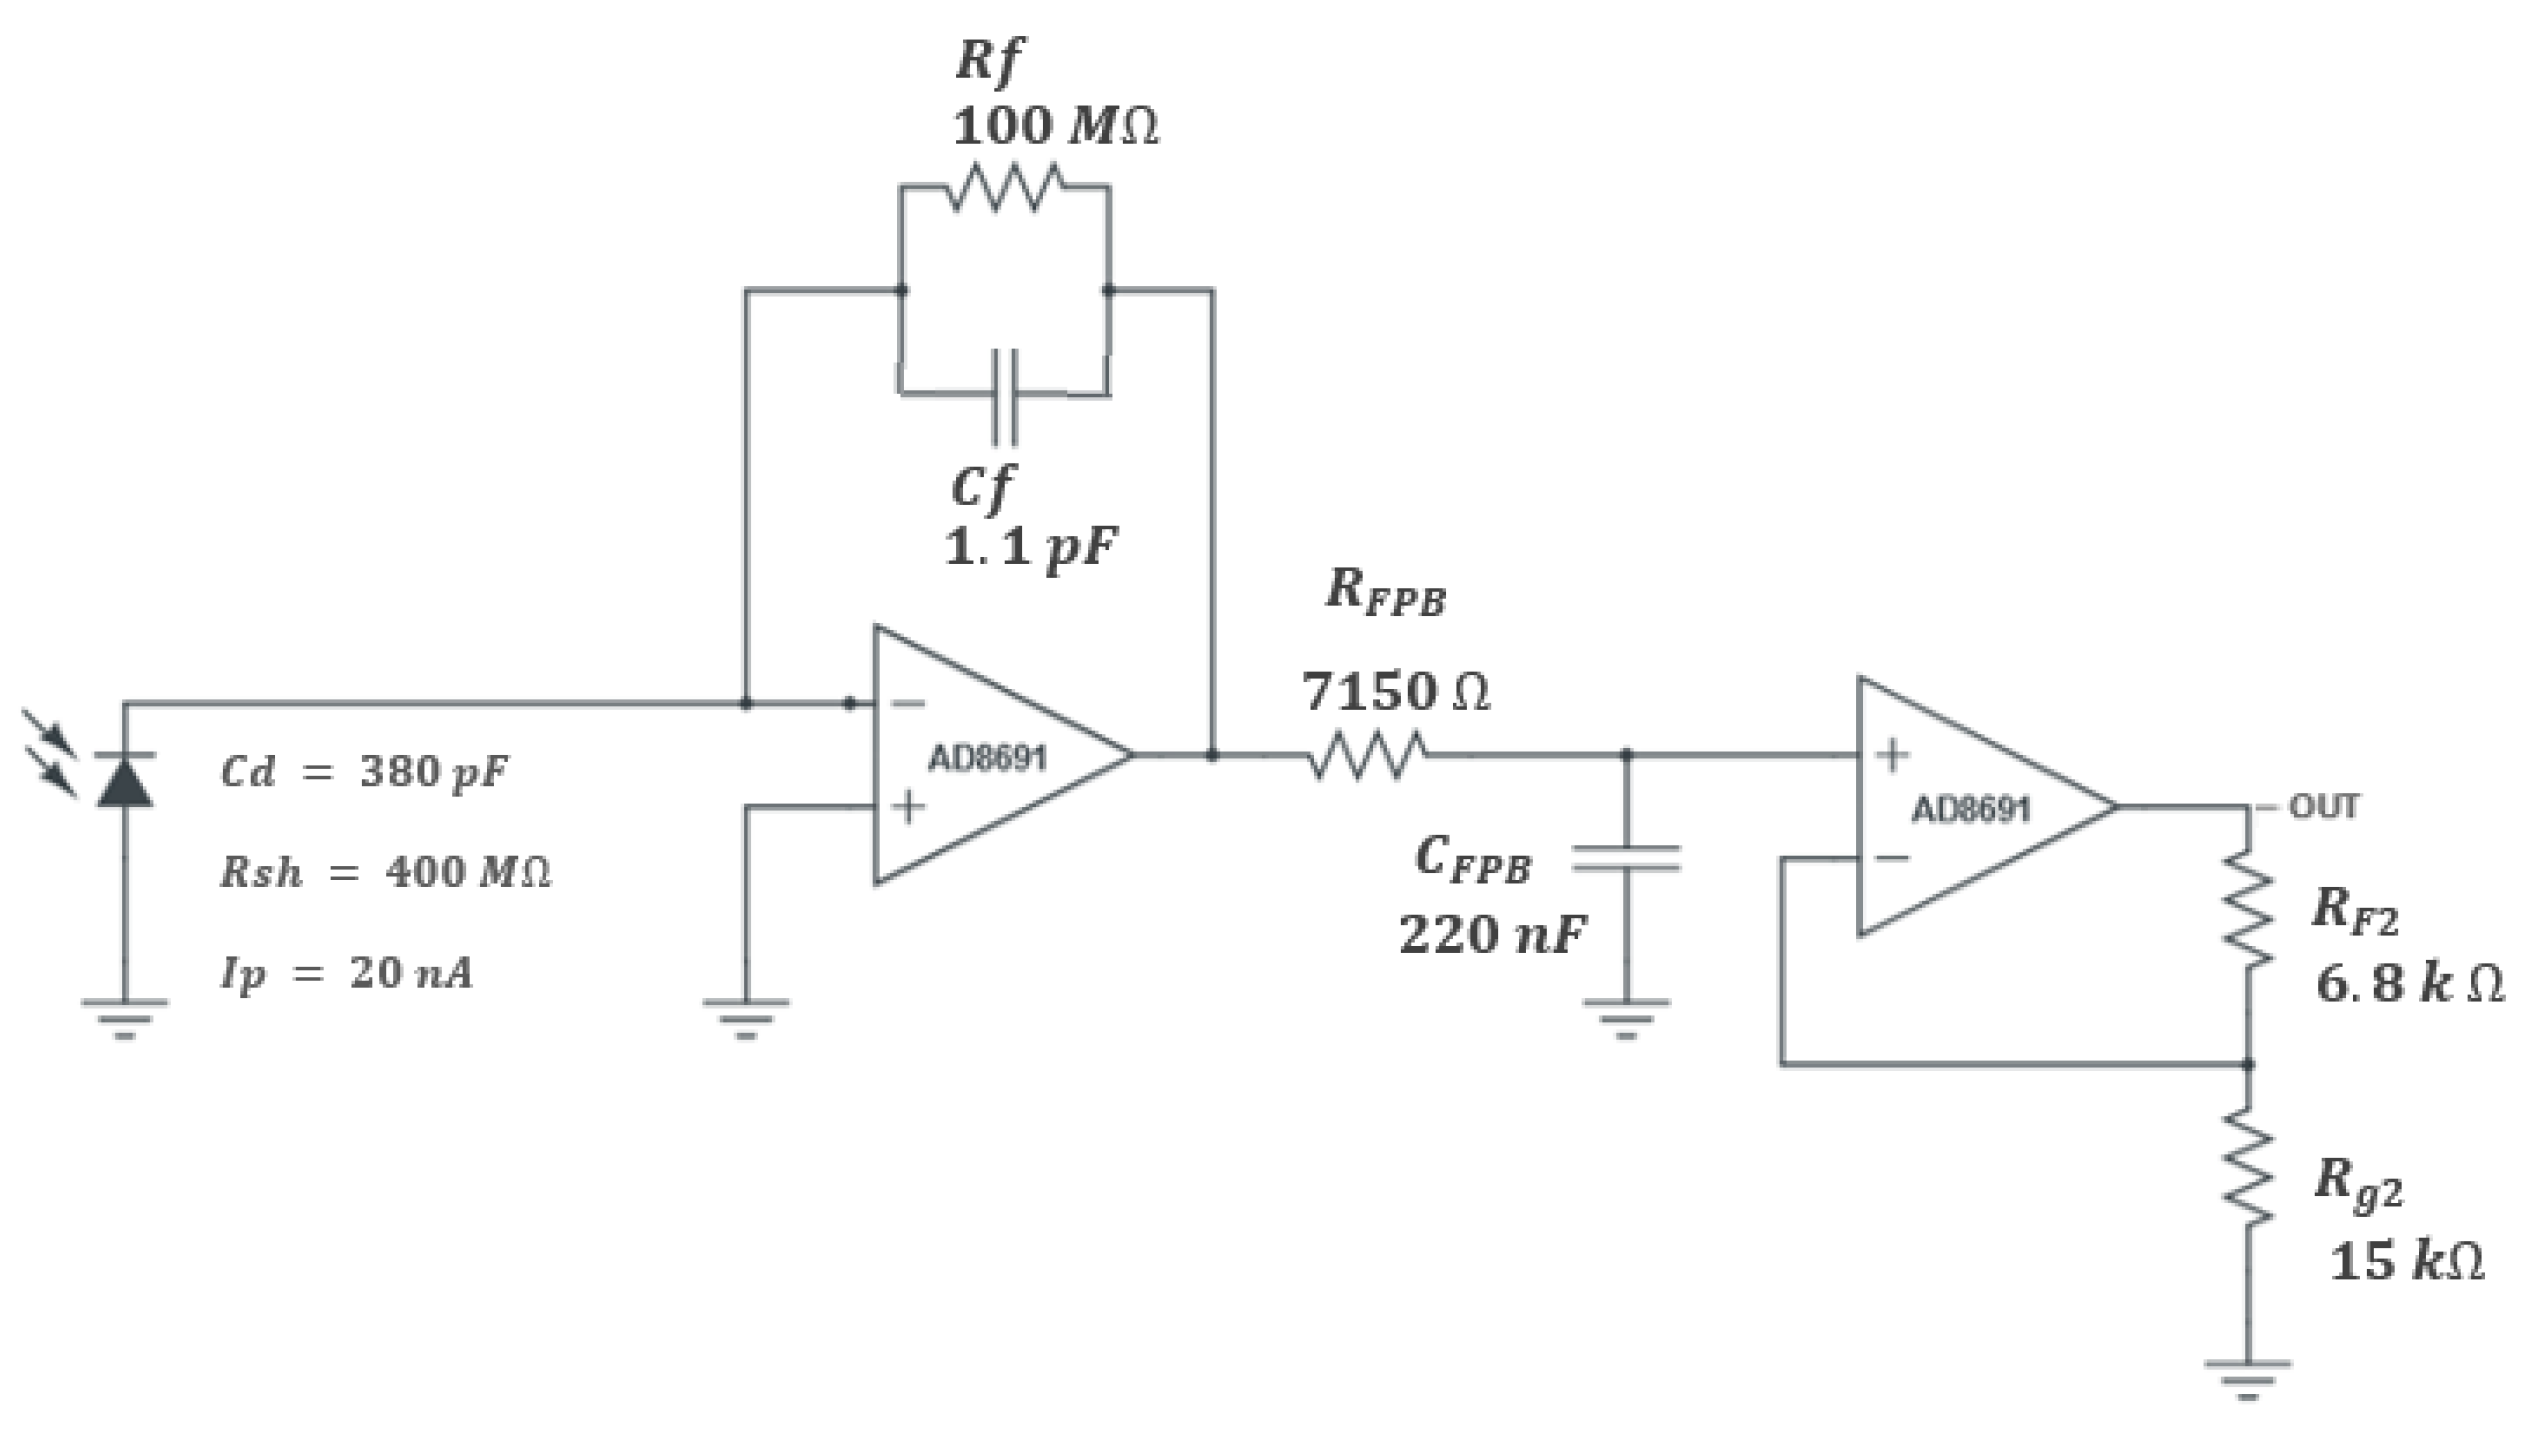
The conversion of the luminescence intensity in a constant voltage is performed using the circuit presented in
Figure 6. The selected photodiode (Hamamatsu S1336-8BK) is used in photovoltaic mode, polarized with 0 V, to minimize dark current. This photodiode has a sensitive area of 5.8 × 5.8 mm, low dark current (100 pA) and excellent quality/price ratio. The photodiode is connected to a transimpedance amplifier (TIA), followed by a low-pass filter and a second stage amplifier, as shown in
Figure 6.
The maximum input current of 20 nA in converted to an output voltage of 3.0 V, thus a gain of 146.3 V/µA is implemented in the transimpedance amplifier circuit, based on the precision amplifier AD8691 (using only the first stage does not allow to obtain the desired gain, since a large value of Rf is required). This amplifier (AD8691) has a low bias current (typical of 0.2 pA) suitable for the high impedance of the circuit, and a current noise density of 0.05 pA/√Hz, that will produce a noise output of approximately 20 mV at 100 Hz bandwidth, since the filter between the two stages implements a low pass at 100 Hz.
2.3. Characterization Methods
Absorption spectra were recorded with a setup that includes a 200 W quartz tungsten halogen lamp (Newport 6334NS) as light source; a monochromator (Oriel Intruments Cornerstone 74,000); an optical fiber (Newport Standard Grade FS Fiber Optic) used to guide the light through the sample and into the photodiodes box; and a picoammeter (Keithley 487) to measure the photodiode current. This enabled the selection of the best membranes to carry out the remaining tests.
Subsequently, a luminescent analysis was performed. Therefore, a controlled atmosphere was produced inside a small container, made up of pressurized argon and oxygen. For liquid samples, the container was filled with ultrapure water and the same gases were injected into the water volume.
To obtain homogeneous media, it was necessary to include a small turbine inside the recipient.
Luminescence analysis was performed with a lock-in amplifier (Zurich Instruments HF2LI) and its software (LabOne), to extract intensity and lifetime of luminescence. Spectral analysis of luminescence was analyzed with a spectrophotometer—
AvaSoft Avaspec ULS2048 XL-RS-EVO, to carry out the remaining analysis. We considered the linearity, higher absorption, and greater range as fundamental criteria in selecting the best membrane. For this, the selected membrane should have homogeneous distribution of the indicator [
20], without crystallizations or aggregate inside the membrane that results in a non-linear response.
The complete sensor based in a photodiode paired with a ThorLabs bandpass filter was tested to evaluate oxygen concentration, and their results were compared with a commercial sensor (Extech DO210).
3. Results and Discussion
During the manufacture of the membranes, three fabrication parameters were considered: the indicator concentration, the solvent used and the final thickness of the membrane. Two different solvents (toluene and THF) were tested; four different indicator concentrations (2, 4, 6 and 8 mg dissolved in 11 g of PDMS resulting in the concentrations of 181, 363, 545 and 727 ppm) were studied, and membrane thicknesses from 0.1 mm up to 2.5 mm were fabricated.
The membranes were first tested for light absorption in the range of 350–600 nm to find the maximum absorption wavelength. Subsequently, the absorption at this wavelength was measured for the membranes of different thicknesses and fabricated with different solvents (THF and toluene). The luminescence spectrum for the different fabricated membranes was recorded and analyzed. The luminescence intensity and the delay were analyzed using the lock-in amplifier. Finally, two sensors with different membranes were fabricated and tested in a gaseous and a liquid environment.
3.1. Membrane Absorption
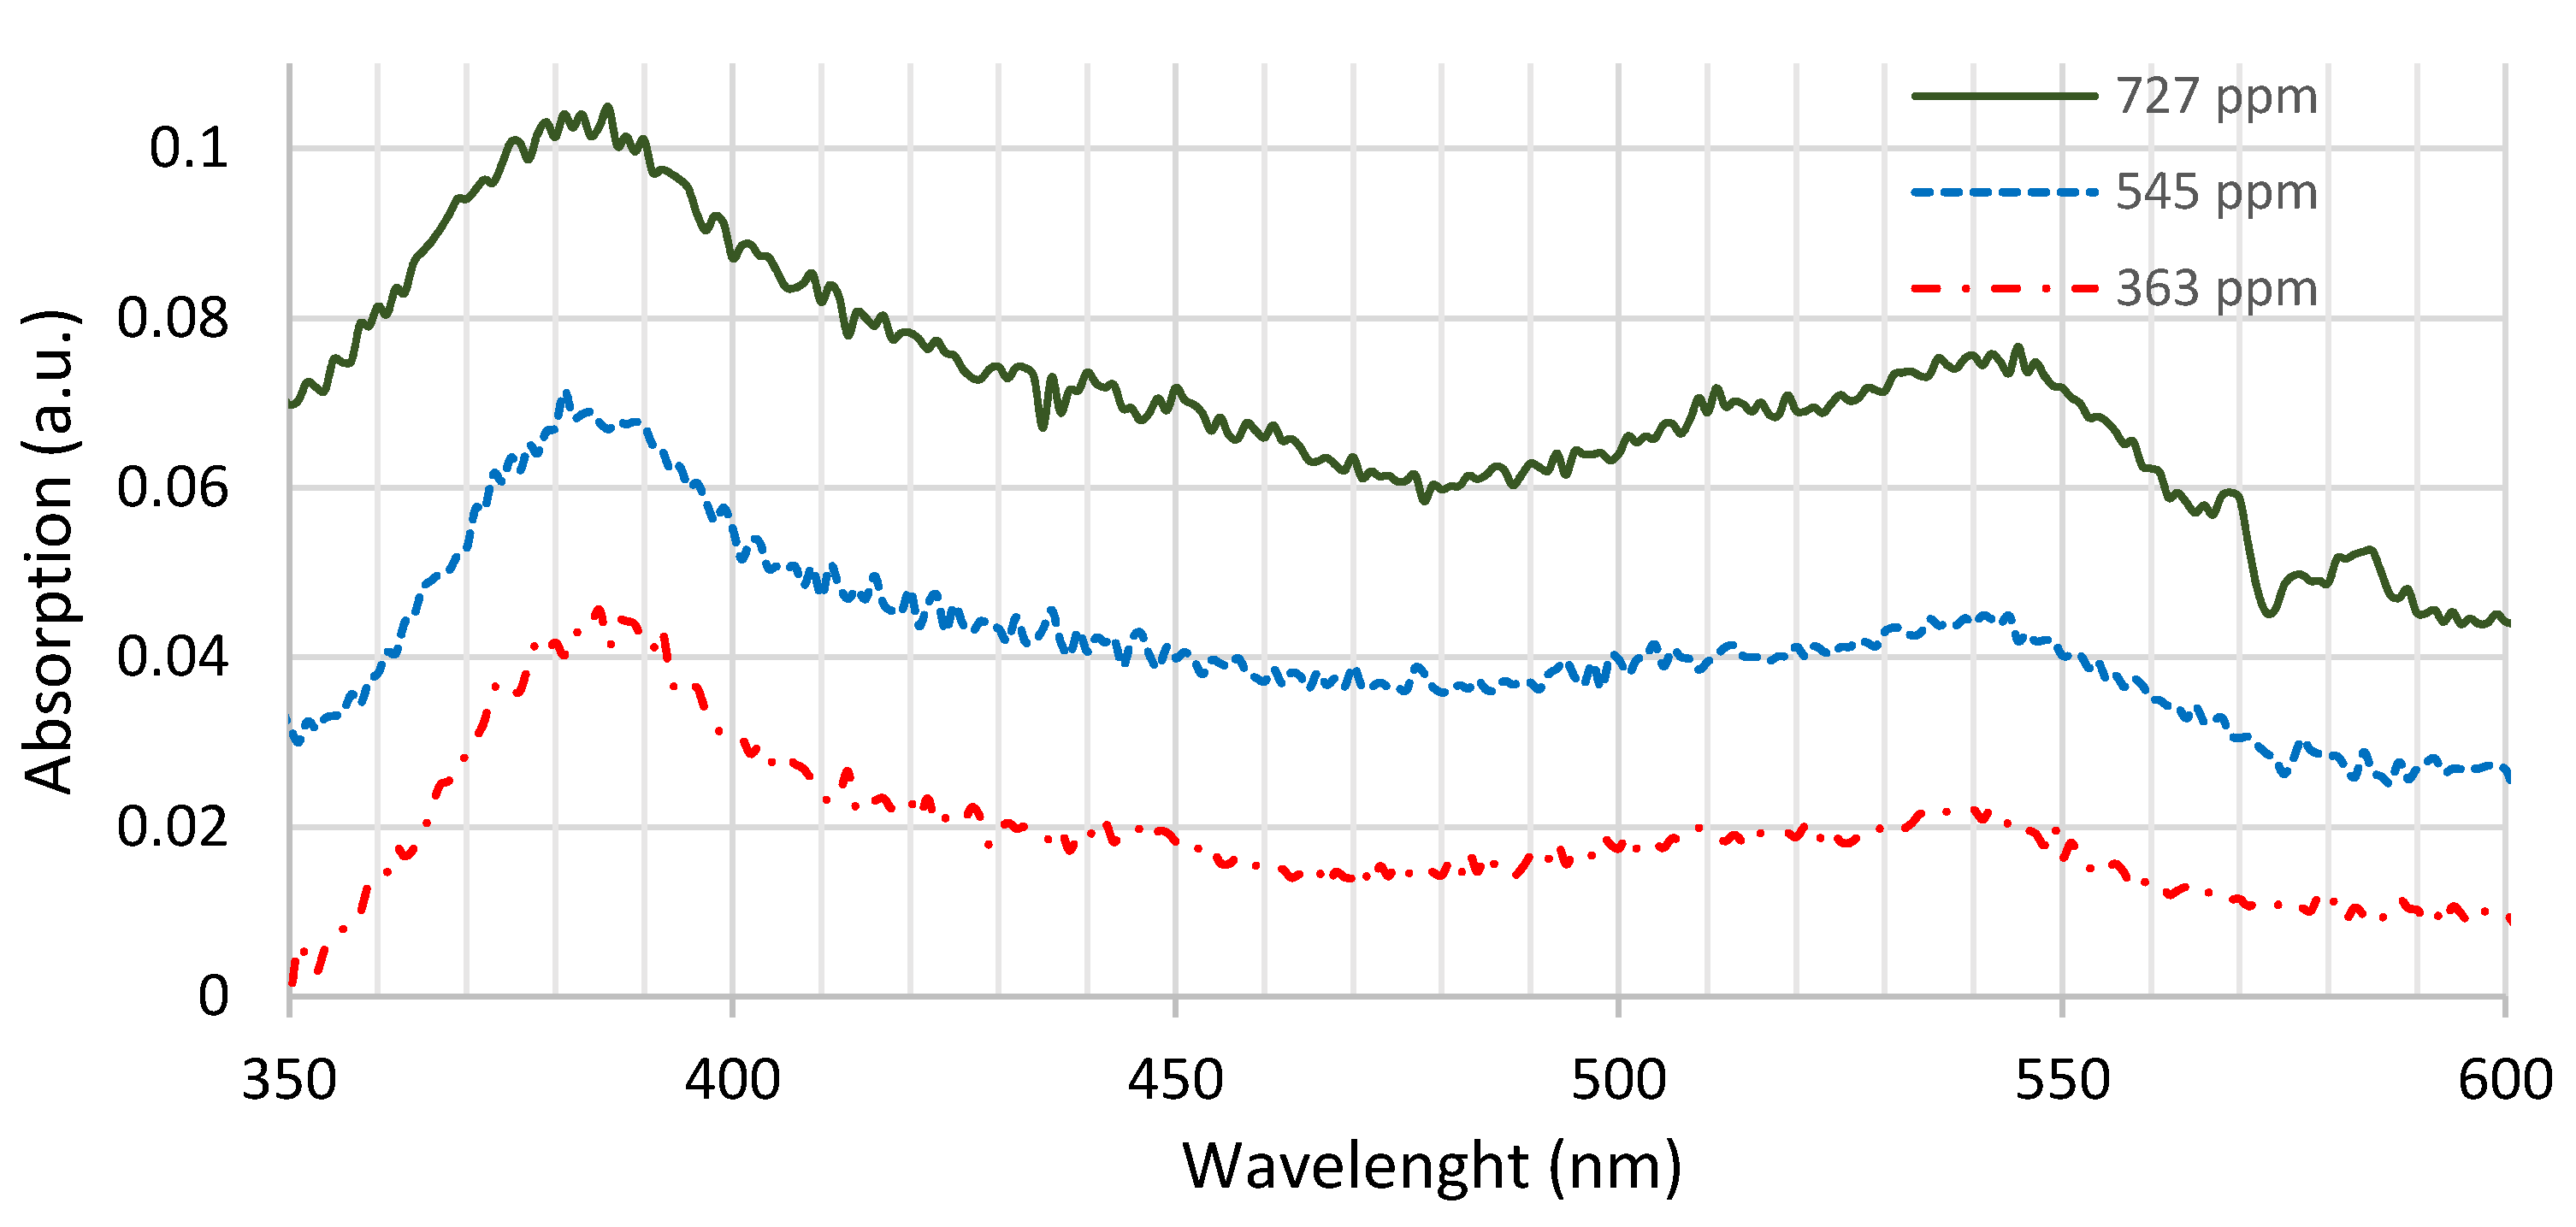
Figure 7 shows a typical absorption result of the fabricated membranes with different concentrations, similar thickness and the same solvent (namely THF).
There are two clear absorption peaks: the first, located in the Soret zone, at 385 nm (+/−3 nm) and the second in the Q zone, at 535 nm (+/− 3 nm). The emission intensity is higher when the excitation is carried out at wavelengths where higher absorption of the membrane is observed. UV excitation (385 nm) was selected to promote higher luminescence of the membrane. Additionally, this wavelength is sufficiently far from the luminescence wavelength, as demonstrated further.
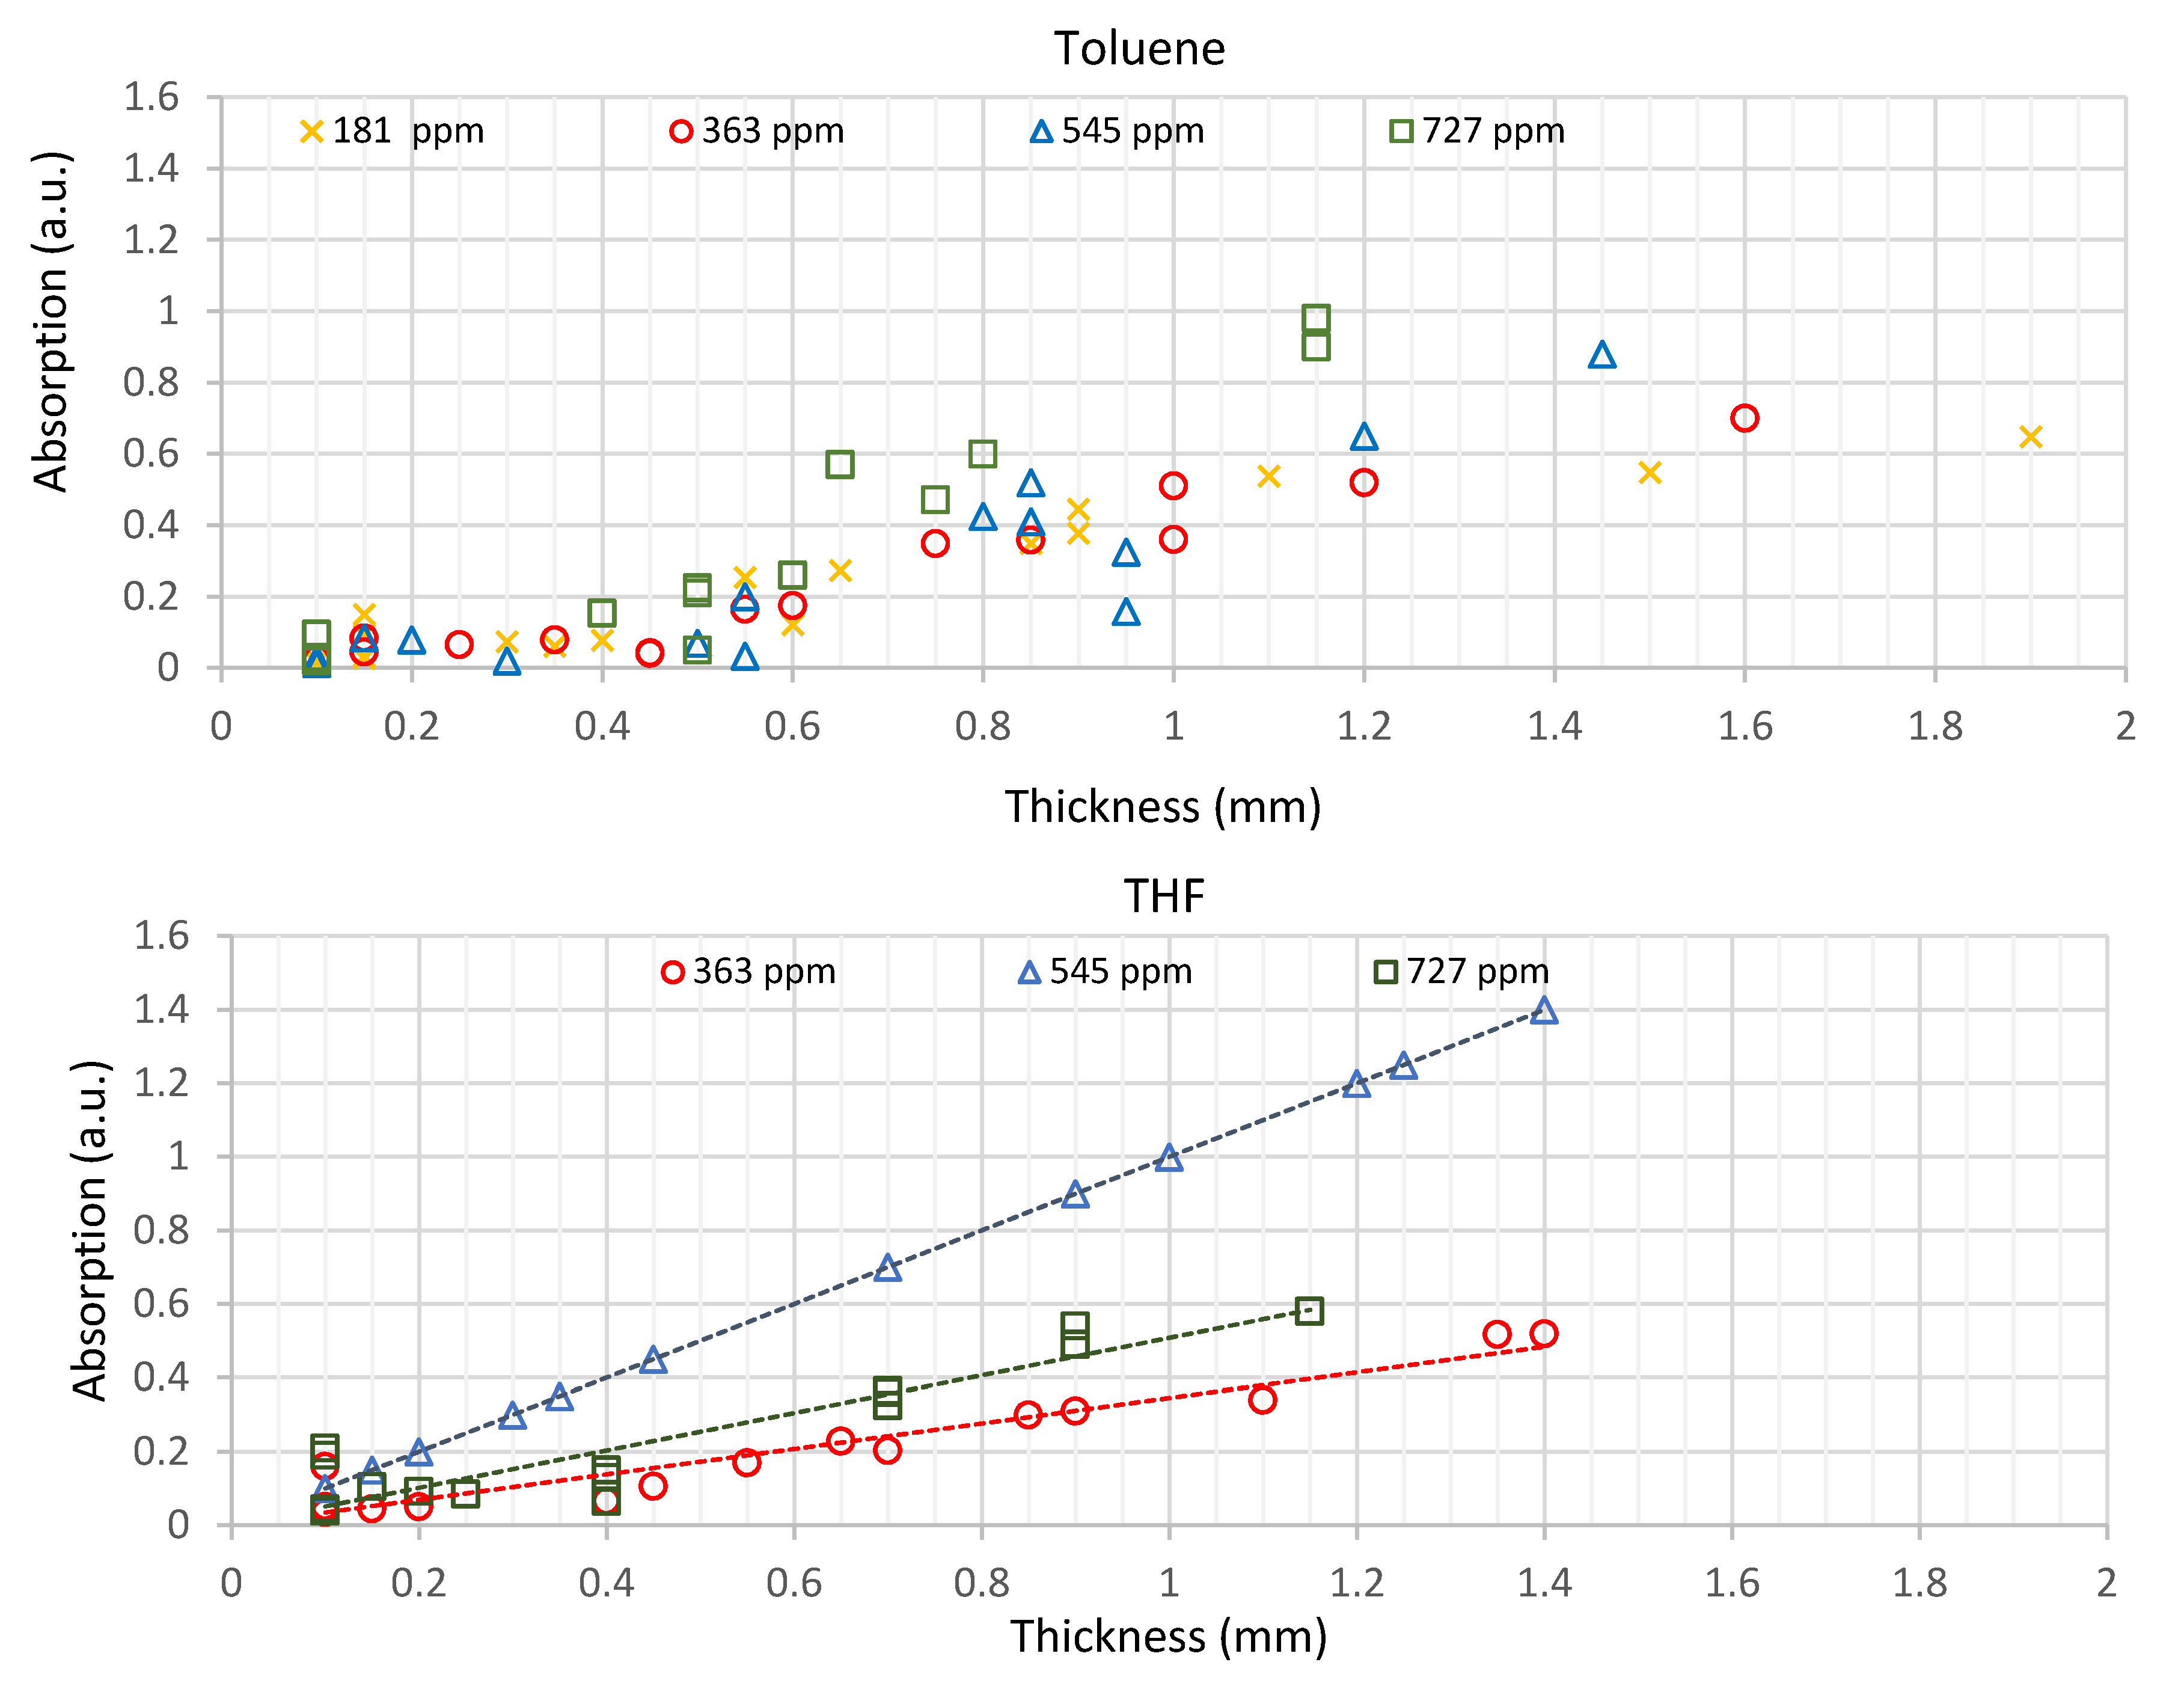
Figure 8 shows the relationship between absorption (measured at 385 nm) and membrane thickness with the solvent’s toluene and THF, respectively, using different indicator concentrations.
The light absorption depends on the thickness, concentration and solvent used. The higher the concentration and thickness of the membrane, the higher the absorption. The absorption in membranes prepared with THF is almost linear with the thickness, contrary to the results obtained with toluene. Linearity differences may have their origin in the homogeneity of the indicator concentration and homogeneity in the thickness. Membranes made with THF also have slightly higher absorption values than those made with toluene, for the same thickness and indicator concentration.
3.2. Luminescence Spectrum
Figure 9 shows the variation of luminescence intensity between different toluene and THF-based membranes (indicator concentration of 363 ppm) over a spectrum between 635 nm and 658 nm for three different oxygen concentrations, 0.6%, 1.3% and 2%, with an excitation at 385 nm.
In both solvents, the spectrum is equivalent, and the highest luminescence was obtained at 645 nm. It was also stated that the emission wavelength peak (645 nm) of the indicator is independent of the excitation wavelength, since similar analyses were realized with excitation at 540 nm. Additionally, in both solvents, luminescence decreases as oxygen concentration increases. However, for the toluene solvent, with thicker membranes, luminescence is about 1.8 times higher than in THF-based membranes. An equivalent spectrum was also obtained in membranes with thicknesses between 0.15 and 1.4 mm, using both solvents, and the maximum intensity, the measurement range and the linearity of the inverse of luminescence relative to oxygen concentration (Equation (1)) were measured and results presented in
Table 2.
Although toluene membranes have a higher luminescence intensity, THF membranes have higher linearity and homogeneity (
Figure 8) and were therefore chosen for the following tests.
3.3. Membrane Luminescence Intensity and Lifetime
Stern–Volmer equations (Equations (1)–(3)) indicate that the variation of oxygen concentration can be measured using intensity (
I) or lifetime (
τ) of luminescence. Using an alternated excitation light, both intensity and lifetime can be, respectively, measured by the module and phase of measured luminescence, using a lock-in amplifier. The graphs of
Figure 10 show the results of the module and phase of luminescence as functions of oxygen concentration for the membrane 363 ppm 1.4 mm THF in a gaseous environment. The membrane was excited with the UV LED, modulating the intensity at frequencies between 100 Hz and 10 kHz. The resultant photodiode current from the luminescence was converted to voltage using the previously described electronic circuit for amplification (TIA).
The amplitude of the luminescence signal (R) at the output of the transimpedance amplifier decreases with the increase in oxygen concentration, as would be expected by the Stern–Volmer equation (Equation (1)). It is possible to analyse that the higher the excitation frequency, the higher the value of the modulus, representing higher sensor sensitivity. For the oxygen range between 0.5–1% oxygen, it is possible to observe that the membrane is clearly more sensitive, either in modulus (R) and phase (Θ), and its reaction tends to stabilize horizontally, revealing a lack of sensitivity to higher oxygen levels (>6%). An inversely linear relationship between the delay (
τ) and the oxygen concentration was also expected, which would be reflected as a phase shift in
Figure 10. However, only a small phase shift (that corresponds to a delay) was observed for low oxygen concentration (0.5–1%). This lack of agreement with the theory may be due to the reflection and dispersion of the excitation light in the membrane that also could be reaching the photodiode. The reflection and dispersion are in phase with the excitation, thus altering phase measurement. The reflexion/dispersion also affects the amplitude (R), resulting in an offset voltage measured for high oxygen concentrations.
The use of amplitude, through the intensity measurement method, was selected instead of the luminescence delay. This option is justified by the simplicity and the cost of the electronic circuits, since the lock-in amplifier and phase detection could be avoided. Further tests presented below also demonstrate the small effect of photo degradation in this sensor, due to low ON time of the LED light. It is thus possible to conclude that the analysis of the module enables to obtain higher sensibility and a higher measurement range. Although the use of the phase measurement could attenuate the effects of membrane aging, the following tests are carried out to analyse the intensity (modulus) of the signal, given the higher sensitivity observed.
3.4. Sensor Luminescence in Gaseous and Liquid Media
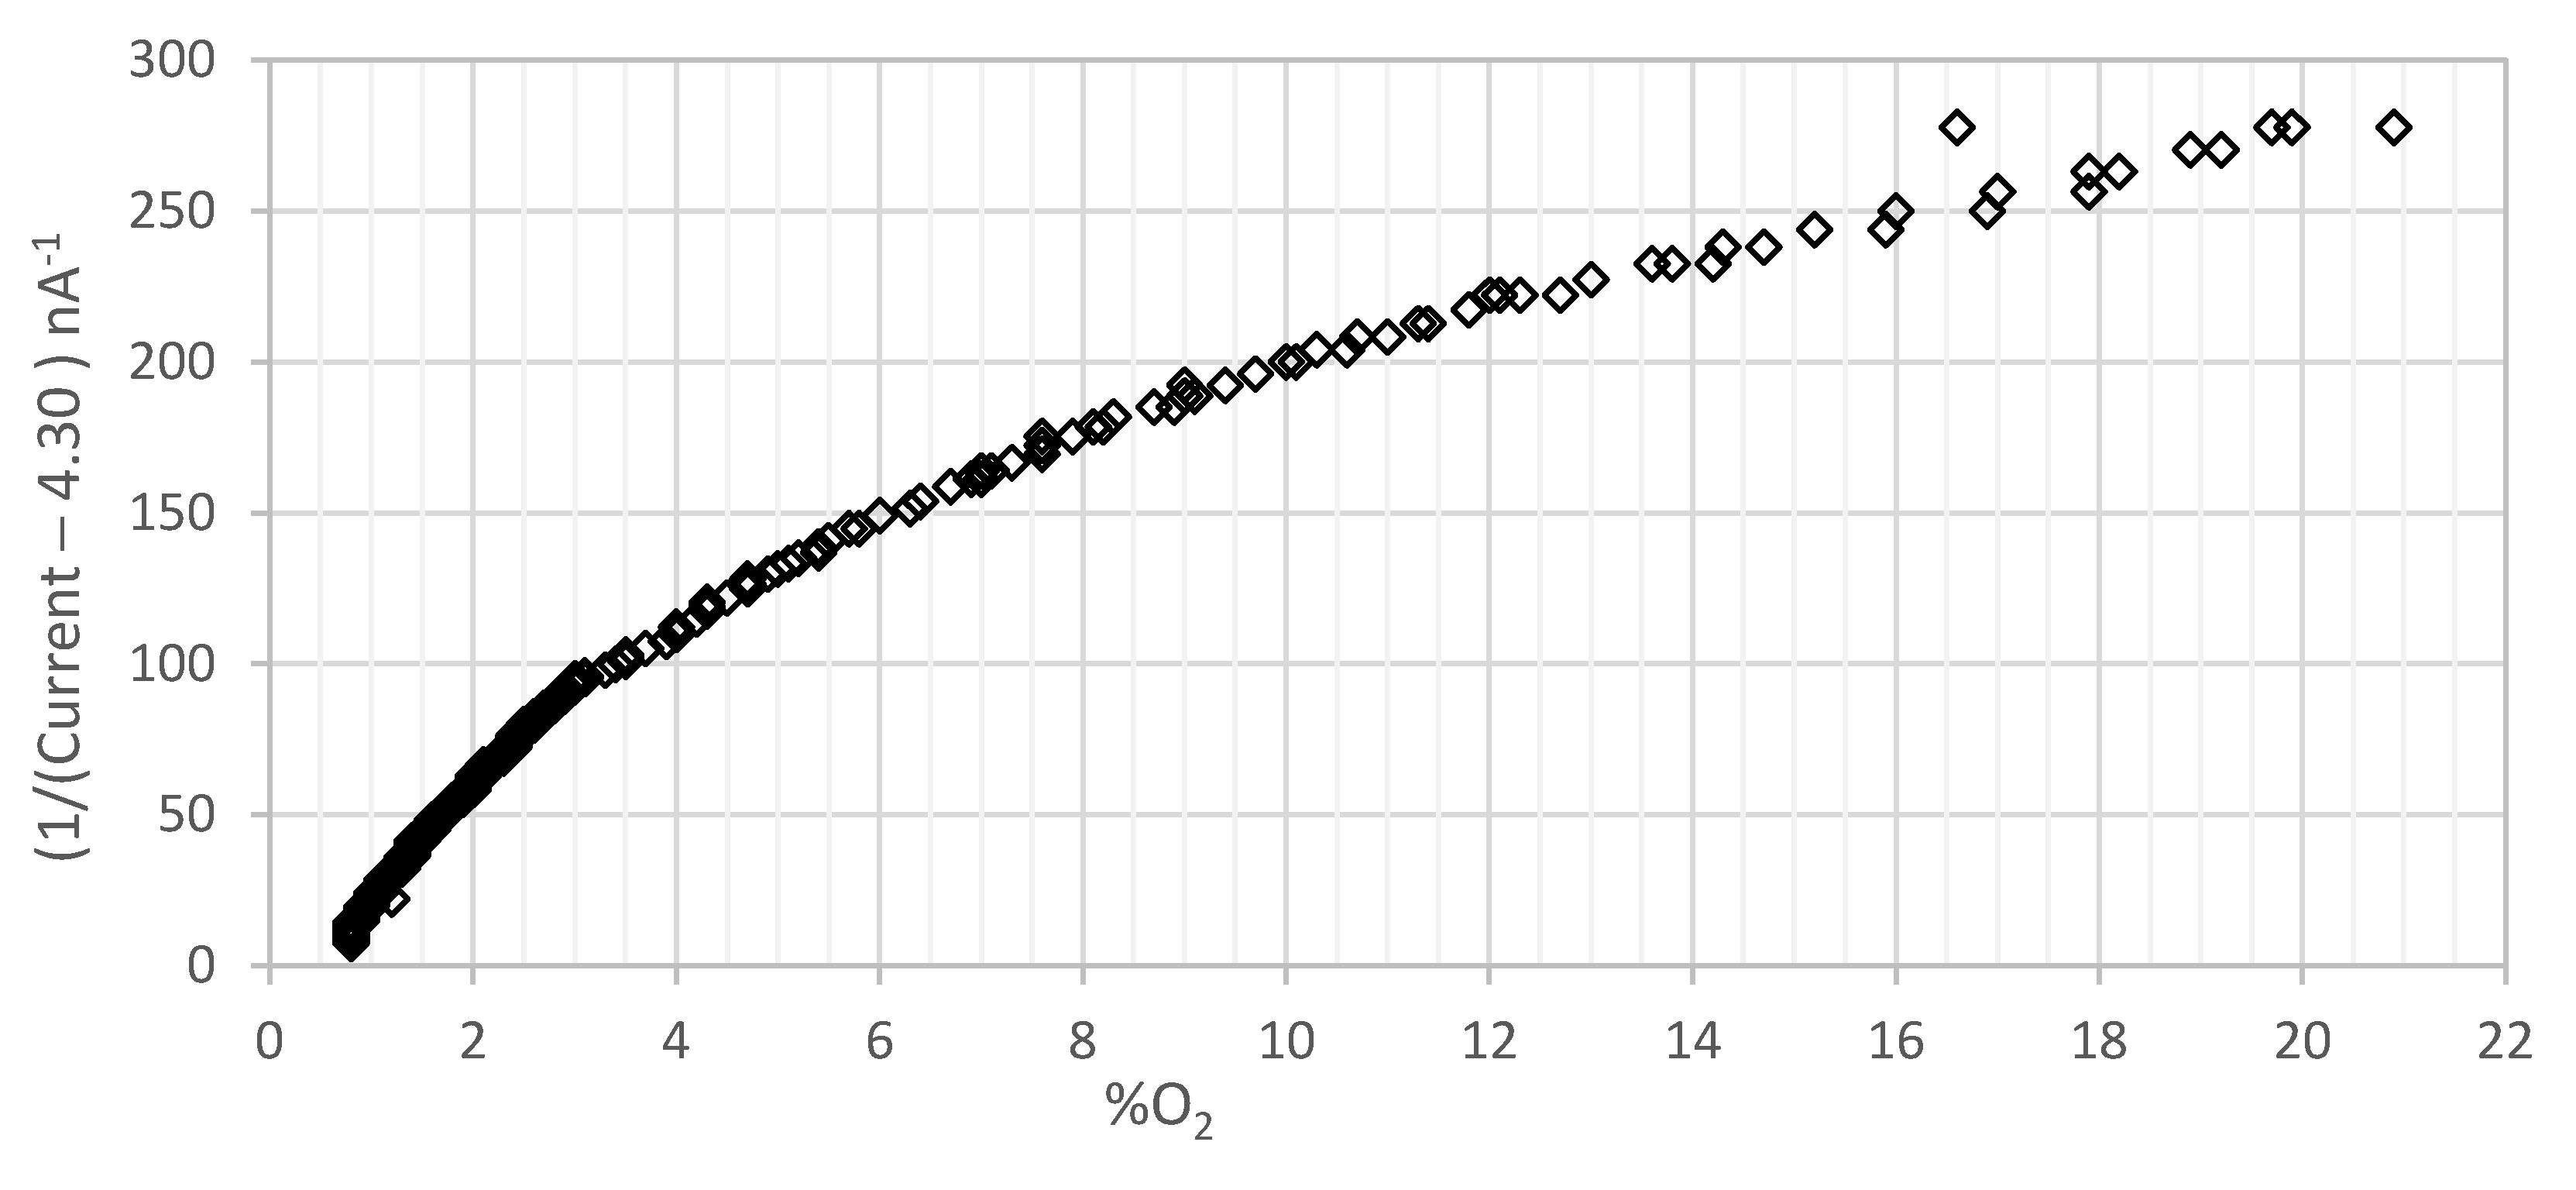
Figure 11 represents the inverse of the photodiode current, whereas the offset of 4.3 nA was already removed, along with the increase in oxygen concentration in a gaseous media for the membrane with 363 ppm of concentration and 1.4 mm of thickness fabricated with THF. As it can be seen, there is a linear trend towards higher oxygen concentration, with a small curvature in the lower oxygen range. It is possible to conclude that the membrane can measure oxygen levels up to 20%, but for higher values of oxygen concentration, the sensibility reduces, thus determining the end of the scale.
Figure 12 and
Figure 13 resume the tests performed in liquid media for the membrane with an indicator concentration of 363 ppm and 1.4 mm of thickness, fabricated with THF.
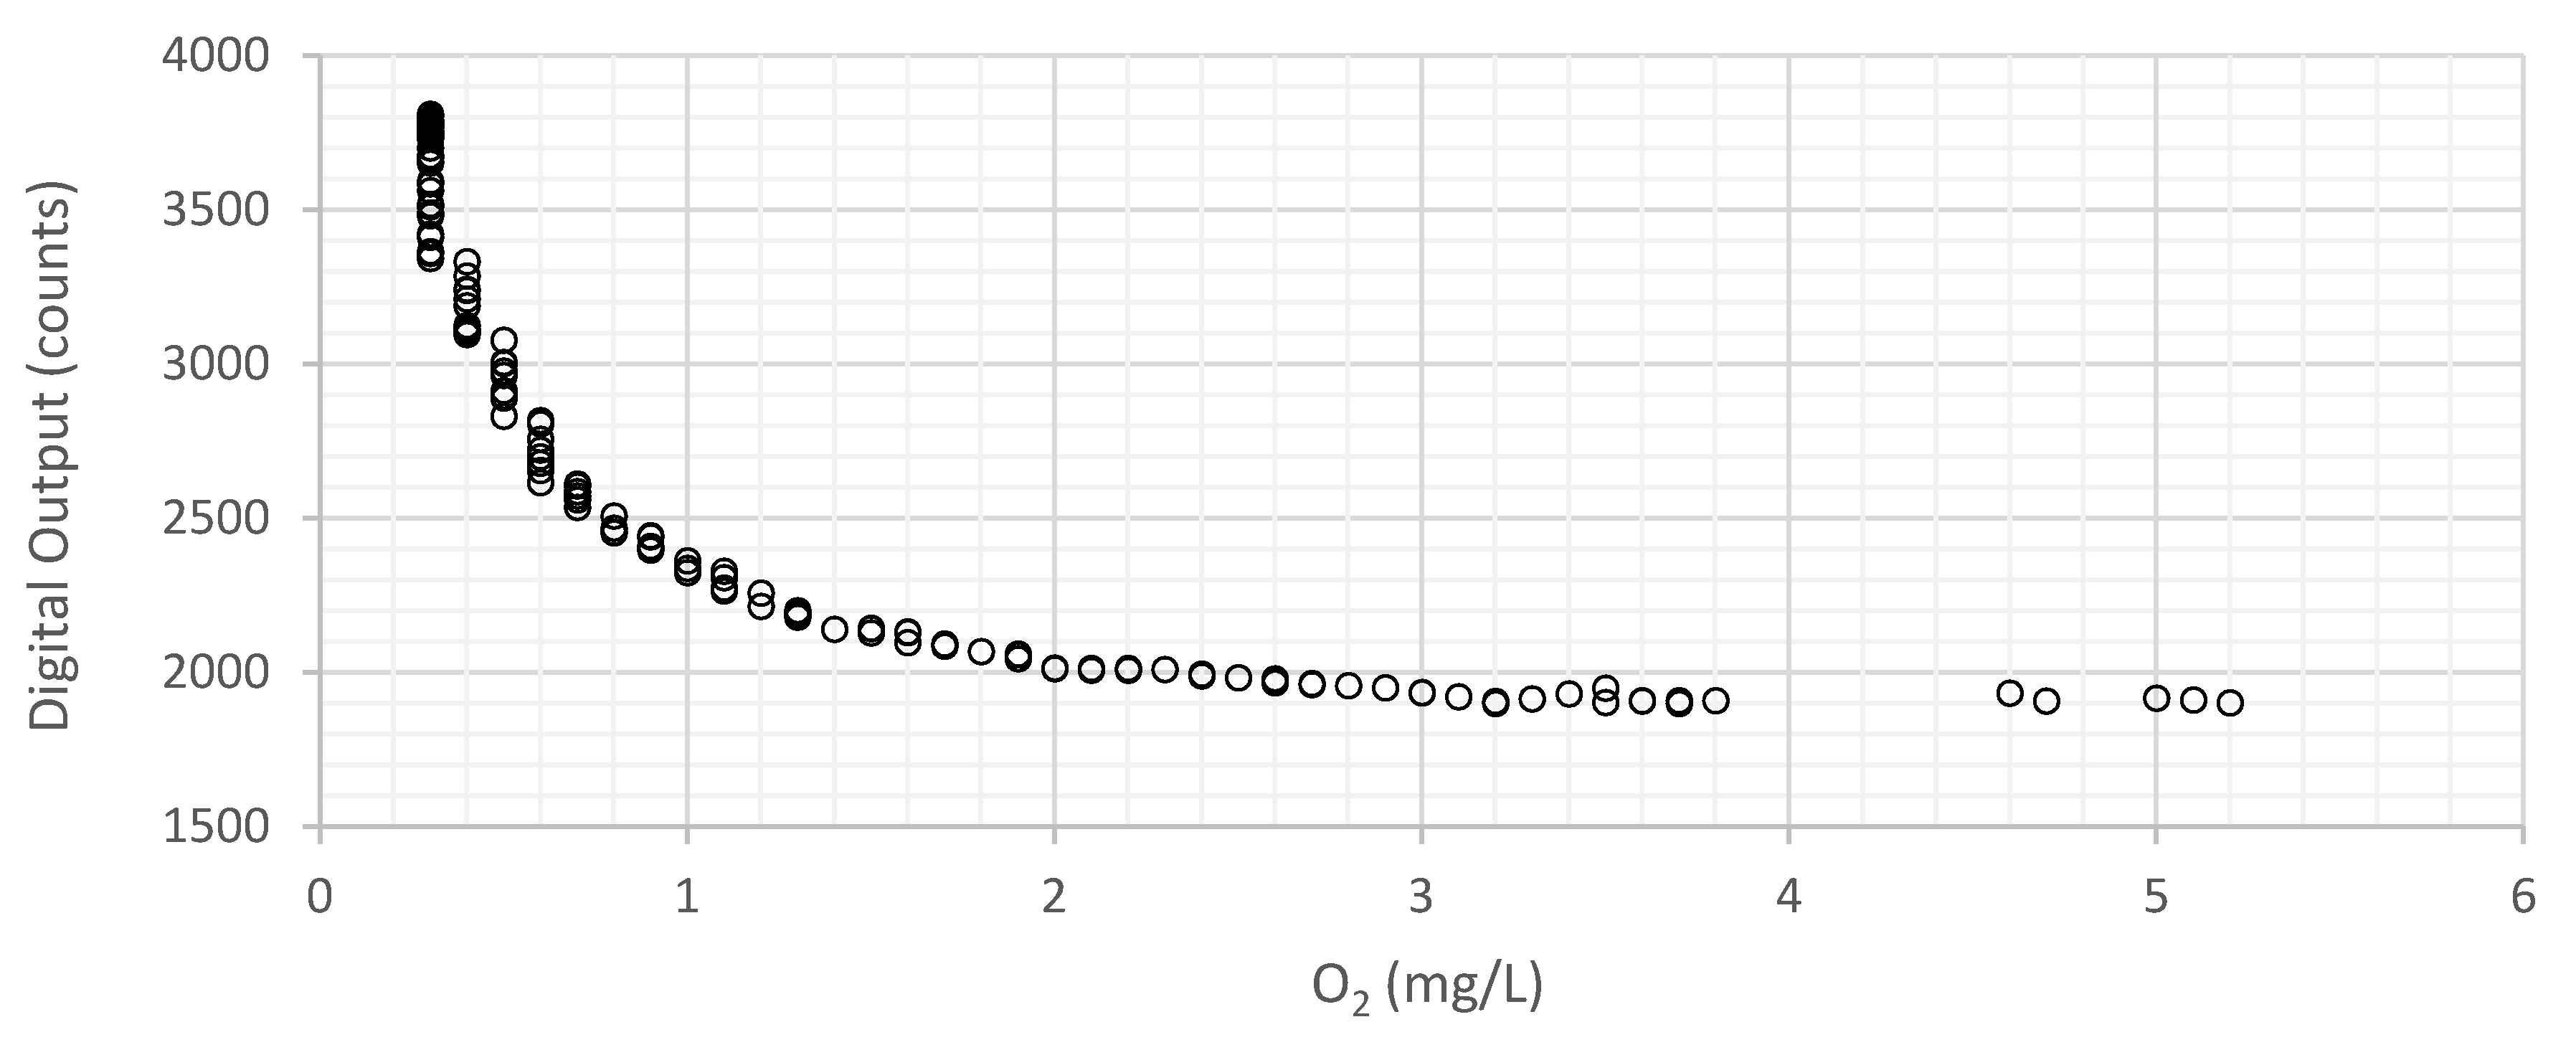
Figure 12 represents the digital values obtained by the microcontroller through its ADC, as a function of dissolved oxygen.
The voltage values were acquired with the 12-bit ADC of the microcontroller (see details on
Section 2.2). The ADC uses 12 bits of resolution and a reference (maximum) voltage of 3 V, so its resolution can be calculated in terms of voltage by Equation (6).
Considering the maximum (3809) and minimum digital values (1936) in the graph of
Figure 13, that correspond, respectively, to 3 mg/L and 0.3 mg/L, the mean sensitivity can be calculated by Equation (7).
However, for lower oxygen concentration, a lower value of RO2 is observed, and for higher oxygen concentration (when the sensor approaches the end of the scale), a higher value of RO2 is observed, respectively, 0.48 µg/L and 13 µg/L in the ranges 0.3–1 mg/L and 2–3 mg/L. Electronic noise and external interferences limit the maximum range of the sensor, since luminescence decreases with a higher concentration of oxygen.
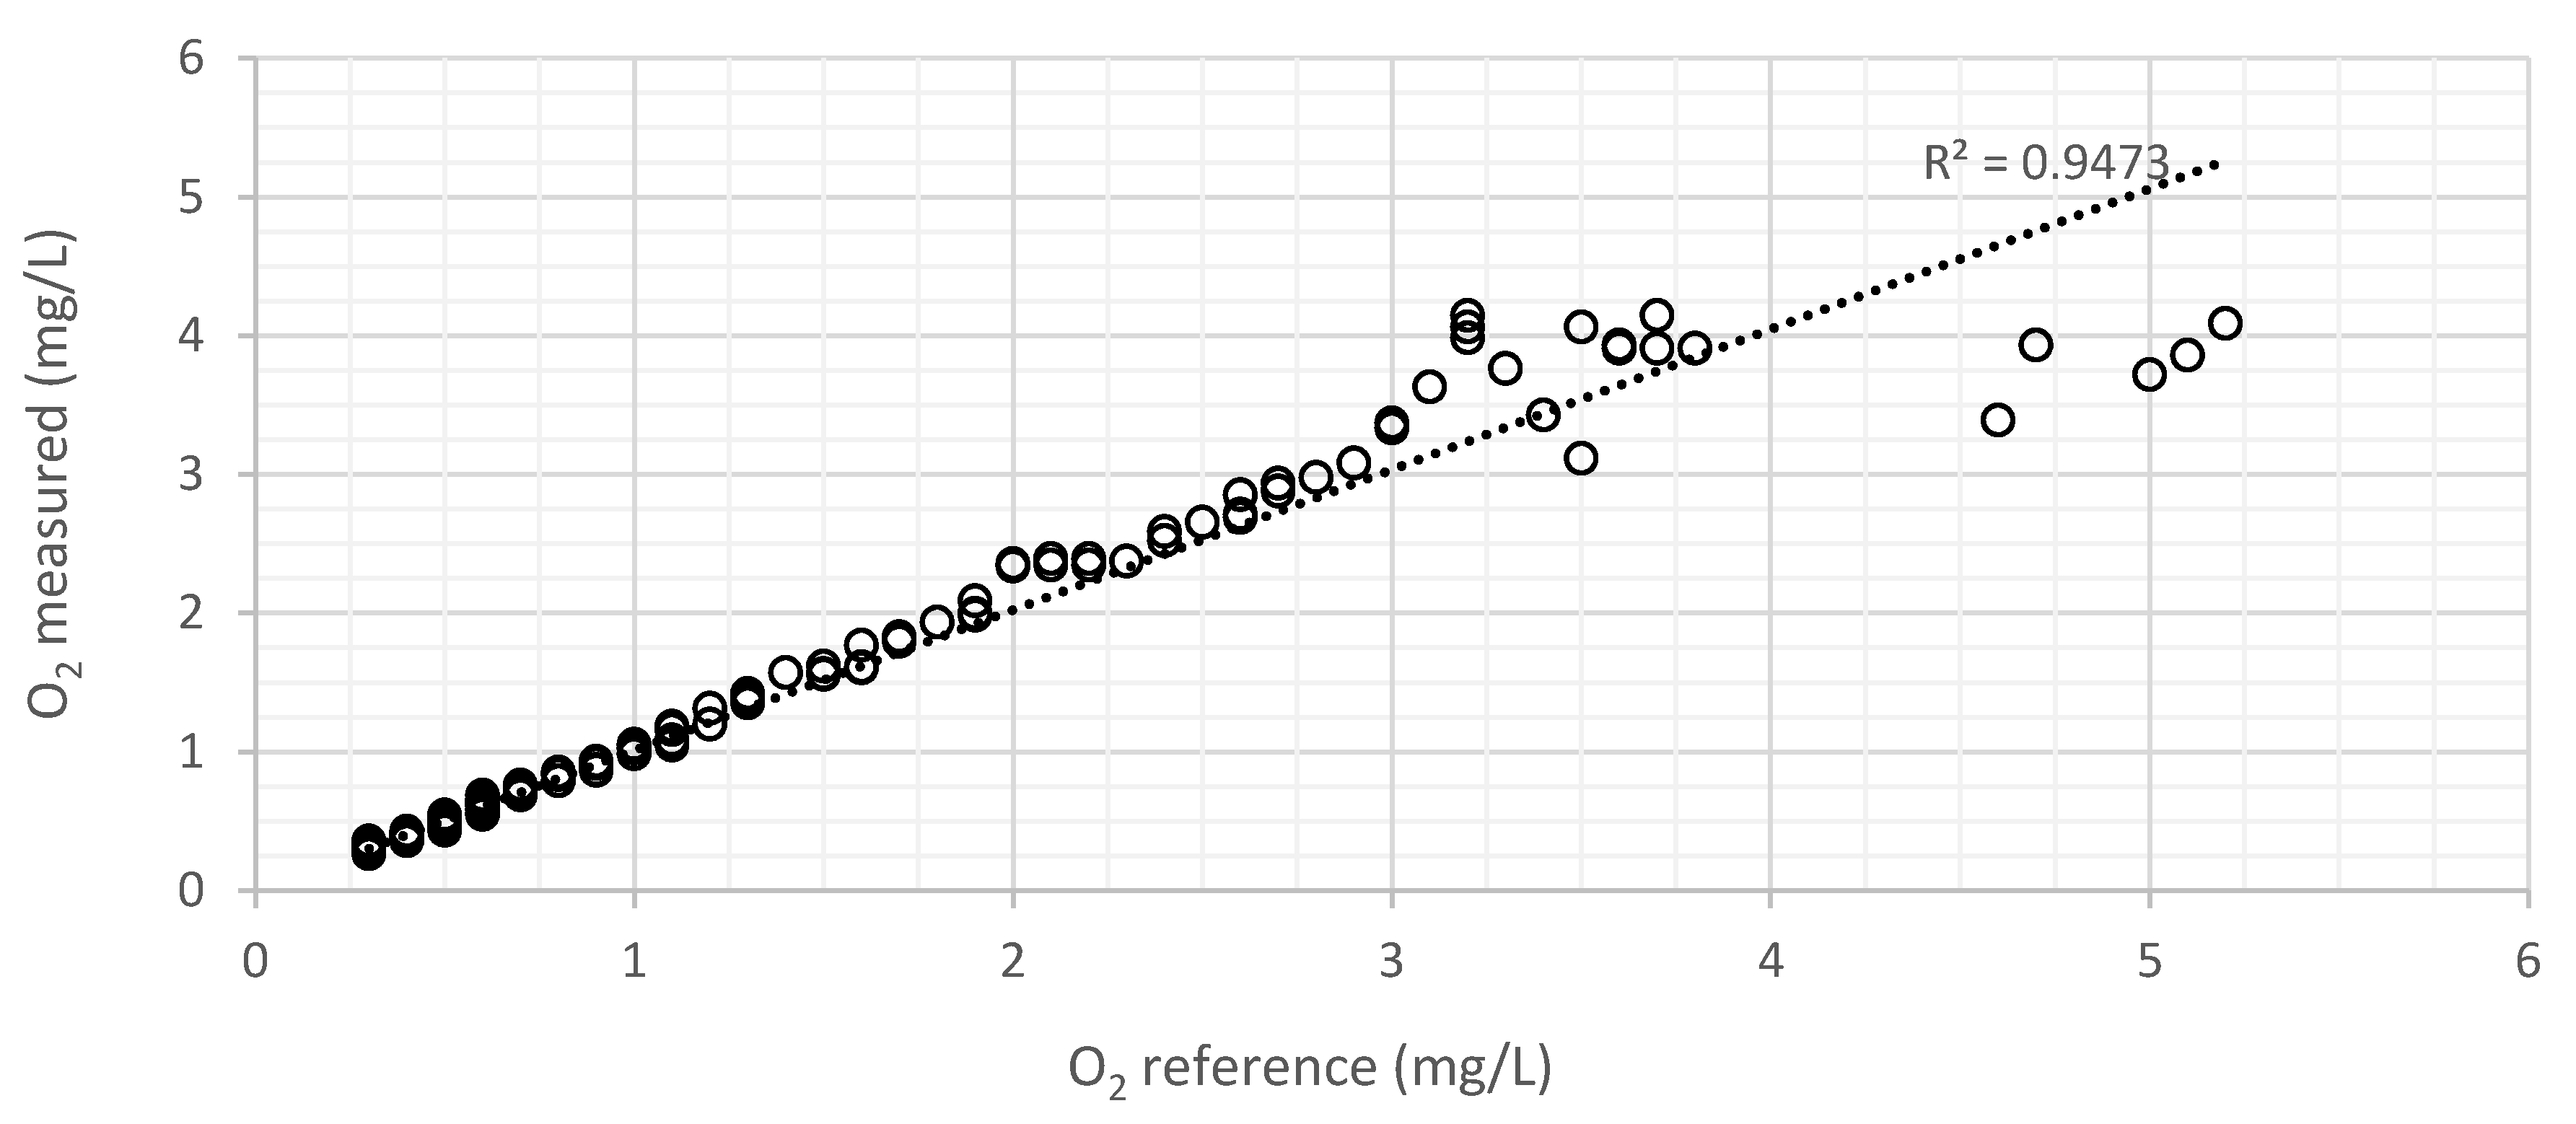
Figure 13 represents the variation of the DO values measured by the developed sensor and by the commercial sensor. The sensor response is compensated digitally to achieve a correct output in mg/L. The dashed line represents the ideal theoretical results. There is an almost inverse linear tend relationship between the current/voltage and the concentration of dissolved oxygen, as depicted by the Stern–Volmer relationship. From 3.5 mg/L it is possible to detect noise resulting from the approach to the end of the scale (where the current in the photodiode is reduced).
An accelerated test of photo degradation was also performed. The selected membrane was submersed in sweater, and illuminated for 7 h, with the selected UV-385 nm LED with a current of 20 mA and a duty cycle of 20% (200 µs ON and 800 µs OFF) corresponding to 1.4 h of continuous illumination. After this test, the membrane showed a reduction of 2% of luminescence when compared with the luminescence before the degradation test.
Since a measurement of oxygen requires a light pulse of the UV LED with a period below 1 ms, these stability results announce that for a degradation up to 2%, more than 5 million measurements can be performed, thus allowing a reasonable lifetime of the membrane, even if a 1-min sampling time of the measurements is required.
4. Conclusions
Luminescent PDMS membranes (sensitive to the presence of oxygen) and controlling/acquiring electronics were developed to achieve an optical DO sensor to be used in a marine environment, with a measuring range between 0 and 5 mg/L in liquid medium. It was possible to manufacture oxygen-sensitive membranes from simple fabrication procedures, compatible with standard processes of microfluidics, without the need for complex laboratory equipment.
The developed membranes were based on PDMS doped with the PtOEP indicator, which present a luminescent behavior as described by the Stern–Volmer equation through the luminescence intensity ratio method. A maximum light absorption was verified at 385 nm, and a maximum luminescence at 640 nm, as found in the literature.
It was possible to observe differences between the solvents used in the fabrication processes, concluding that the use of THF can result in membranes with a more linear response to oxygen than toluene. The influence of indicator concentration (181 ppm to 727 ppm) and membrane thickness (0.1 mm to 1.9 mm) was reported, with best results (higher luminescence, higher linearity and higher range) found in thick membranes, with moderate doping. The membrane with 363 ppm of indicator and 1.4 mm thickness, using THF solvent, was selected for further tests.
The sensor was tested in liquid medium and in a gaseous environment, achieving a O2 measurement range of 0–5.5 mg/L and 0–21%, respectively. However, due to noise in electronics above the limit of detection in luminescence intensity, only the range of 0–3.3 mg/L in liquid medium and 0.5–20% in gaseous medium can be usable. The sensitivity (with a common 12 bits microcontroller ADC) varies from 0.48 µg/L to 13 µg/L, respectively, in the ranges 0.3–1 mg/L and 2–3 mg/L.
Since luminescence increases with lower oxygen concentration, the limit of detection of the fabricated PDMS membrane is clearly higher than the limit of detection of the electrode-based commercial sensor (Extech DO210), concluding that the PDMS luminescence intensity measurement method is clearly advantageous to oxygen electrode-based sensors for applications where high sensitivity is required at low oxygen levels (below 3 mg/L).
Author Contributions
C.M.P.: conceptualization, methodology, software, hardware, validation, investigation, data analysis, writing original draft preparation, sensor structural housing and 3D printing; L.M.G.: conceptualization, electronic supervision and review and editing; M.M.S.: laboratory supervision, chemical review and editing; J.L.R.: software support; V.C.P. and P.J.S.: laboratory supervision. M.S.M.: review and editing; G.M.: review and editing. All authors have read and agreed to the published version of the manuscript.
Funding
This work was co-financed by national funds through FCT—Fundação para a Ciência e Tecnologia, I.P. under project SONDA (PTDC/EME-SIS/1960/2020), by Programa Operacional Regional do Norte (NORTE2020), through Fundo Europeu de Desenvolvimento Regional (FEDER), Project NORTE-01-0145-FEDER-000032—NextSea, by the European Regional Development Fund (ERDF) through INTERREG V-A Spain-Portugal Programme (POCTEP) 2014–2020, Project N. 0591_FOODSENS_1_E and by FCT national funds, under the national support to R&D units grants, through the reference projects UIDB/04436/2020 and UIDP/04436/2020.
Institutional Review Board Statement
Not applicable.
Informed Consent Statement
Not applicable.
Data Availability Statement
Not applicable.
Conflicts of Interest
The authors declare no conflict of interest.
References
- Helm, I.; Karina, G.; Jalukse, L.; Pagano, T.; Leito, I. Comparative validation of amperometric and optical analyzers of dissolved oxygen: A case study. Environ. Monit. Assess. 2018, 190, 313. [Google Scholar] [CrossRef] [PubMed]
- Klimant, I.; Kühl, M.; Glud, R.N.; Holst, G. Optical measurement of oxygen and temperature in microscale: Strategies and biological applications. Sens. Actuators B Chem. 1997, 38, 29–37. [Google Scholar] [CrossRef]
- Ferreira, M.A.C. Development of Dissolved Oxygen Sensors Using Electrochemical and Optic Methods for Real Time Monitoring of Water Quality. 2008. Available online: http://www.teses.usp.br/teses/disponiveis/3/3140/tde-08012008-161104/ (accessed on 15 January 2021).
- Basu, B.J. Optical oxygen sensing based on luminescence quenching of platinum porphyrin dyes doped in ormosil coatings. Sens. Actuators B Chem. 2007, 123, 568–577. [Google Scholar] [CrossRef]
- Gehlen, M.H. The centenary of the Stern-Volmer equation of fluorescence quenching: From the single line plot to the SV quenching map. J. Photochem. Photobiol. C Photochem. Rev. 2020, 42, 100338. [Google Scholar] [CrossRef]
- Carraway, E.R.; Demas, J.N.; DeGraff, B.A. Luminescence quenching mechanism for microheterogeneous systems. Anal. Chem. 1991, 63, 332–336. [Google Scholar] [CrossRef]
- Quaranta, M.; Borisov, S.M.; Klimant, I. Indicators for optical oxygen sensors. Bioanal. Rev. 2012, 4, 115–157. [Google Scholar] [CrossRef] [PubMed] [Green Version]
- Koren, K.; Borisov, S.M.; Saf, R.; Klimant, I. Strongly phosphorescent iridium(III)-porphyrins—New oxygen indicators with tuneable photophysical properties and functionalities. Eur. J. Inorg. Chem. 2011, 2011, 1531–1534. [Google Scholar] [CrossRef] [PubMed] [Green Version]
- Puklin, E.; Carlson, B.; Gouin, S.; Costin, C.; Green, E.; Ponomarev, S.; Tanji, H.; Gouterman, M. Ideality of pressure-sensitive paint. I. Platinum tetra(pentafluorophenyl)porphine in fluoroacrylic polymer. J. Appl. Polym. Sci. 2000, 77, 2795–2804. [Google Scholar] [CrossRef]
- Amao, Y.; Asai, K.; Miyashita, T.; Okura, I. Novel optical oxygen sensing material: Platinum porphyrin-fluoropolymer film. Polym. Adv. Technol. 2000, 11, 705–709. [Google Scholar] [CrossRef]
- Douglas, P.; Eaton, K. Response characteristics of thin film oxygen sensors, Pt and Pd octaethylporphyrins in polymer films. Sens. Actuators B Chem. 2002, 82, 200–208. [Google Scholar] [CrossRef]
- Amao, Y.; Miyashita, T.; Okura, I. Optical oxygen sensing based on the luminescence change of metalloporphyrins immobilized in styrene-pentafluorostyrene copolymer film. Analyst 2000, 125, 871–875. [Google Scholar] [CrossRef]
- Lu, X.; Manners, I.; Winnik, M.A. Polymer/silica composite films as luminescent oxygen sensors. Macromolecules 2001, 34, 1917–1927. [Google Scholar] [CrossRef]
- Amao, Y.; Asai, K.; Okura, I.; Shinohara, H.; Nishide, H. Platinum porphyrin embedded in poly(1-trimethylsilyl-1-propyne) film as an optical sensor for trace analysis of oxygen. Analyst 2000, 125, 1911–1914. [Google Scholar] [CrossRef]
- Lai, S.-W.; Hou, Y.-J.; Che, C.-M.; Pang, H.-L.; Wong, K.-Y.; Chang, C.K.; Zhu, N. Electronic spectroscopy, photophysical properties, and emission quenching studies of an oxidatively robust perfluorinated platinum porphyrin. Inorg. Chem. 2004, 43, 3724–3732. [Google Scholar] [CrossRef] [PubMed]
- Amao, Y.; Okura, I. Optical oxygen sensor devices using metalloporphyrins. J. Porphyr. Phthalocyanines 2009, 13, 1111–1122. [Google Scholar] [CrossRef]
- Nagai, K.; Higuchi, A.; Nakagawa, T. Gas permeability and stability of poly(1-trimethylsilyl-1-propyne-co-1-phenyl-1-propyne) membranes. J. Polym. Sci. Part B Polym. Phys. 1995, 33, 289–298. [Google Scholar] [CrossRef]
- Brandrup, J.; Immergut, E.H.; Grulke, E.A. Polymer Handbook, 4th ed.; Wiley-Interscience Publication: Hoboken, NJ, USA, 1999. [Google Scholar]
- Cai, D.; Neyer, A.; Kuckuk, R.; Heise, H.M. Raman, mid-infrared, near-infrared and ultraviolet-visible spectroscopy of PDMS silicone rubber for characterization of polymer optical waveguide materials. J. Mol. Struct. 2010, 976, 274–281. [Google Scholar] [CrossRef]
- Lei, B.; Li, B.; Zhang, H.; Lu, S.; Zheng, Z.; Li, W.; Wang, Y. Mesostructured Silica Chemically Doped with RuII as a Superior Optical Oxygen Sensor. Adv. Funct. Mater. 2006, 16, 1883–1891. [Google Scholar] [CrossRef]
Figure 1.
Diagram of a typical dissolved oxygen optical sensor.
Figure 1.
Diagram of a typical dissolved oxygen optical sensor.
Figure 2.
Schematic representation of the main components and encapsulation of the oxygen sensor.
Figure 2.
Schematic representation of the main components and encapsulation of the oxygen sensor.
Figure 3.
Photograph of the fabricated device.
Figure 3.
Photograph of the fabricated device.
Figure 4.
Brief description of hardware blocks.
Figure 4.
Brief description of hardware blocks.
Figure 5.
Constant current sink used to feed the excitation LED.
Figure 5.
Constant current sink used to feed the excitation LED.
Figure 6.
The signal condition circuit, composed of the transimpedance amplifier, a low-pass first order filter, and a second amplifier stage.
Figure 6.
The signal condition circuit, composed of the transimpedance amplifier, a low-pass first order filter, and a second amplifier stage.
Figure 7.
Typical absorption of PtOEP for different concentrations with similar thicknesses, namely 0.2 mm for the membranes of 363 ppm and 545 ppm of concentration and 0.15 mm for the membrane of 727 ppm of concentration.
Figure 7.
Typical absorption of PtOEP for different concentrations with similar thicknesses, namely 0.2 mm for the membranes of 363 ppm and 545 ppm of concentration and 0.15 mm for the membrane of 727 ppm of concentration.
Figure 8.
Relationship between absorption and thickness, for membranes manufactured using the solvent toluene and THF, with indicator concentrations of from 181 ppm to 727 ppm.
Figure 8.
Relationship between absorption and thickness, for membranes manufactured using the solvent toluene and THF, with indicator concentrations of from 181 ppm to 727 ppm.
Figure 9.
Luminescence spectrum of THF and toluene-based membranes with a concentration of 363 ppm, for thin and thick membranes, respectively, 0.15–0.20 mm and 1.24–1.4 mm. Each line in the graphs was obtained with different oxygen concentration (gaseous media) with oxygen concentration of 0.6%, 1.3% and 2%.
Figure 10.
Phase shift of the sensor signal as a function of oxygen variation, for the 363 ppm concentration membrane with a thickness of 1.4 mm and THF in a gaseous environment.
Figure 10.
Phase shift of the sensor signal as a function of oxygen variation, for the 363 ppm concentration membrane with a thickness of 1.4 mm and THF in a gaseous environment.
Figure 11.
Inverse of the current intensity along the increase in oxygen concentration, in a gaseous environment, for the 363 ppm membrane with a thickness of 1.4 mm and THF. The 4.3 nA offset has been removed, and the inverse of the photodiode current is shown.
Figure 11.
Inverse of the current intensity along the increase in oxygen concentration, in a gaseous environment, for the 363 ppm membrane with a thickness of 1.4 mm and THF. The 4.3 nA offset has been removed, and the inverse of the photodiode current is shown.
Figure 12.
ADC values as a function of oxygen concentration for the membrane with 363 ppm of indicator with a thickness of 1.4 mm, manufactured with THF, in a liquid environment.
Figure 12.
ADC values as a function of oxygen concentration for the membrane with 363 ppm of indicator with a thickness of 1.4 mm, manufactured with THF, in a liquid environment.
Figure 13.
Variation of the DO values measured by the developed sensor as a function of the reference DO values (measured with the commercial sensor) for the membrane with a concentration of 363 ppm with 1.4 mm and manufactured with THF, in a liquid environment, obtained with the Stern–Volmer equation (Equation (1)).
Table 1.
Polymer proprieties (permeability, diffusion, and solubility).
Table 1.
Polymer proprieties (permeability, diffusion, and solubility).
| Polymer |
| |
| Ref. |
|---|
PDMS
Poly(dimethylsiloxane) | 695 | 40 | 24 | [18] |
PMSP
Poly(1-trimethylsily-1-propyne) | 7700 | 47 | 170 | [17] |
PS
Polystyrene | 2.63 | -- | -- | [19] |
| PMMA Poly(methylmethacrylate) | 9 | 10 | 8.5 | [18] |
PVC
Poly(vinyl chloride) | 0.34 | 1.2 | 2.9 | [18] |
| PiBMA Poly(isobutylmethacrylate) | 20 | -- | -- | [18] |
| Poly(2,2,2-trifluoroethylmethacrylate) | 32 | 15 | 0.27 | [16] |
EC
Ethylcellulose | 11 | 0.639 | 1.73 | [18] |
CAB
Cellulose acetibutyrate | 3.56 | -- | -- | [18] |
CA
Cellulose acetate | 5.85 | -- | -- | [18] |
Table 2.
Characterization of membranes.
Table 2.
Characterization of membranes.
| Solvent | Indicator Concentration (ppm) | Thickness (mm) | Maximum Intensity (Counts) | Linearity | Range
(%O2) |
|---|
| Toluene | | 0.15 | 566 | Linear | 0.4–3% |
| 1.25 | 10,084 | Non-linear | 0.4–15% |
| 0.15 | 282 | Linear | 0.4–4.5% |
| 1.2 | 6008 | Linear | 0.4–14% |
| 0.15 | 4444 | Linear | 0.4–4% |
| 1.15 | 6641 | Non-linear | 0.4–10% |
| THF | | 0.2 | 787 | Non-linear | 0.4–3% |
| 1.4 | 4689 | Aprox. linear | 0.4–21% |
| 0.2 | 715 | Non-linear | 0.4–4% |
| 1.4 | 4414 | Non-linear | 0.4–12% |
| 0.15 | 576 | Non-linear | 0.4–2.9% |
| 1.15 | 760 | Non-linear | 0.4–18% |
| Publisher’s Note: MDPI stays neutral with regard to jurisdictional claims in published maps and institutional affiliations. |
© 2021 by the authors. Licensee MDPI, Basel, Switzerland. This article is an open access article distributed under the terms and conditions of the Creative Commons Attribution (CC BY) license (https://creativecommons.org/licenses/by/4.0/).


 ,
, 


