
IoT and Interpretable Machine Learning Based Framework for Disease Prediction in Pearl Millet


 , and
, and
Abstract
:1. Introduction
- Highlighting the need to automate the detection of diseases in the underexplored crop ‘pearl millet’.
- Automatic collection of the real-time datasets by the IoT system fixed at the farmlands of pearl millet.
- Developing the IoT and deep transfer learning-based framework for detection and classification of diseases in pearl millet.
- Presenting the comparative analysis of the proposed framework and the systems available in the literature to detect and classify plant diseases.
2. Related Works
3. Materials and Methods
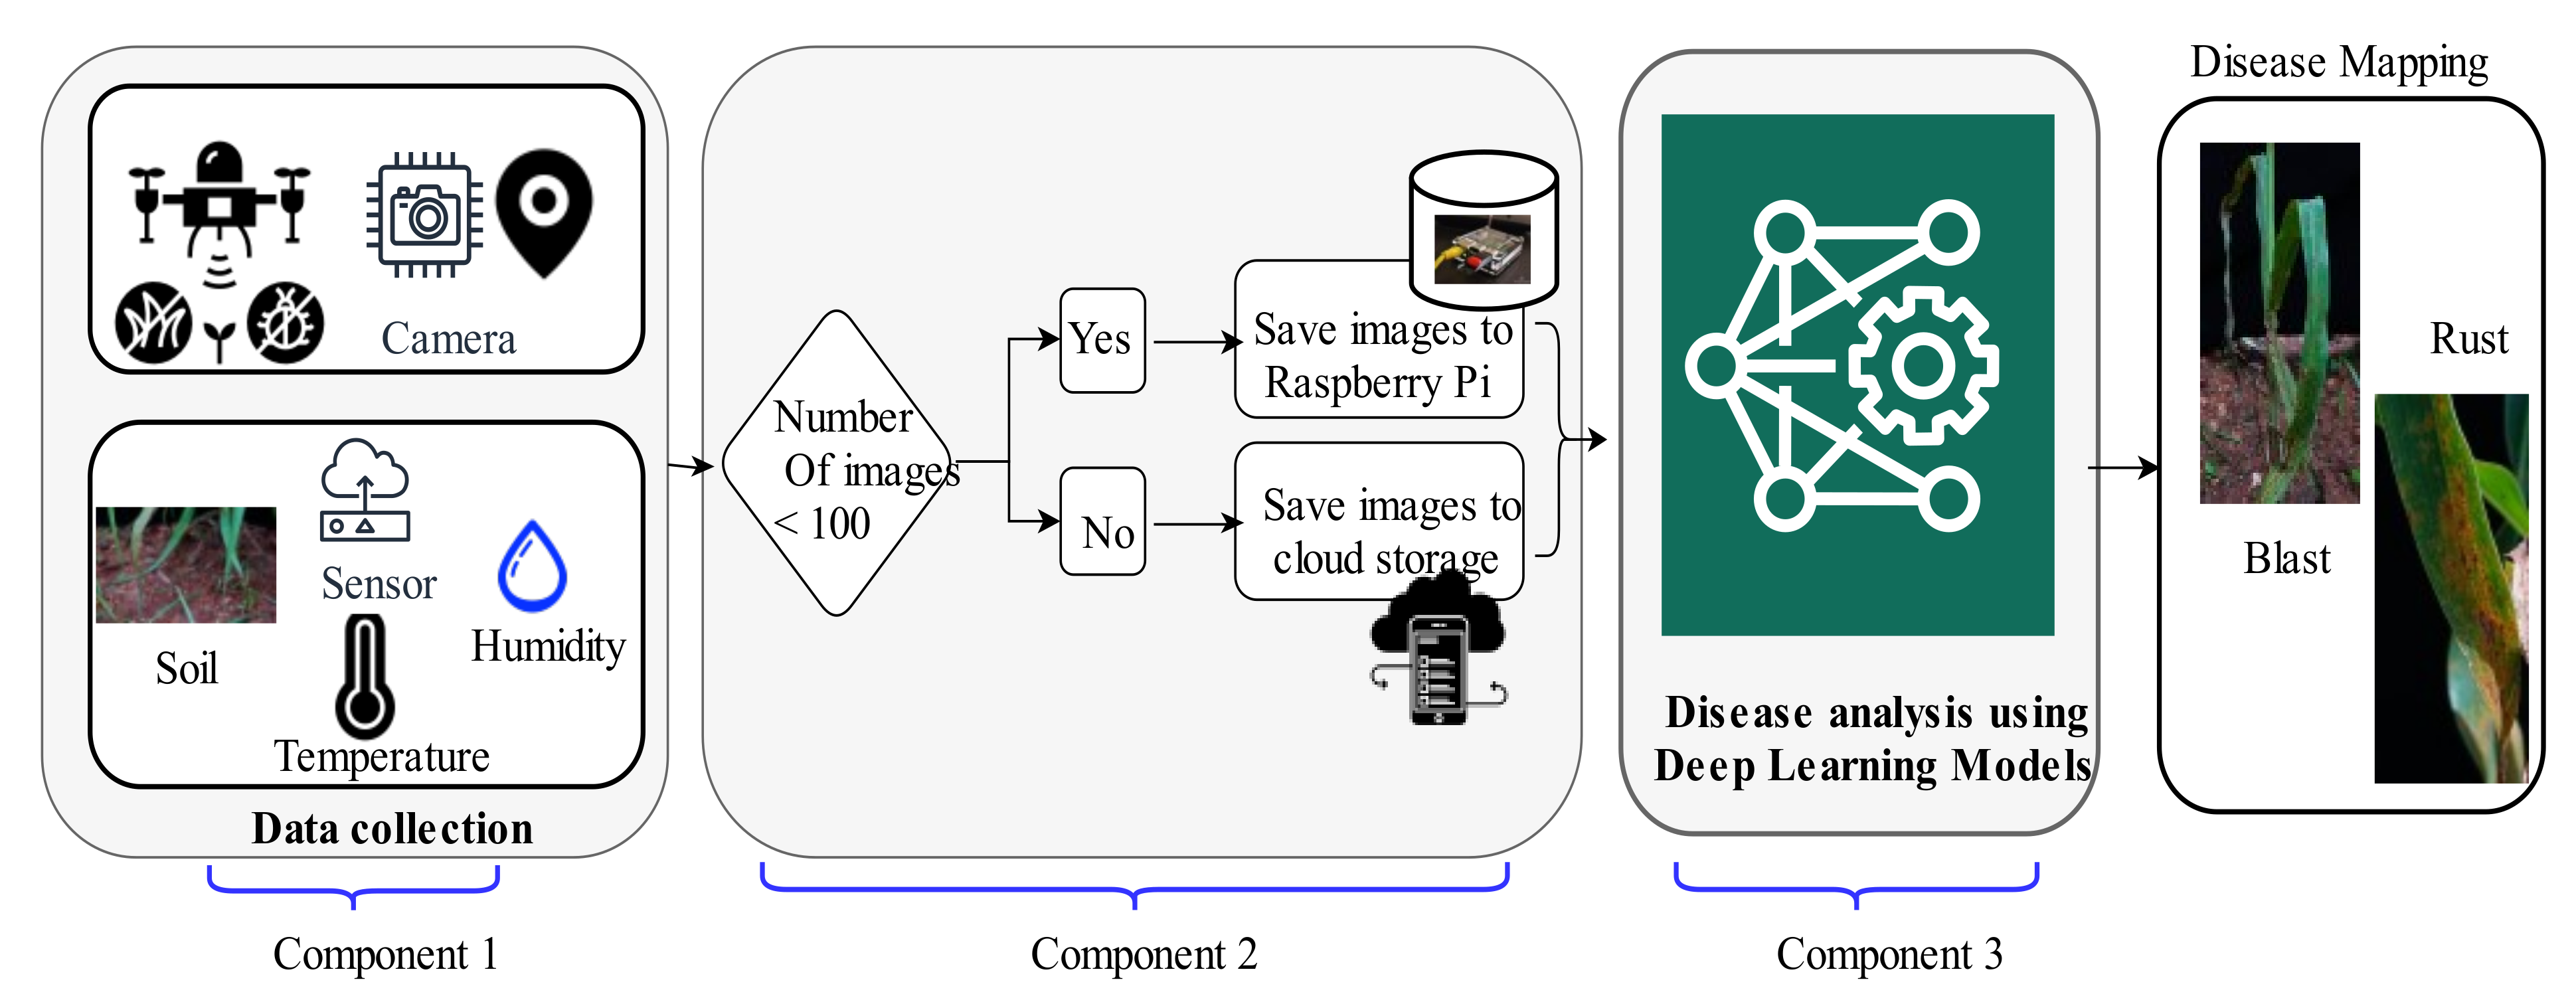
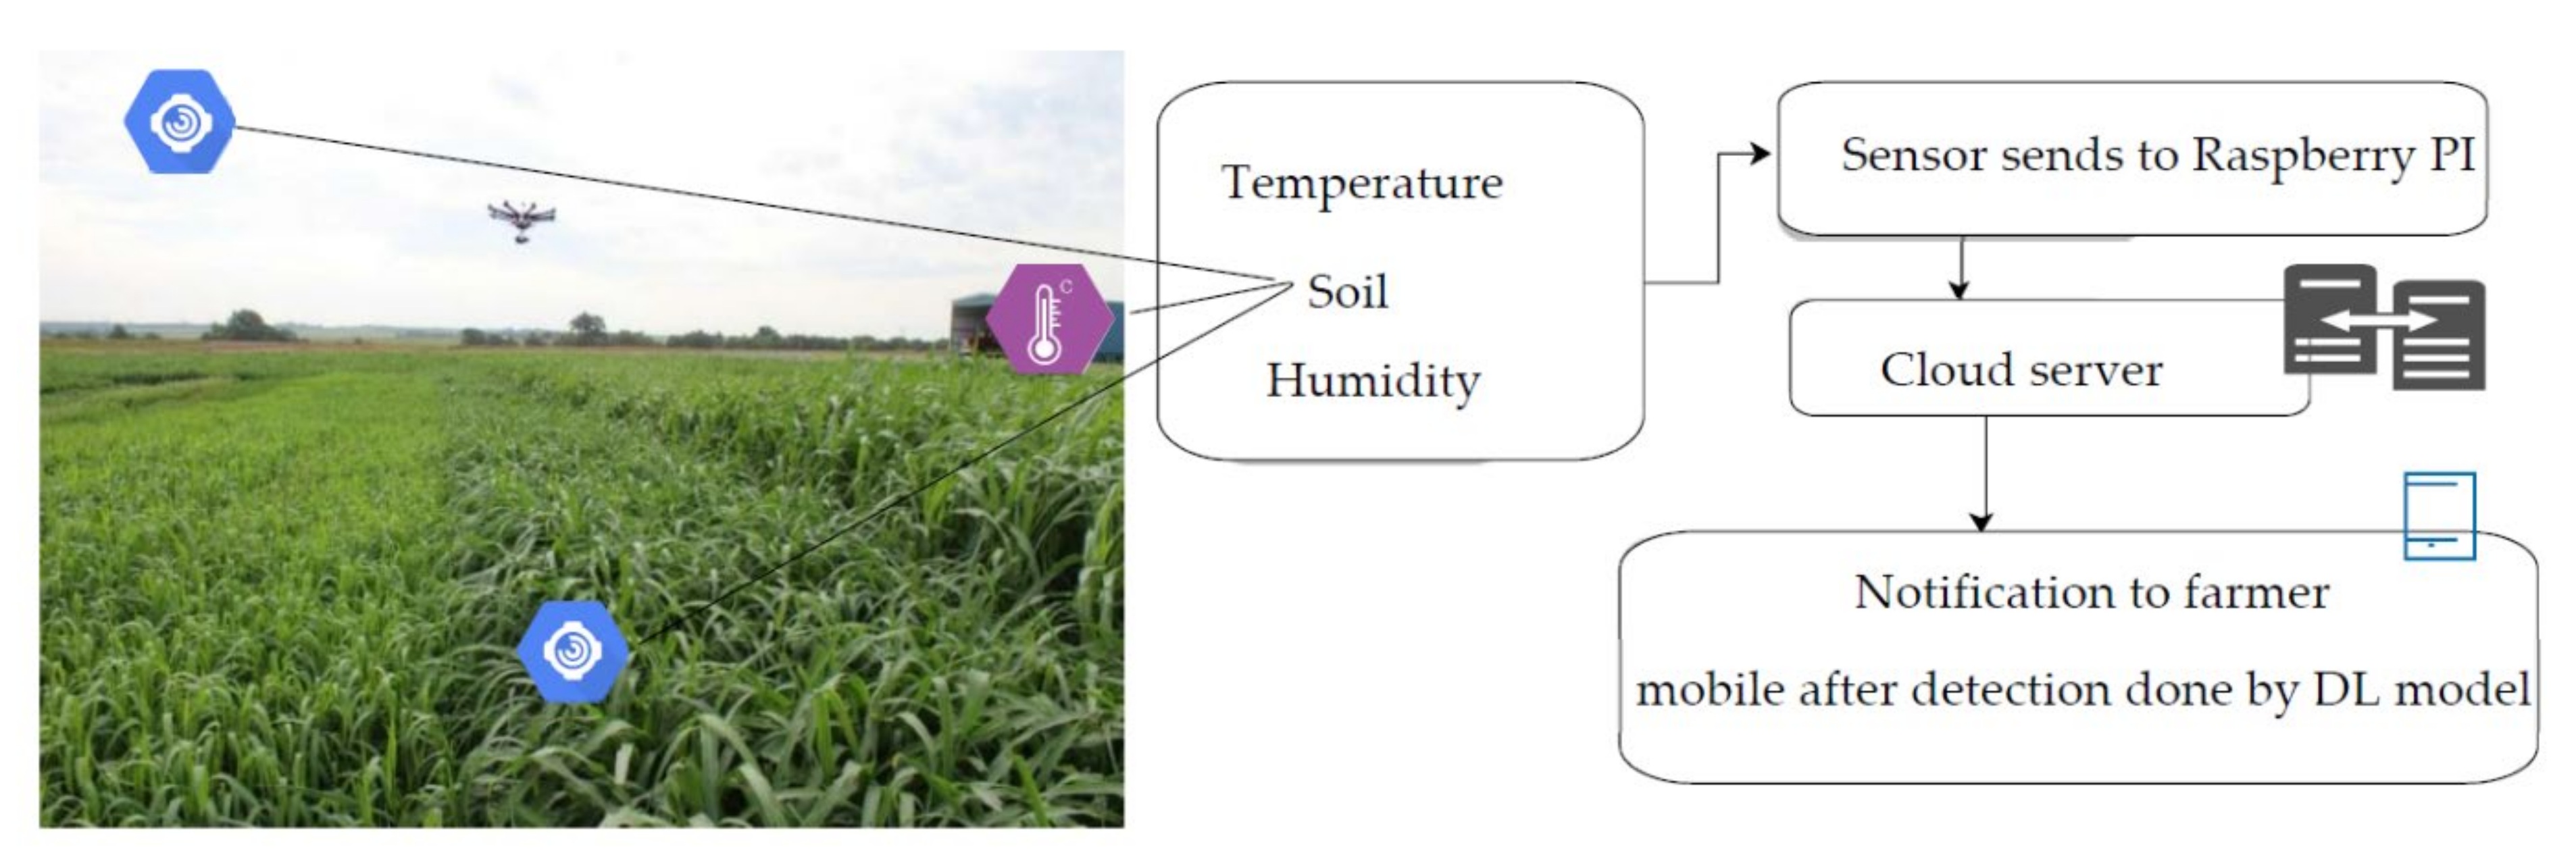
3.1. Proposed Framework
3.2. Dataset Preparation
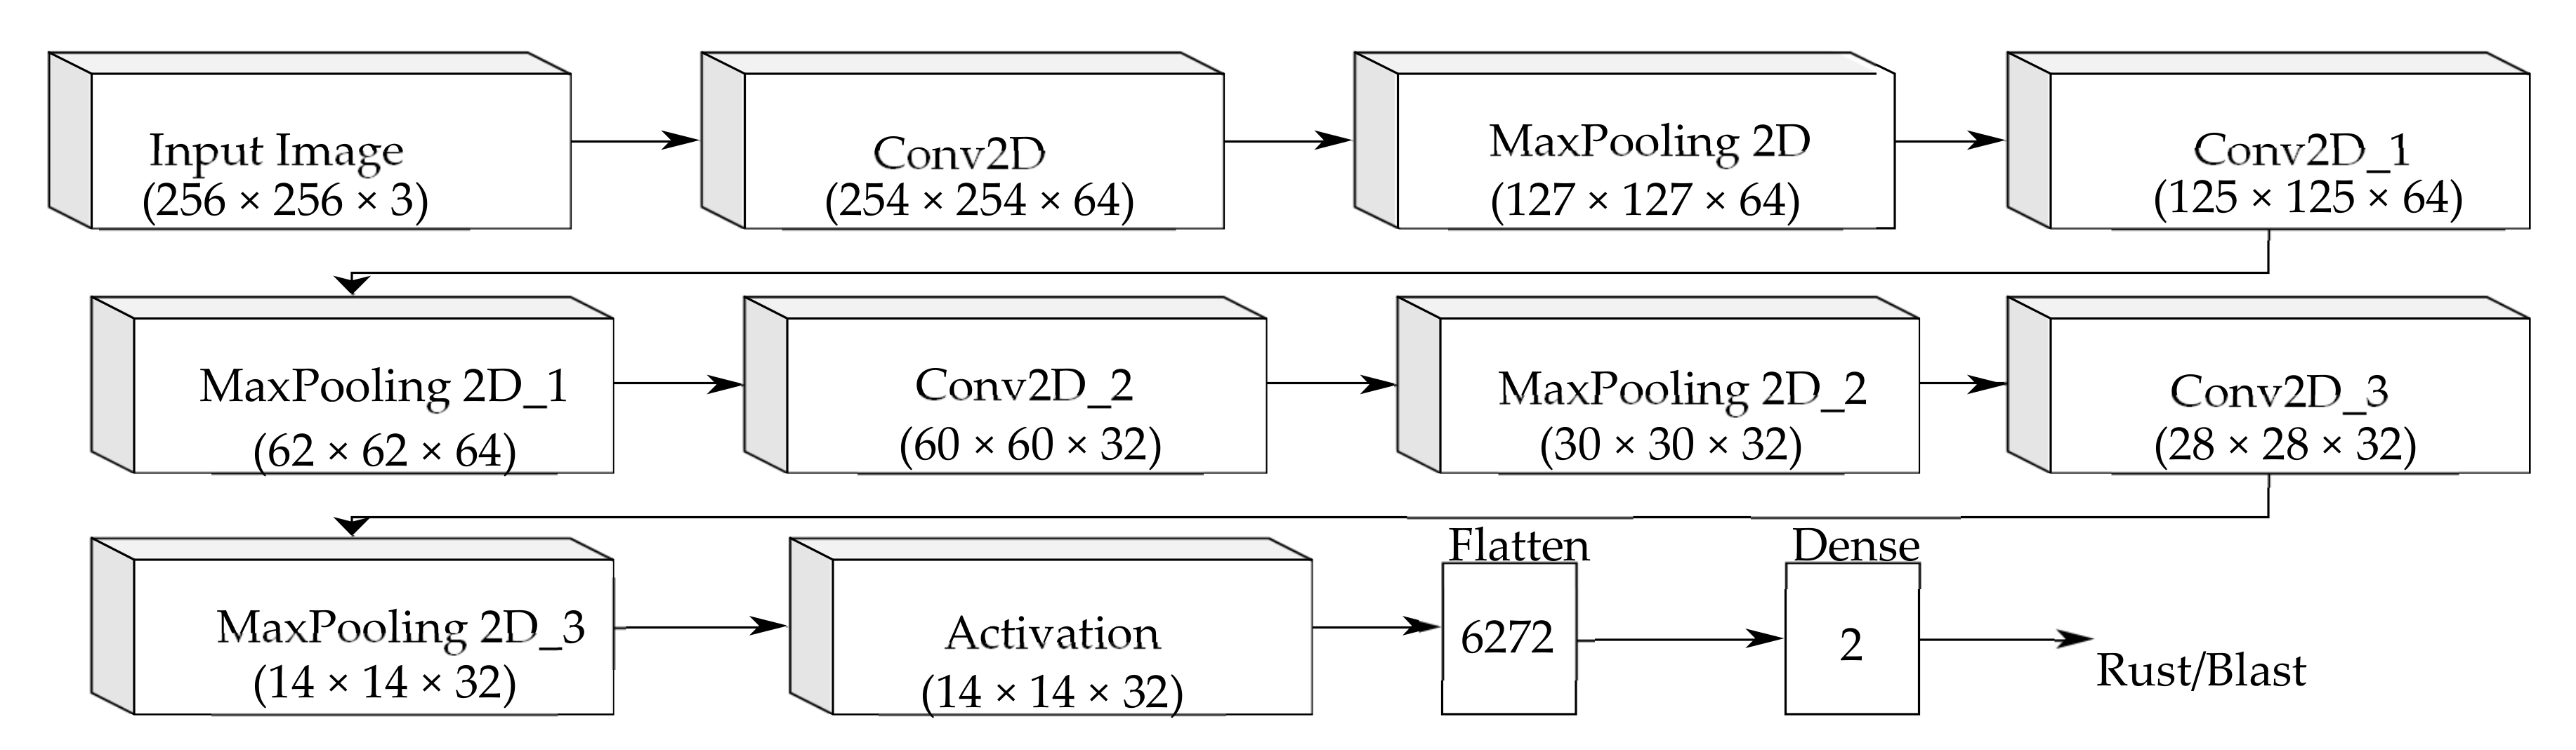
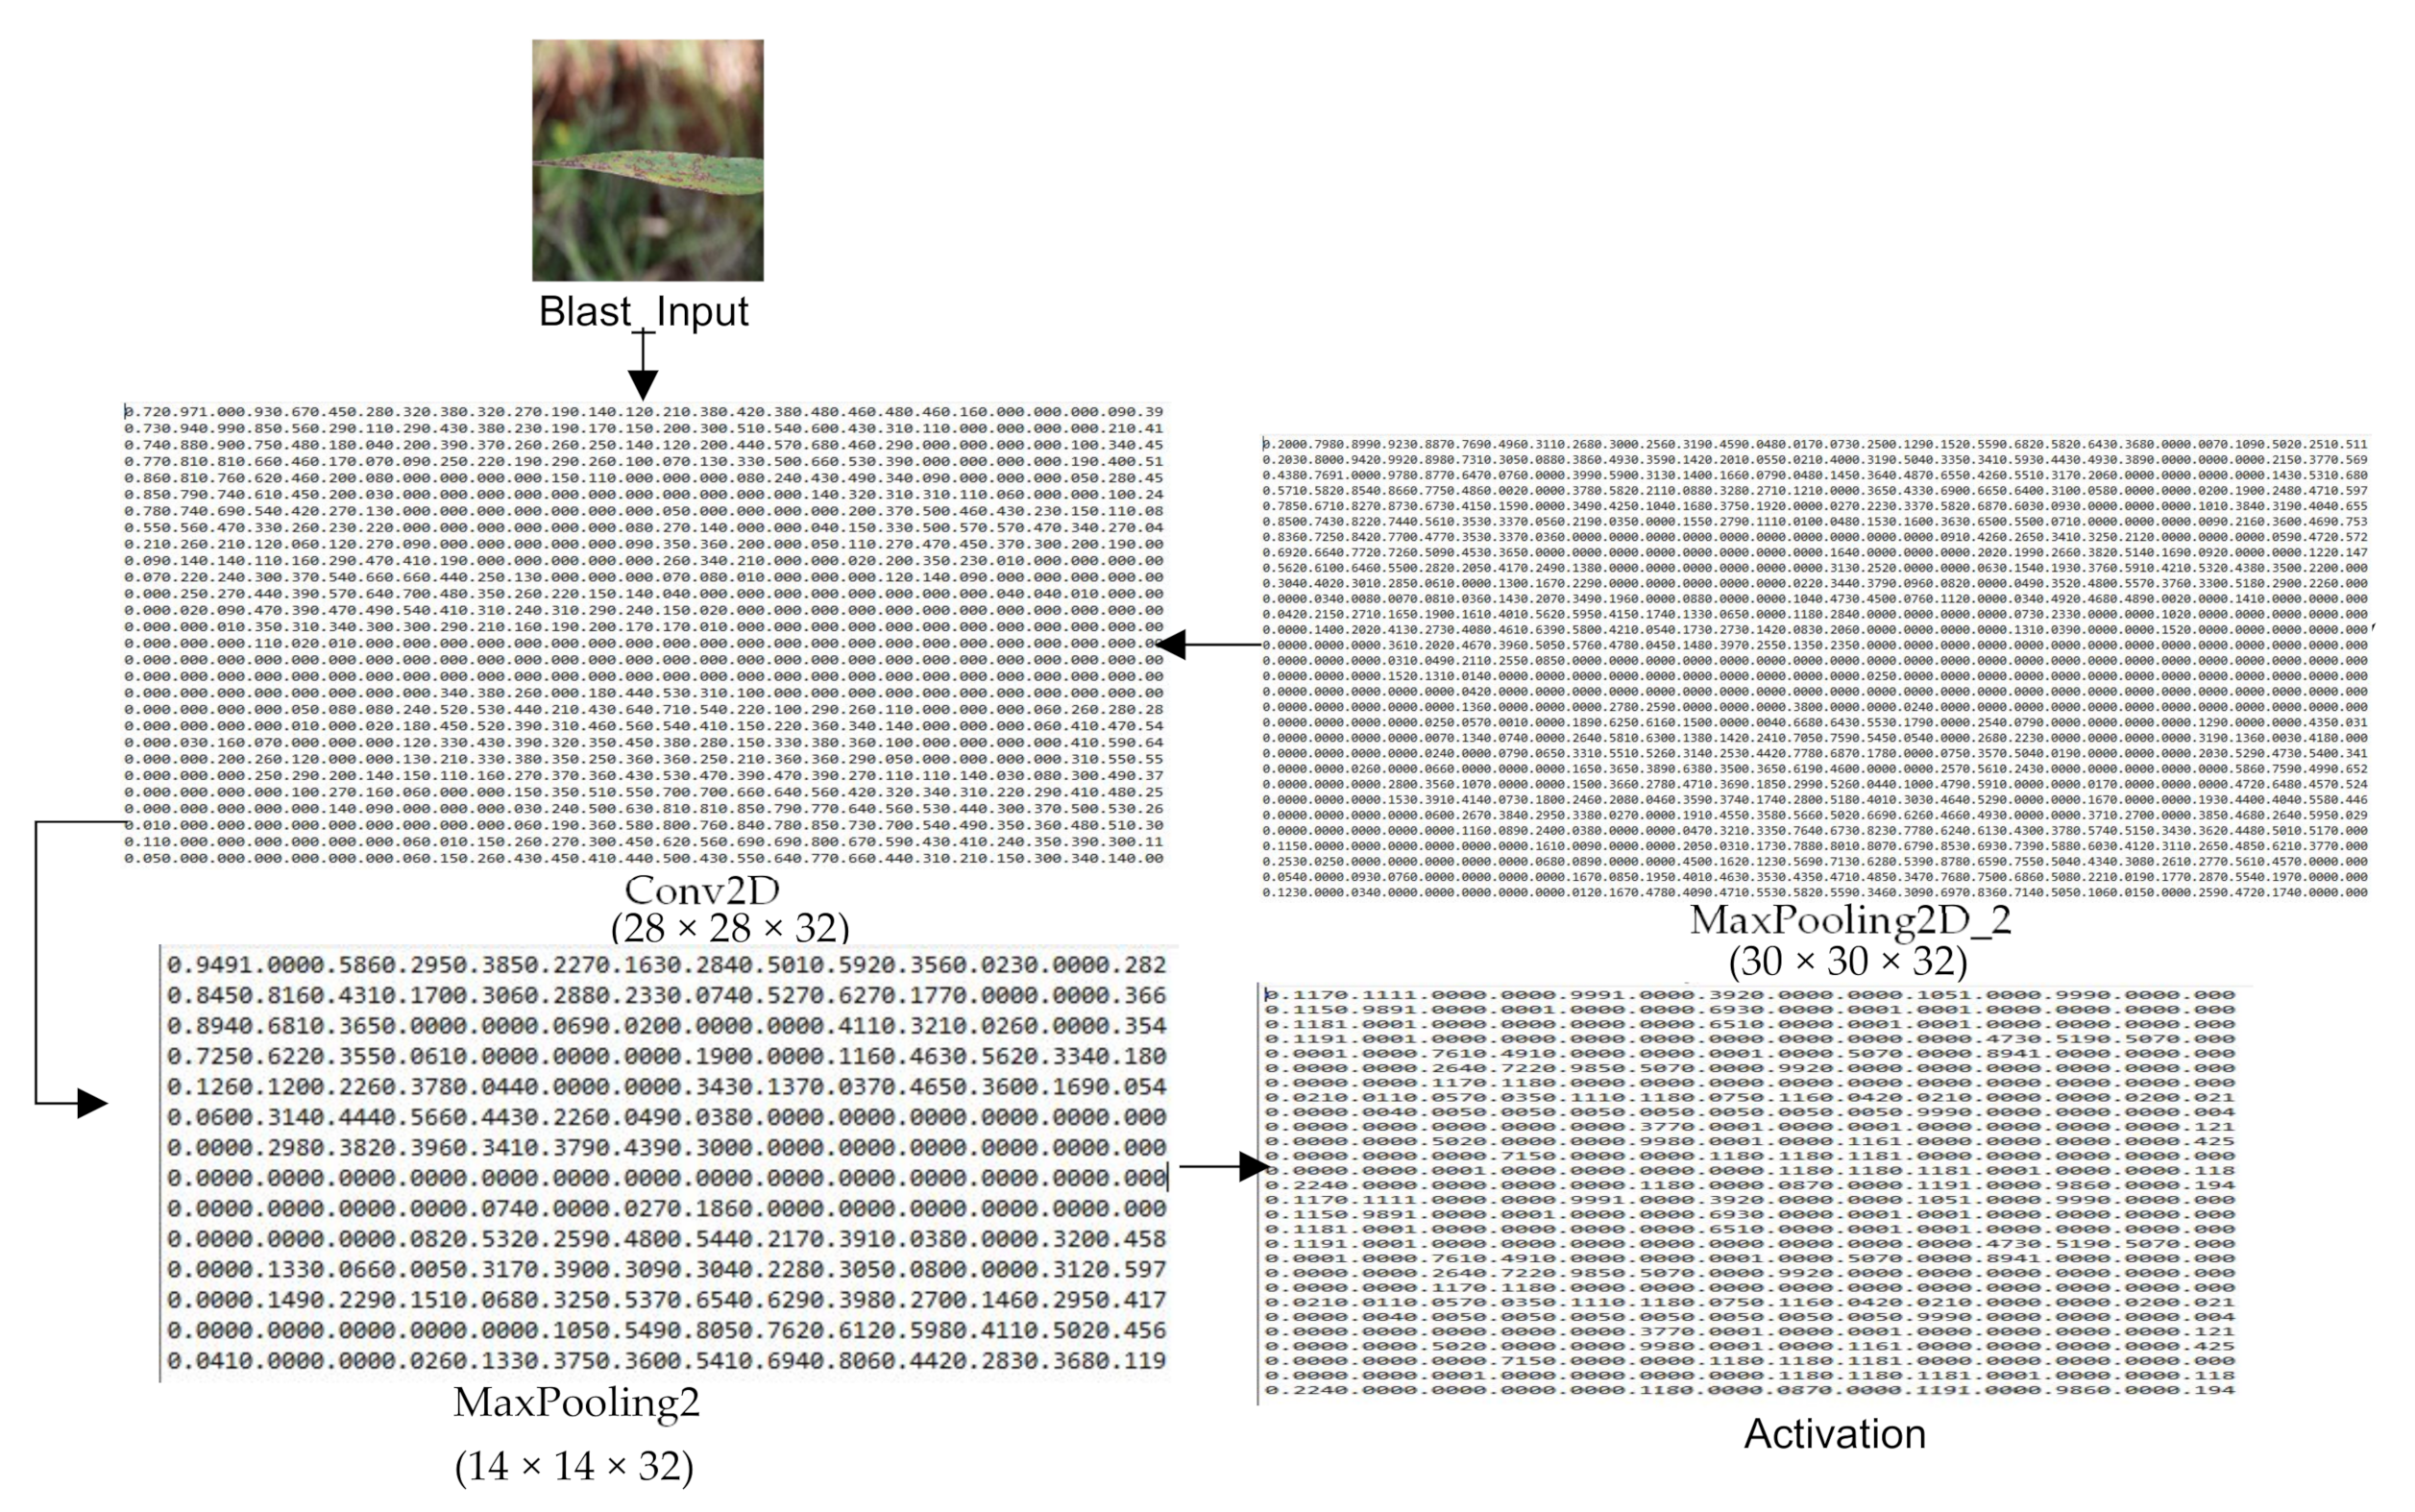
3.3. The Architecture of the ‘Custom-Net’ Model
Training of ‘Custom-Net’ and State-of-the-Art Deep Learning Models
3.4. Evaluation Metrics
- Average accuracy: It is the measure of the degree of correctness of the classification. It can be calculated using the formula given in Equation (1).
- Precision: This is the measure of classifying the samples of the blast correctly to the blast class. The formula to calculate the precision is given in Equation (2).
- Recall: This is the measure of correct identification of samples of the blast class from the total number of samples of that class. The formula to calculate the precision is given in Equation (3).
4. Results
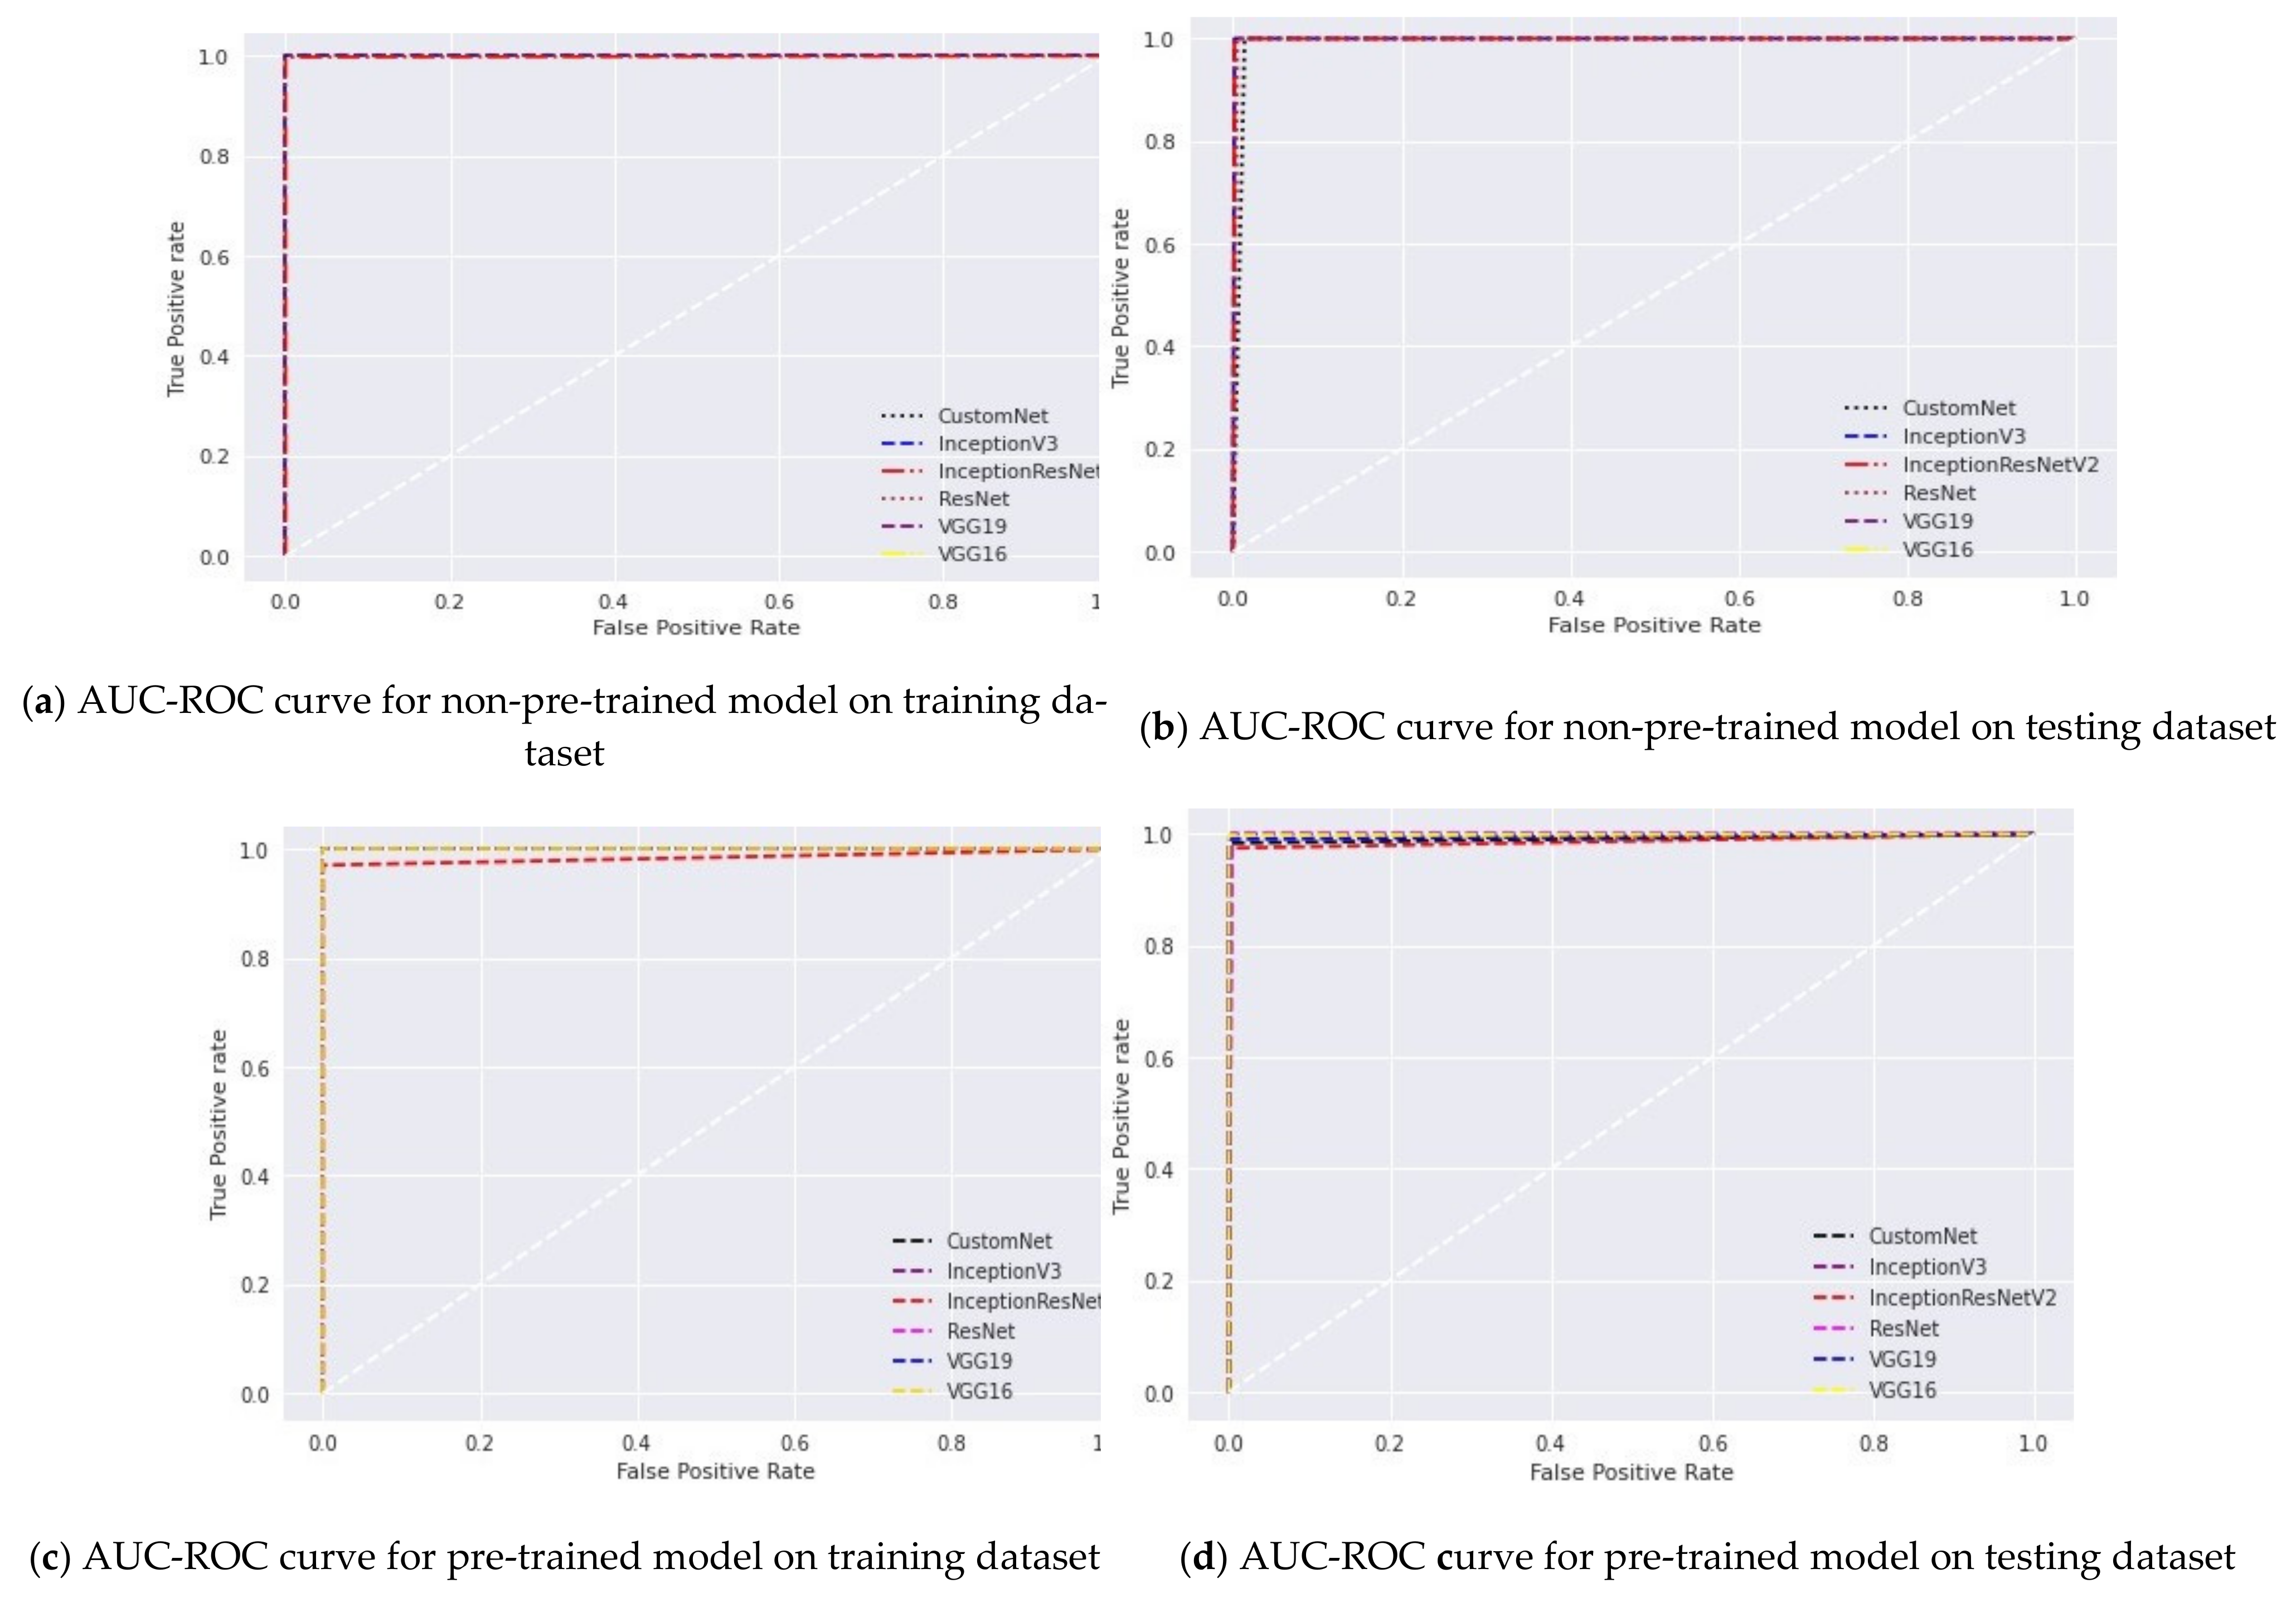
4.1. Confusion Matrix for Classification
4.2. Average Accuracy
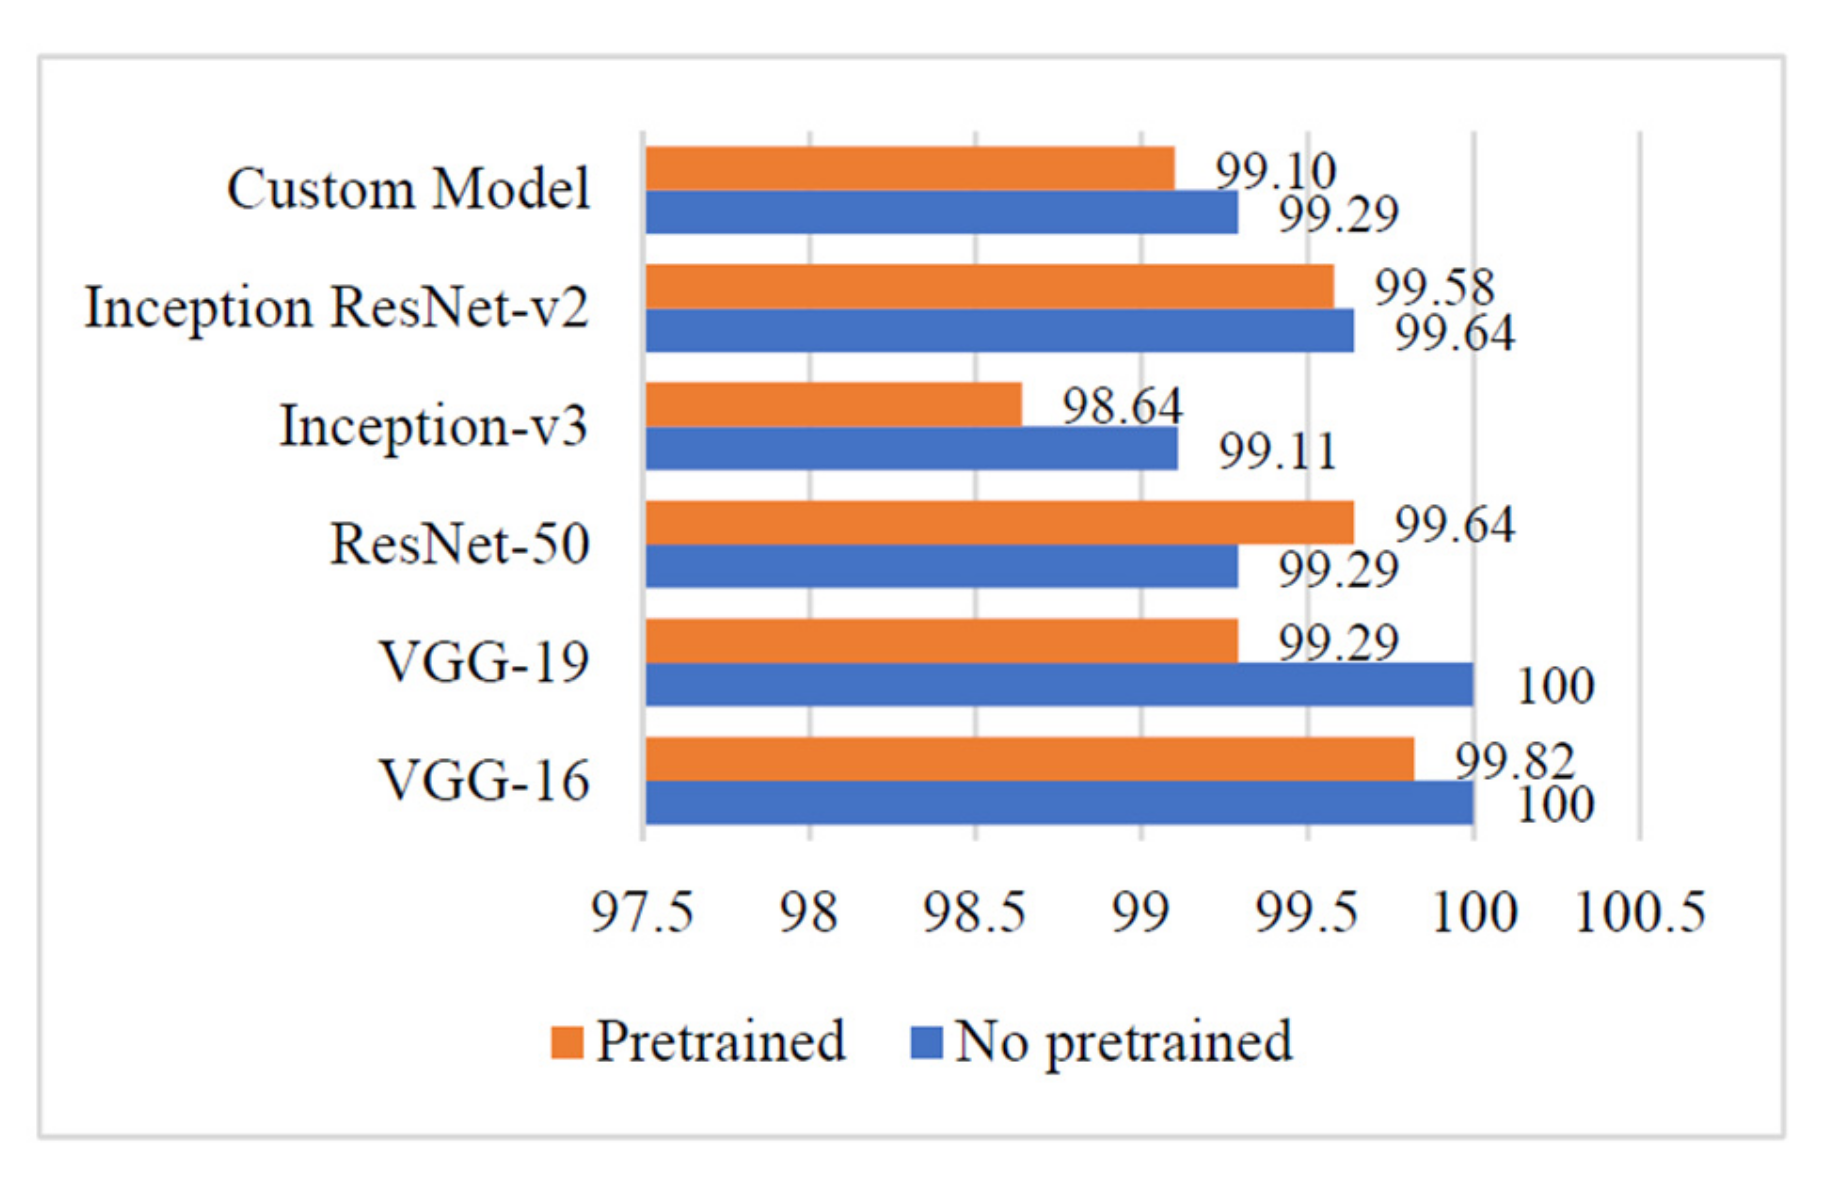
4.3. Precision
4.4. Recall
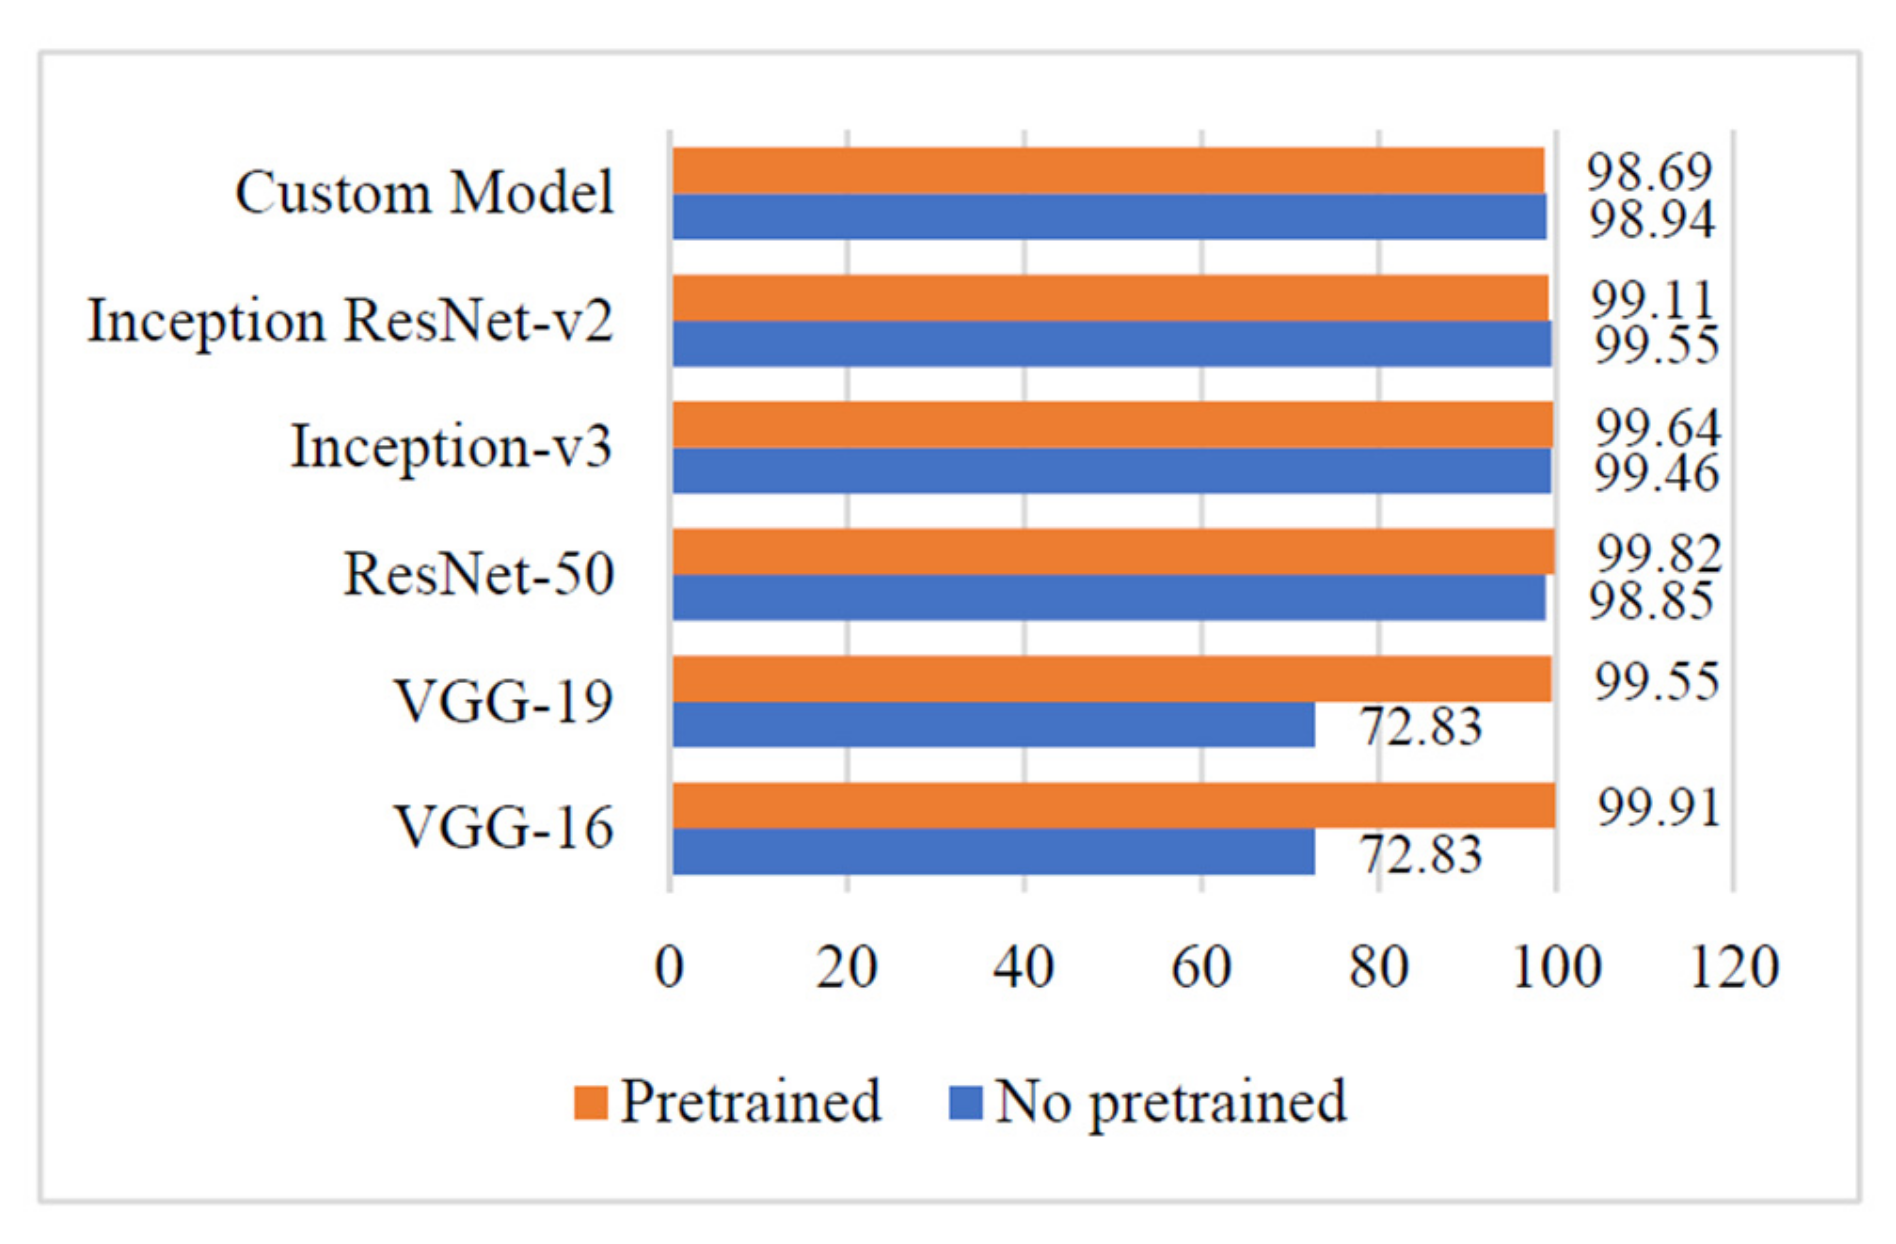
4.5. F1 Score
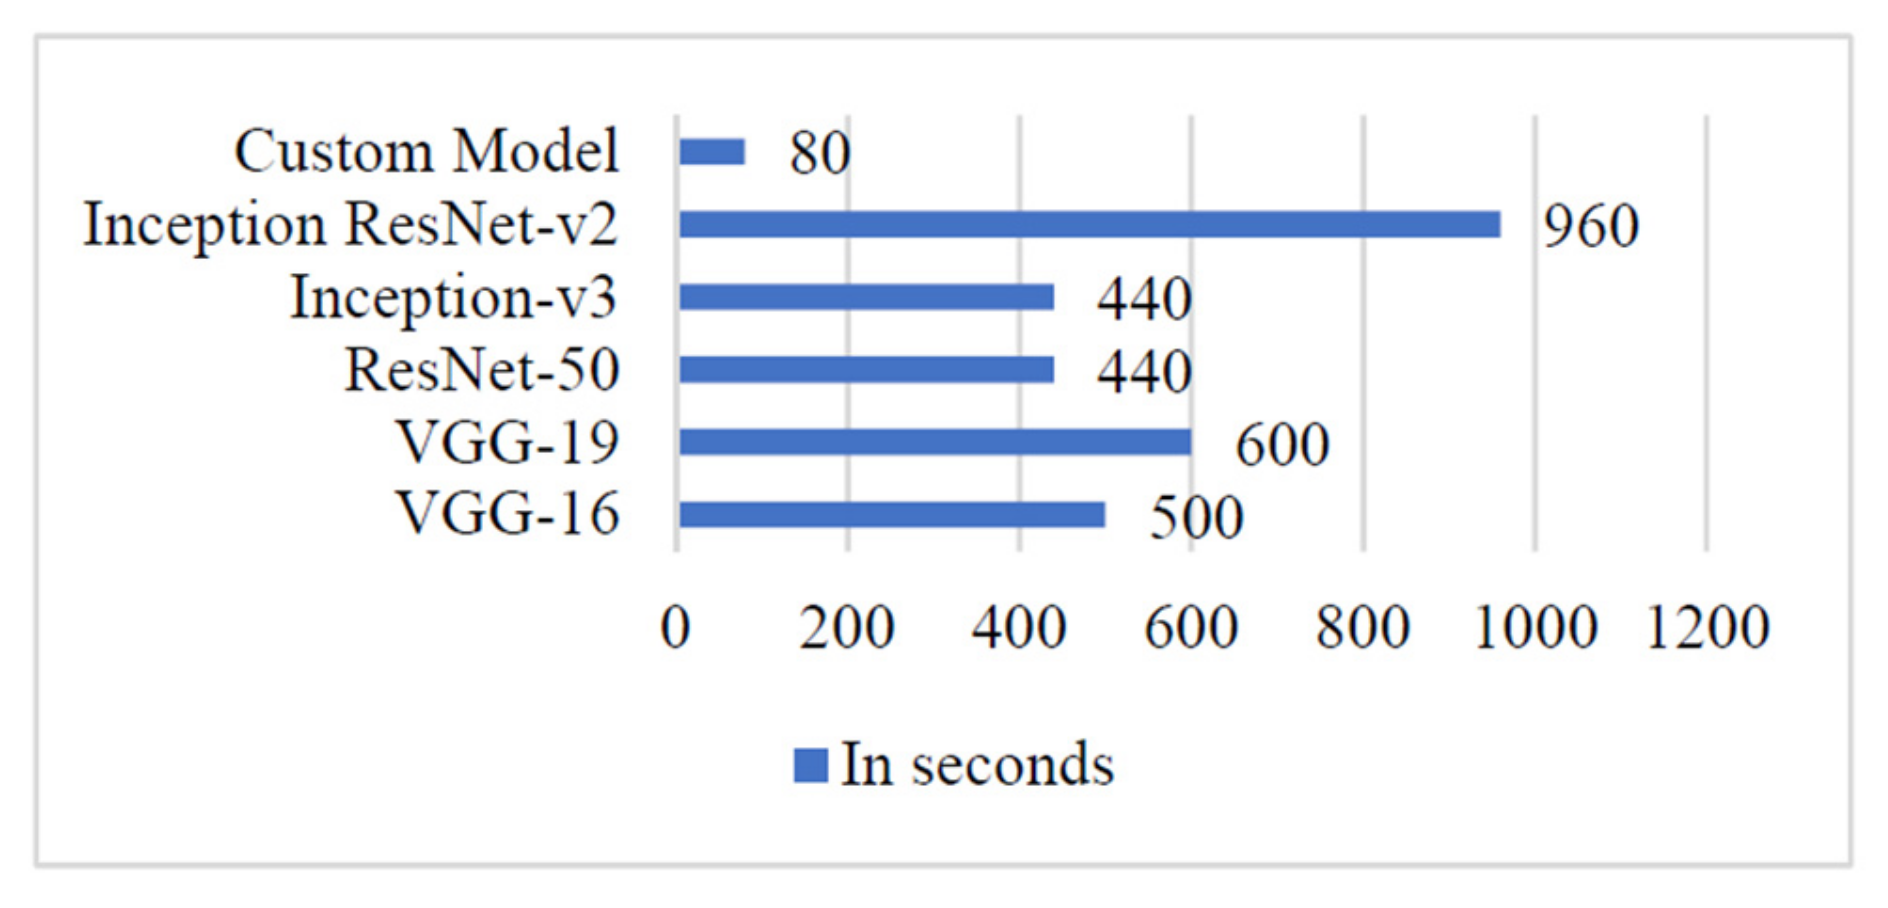
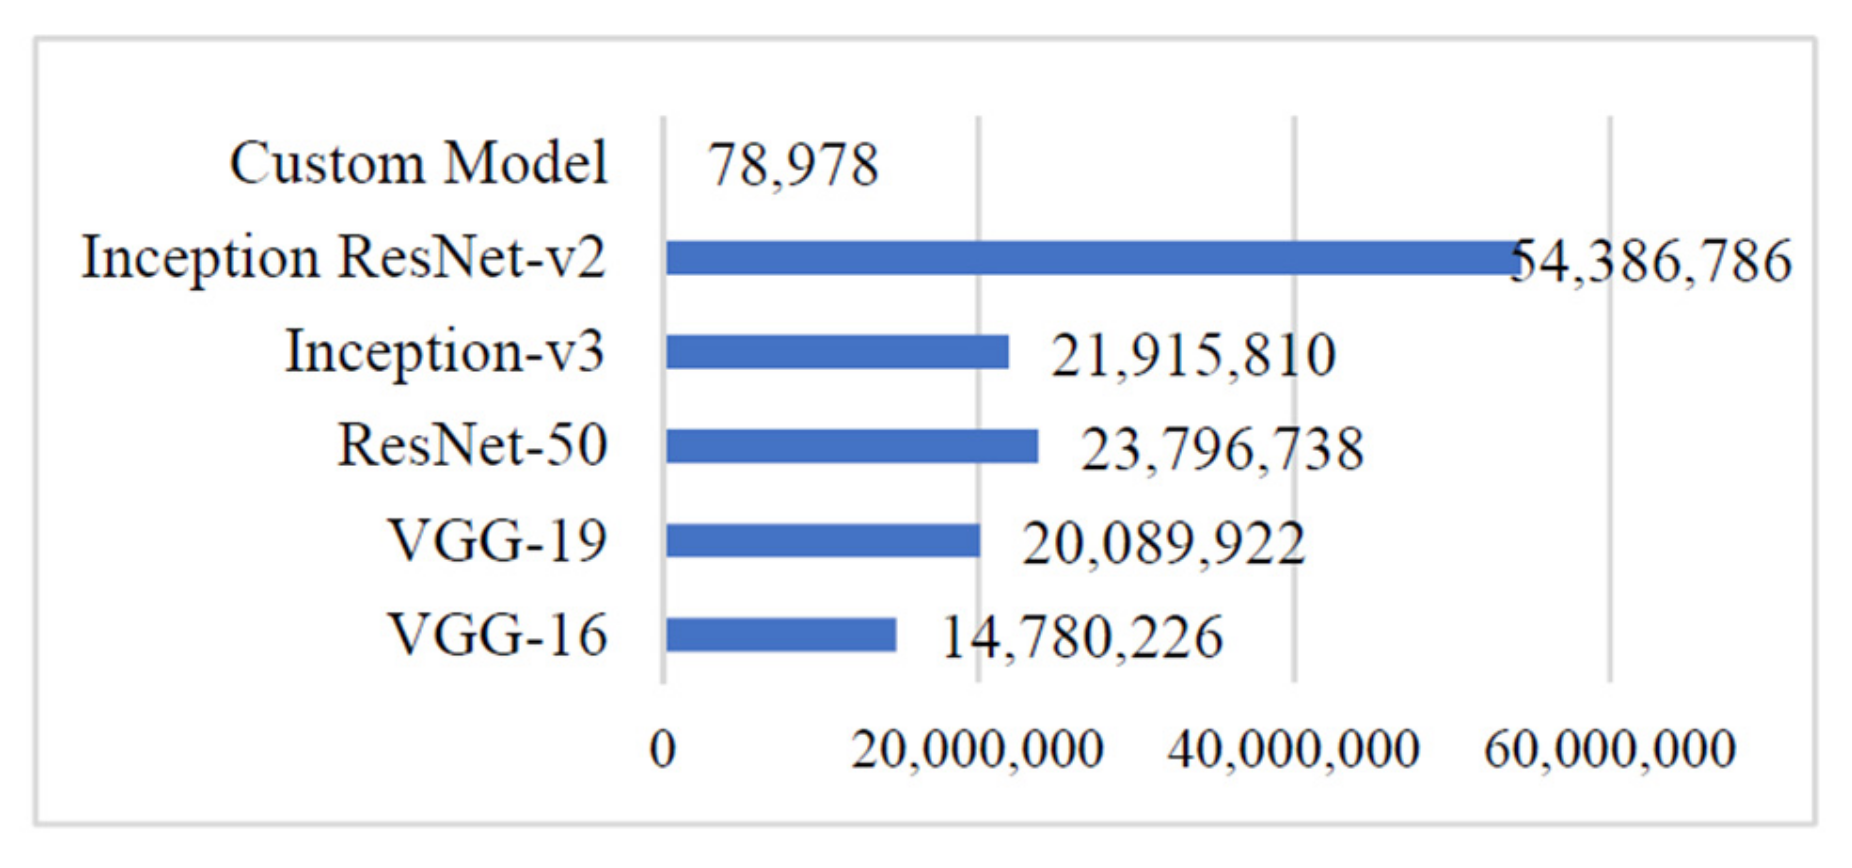
4.6. Computation Cost
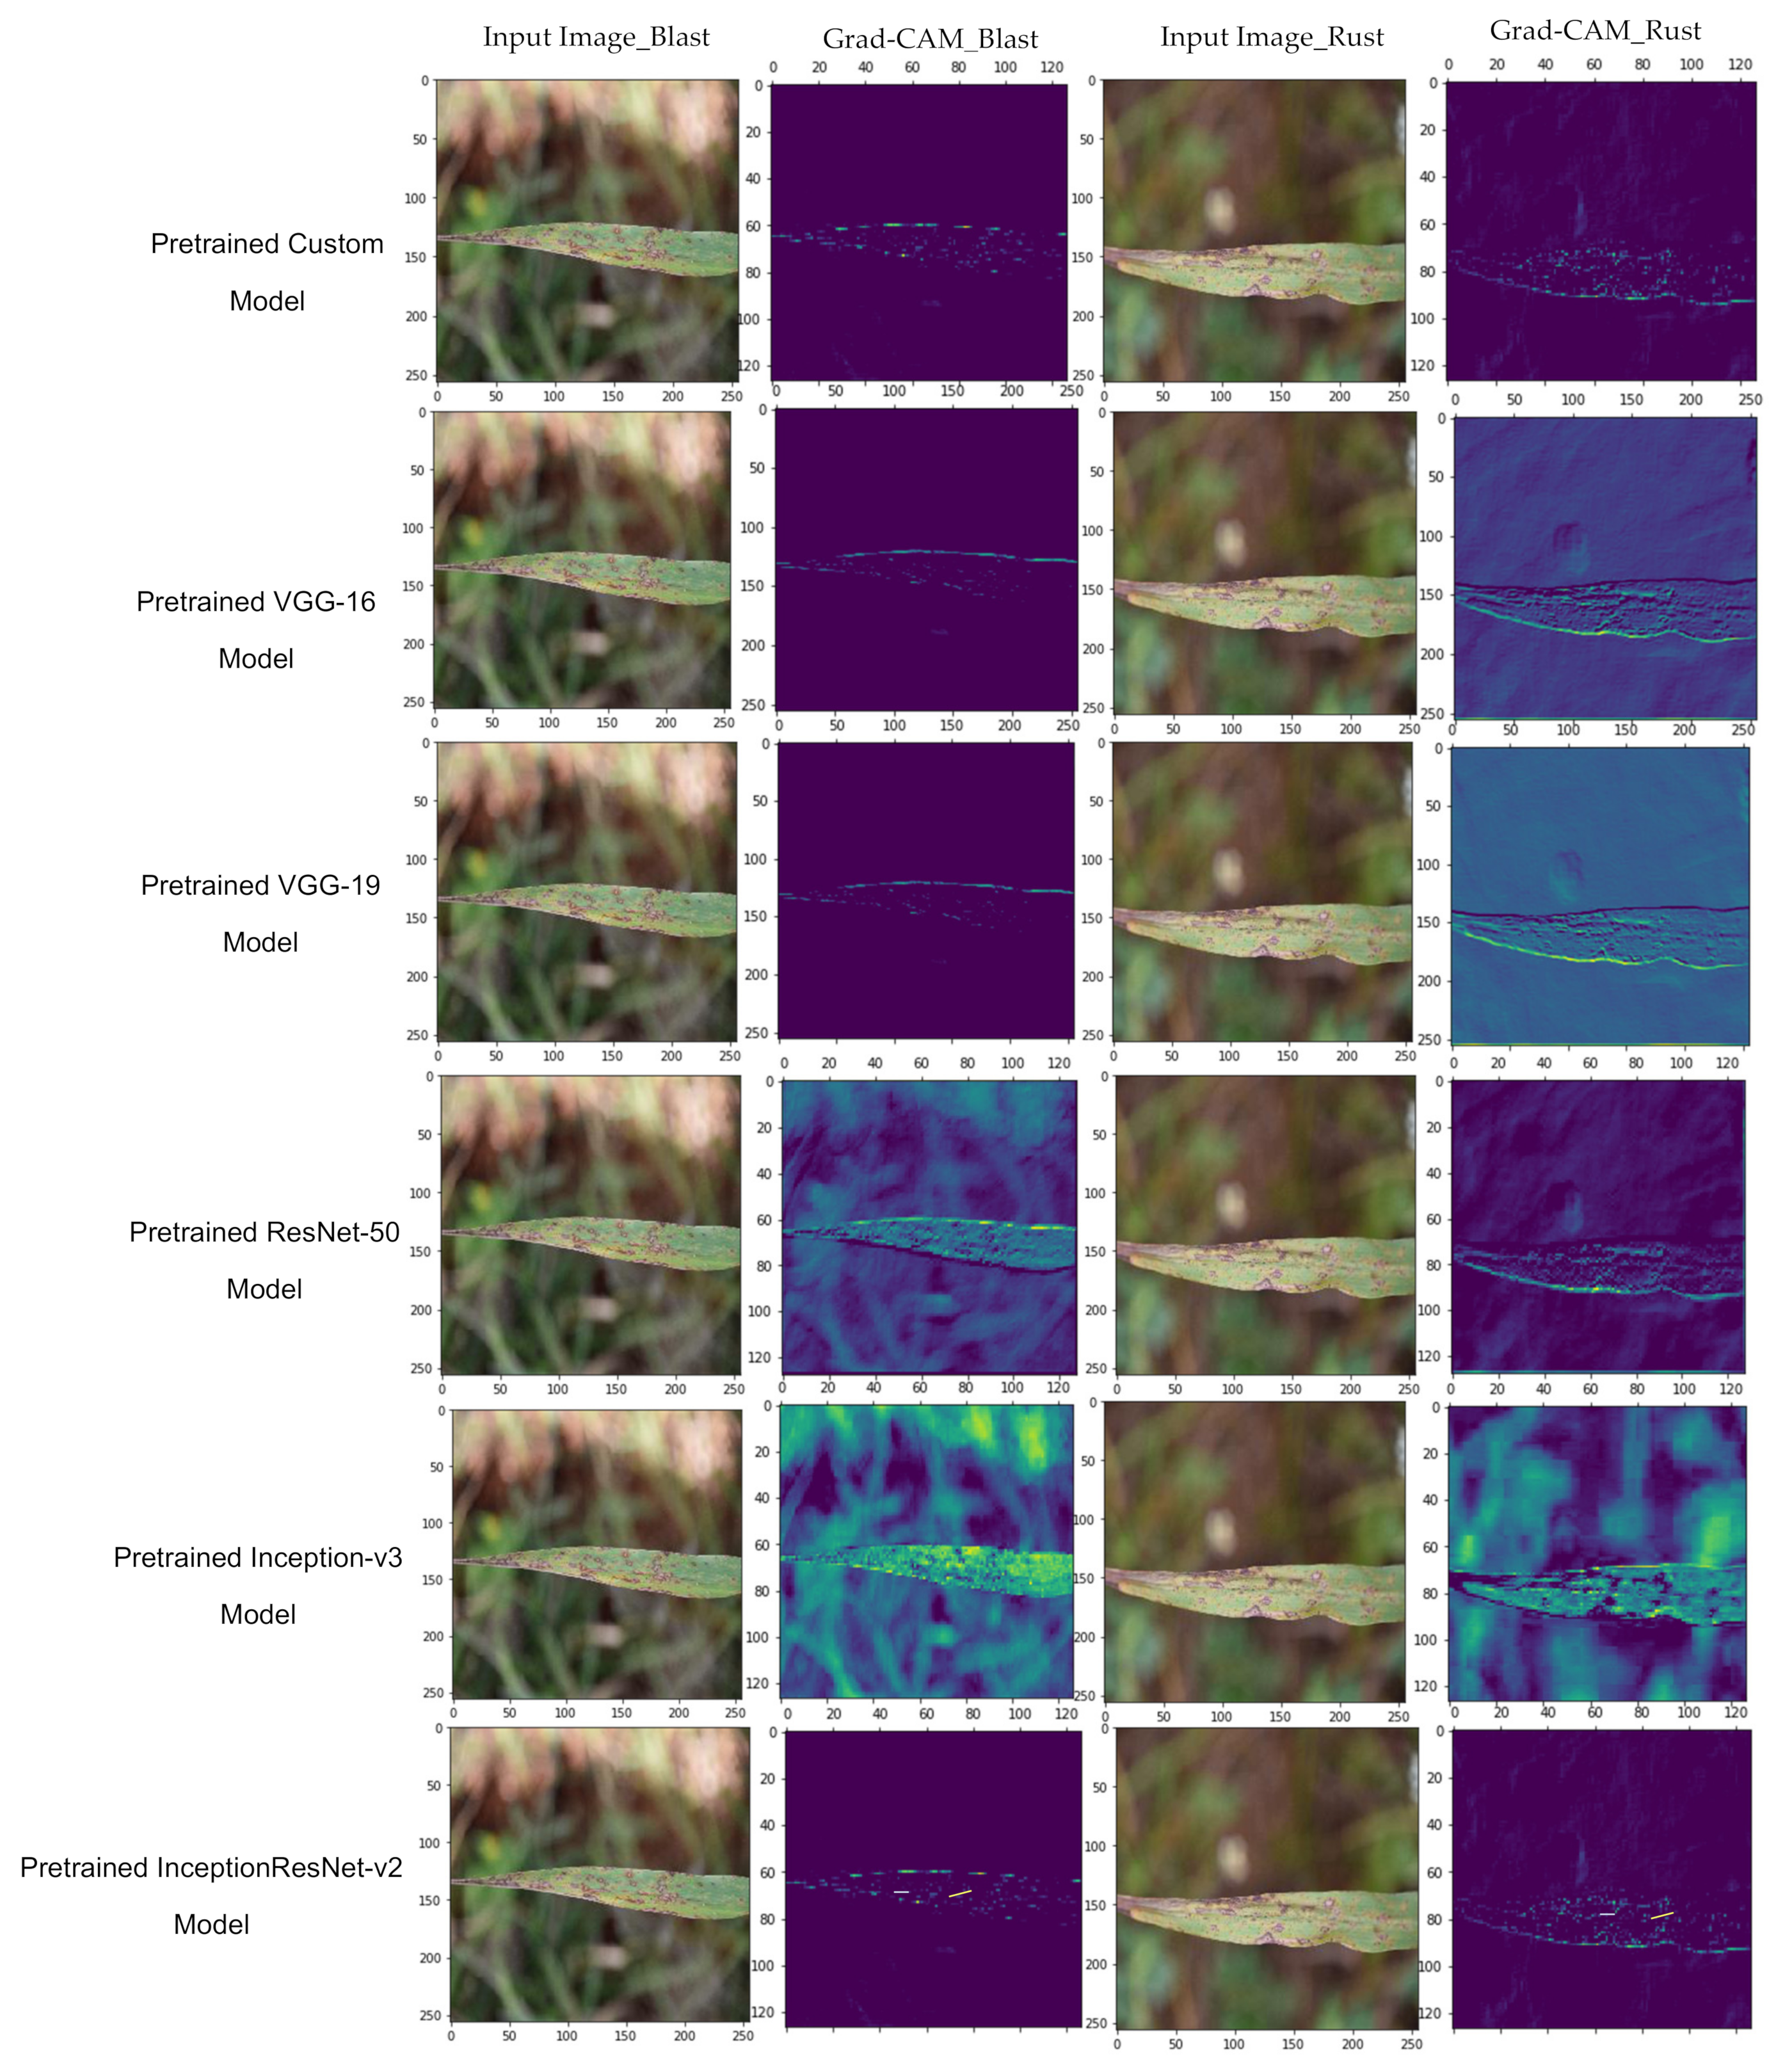
4.7. Grad-CAM
5. Discussion
6. Conclusions
Author Contributions
Funding
Institutional Review Board Statement
Informed Consent Statement
Data Availability Statement
Acknowledgments
Conflicts of Interest
References
- C. Pearl and M. Improvement, Pearl Millet News. Project Coordinator ICAR—All India Coordinated Research Project on Pearl Millet. 2020. Available online: http://www.aicpmip.res.in/pmnews.html (accessed on 6 July 2021).
- Authority, P.B.Y.; Delhi, N.E.W. The Gazette of India. 2018; pp. 1–2. Available online: https://en.wikipedia.org/wiki/The_Gazette_of_India (accessed on 6 July 2021).
- ICRISAT. Millet in Schools by Union Minitry. Available online: https://www.icrisat.org/indias-millets-makeover-set-to-reach-poor-school-meals/ (accessed on 6 July 2021).
- Climate Change Impact. Available online: https://thewire.in/environment/millets-india-food-basket-climate-change (accessed on 6 July 2021).
- Jukanti, A.K.; Gowda, C.L.L.; Rai, K.N.; Manga, V.K.; Bhatt, R.K. Crops that feed the world 11. Pearl Millet (Pennisetum glaucum L.): An important source of food security, nutrition and health in the arid and semi-arid tropics. Food Secur. 2016, 8, 307–329. [Google Scholar] [CrossRef]
- Chougule, A.; Jha, V.K.; Mukhopadhyay, D. Using IoT for integrated pest management. In Proceedings of the 2016 International Conference on Internet of Things and Applications (IOTA), Prune, India, 22–24 January 2016; pp. 17–22. [Google Scholar] [CrossRef]
- Savary, S.; Bregaglio, S.; Willocquet, L.; Gustafson, D.; Mason-D’Croz, D.; Sparks, A.H.; Castilla, N.; Djurle, A.; Allinne, C.; Sharma, M.; et al. Crop health and its global impacts on the components of food security. Food Secur. 2017, 9, 311–327. [Google Scholar] [CrossRef]
- Schütz, H.; Jansen, M.; Verhoff, M.A. How to feed the world in 2050. Arch. Kriminol. 2011, 228, 151–159. [Google Scholar]
- Darwin, R. Effects of Greenhouse Gas Emissions on World Agriculture, Food Consumption, and Economic Welfare. Clim. Chang. 2004, 66, 191–238. [Google Scholar] [CrossRef]
- Park, S.J.; Hong, S.; Kim, D.; Seo, Y.; Hussain, I.; Hur, J.H.; Jin, W. Development of a Real-Time Stroke Detection System for Elderly Drivers Using Quad-Chamber Air Cushion and IoT Devices. SAE Tech. Pap. 2018, 2018, 1–5. [Google Scholar] [CrossRef]
- Hussain, I.; Park, S.J. HealthSOS: Real-Time Health Monitoring System for Stroke Prognostics. IEEE Access 2020, 8, 213574–213586. [Google Scholar] [CrossRef]
- Park, S.J.; Hussain, I.; Hong, S.; Kim, D.; Park, H.; Benjamin, H.C.M. Real-time gait monitoring system for consumer stroke prediction service. In Proceedings of the 2020 IEEE International Conference on Consumer Electronics (ICCE), Las Vegas, NV, USA, 4–6 January 2020. [Google Scholar] [CrossRef]
- El-Jerjawi, N.S.; Abu-Naser, S.S. Diabetes prediction using artificial neural network. Int. J. Adv. Sci. Technol. 2020, 327–339. [Google Scholar] [CrossRef]
- Oza, M.G.; Rani, G.; Dhaka, V.S. Glaucoma Detection Using Convolutional Neural Networks. In Handbook of Research on Disease Prediction through Data Analytics and Machine Learning; IGI Global: Hershey, PA, USA, 2021; pp. 1–7. [Google Scholar]
- Rani, G.; Oza, M.G.; Dhaka, V.S.; Pradhan, N.; Verma, S.; Rodrigues, J.J. Applying Deep Learning for Genome Detection of Coronavirus. Multimed. Syst. 2021, 1–12. [Google Scholar] [CrossRef]
- Kundu, N.; Rani, G.; Dhaka, V.S. Machine Learning and IoT based Disease Predictor and Alert Generator System. In Proceedings of the 2020 Fourth International Conference on Computing Methodologies and Communication (ICCMC), Erode, India, 11–13 March 2020; pp. 764–769. [Google Scholar] [CrossRef]
- Sinwar, D.; Dhaka, V.S.; Sharma, M.K.; Rani, G. AI-Based Yield Prediction and Smart Irrigation. Stud. Big Data 2019, 2, 155–180. [Google Scholar] [CrossRef]
- Dyrmann, M.; Karstoft, H.; Midtiby, H.S. Plant species classification using deep convolutional neural network. Biosyst. Eng. 2016, 151, 72–80. [Google Scholar] [CrossRef]
- Mohanty, S.P.; Hughes, D.P.; Salathé, M. Using Deep Learning for Image-Based Plant Disease Detection. Front. Plant Sci. 2016, 7, 1419. [Google Scholar] [CrossRef] [PubMed] [Green Version]
- Kundu, N.; Rani, G.; Dhaka, V.S. A Comparative Analysis of Deep Learning Models Applied for Disease Classification in Bell Pepper. In Proceedings of the 2020 Sixth International Conference on Parallel, Distributed and Grid Computing (PDGC), Himachal Pradesh, India, 6–8 November 2020; pp. 243–247. [Google Scholar]
- Mohanraj, I.; Ashokumar, K.; Naren, J. Field Monitoring and Automation Using IOT in Agriculture Domain. Procedia Comput. Sci. 2016, 93, 931–939. [Google Scholar] [CrossRef] [Green Version]
- Pan, S.J.; Yang, Q. A Survey on Transfer Learning. IEEE Trans. Knowl. Data Eng. 2010, 22, 1345–1359. [Google Scholar] [CrossRef]
- Hu, W.-J.; Fan, J.; Du, Y.-X.; Li, B.-S.; Xiong, N.N.; Bekkering, E. MDFC–ResNet: An Agricultural IoT System to Accurately Recognize Crop Diseases. IEEE Access 2020, 8, 115287–115298. [Google Scholar] [CrossRef]
- Feng, J.Z.B.; Li, G.Z. DCNN Transfer Learning and Multi-Model Integration for Disease and Weed Identification; Springer: Singapore, 2019; Volume 2. [Google Scholar]
- Nyvall, R.F.; Nyvall, R.F. Diseases of Millet. In Field Crop Diseases Handbook; ICAR: Hyderabad, India, 1989; Volume 500030, pp. 265–280. [Google Scholar]
- Singh, R.; Singh, G.S. Traditional agriculture: A climate-smart approach for sustainable food production. Energy Ecol. Environ. 2017, 2, 296–316. [Google Scholar] [CrossRef]
- Brahimi, M. Deep Learning for Plants Diseases; Springer International Publishing: New York, NY, USA, 2018. [Google Scholar]
- Khan, S.; Narvekar, M. Disorder detection of tomato plant(solanum lycopersicum) using IoT and machine learning. J. Phys. 2020, 1432, 012086. [Google Scholar] [CrossRef]
- Kitpo, N.; Inoue, M. Early rice disease detection and position mapping system using drone and IoT architecture. In Proceedings of the 2018 12th South East Asian Technical University Consortium (SEATUC), Yogyakarta, Indonesia, 12–13 March 2018. [Google Scholar] [CrossRef]
- Thorat, A.; Kumari, S.; Valakunde, N.D. An IoT based smart solution for leaf disease detection. In Proceedings of the 2017 International Conference on Big Data, IoT and Data Science (BID), Pune, India, 20–22 December 2017. [Google Scholar] [CrossRef]
- Chapaneri, R.; Desai, M.; Goyal, A.; Ghose, S.; Das, S. Plant Disease Detection: A Comprehensive Survey. In Proceedings of the 2020 3rd International Conference on Communication System, Computing and IT Applications (CSCITA), Mumbai, India, 3–4 April 2020. [Google Scholar]
- Abdullahi, H.S.; Sheriff, R.; Mahieddine, F. Convolution neural network in precision agriculture for plant image recognition and classification. In Proceedings of the 2017 Seventh International Conference on Innovative Computing Technology (INTECH), Sao Carlos, Brazil, 16–18 August 2017. [Google Scholar]
- Singh, U.P.; Chouhan, S.S.; Jain, S.; Jain, S. Multilayer Convolution Neural Network for the Classification of Mango Leaves Infected by Anthracnose Disease. IEEE Access 2019, 7, 43721–43729. [Google Scholar] [CrossRef]
- Nagasubramanian, K.; Jones, S.; Singh, A.K.; Sarkar, S.; Singh, A.; Ganapathysubramanian, B. Plant disease identification using explainable 3D deep learning on hyperspectral images. Plant Methods 2019, 15, 1–10. [Google Scholar] [CrossRef]
- Ramcharan, A.; Baranowski, K.; McCloskey, P.; Ahmed, B.; Legg, J.; Hughes, D.P. Deep Learning for Image-Based Cassava Disease Detection. Front. Plant Sci. 2017, 8, 1852. [Google Scholar] [CrossRef] [Green Version]
- Barbedo, J.G.A. Plant disease identification from individual lesions and spots using deep learning. Biosyst. Eng. 2019, 180, 96–107. [Google Scholar] [CrossRef]
- Jiang, P.; Chen, Y.; Liu, B.; He, D.; Liang, C. Real-Time Detection of Apple Leaf Diseases Using Deep Learning Approach Based on Improved Convolutional Neural Networks. IEEE Access 2019, 7, 59069–59080. [Google Scholar] [CrossRef]
- Wu, Q.; Zhang, K.; Meng, J. Identification of Soybean Leaf Diseases via Deep Learning. J. Inst. Eng. (India) Ser. A 2019, 100, 659–666. [Google Scholar] [CrossRef]
- He, L.; Zhang, X.; Ren, S.; Sun, J. Deep Residual learning for image recognition. arXiv 2020, arXiv:1512.03385v1. [Google Scholar]
- Szegedy, C.; Liu, W.; Jia, Y.; Sermanet, P.; Reed, S.; Anguelov, D.; Rabinovich, A. Going Deeper with Convolutions. In Proceedings of the IEEE Conference on Computer Vision and Pattern Recognition, Honolulu, HI, USA, 21–26 July 2017. [Google Scholar]
- Längkvist, M.; Karlsson, L.; Loutfi, A. A review of unsupervised feature learning and deep learning for time-series modeling. Pattern Recognit. Lett. 2014, 42, 11–24. [Google Scholar] [CrossRef] [Green Version]
- Szegedy, C.; Vanhoucke, V.; Ioffe, S.; Shlens, J.; Wojna, Z. Rethinking the Inception Architecture for Computer Vision. In Proceedings of the IEEE Computer Society Conference on Computer Vision and Pattern Recognition, Las Vegas, NV, USA, 26 June–1 July 2016; pp. 2818–2826. [Google Scholar] [CrossRef] [Green Version]
- Huang, G.; Liu, Z.; van der Maaten, L.; Weinberger, K.Q. Densely connected convolutional networks. In Proceedings of the 2017 IEEE Conference on Computer Vision and Pattern Recognition (CVPR), Honolulu, HI, USA, 21–26 July 2017; pp. 2261–2269. [Google Scholar] [CrossRef] [Green Version]
- Howard, A.G.; Zhu, M.; Chen, B.; Kalenichenko, D.; Wang, W.; Weyand, T.; Adam, H. Mobilenets: Efficient convolutional neural networks for mobile vision applications. arXiv 2017, arXiv:1704.04861. [Google Scholar]
- Iandola, F.N.; Han, S.; Moskewicz, M.W.; Ashraf, K.; Dally, W.J.; Keutzer, K. SqueezeNet: AlexNet-level accuracy with 50x fewer parameters and<0.5 MB model size. arXiv 2016, arXiv:1602.07360. [Google Scholar]
- Review: Inception-v3—1st Runner Up (Image Classification) in ILSVRC. 2015. Available online: https://medium.com/@sh.tsang/review-inception-v3-1st-runner-up-image-classification-in-ilsvrc-2015-17915421f77c (accessed on 12 September 2020).
- AI Challenger Crop Disease Detection. 2018. Available online: https://pan.baidu.com/s/1TH9qL7Wded2Qiz03wHTDLw#list/path=%2F (accessed on 10 December 2020).
- Ferentinos, K. Deep learning models for plant disease detection and diagnosis. Comput. Electron. Agric. 2018, 145, 311–318. [Google Scholar] [CrossRef]
- Shah, J.P.; Prajapati, H.B.; Dabhi, V.K. A survey on detection and classification of rice plant diseases. In Proceedings of the 2016 IEEE International Conference on Current Trends in Advanced Computing (ICCTAC), Piscataway, NJ, USA, 10–11 March 2016. [Google Scholar]
- Shorten, C.; Khoshgoftaar, T.M. A survey on Image Data Augmentation for Deep Learning. J. Big Data 2019, 6, 60. [Google Scholar] [CrossRef]
- Cao, P.; Li, X.; Mao, K.; Lu, F.; Ning, G.; Fang, L.; Pan, Q. A novel data augmentation method to enhance deep neural networks for detection of atrial fibrillation. Biomed. Signal Process. Control 2020, 56, 101675. [Google Scholar] [CrossRef]
- Coulibaly, S.; Kamsu-Foguem, B.; Kamissoko, D.; Traore, D. Deep neural networks with transfer learning in millet crop images. Comput. Ind. 2019, 108, 115–120. [Google Scholar] [CrossRef] [Green Version]
- Simonyan, K.; Zisserman, A. Very deep convolutional networks for large-scale image recognition. arXiv 2014, arXiv:1409.1556. [Google Scholar]
- Shetty, H.S.; Raj, S.N.; Kini, K.R.; Bishnoi, H.R.; Sharma, R.; Rajpurohit, B.S.; Yadav, O.P. Downy Mildew of Pearl Millet and its Management. Indian Counc. Agric. Res. Mandor Jodhpur 2016, 342304, 55. [Google Scholar]
- Garg, D.; Alam, M. Deep learning and IoT for agricultural applications. In Internet of Things (IoT); Springer: Cham, Switzerland, 2020. [Google Scholar]
- Mogili, U.R.; Deepak, B.B.V.L. Review on Application of Drone Systems in Precision Agriculture. Procedia Comput. Sci. 2018, 133, 502–509. [Google Scholar] [CrossRef]
- Chen, C.-J.; Huang, Y.-Y.; Li, Y.-S.; Chang, C.-Y.; Huang, Y.-M. An AIoT Based Smart Agricultural System for Pests Detection. IEEE Access 2020, 8, 180750–180761. [Google Scholar] [CrossRef]
- Materne, N.; Inoue, M. IoT Monitoring System for Early Detection of Agricultural Pests and Diseases. In Proceedings of the 2018 12th South East Asian Technical University Consortium (SEATUC), Piscataway, NJ, USA, 12–13 March 2018. [Google Scholar]
- Thakur, V.R.R. P Screening techniques forpearl millet. Flexo Tech. 2008, 96, 13–14. [Google Scholar]
- Amara, J.; Bouaziz, B.; Algergawy, A. A deep learning-based approach for banana leaf diseases classification. Lect. Notes Inform. 2017, 266, 79–88. [Google Scholar]
- Sharma, P.; Berwal, Y.P.S.; Ghai, W. Performance analysis of deep learning CNN models for disease detection in plants using image segmentation. Inf. Process. Agric. 2020, 7, 566–574. [Google Scholar] [CrossRef]
- ImageNet Dataset. Available online: Image-net.org (accessed on 2 October 2020).
- Fawcett, T. An introduction to ROC analysis. Pattern Recognit. Lett. 2006, 27, 861–874. [Google Scholar] [CrossRef]


| Name of Disease | Causing Agent | Stage of Infection | Shape of Infected Region | Colour of Infected Region |
|---|---|---|---|---|
| Downy mildew | Sclerospora graminicola | Seedling. | Foliar and green ear | Green and whitish |
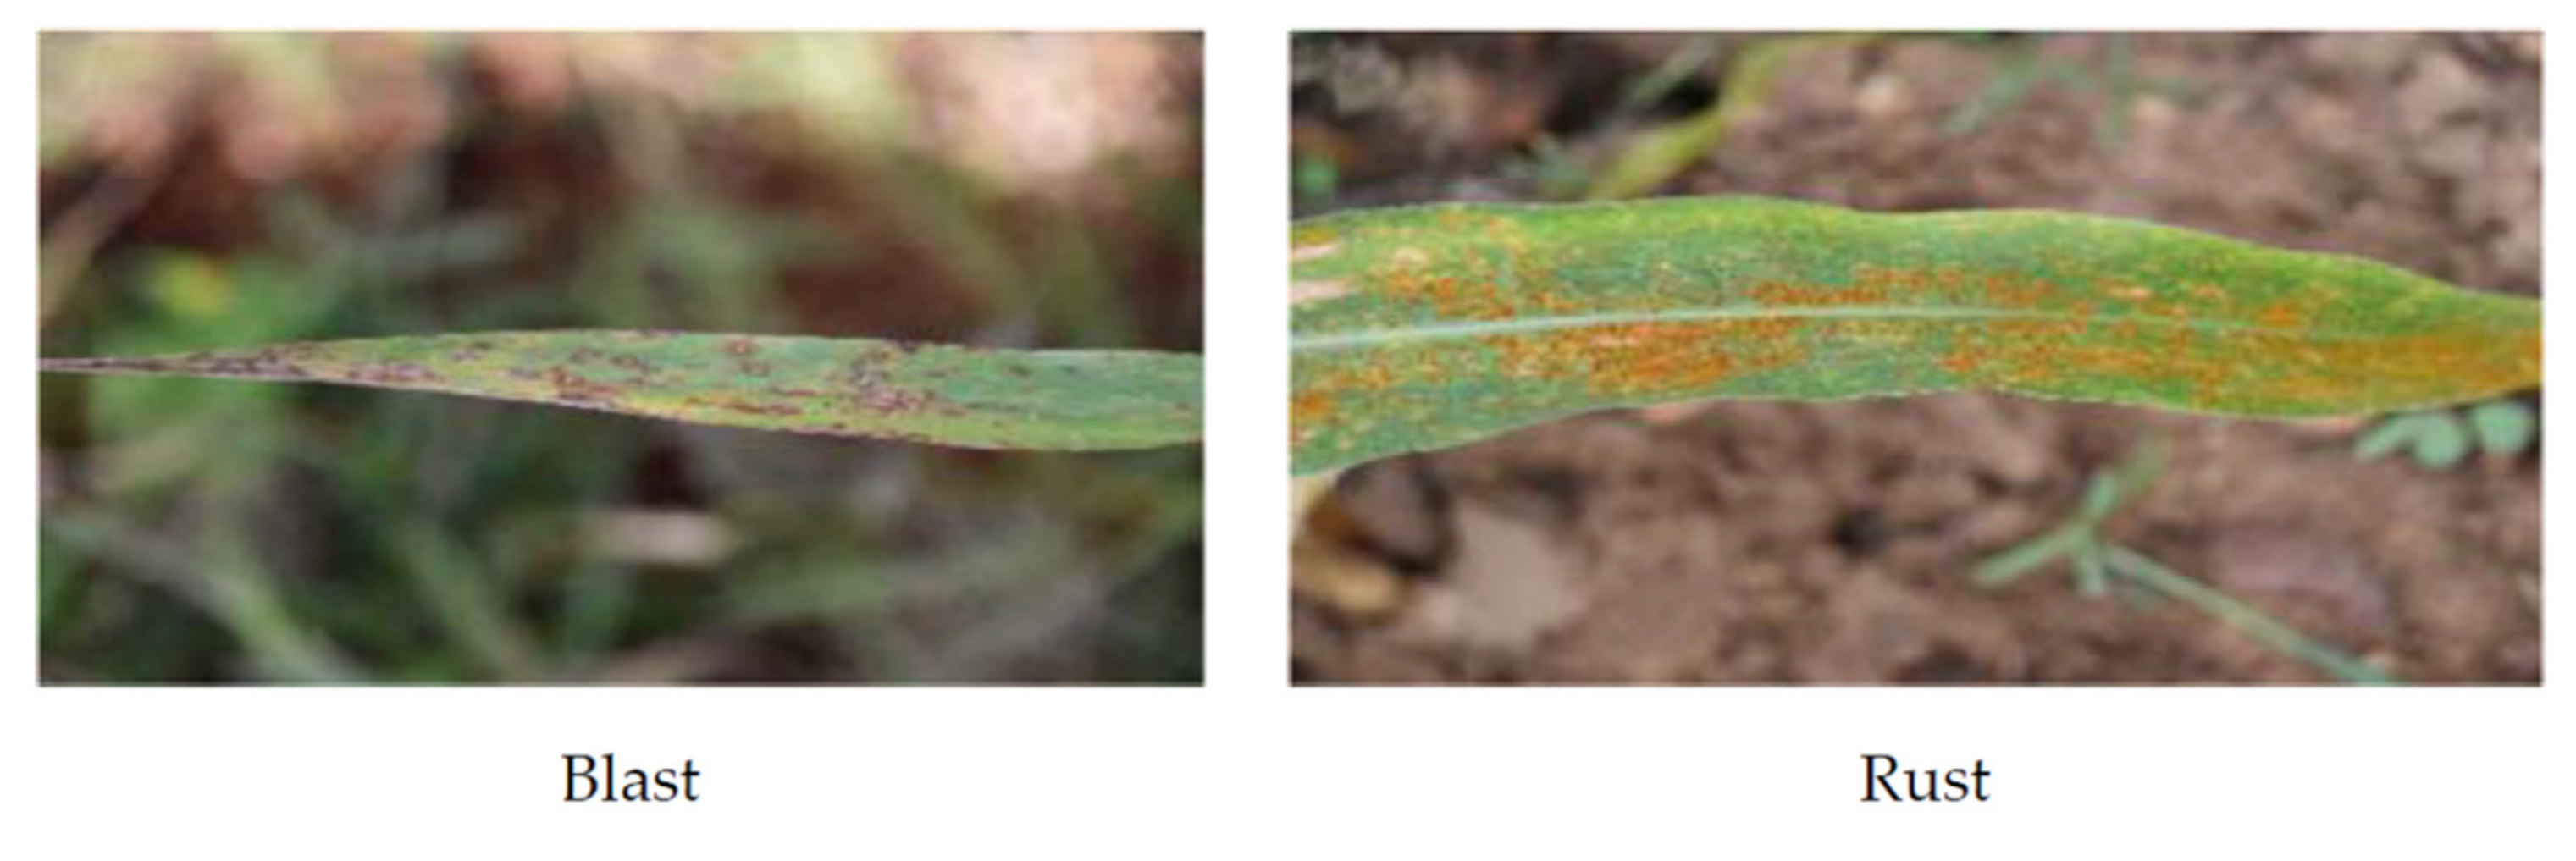
| Blast | Magnaporthe grisea | Seedling and tillering stage | Elliptical or diamond-shaped | Pale green to greyish green, later turning yellow to grey with age |
| Rust | Puccinia substriata var. indica. | Before flowering | Pistules type small spots | Reddish-orange |
| Name of Disease | Total Number of Images | Number of Images in the Training Dataset | Number of Images in Testing Dataset |
|---|---|---|---|
| Blast | 1964 | 1375 | 567 |
| Rust | 1336 | 935 | 423 |
| Total | 3300 | 2310 | 990 |
| Actual Label | |||
|---|---|---|---|
| Predicted Label | Blast | Rust | |
| Blast | TB | FB | |
| Rust | FR | TR | |
| (a) Training dataset | |||
| Actual Label | |||
| Predicted Label | Blast | Rust | |
| Blast | 1375 (TB) | 0(FB) | |
| Rust | 0(FR) | 935 (TR) | |
| (b) Testing dataset | |||
| Actual Label | |||
| Predicted Label | Blast | Rust | |
| Blast | 533 (TB) | 34(FB) | |
| Rust | 69(FR) | 354(TR) | |
| (a) Training dataset | |||
| Actual Label | |||
| Predicted Label | Blast | Rust | |
| Blast | 1375 | 0 | |
| Rust | 0 | 935 | |
| (b) Testing dataset | |||
| Actual Label | |||
| Predicted Label | Blast | Rust | |
| Blast | 563 (TB) | 4(FB) | |
| Rust | 8(FR) | 415(TR) | |
| Metrics | Non-Pre-Trained Models | Pre-Trained Models | ||||||||||
|---|---|---|---|---|---|---|---|---|---|---|---|---|
| VGG-16 | VGG-19 | ResNet-50 | Inception-V3 | Inception ResNetV2 | ‘Custom-Net’ | VGG-16 | VGG-19 | ResNet-50 | Inception-V3 | Inception ResNetV2 | ‘Custom-Net’ Model | |
| Accuracy (%) | 57.27 | 57.27 | 98.68 | 99.39 | 99.49 | 99.78 | 99.89 | 99.49 | 99.79 | 99.59 | 98.98 | 98.15 |
| Precision (%) | 100 | 100 | 99.29 | 99.11 | 99.64 | 99.29 | 99.82 | 99.29 | 99.64 | 98.64 | 99.58 | 99.10 |
| Recall (%) | 57.27 | 57.27 | 98.42 | 99.82 | 99.47 | 98.59 | 100 | 99.82 | 100 | 99.64 | 99.64 | 98.39 |
| F1 score (%) | 72.83 | 72.83 | 98.85 | 99.46 | 99.55 | 98.94 | 99.91 | 99.55 | 99.82 | 99.64 | 99.11 | 98.69 |
| Reference | Year | Crop | Diseases | Number of Images, Source | Tools Used for Dataset Collection | Model(s) Applied | Evaluation Metrics |
|---|---|---|---|---|---|---|---|
| Our work | 2021 | Pearl millet | Rust, blast | 3300, ICAR Mysore | X8-RC Drone camera NIKON D750 Digital camera DHT11 sensor Raspberry Pi | ‘Custom-Net’ VGG-16 VGG-19 ResNet-50 Inception-v3 Inception ResNet-v2 | Accuracy = 98.78% Precision = 99.29% Recall = 98.59% F1 score = 98.64% Training time = 80 s Number of training parameters = 78,978 |
| [28] | 2020 | Tomato | Early blight Late blight Healthy | 5923 Plant Village Dataset, Internet images, and leaf images captured from Tansa Farm, Bhiwandi | Sensor | Support vector machines Random Forest (RF) K-means VGG-16 VGG-19 | Clustering accuracy using RF = 99.56% Classification accuracy using VGG-16 = 92.08% |
| [23] | 2020 | 59 categories | 49 disease categories, 10 healthy | 36,252, AI-challenger | Video cameras Smartphone | MDFC-ResNet VGG-19 AlexNet ResNet = 50 | Accuracy = 93.96% Precision = 98.22% Recall = 95.40% F1 score = 96.79% |
| [52] | 2019 | Pearl millet | Downy mildew | 711 Images from the Internet | No camera No IoT | VGG-16 Transfer learning | Accuracy = 95% Precision = 94.50% Recall = 90.50% F1 score = 91.75% |
| [29] | 2018 | Rice | Bacterial Blight Sheath Blight Brown Spot Leaf Blast | International Rice Research Institute (IRRI) database | Drone Camera GPS sensor | Support vector machine (SVM) | Only disease boundary detected |
Publisher’s Note: MDPI stays neutral with regard to jurisdictional claims in published maps and institutional affiliations. |
© 2021 by the authors. Licensee MDPI, Basel, Switzerland. This article is an open access article distributed under the terms and conditions of the Creative Commons Attribution (CC BY) license (https://creativecommons.org/licenses/by/4.0/).
Share and Cite
Kundu, N.; Rani, G.; Dhaka, V.S.; Gupta, K.; Nayak, S.C.; Verma, S.; Ijaz, M.F.; Woźniak, M. IoT and Interpretable Machine Learning Based Framework for Disease Prediction in Pearl Millet. Sensors 2021, 21, 5386. https://doi.org/10.3390/s21165386
Kundu N, Rani G, Dhaka VS, Gupta K, Nayak SC, Verma S, Ijaz MF, Woźniak M. IoT and Interpretable Machine Learning Based Framework for Disease Prediction in Pearl Millet. Sensors. 2021; 21(16):5386. https://doi.org/10.3390/s21165386
Chicago/Turabian StyleKundu, Nidhi, Geeta Rani, Vijaypal Singh Dhaka, Kalpit Gupta, Siddaiah Chandra Nayak, Sahil Verma, Muhammad Fazal Ijaz, and Marcin Woźniak. 2021. "IoT and Interpretable Machine Learning Based Framework for Disease Prediction in Pearl Millet" Sensors 21, no. 16: 5386. https://doi.org/10.3390/s21165386