
Learning Carbohydrate Digestion and Insulin Absorption Curves Using Blood Glucose Level Prediction and Deep Learning Models


Abstract
:1. Introduction
2. State of the Art
3. Materials and Methods
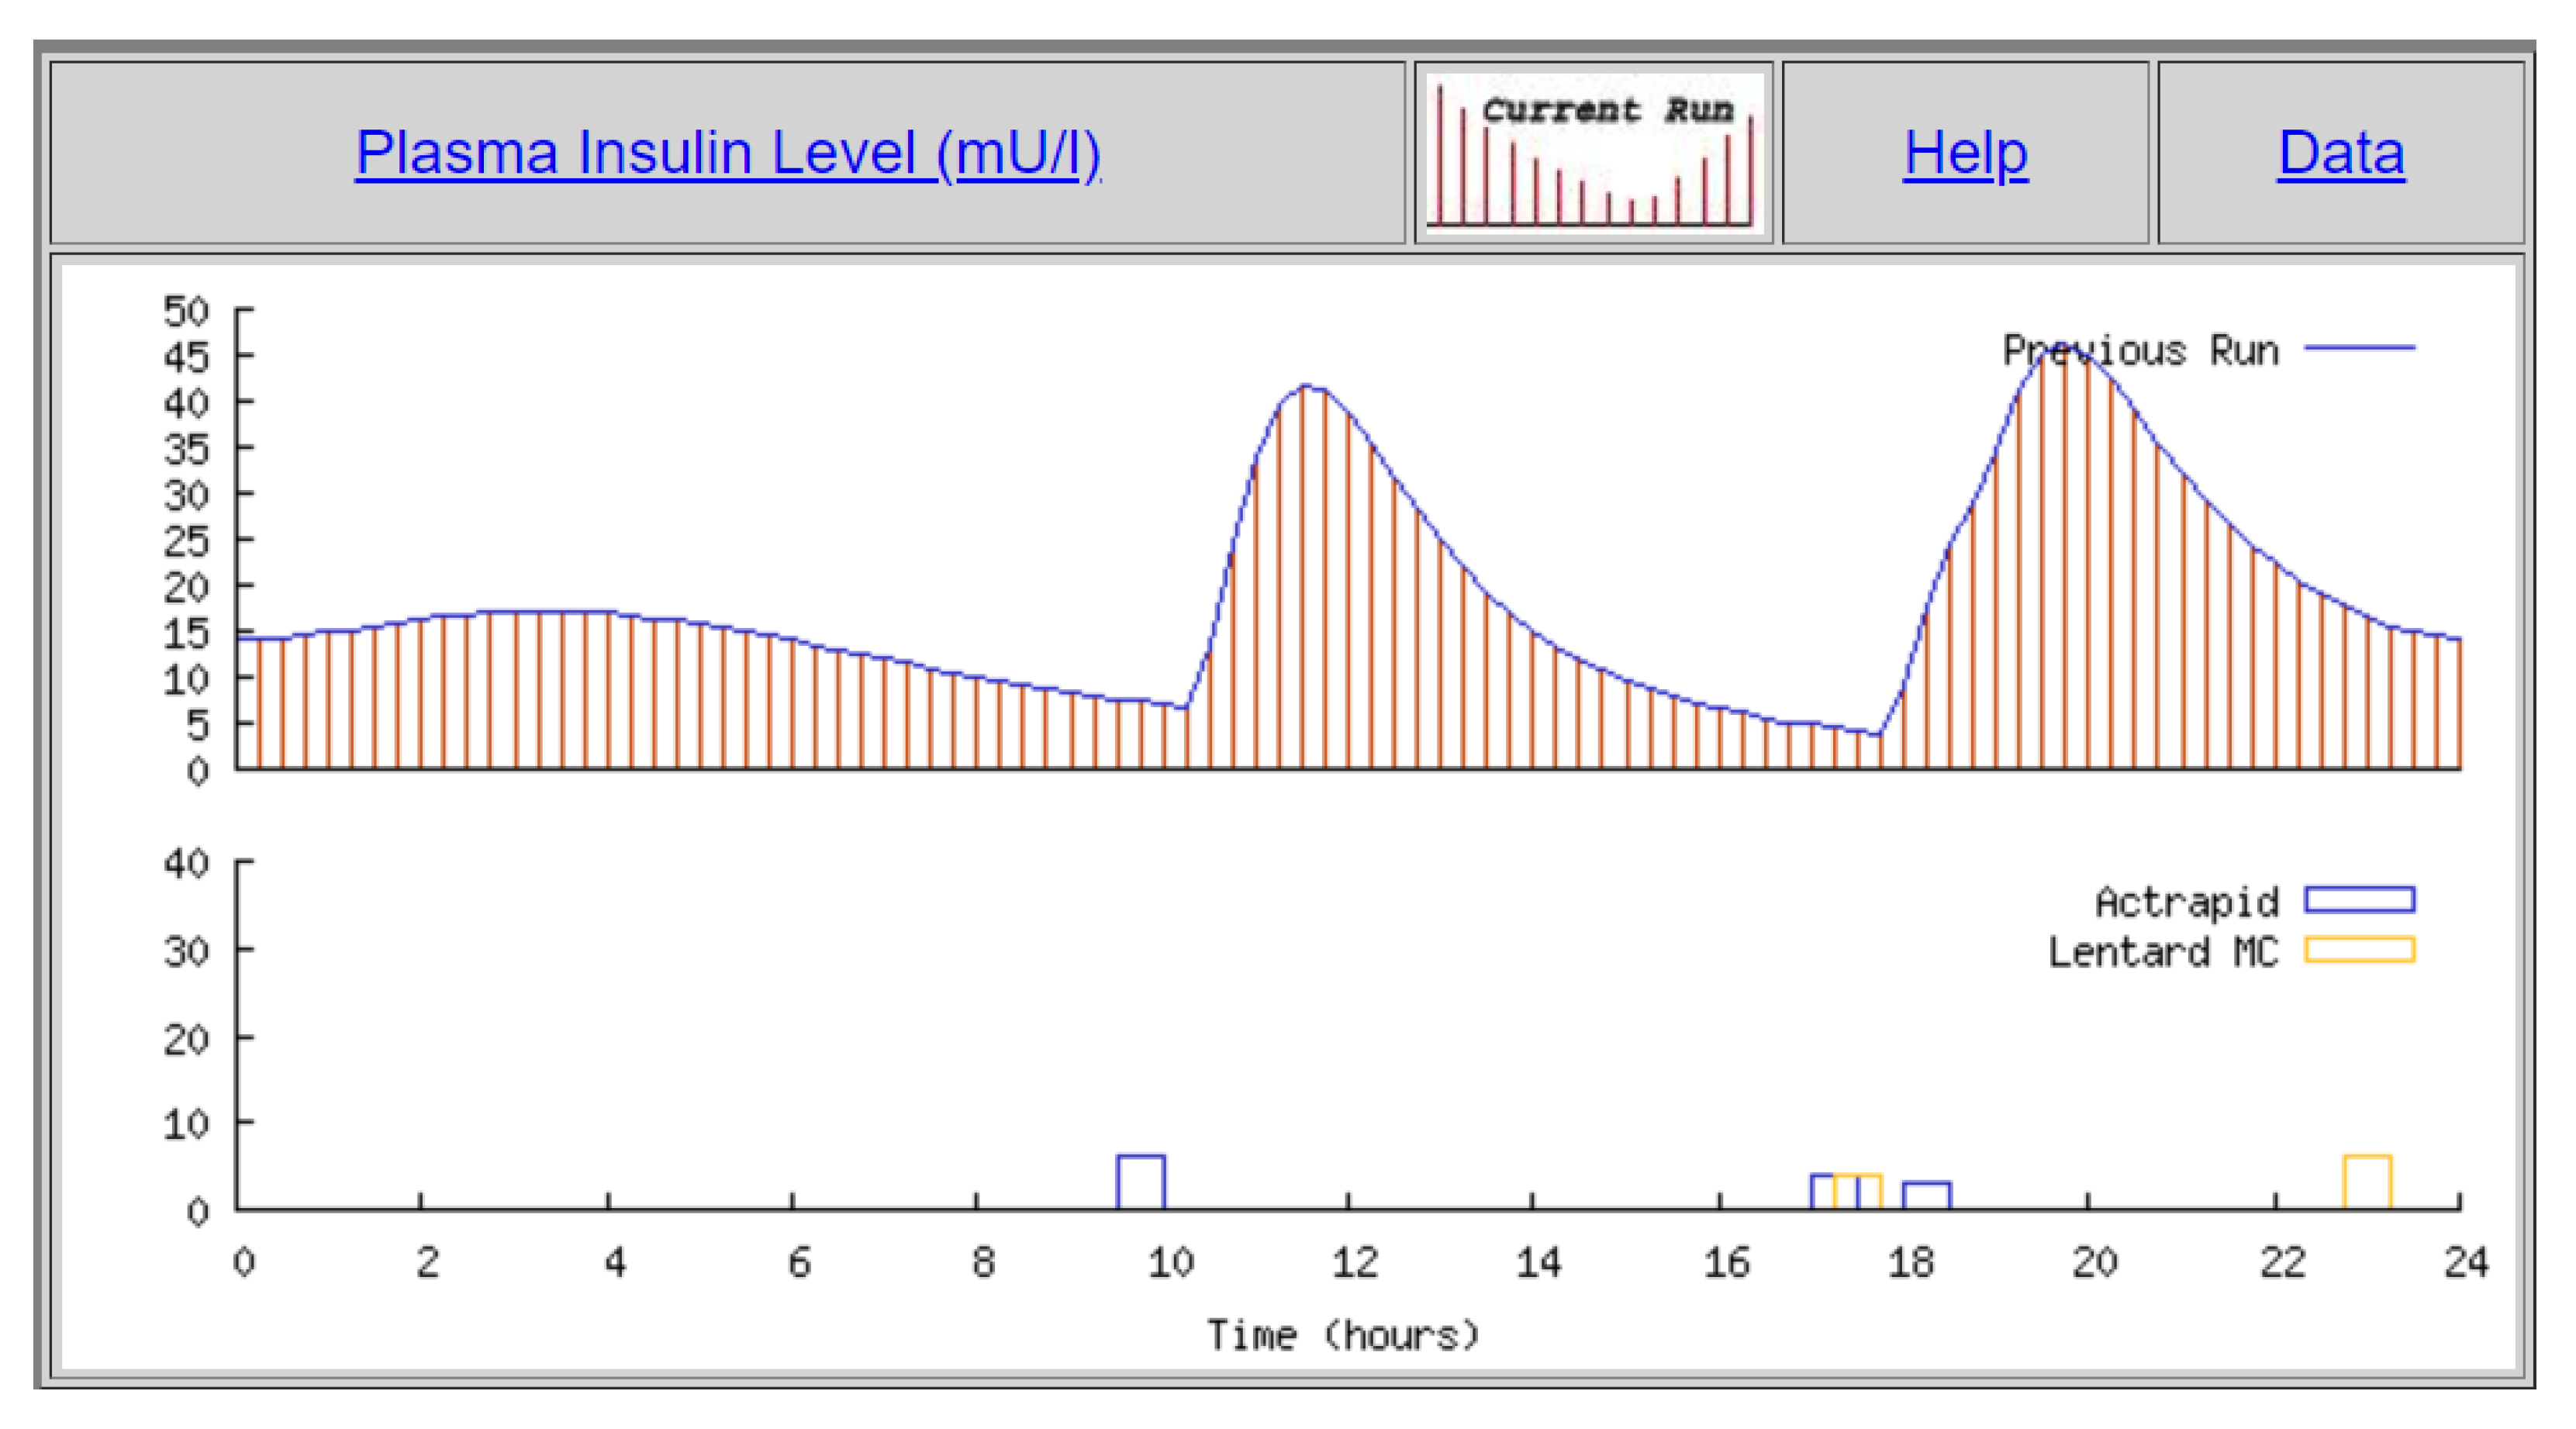
3.1. Dataset Used
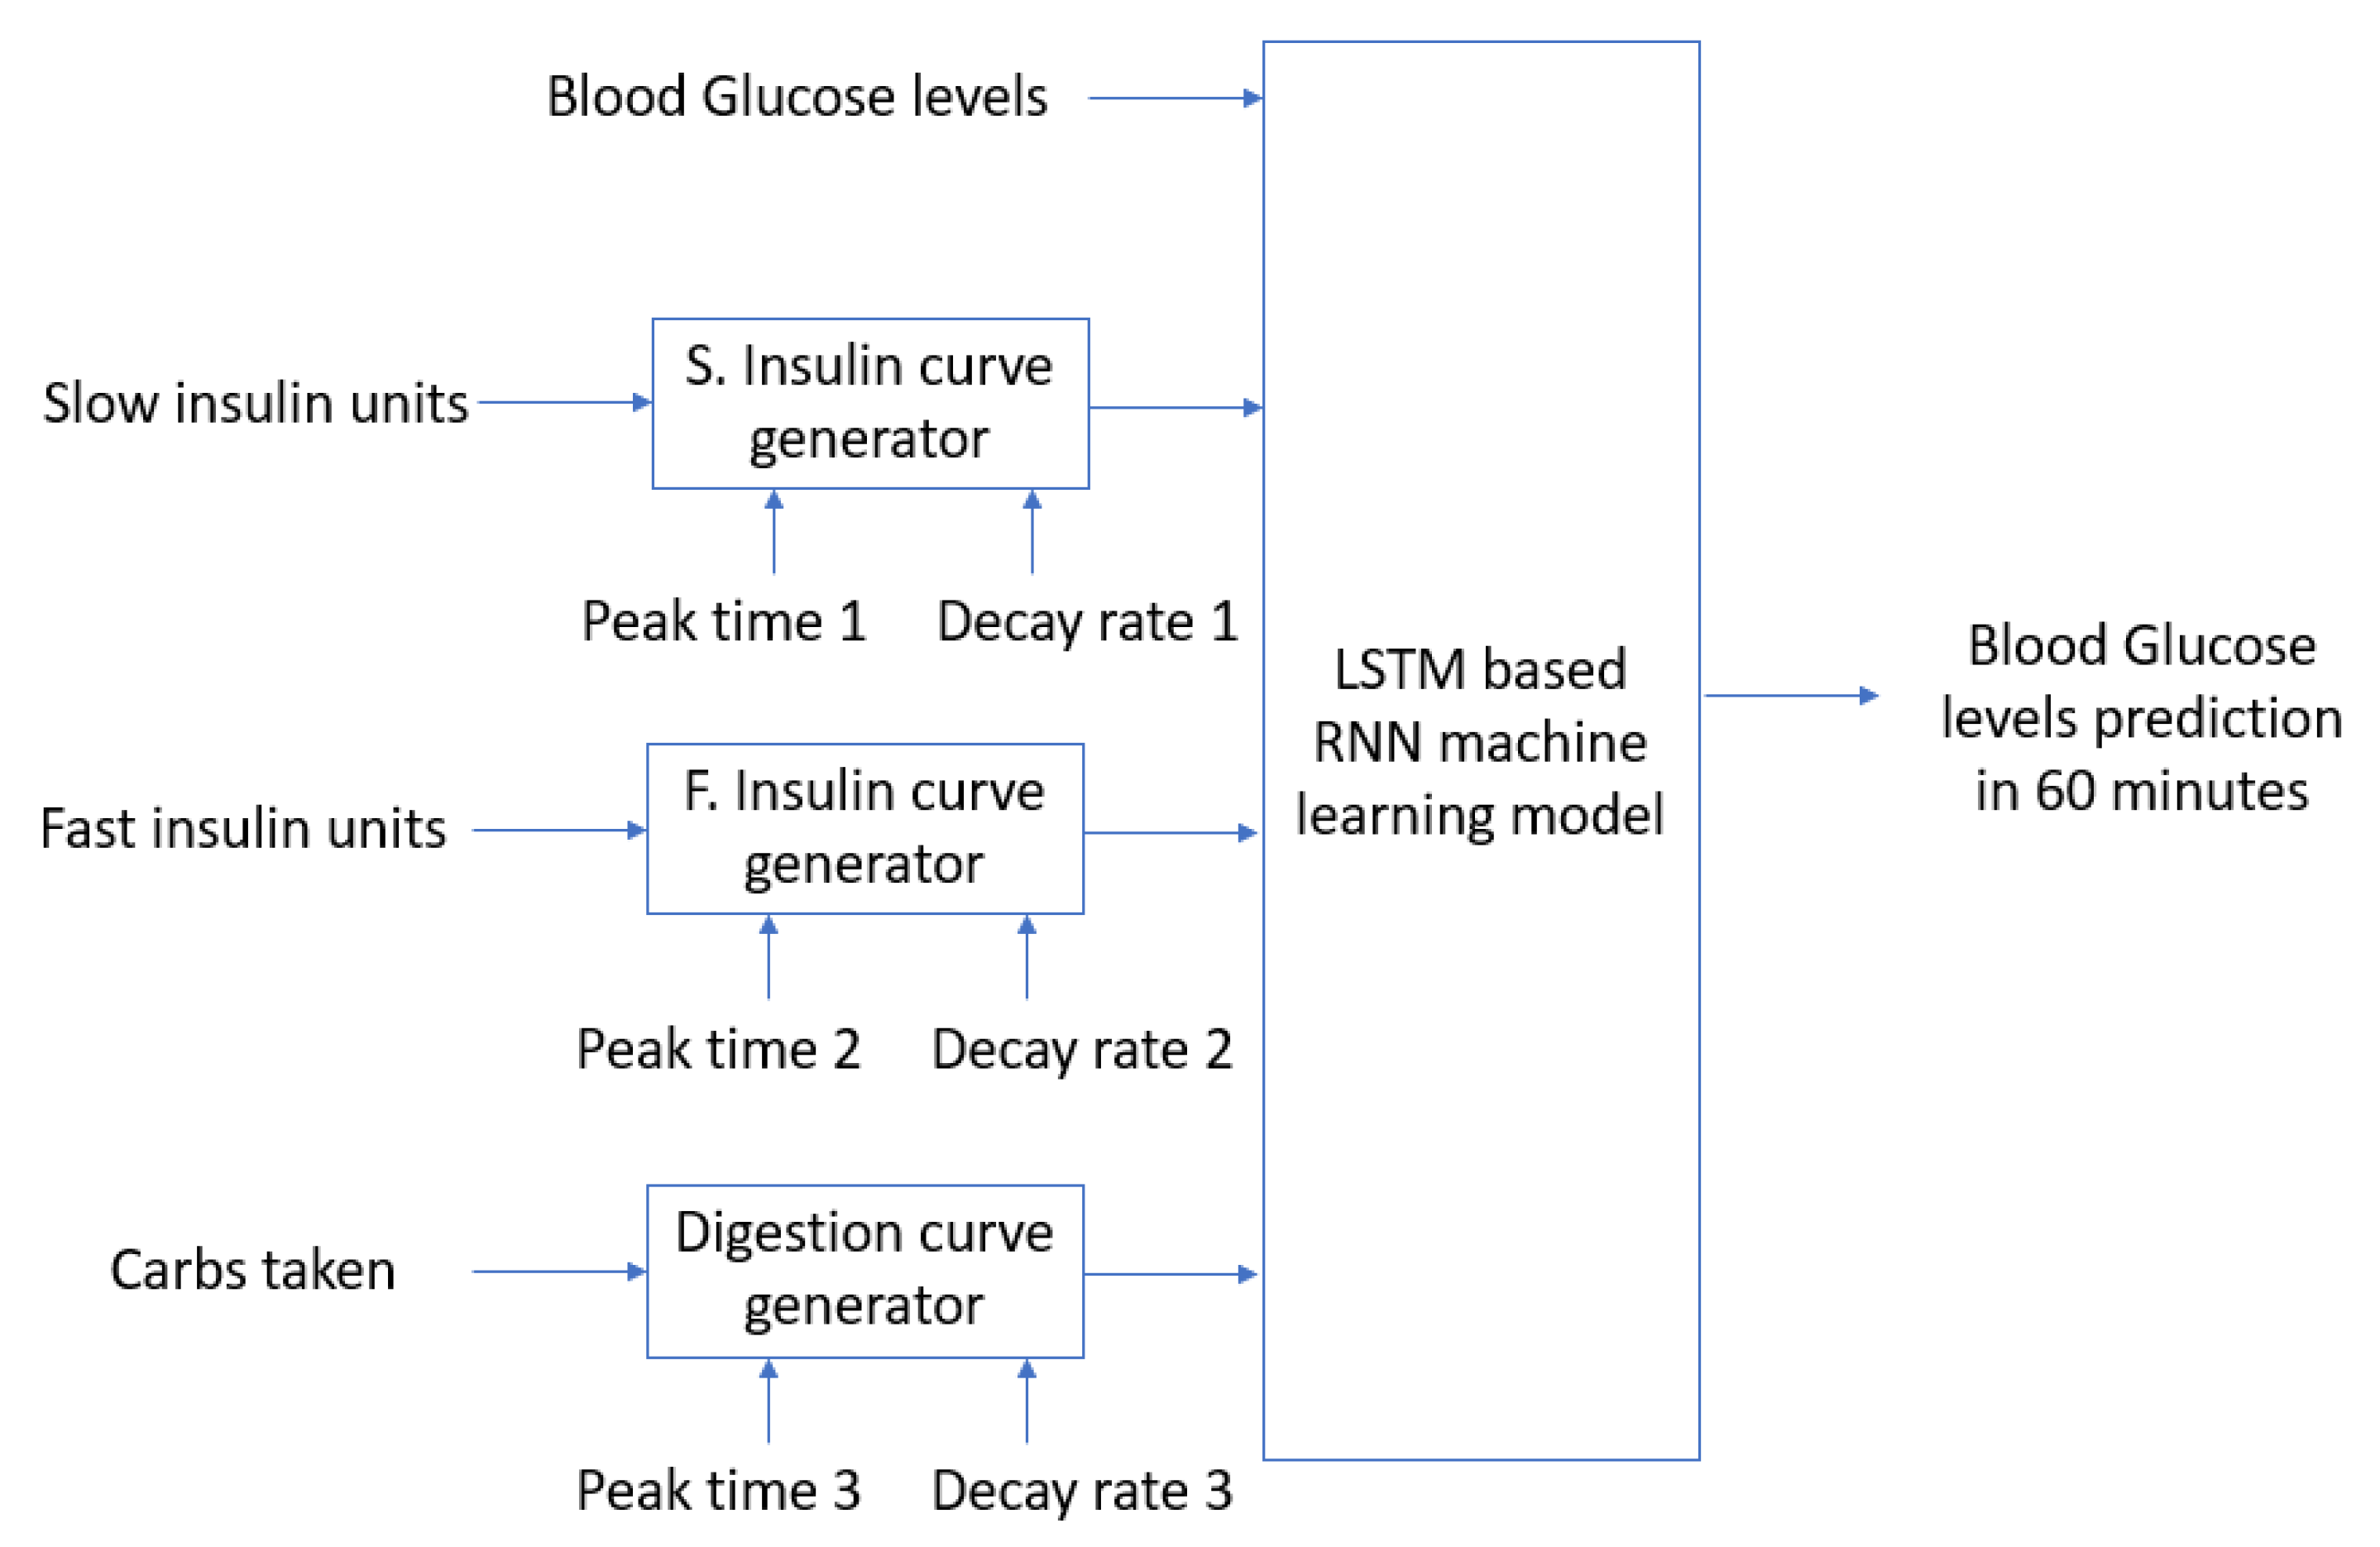
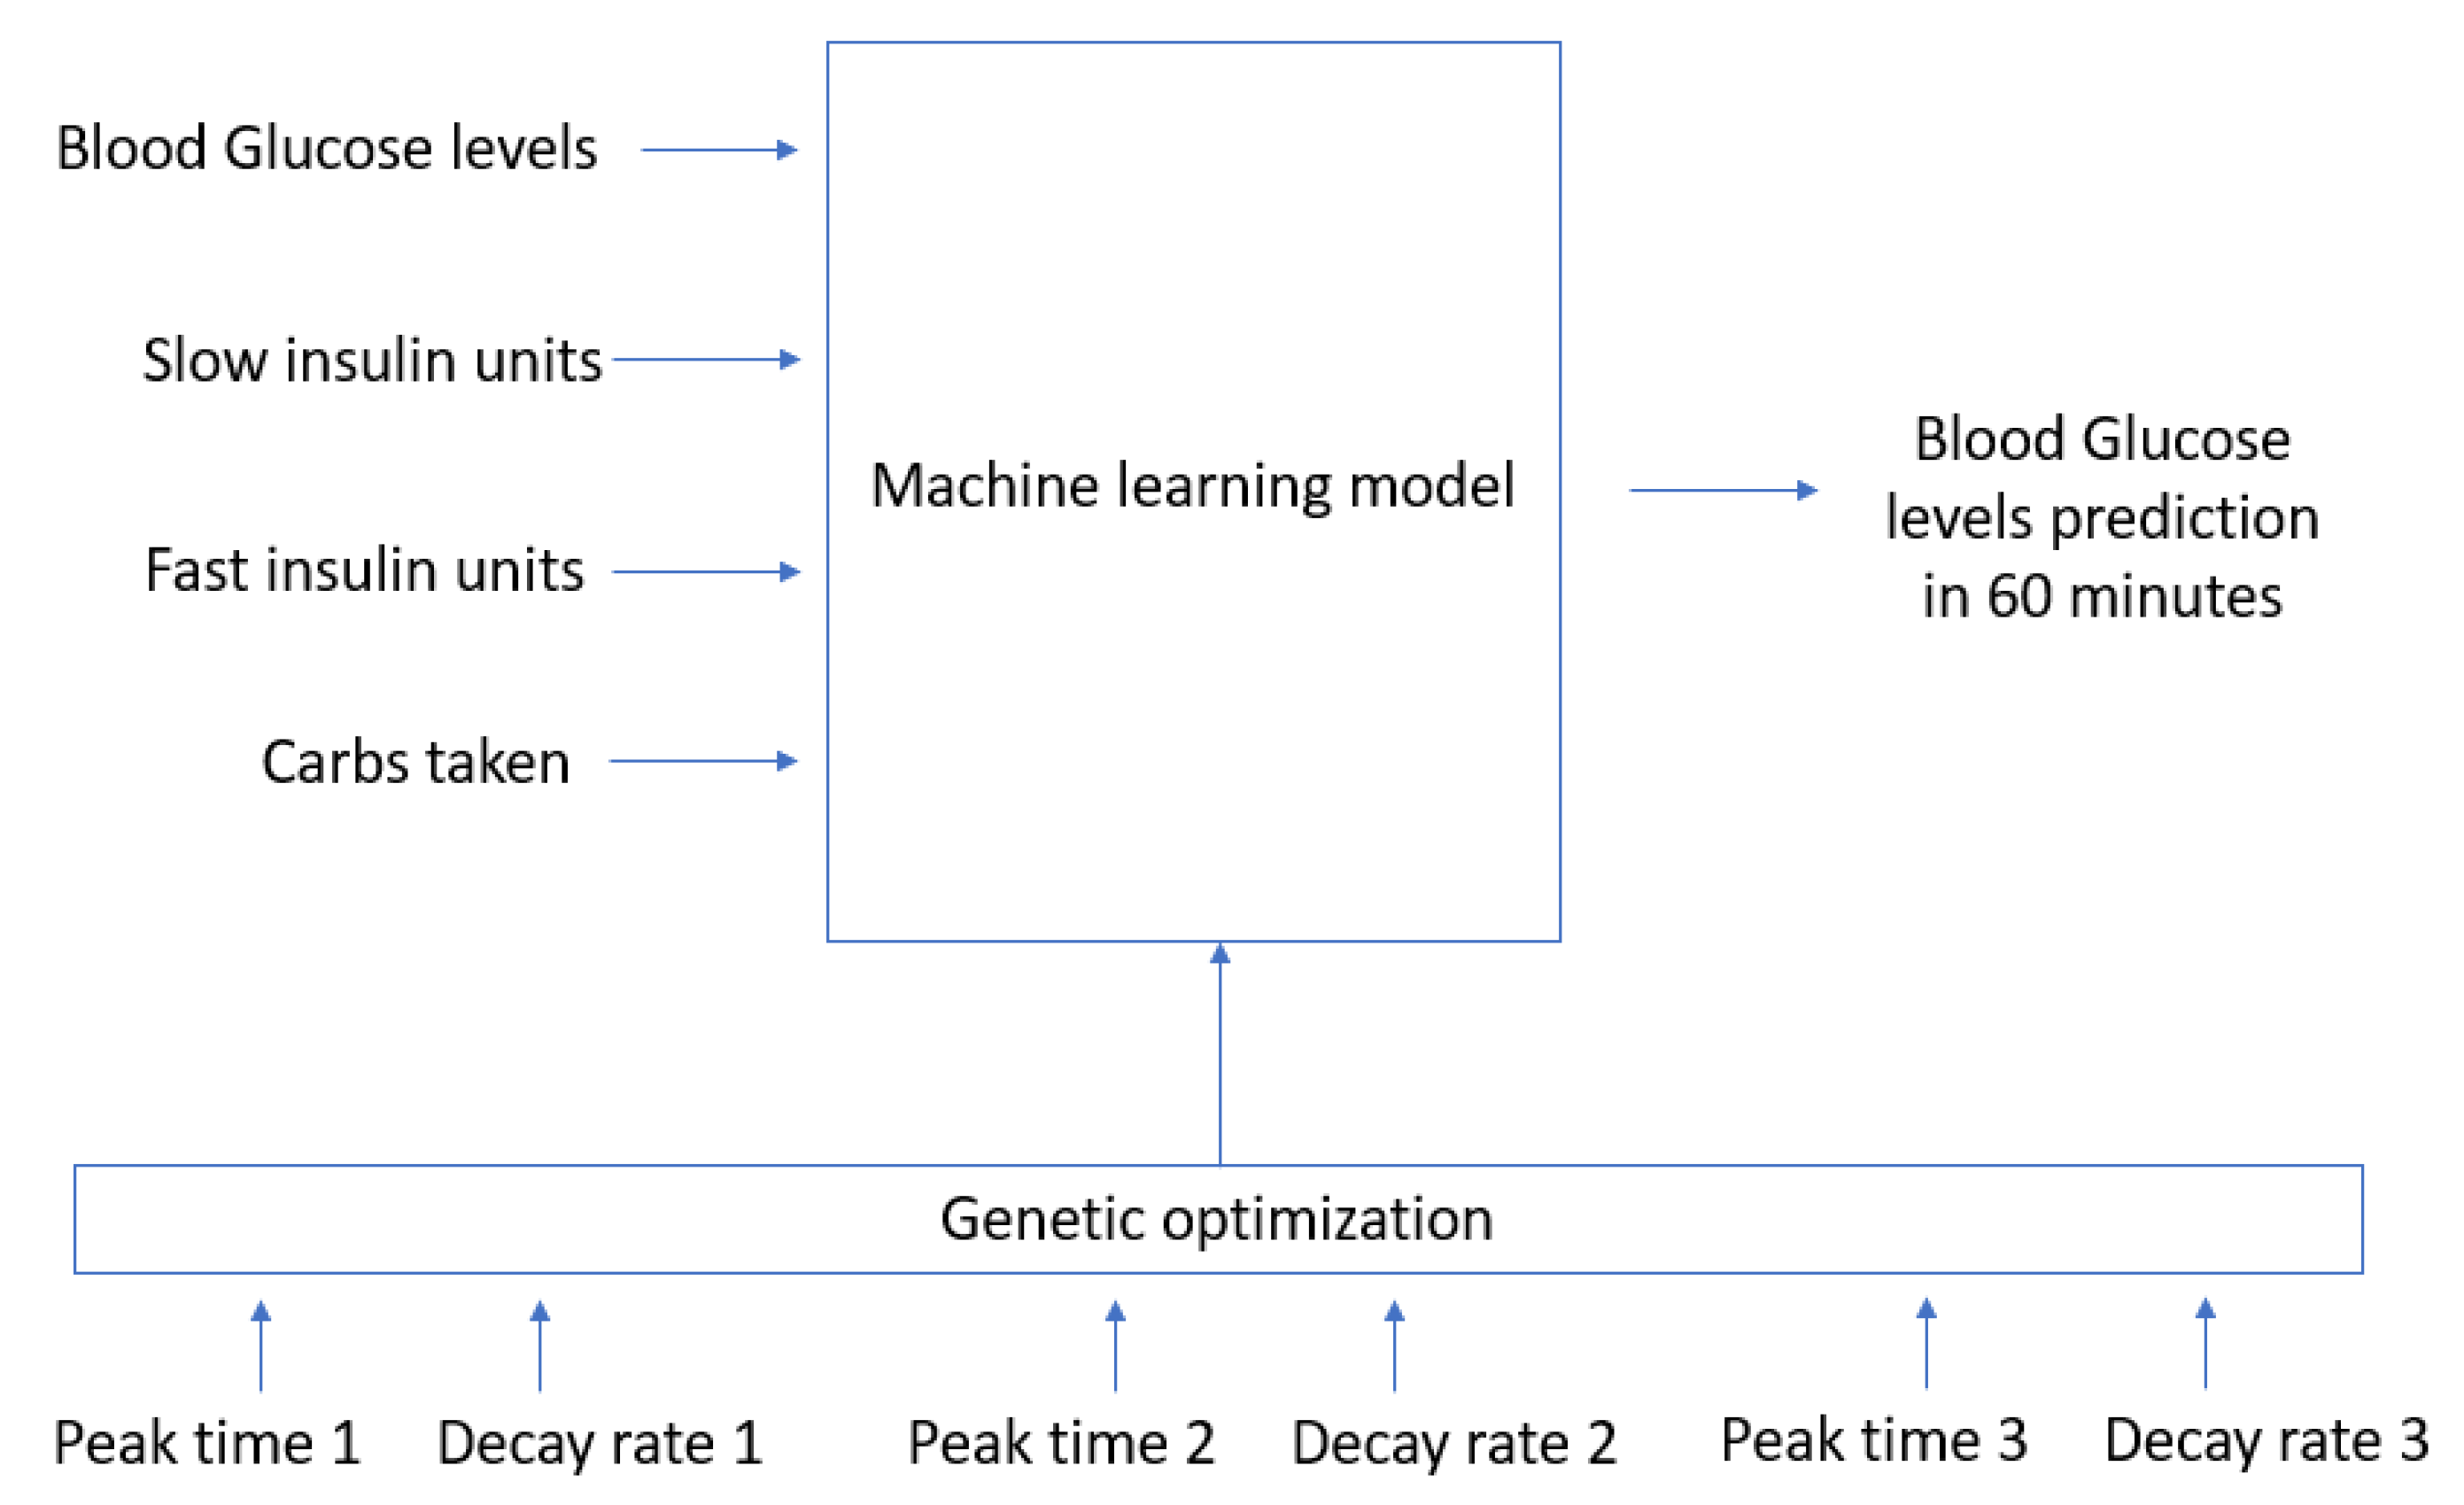
3.2. Proposed Model
4. Experimental Results
4.1. Software Configuration
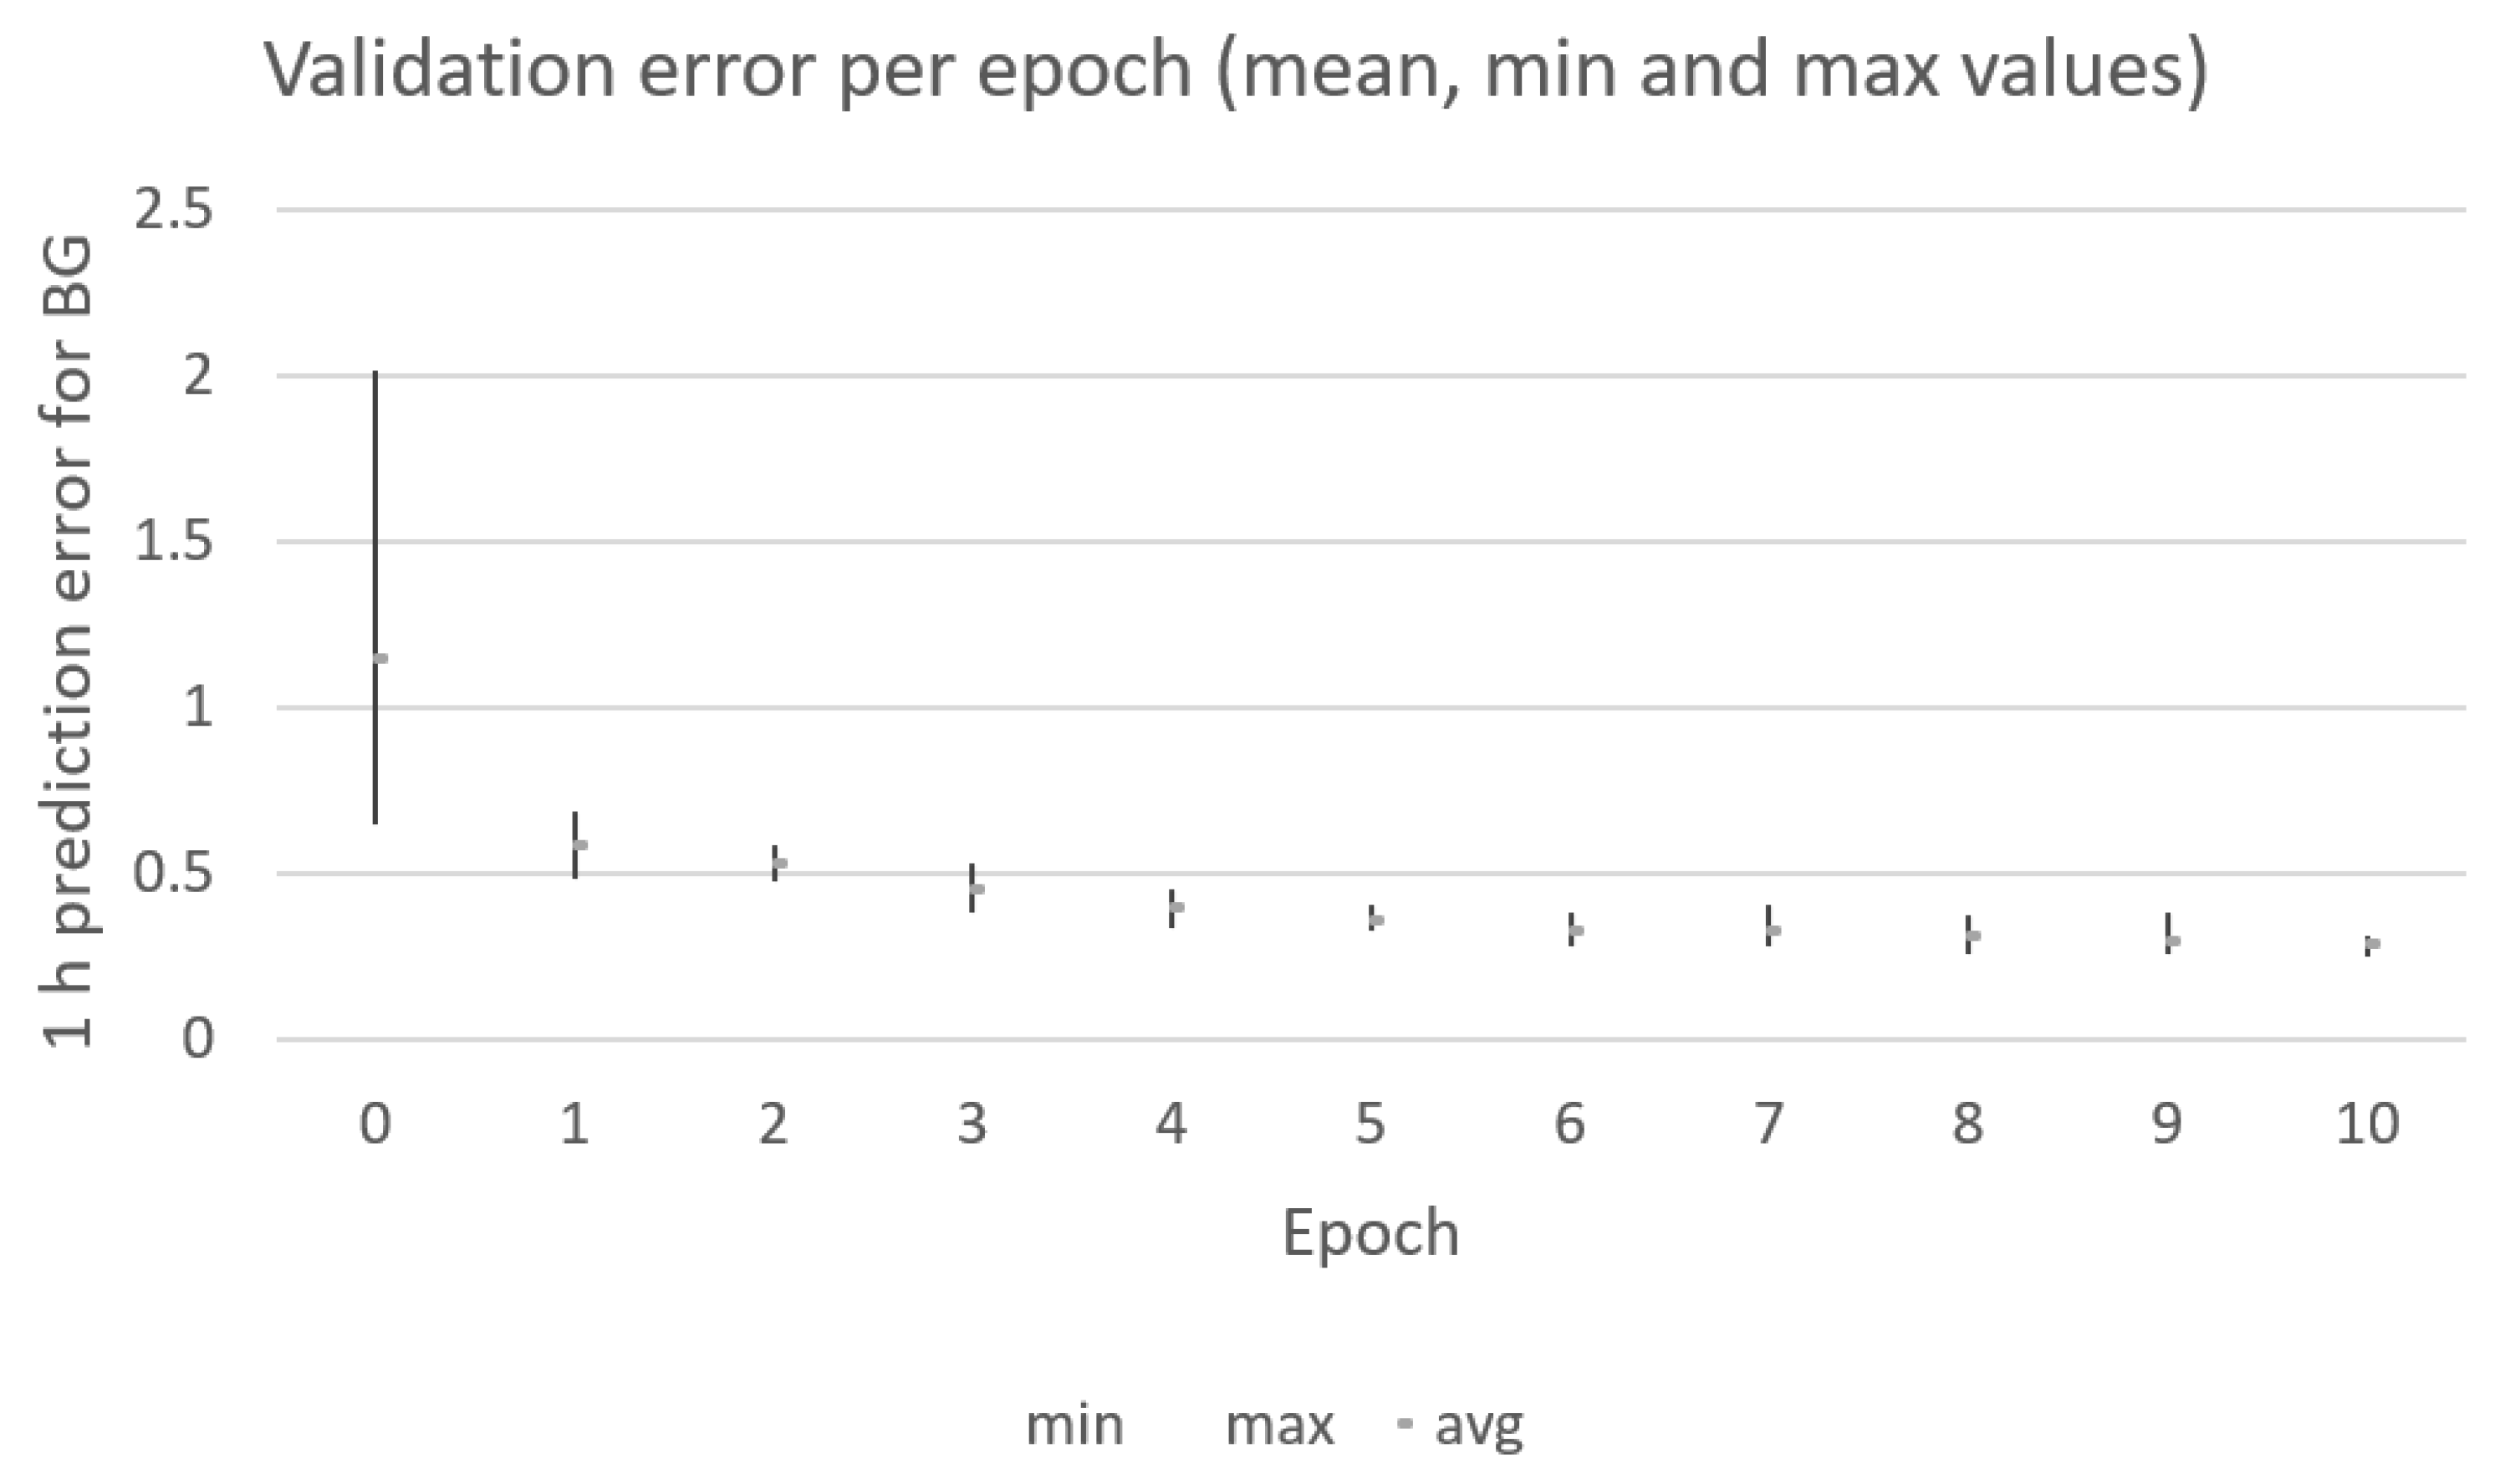
4.2. Numerical Results
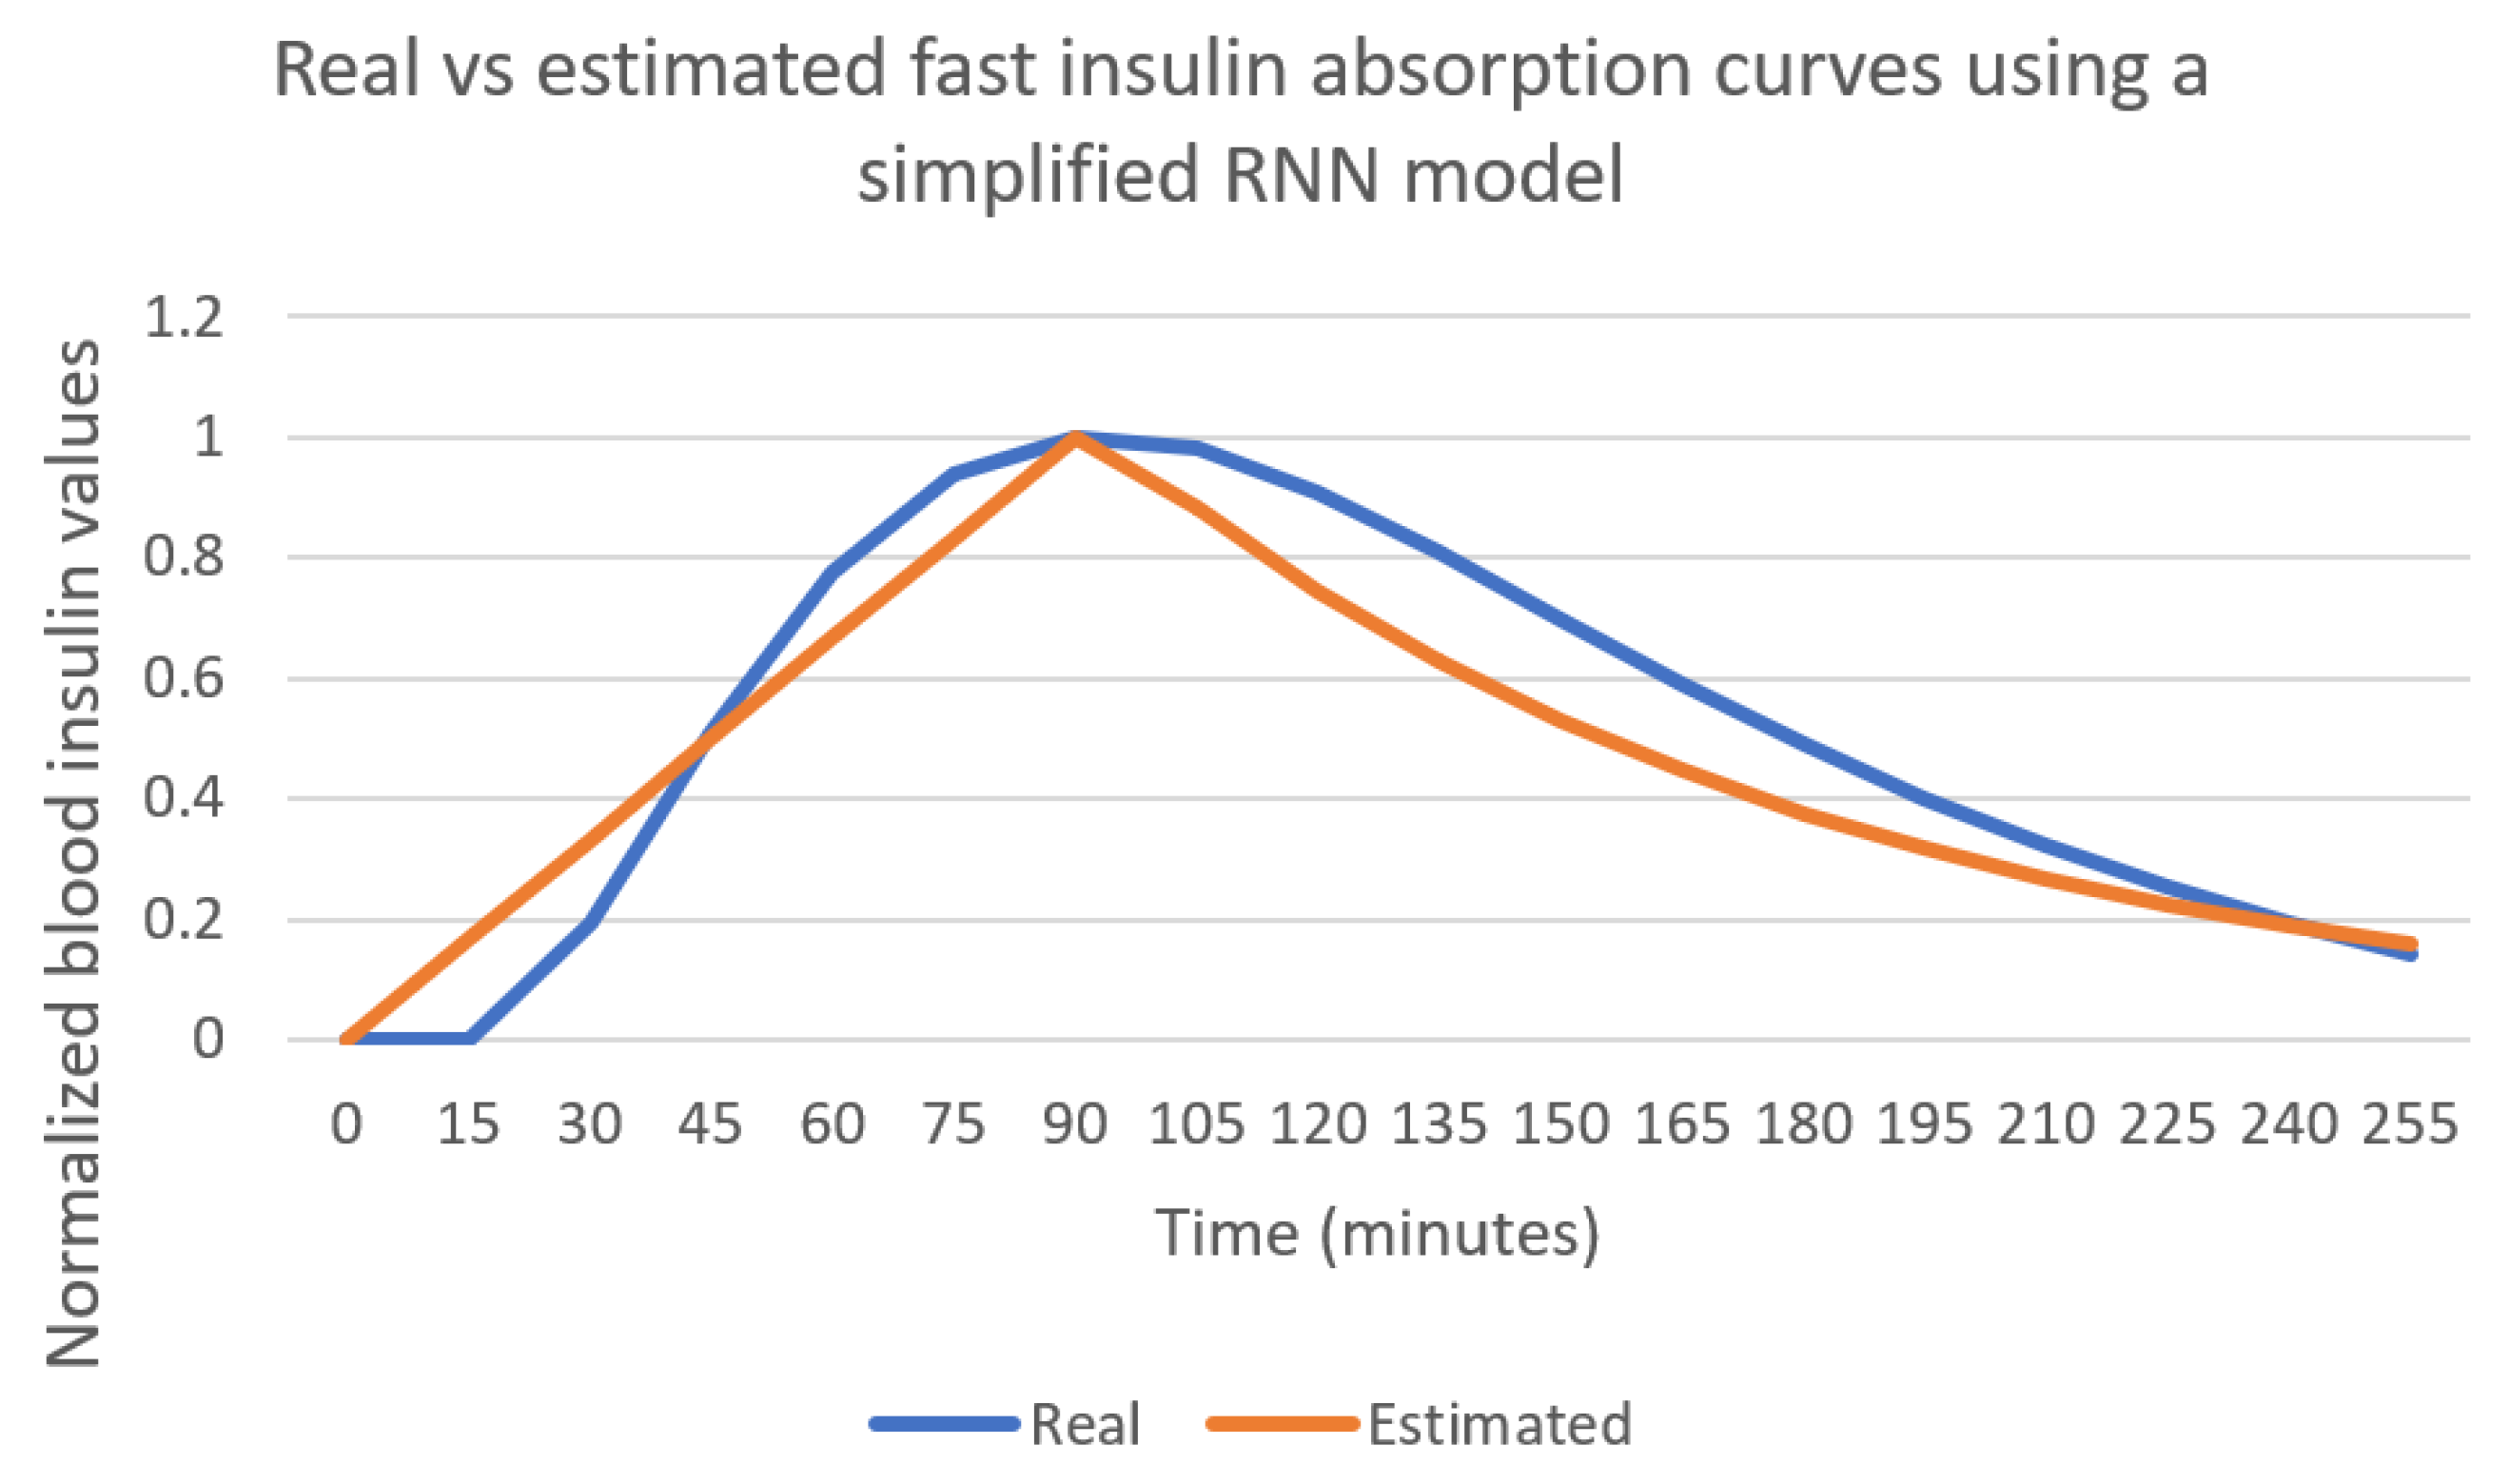
4.3. Using a Simple Model Results
5. Conclusions
Author Contributions
Funding
Data Availability Statement
Conflicts of Interest
References
- Wei, S.; Zhao, X.; Miao, C. A comprehensive exploration to the machine learning techniques for diabetes identification. In Proceedings of the 2018 IEEE 4th World Forum on Internet of Things (WF-IoT), Singapore, 5–8 February 2018; pp. 291–295. [Google Scholar]
- De Bois, M.; El Yacoubi, M.A.; Ammi, M. Study of Short-Term Personalized Glucose Predictive Models on Type-1 Diabetic Children. In Proceedings of the 2019 International Joint Conference on Neural Networks (IJCNN), Budapest, Hungary, 14–19 July 2019; pp. 1–8. [Google Scholar] [CrossRef]
- Sun, Q.; Jankovic, M.V.; Bally, L.; Mougiakakou, S.G. Predicting blood glucose with an LSTM and Bi-LSTM based deep neural network. In Proceedings of the 2018 14th Symposium on Neural Networks and Applications (NEUREL), Belgrade, Servia, 20–21 November 2018; pp. 1–5. [Google Scholar]
- Ruan, Y.; Wilinska, M.E.; Thabit, H.; Hovorka, R. Modeling day-to-day variability of glucose–insulin regulation over 12-week home use of closed-loop insulin delivery. IEEE Trans. Biomed. Eng. 2016, 64, 1412–1419. [Google Scholar] [CrossRef] [PubMed]
- Man, C.D.; Rizza, R.A.; Cobelli, C. Meal simulation model of the glucose-insulin system. Trans. Biomed. Eng. 2007, 54, 1740–1749. [Google Scholar]
- Wilinska, M.; Chassin, L.; Schaller, H.; Schaupp, L.; Pieber, T.; Hovorka, R. Insulin Kinetics in Type-1 Diabetes: Continuous and Bolus Delivery of Rapid Acting Insulin. IEEE. Trans. Biomed. Eng. 2005, 52, 3–12. [Google Scholar] [CrossRef] [PubMed]
- Roman, H.; Canonico, V.; Chassin, L.J.; Haueter, U.; Massi-Benedetti, M.; Federici, M.O.; Pieber, T.R.; Schaller, H.C.; Schaupp, L.; Vering, T.; et al. Nonlinear model predictive control of glucose concentration in subjects with type 1 diabetes. Physiol. Meas. 2004, 25, 905. [Google Scholar]
- Hajizadeh, I.; Rashid, M.; Samadi, S.; Feng, J.; Sevil, M.; Hobbs, N.; Lazaro, C.; Maloney, Z.; Brandt, R.; Yu, X.; et al. Adaptive and personalized plasma insulin concentration estimation for artificial pancreas systems. J. Diabetes Sci. Technol. 2018, 12, 639–649. [Google Scholar] [CrossRef] [PubMed] [Green Version]
- Haiya, W.; LI, J.; Yang, K. Mathematical Modeling and Qualitative Analysis of Insulin Therapies. 2007. Available online: https://www.sciencedirect.com/science/article/pii/S0025556407001058 (accessed on 25 May 2021).
- Lehmann, E.D.; Deutsch, T. AIDA Technical Guide. Available online: http://www.2aida.org/aida/technical.htm (accessed on 4 May 2021).
- Guyton, J.R.; Foster, R.O.; Soeldner, J.S.; Tan, M.H.; Kahn, C.B.; Koncz, L.; Gleason, R.E. A model of glucose-insulin homeostasis in man that incorporates the heterogenous fast pool theory of pancreatic insulin release. Diabetes 1978, 27, 1027–1042. [Google Scholar] [CrossRef] [PubMed]
- Lehmann, E.D. The freeware AIDA interactive educational diabetes simulator. Med. Sci. Monit. 2001, 7, 504–515. [Google Scholar] [PubMed]
- Pappada, S.M.; Cameron, B.D.; Rosman, P.M. Development of a neural network for prediction of glucose concentration in type 1 diabetes patients. J. Diabetes Sci. Technol. 2008, 2, 792–801. [Google Scholar] [CrossRef] [PubMed] [Green Version]
- Plis, K.; Bunescu, R.; Marling, C.; Shubrook, J.; Schwartz, F. A machine learning approach to predicting blood glucose levels for diabetes management. In Proceedings of the Workshops at the Twenty-Eighth AAAI Conference on Artificial Intelligence, Québec City, QC, Canada, 27–28 July 2014. [Google Scholar]
- Hamdi, T.; Ali, J.B.; Di Costanzo, V.; Fnaiech, F.; Moreau, E.; Ginoux, J.M. Accurate prediction of continuous blood glucose based on support vector regression and differential evolution algorithm. Biocybern. Biomed. Eng. 2018, 38, 362–372. [Google Scholar] [CrossRef]
- Ali, J.B.; Hamdi, T.; Fnaiech, N.; Di Costanzo, V.; Fnaiech, F.; Ginoux, J.M. Continuous blood glucose level prediction of Type 1 Diabetes based on Artificial Neural Network. Biocybern. Biomed. Eng. 2018, 38, 828–840. [Google Scholar]
- Naumova, V.; Pereverzyev, S.V.; Sivananthan, S. A meta-learning approach to the regularized learning—Case study: Blood glucose prediction. Neural Netw. 2012, 33, 181–193. [Google Scholar] [CrossRef] [Green Version]
- Fox, I.; Ang, L.; Jaiswal, M.; Pop-Busui, R.; Wiens, J. Deep multi-output forecasting: Learning to accurately predict blood glucose trajectories. In Proceedings of the 24th ACM SIGKDD International Conference on Knowledge Discovery & Data Mining, London, UK, 19–23 August 2018; pp. 1387–1395. [Google Scholar]
- Mhaskar, H.N.; Pereverzyev, S.V.; van der Walt, M.D. A deep learning approach to diabetic blood glucose prediction. Front. Appl. Math. Stat. 2017, 3, 14. [Google Scholar] [CrossRef] [Green Version]
- Robertson, G.; Lehmann, E.D.; Sandham, W.; Hamilton, D. Blood glucose prediction using artificial neural networks trained with the AIDA diabetes simulator: A proof-of-concept pilot study. J. Electr. Comput. Eng. 2011. [Google Scholar] [CrossRef]
- Munoz-Organero, M. Deep Physiological Model for Blood Glucose Prediction in T1DM Patients. Sensors 2020, 20, 3896. [Google Scholar] [CrossRef]
- Matthews, D.R.; Rudenski, A.S.; Burnett, M.A.; Darling, P.; Turner, R.C. The half-life of endogenous insulin and C-peptide in man assessed by somatostatin suppression. Clin. Endocrinol. 1985, 23, 71–79. [Google Scholar] [CrossRef] [PubMed]
- Baeck, T.; Fogel, D.B.; Michalewicz, Z. Evolutionary Computation 1: Basic Algorithms and Operators; Institute of Physics Publishing: Bristol, UK; Philadelphia, PA, USA, 2000. [Google Scholar]
- The DEAP Project. DEAP Documentation. Available online: https://deap.readthedocs.io/en/master/ (accessed on 5 May 2021).
- The Keras Team. The Keras Deep Learning Library. Available online: https://keras.io/ (accessed on 5 May 2021).


| Parameter | Value |
|---|---|
| Number of simulated patients | 40 |
| Number of days per patient | 8 |
| Average number of insulin boluses per day | 4 |
| Average number of meals per day | 6 |
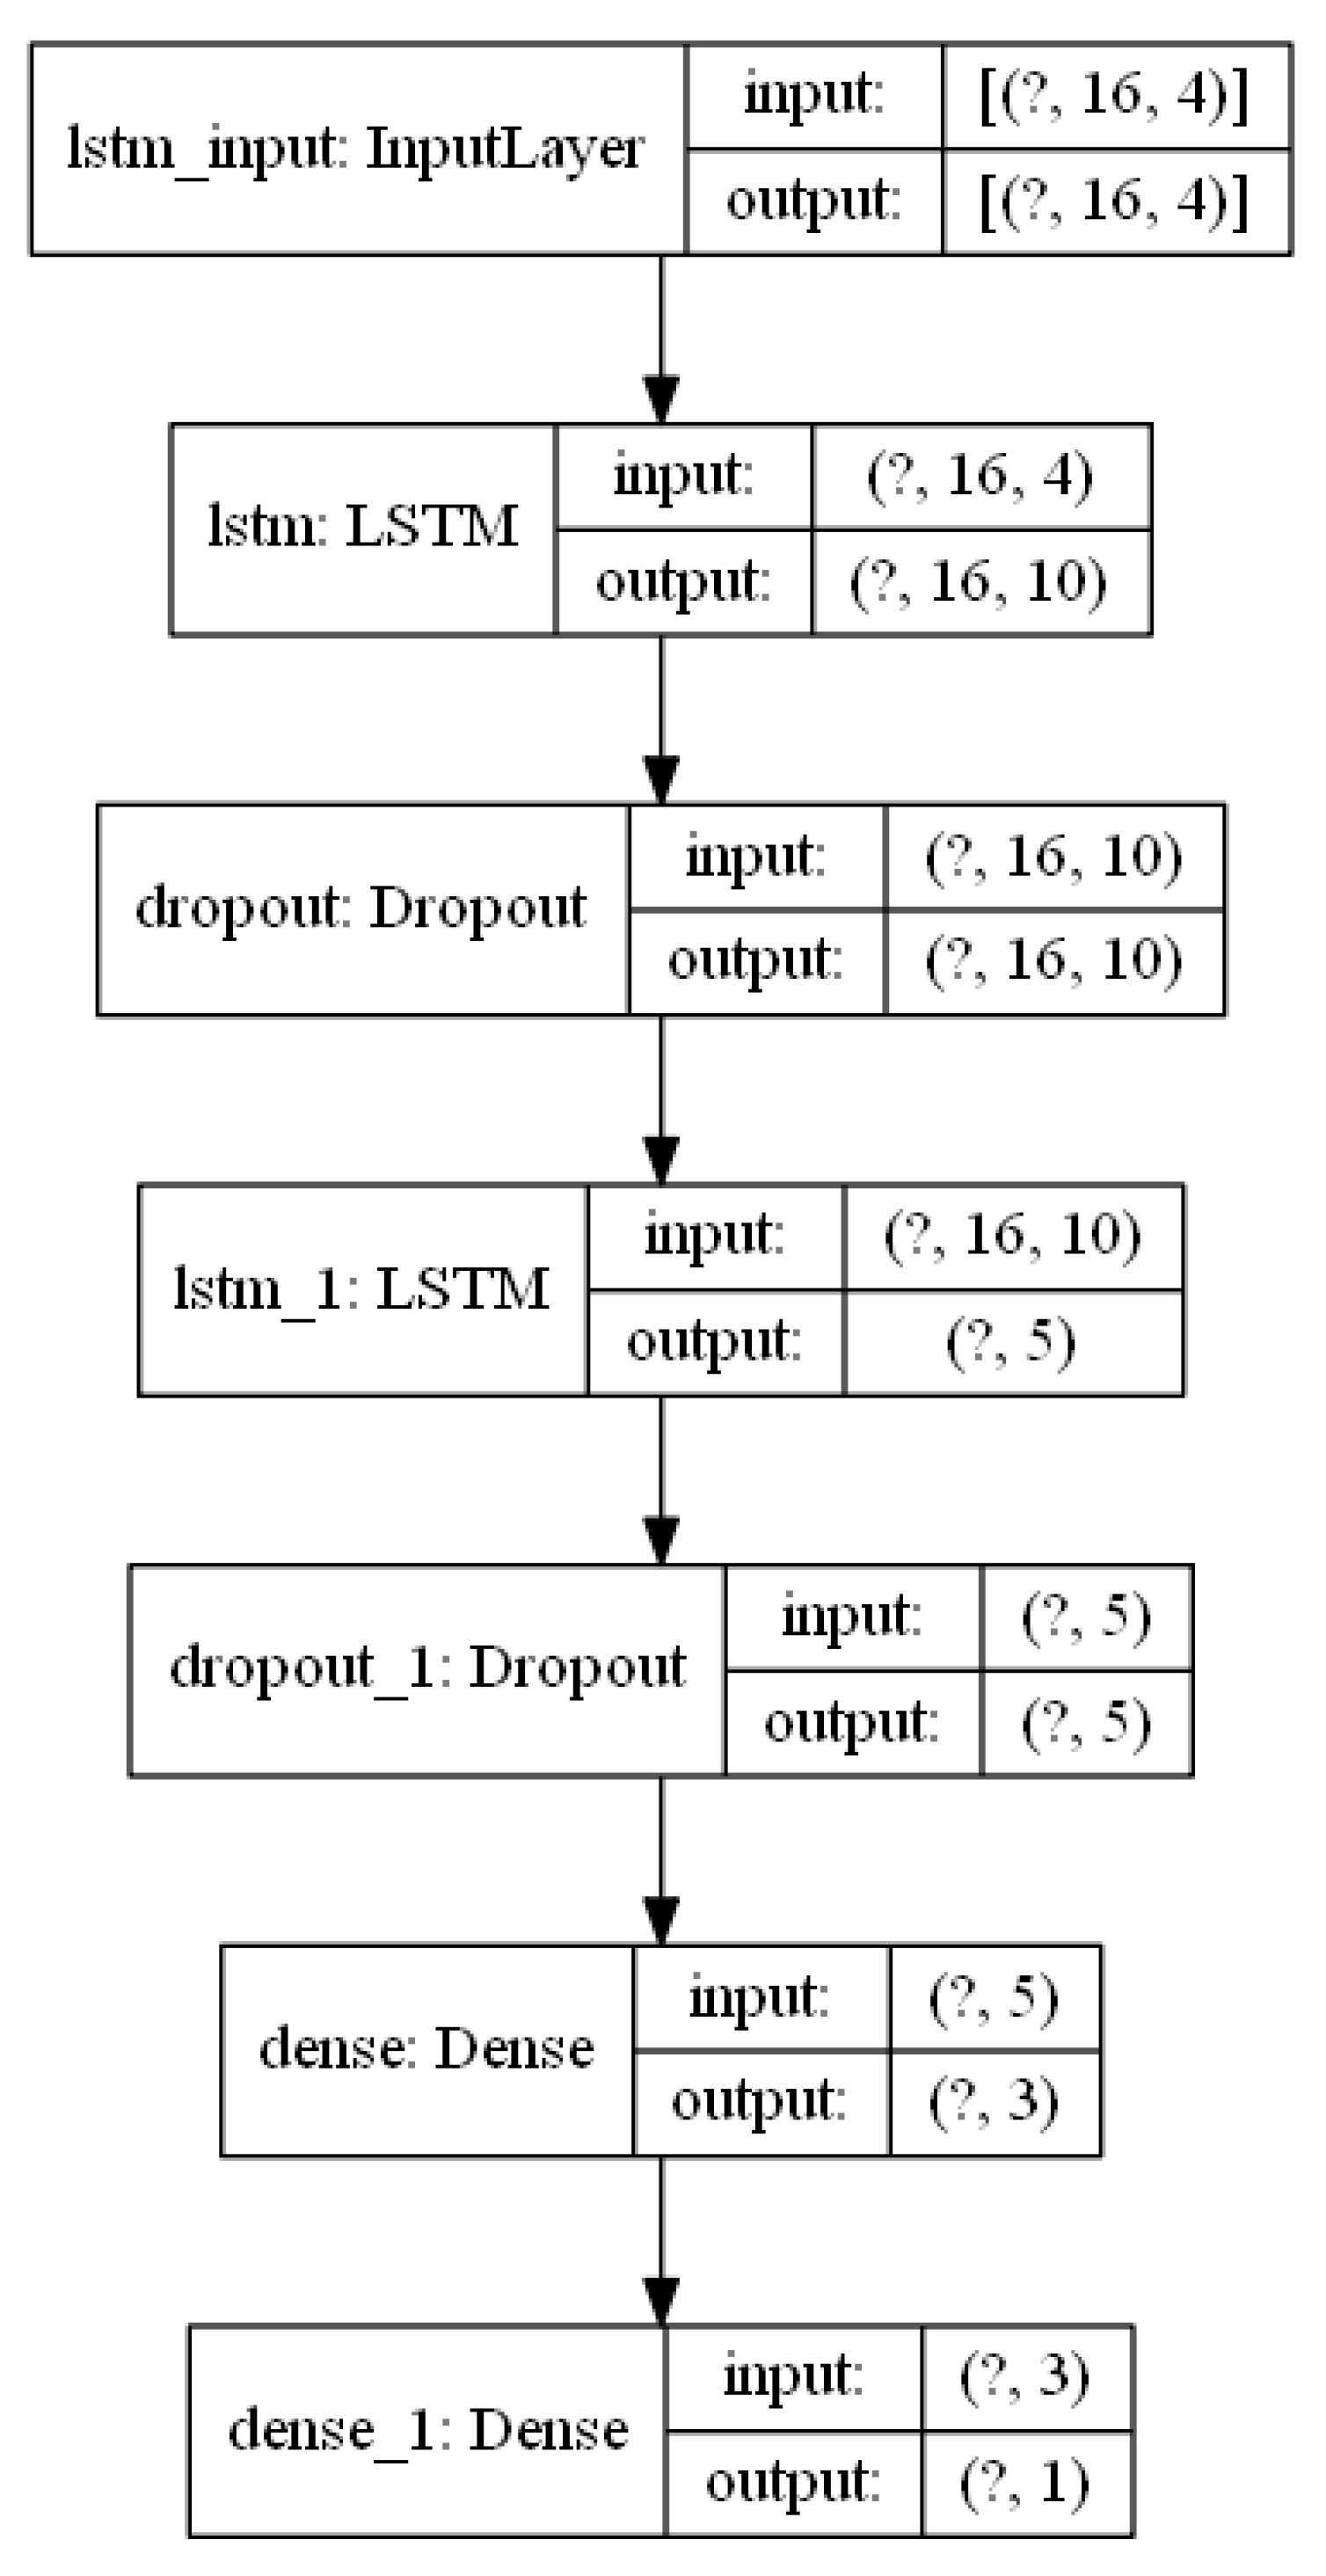
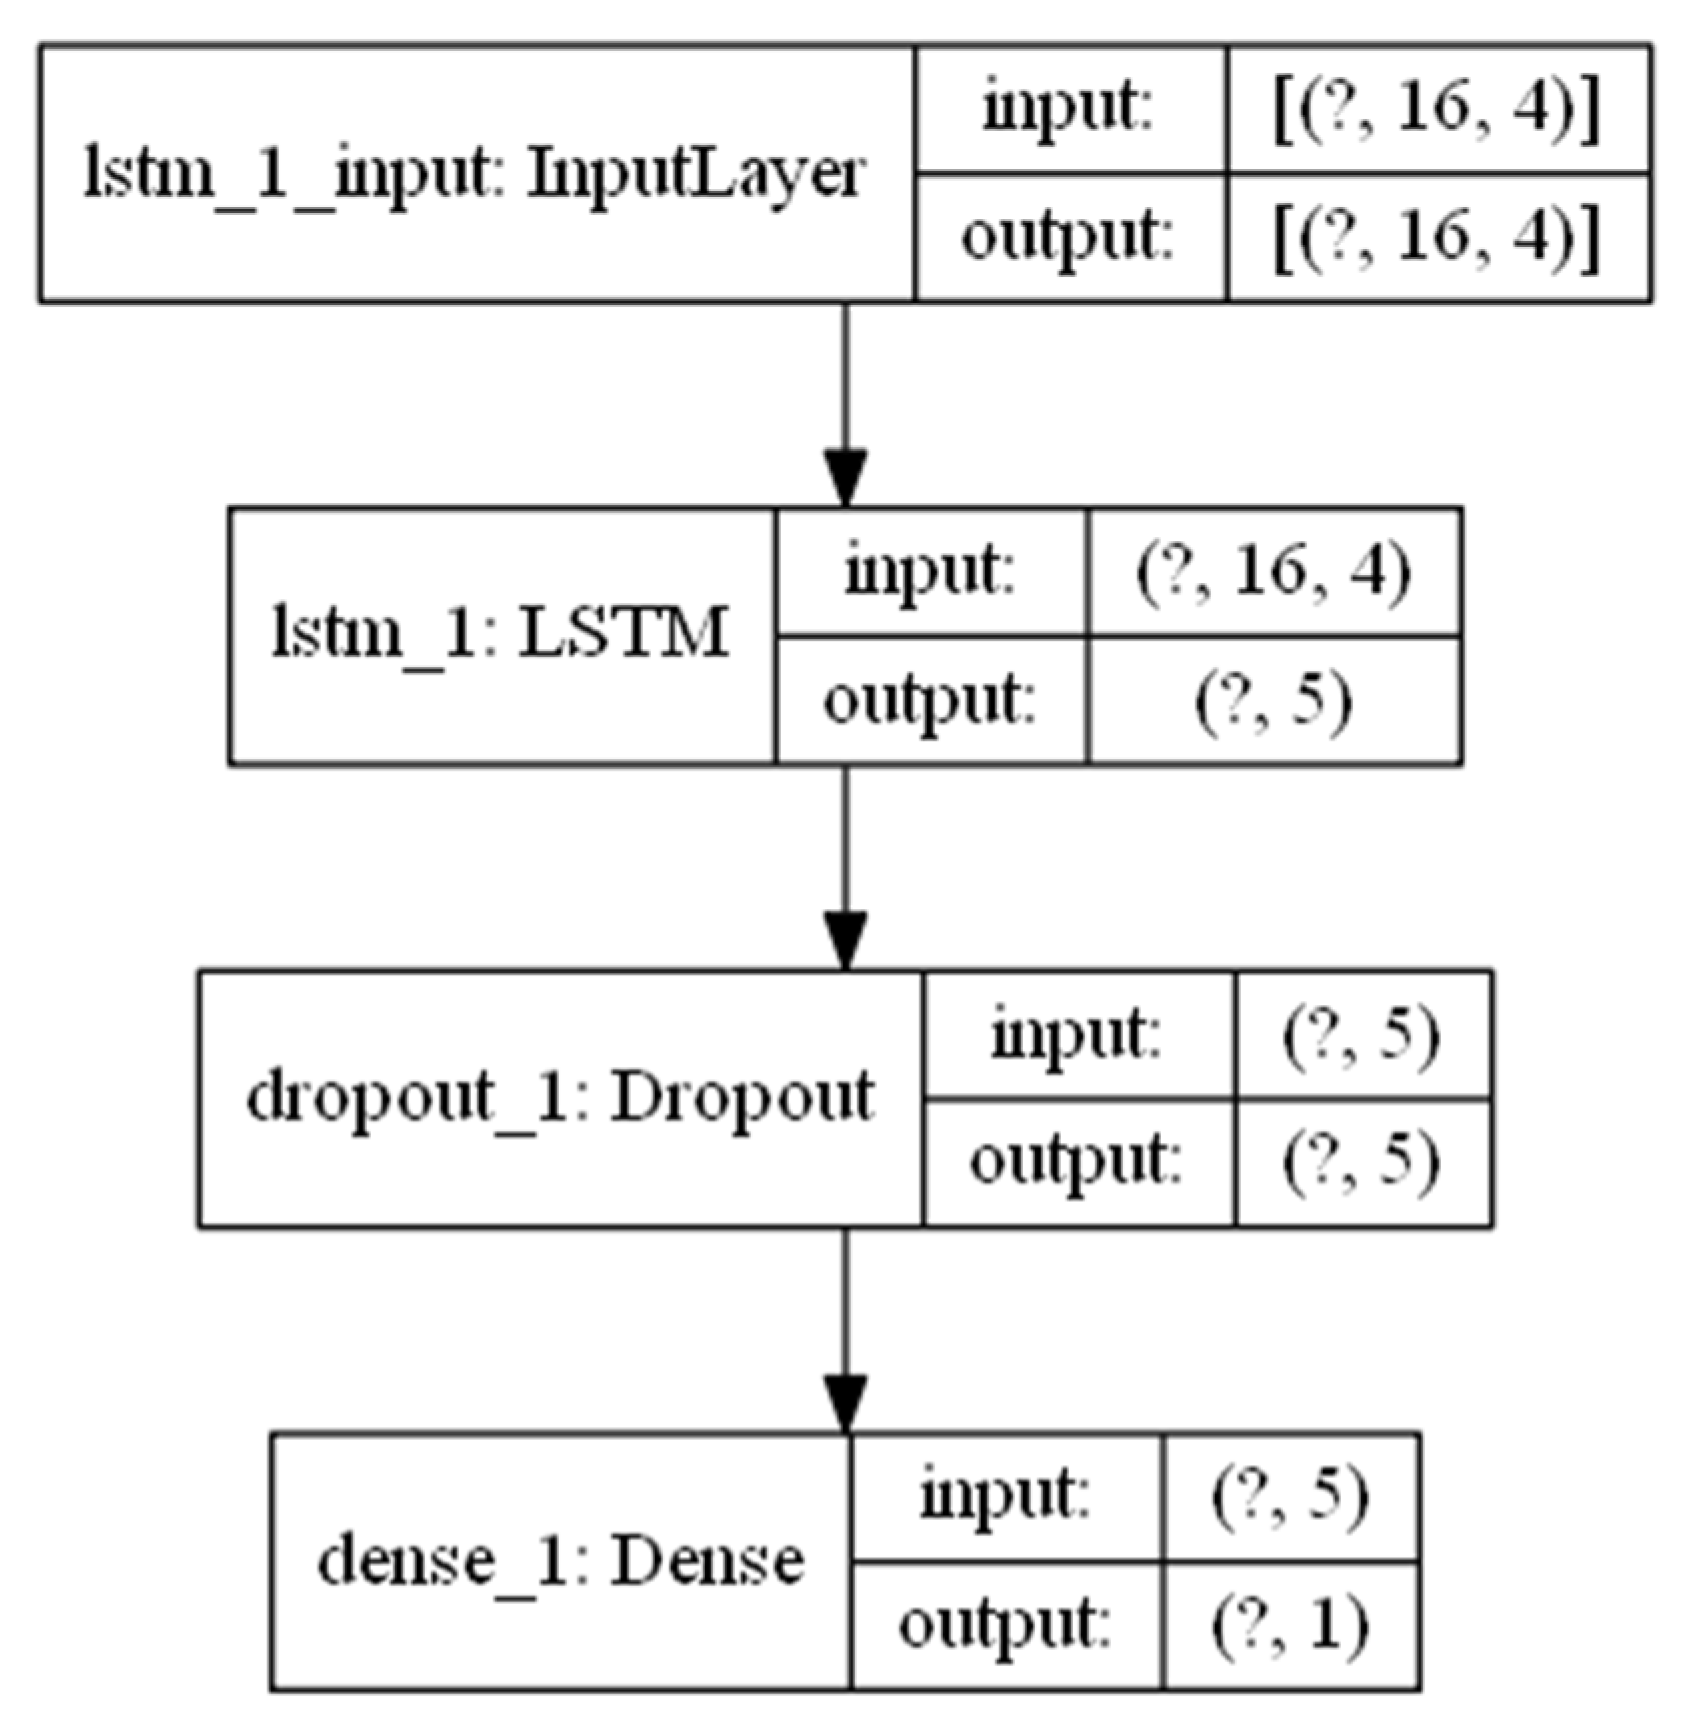
| Layer (Type) | Output Shape | #Param |
|---|---|---|
| lstm_1 (LSTM) | (None, 16, 10) | 600 |
| dropout (Dropout) | (None, 16, 10) | 0 |
| lstm_2 (LSTM) | (None, 5) | 320 |
| dropout_1 (Dropout) | (None, 5) | 0 |
| dense (Dense) | (None, 3) | 18 |
| dense_1 (Dense) | (None, 1) | 4 |
| Parameter | Value |
|---|---|
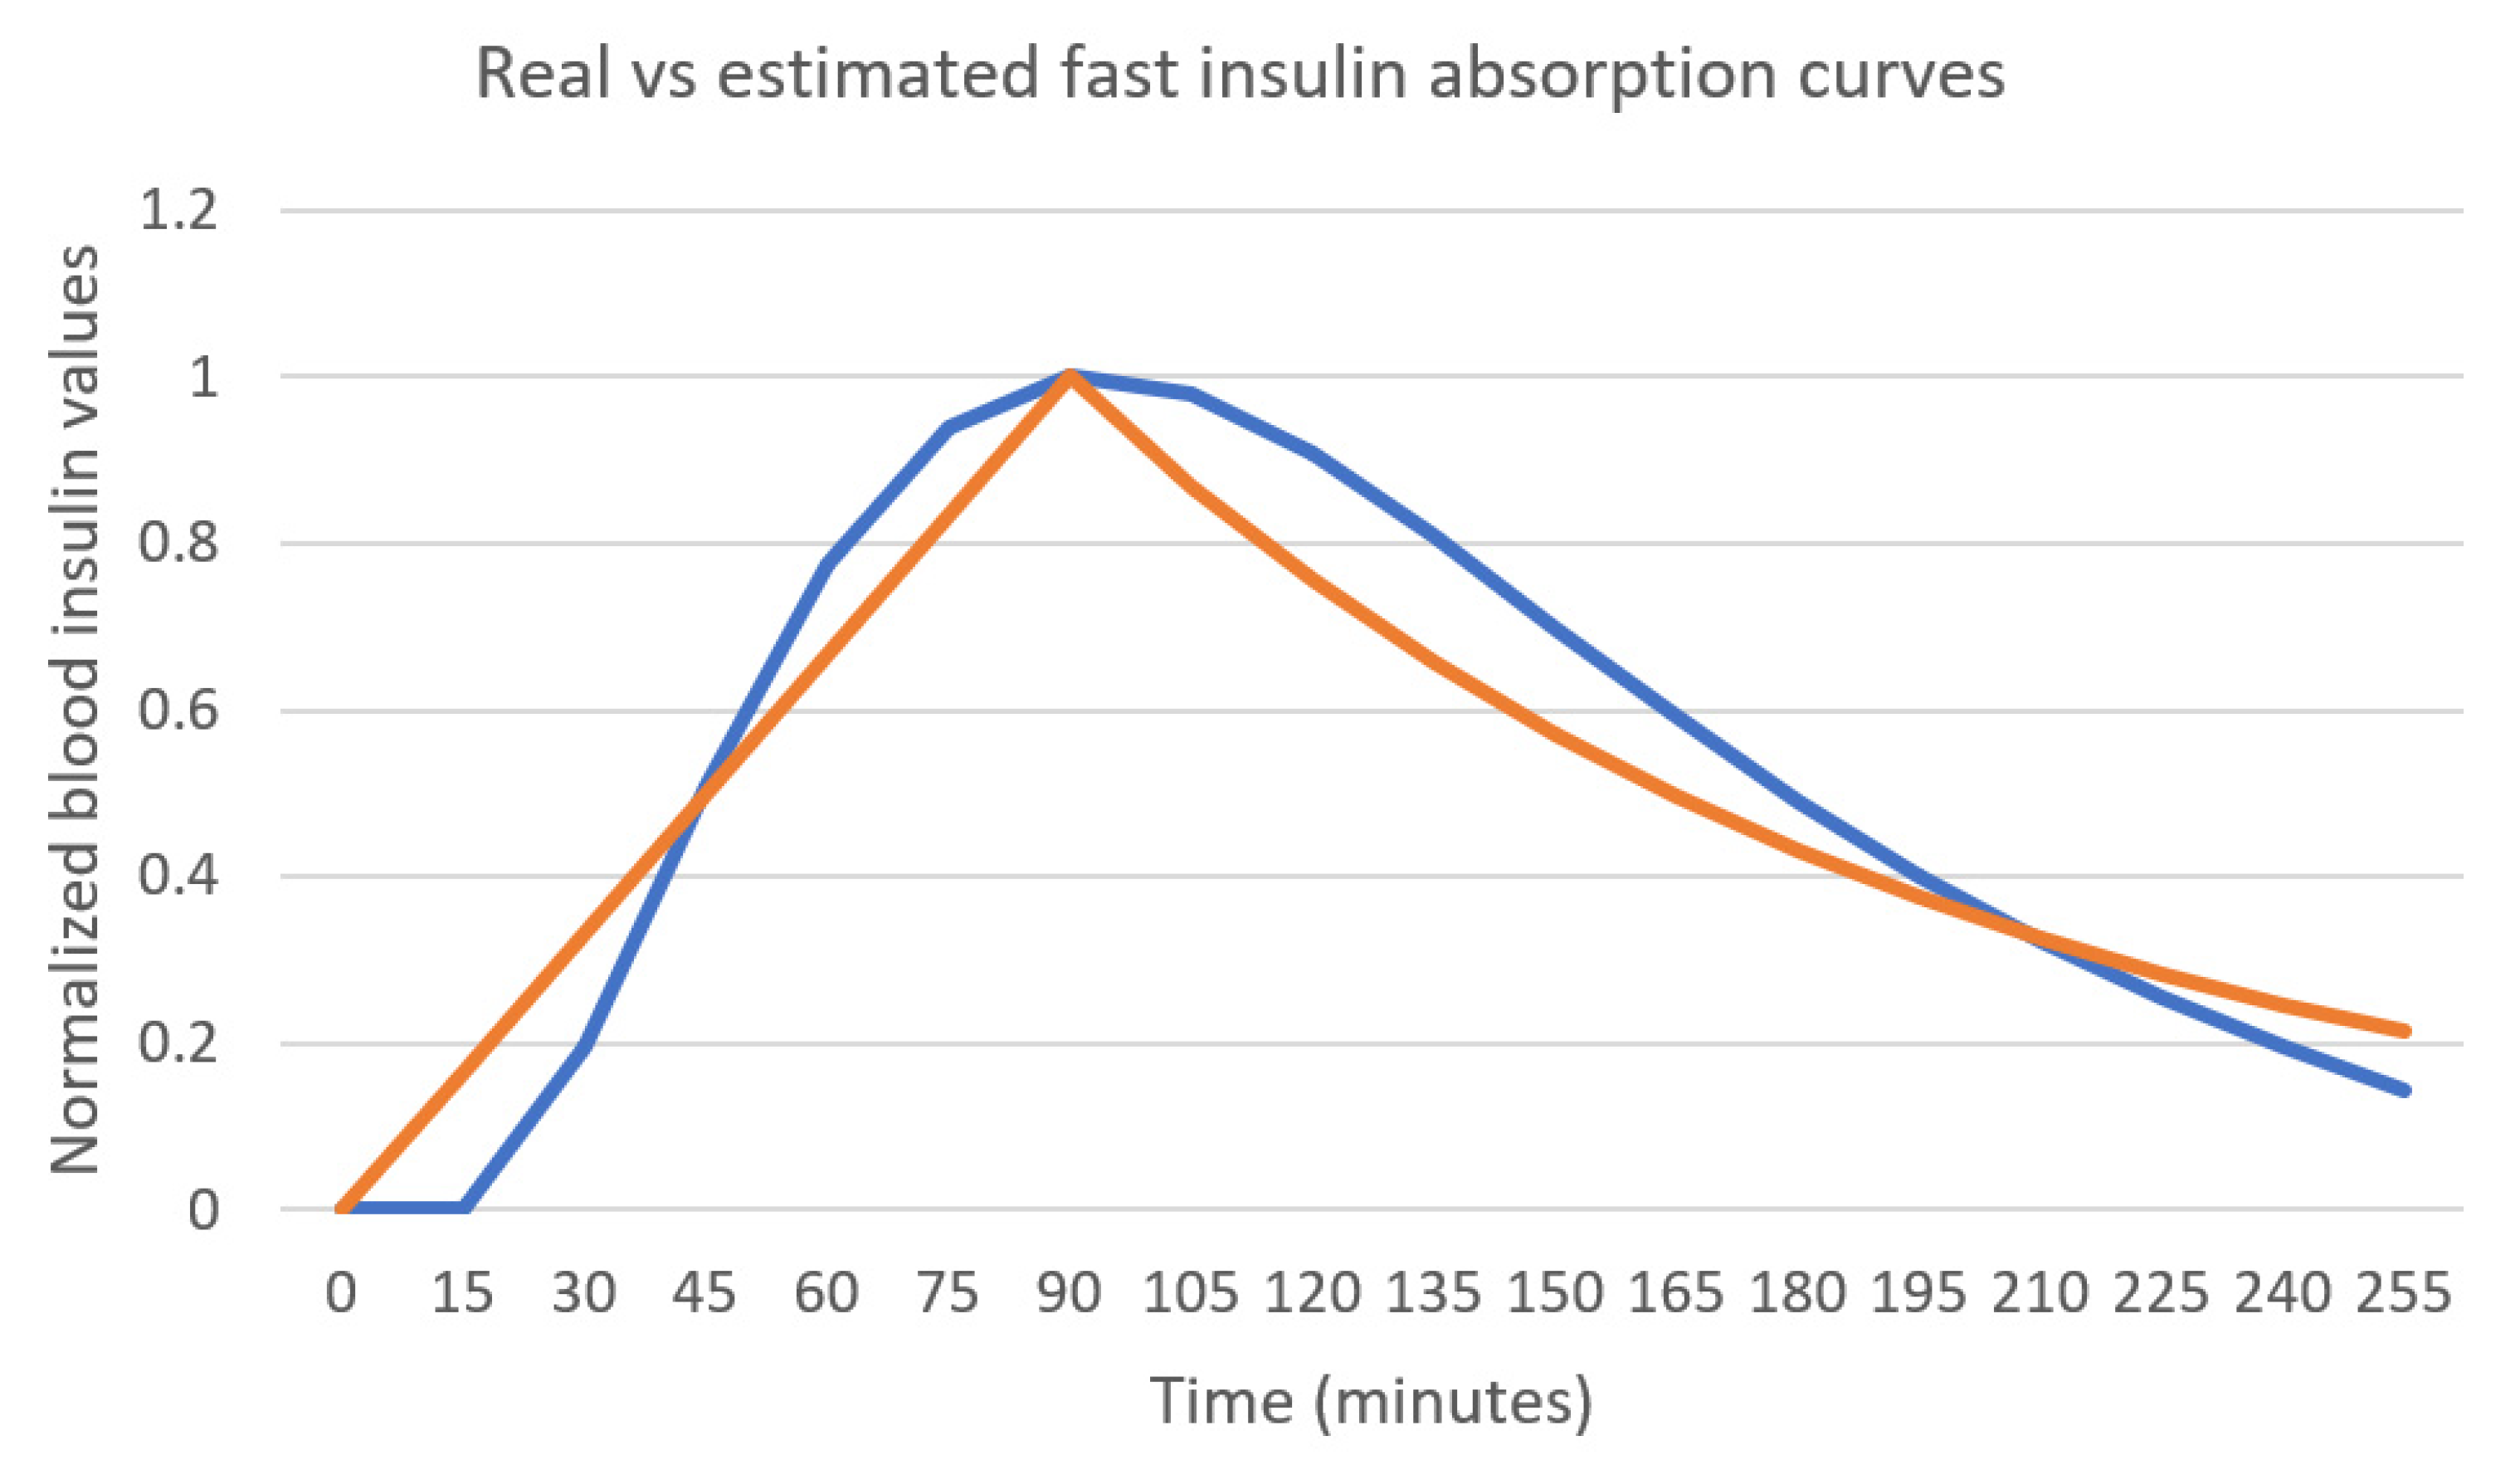
| Mean peak time (h) | 1.52 |
| Mean decay rate (h−1) | 0.57 |
| Mean absolute error | 0.078 |
| Parameter | Value |
|---|---|
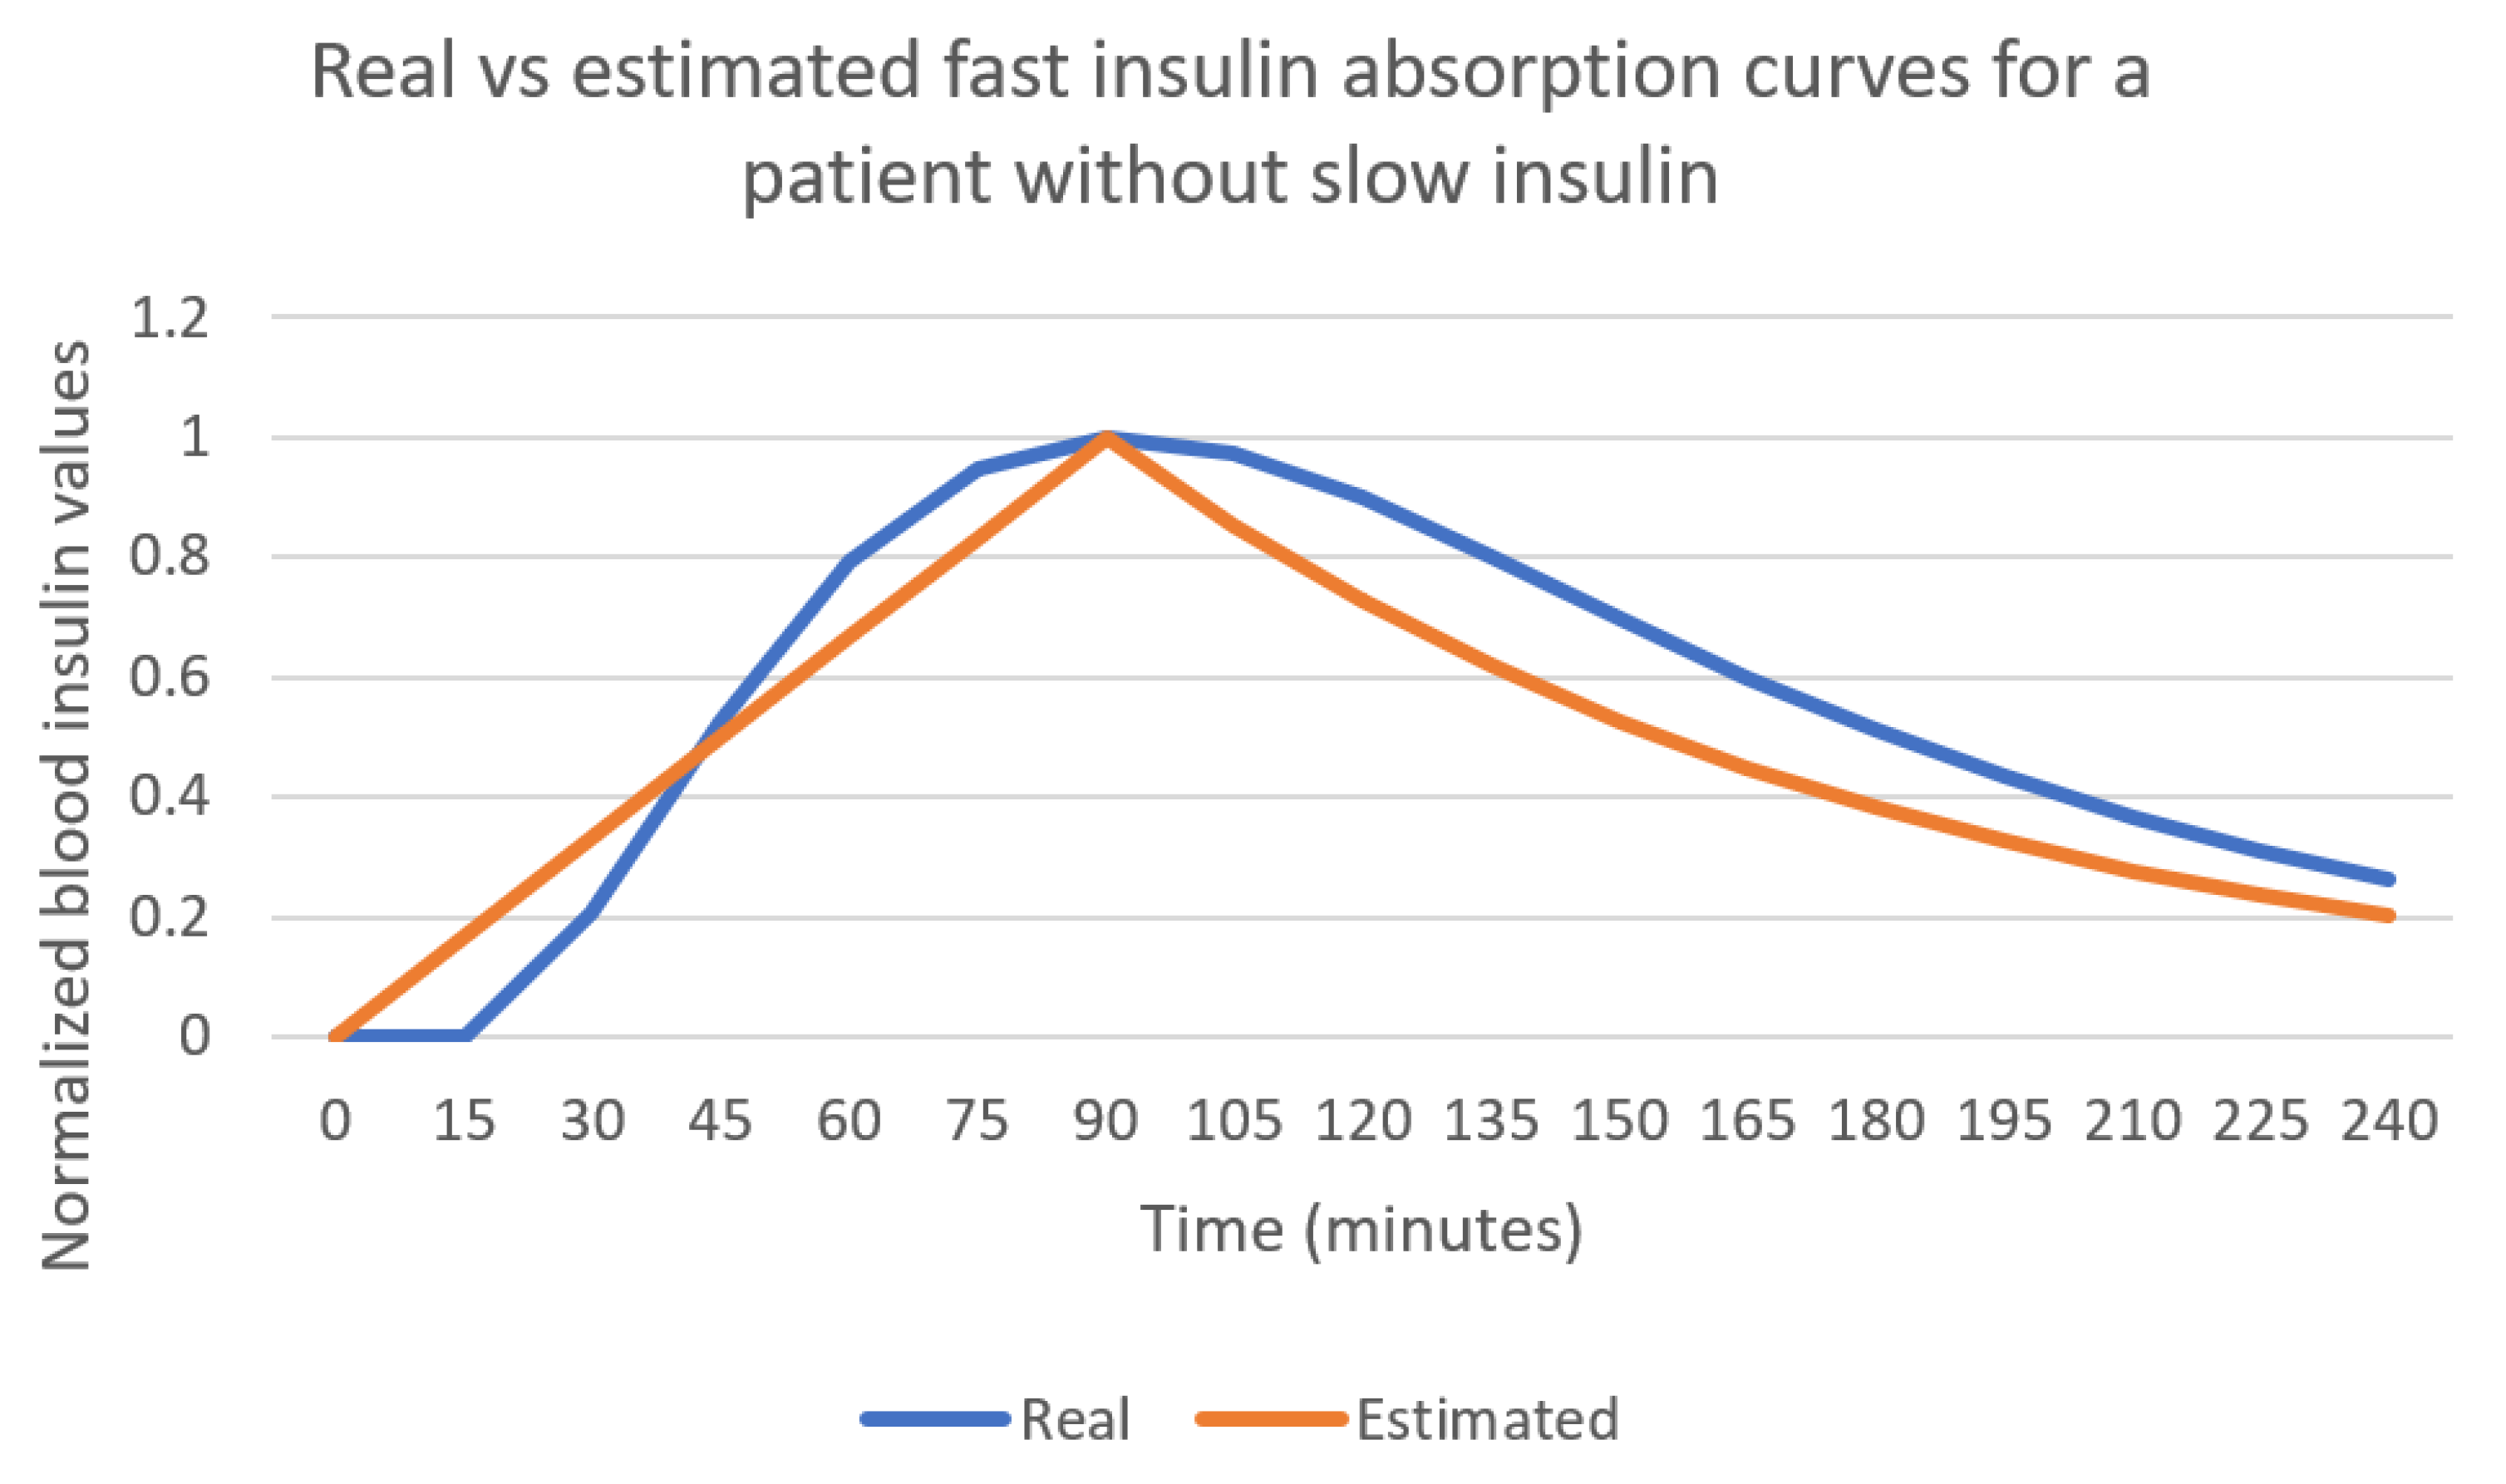
| Mean peak time (h) | 1.65 |
| Mean decay rate (h−1) | 0.77 |
| Mean absolute error | 0.088 |
Publisher’s Note: MDPI stays neutral with regard to jurisdictional claims in published maps and institutional affiliations. |
© 2021 by the authors. Licensee MDPI, Basel, Switzerland. This article is an open access article distributed under the terms and conditions of the Creative Commons Attribution (CC BY) license (https://creativecommons.org/licenses/by/4.0/).
Share and Cite
Muñoz-Organero, M.; Queipo-Álvarez, P.; García Gutiérrez, B. Learning Carbohydrate Digestion and Insulin Absorption Curves Using Blood Glucose Level Prediction and Deep Learning Models. Sensors 2021, 21, 4926. https://doi.org/10.3390/s21144926
Muñoz-Organero M, Queipo-Álvarez P, García Gutiérrez B. Learning Carbohydrate Digestion and Insulin Absorption Curves Using Blood Glucose Level Prediction and Deep Learning Models. Sensors. 2021; 21(14):4926. https://doi.org/10.3390/s21144926
Chicago/Turabian StyleMuñoz-Organero, Mario, Paula Queipo-Álvarez, and Boni García Gutiérrez. 2021. "Learning Carbohydrate Digestion and Insulin Absorption Curves Using Blood Glucose Level Prediction and Deep Learning Models" Sensors 21, no. 14: 4926. https://doi.org/10.3390/s21144926