
Analysis of Default Mode Network in Social Anxiety Disorder: EEG Resting-State Effective Connectivity Study


Abstract
:1. Introduction
2. Materials and Methods
2.1. Participants
2.2. Experimental Design
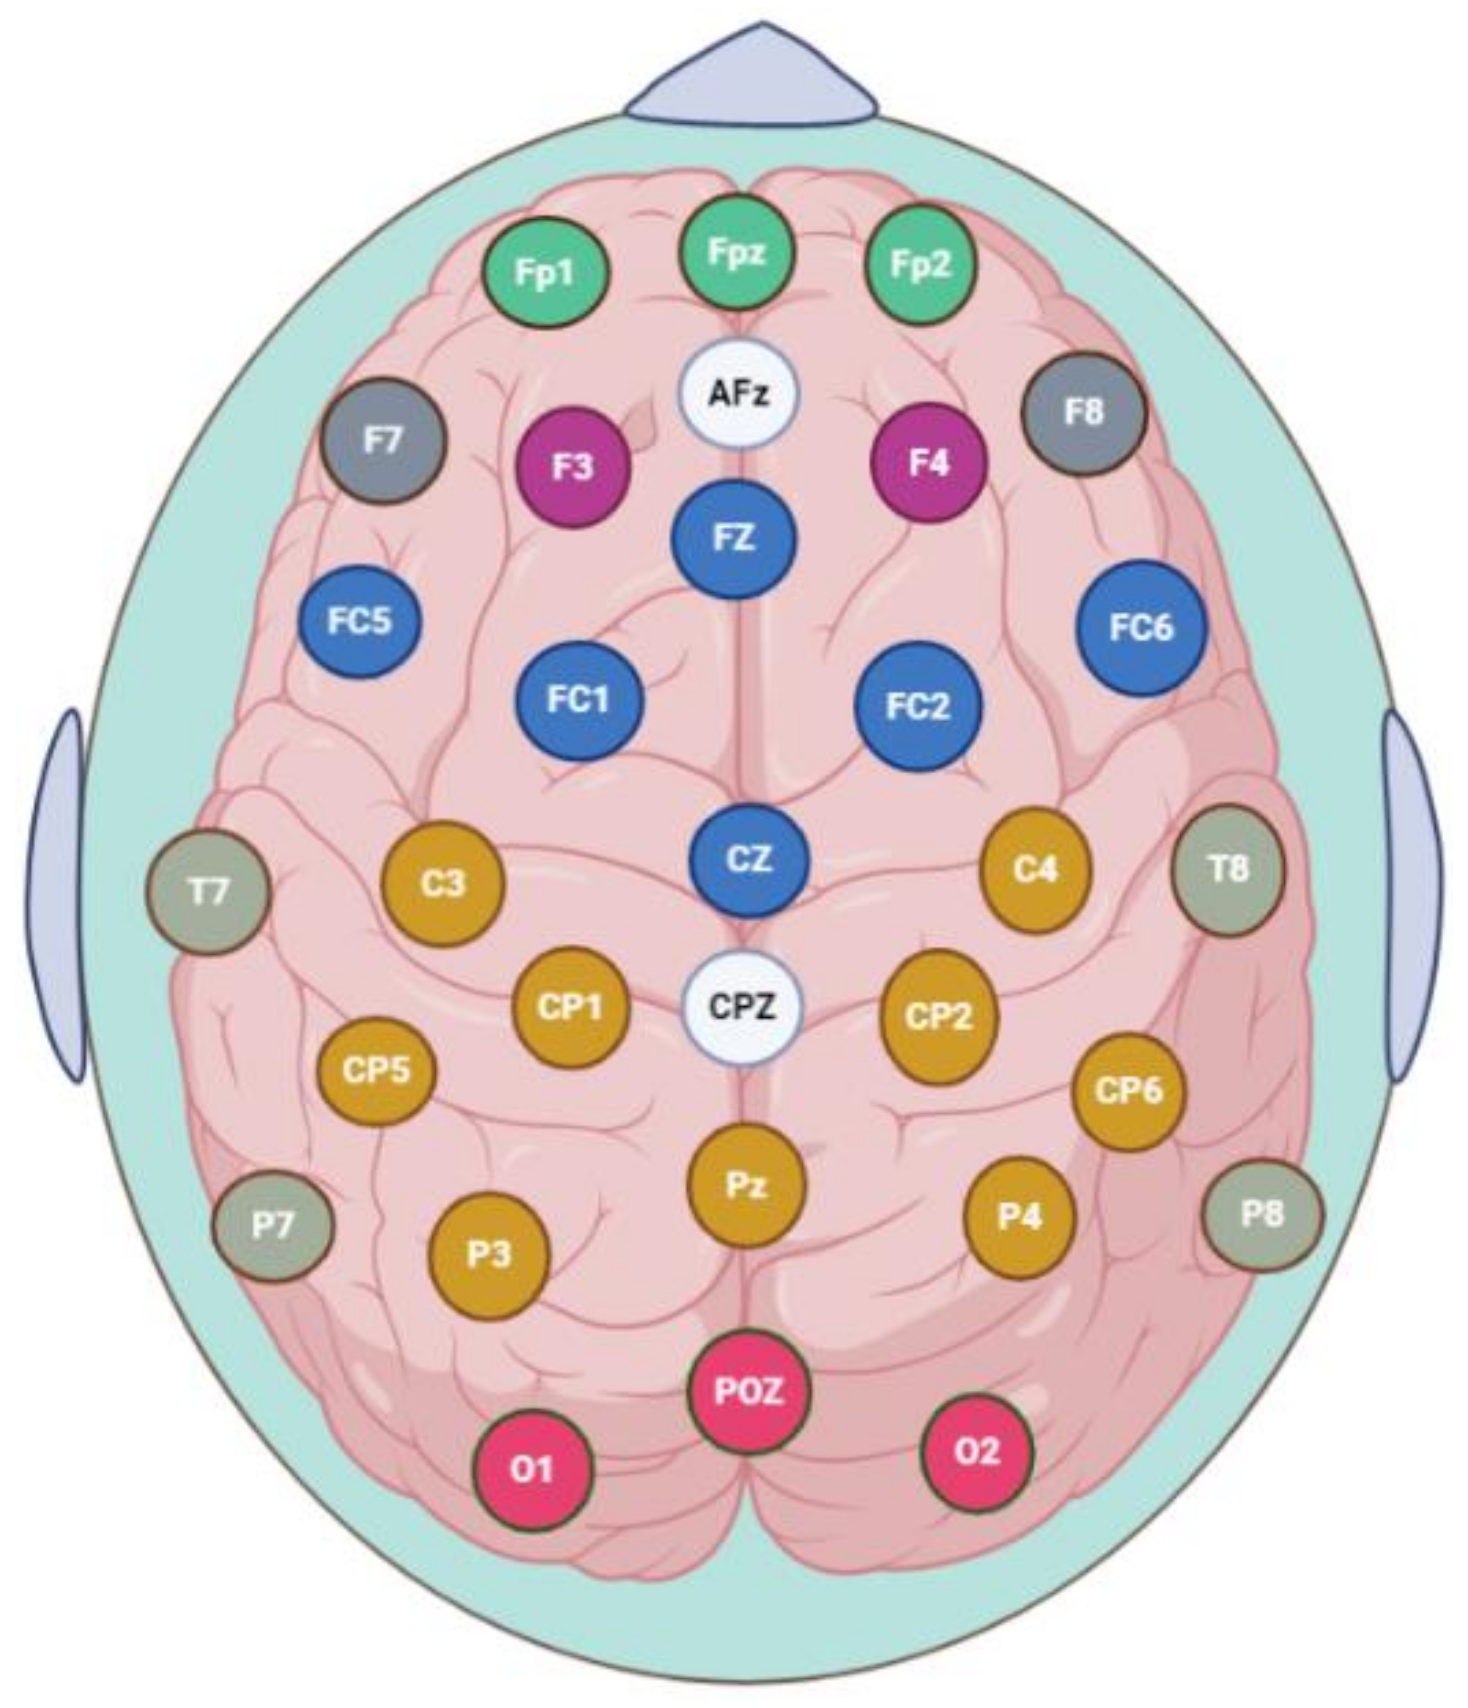
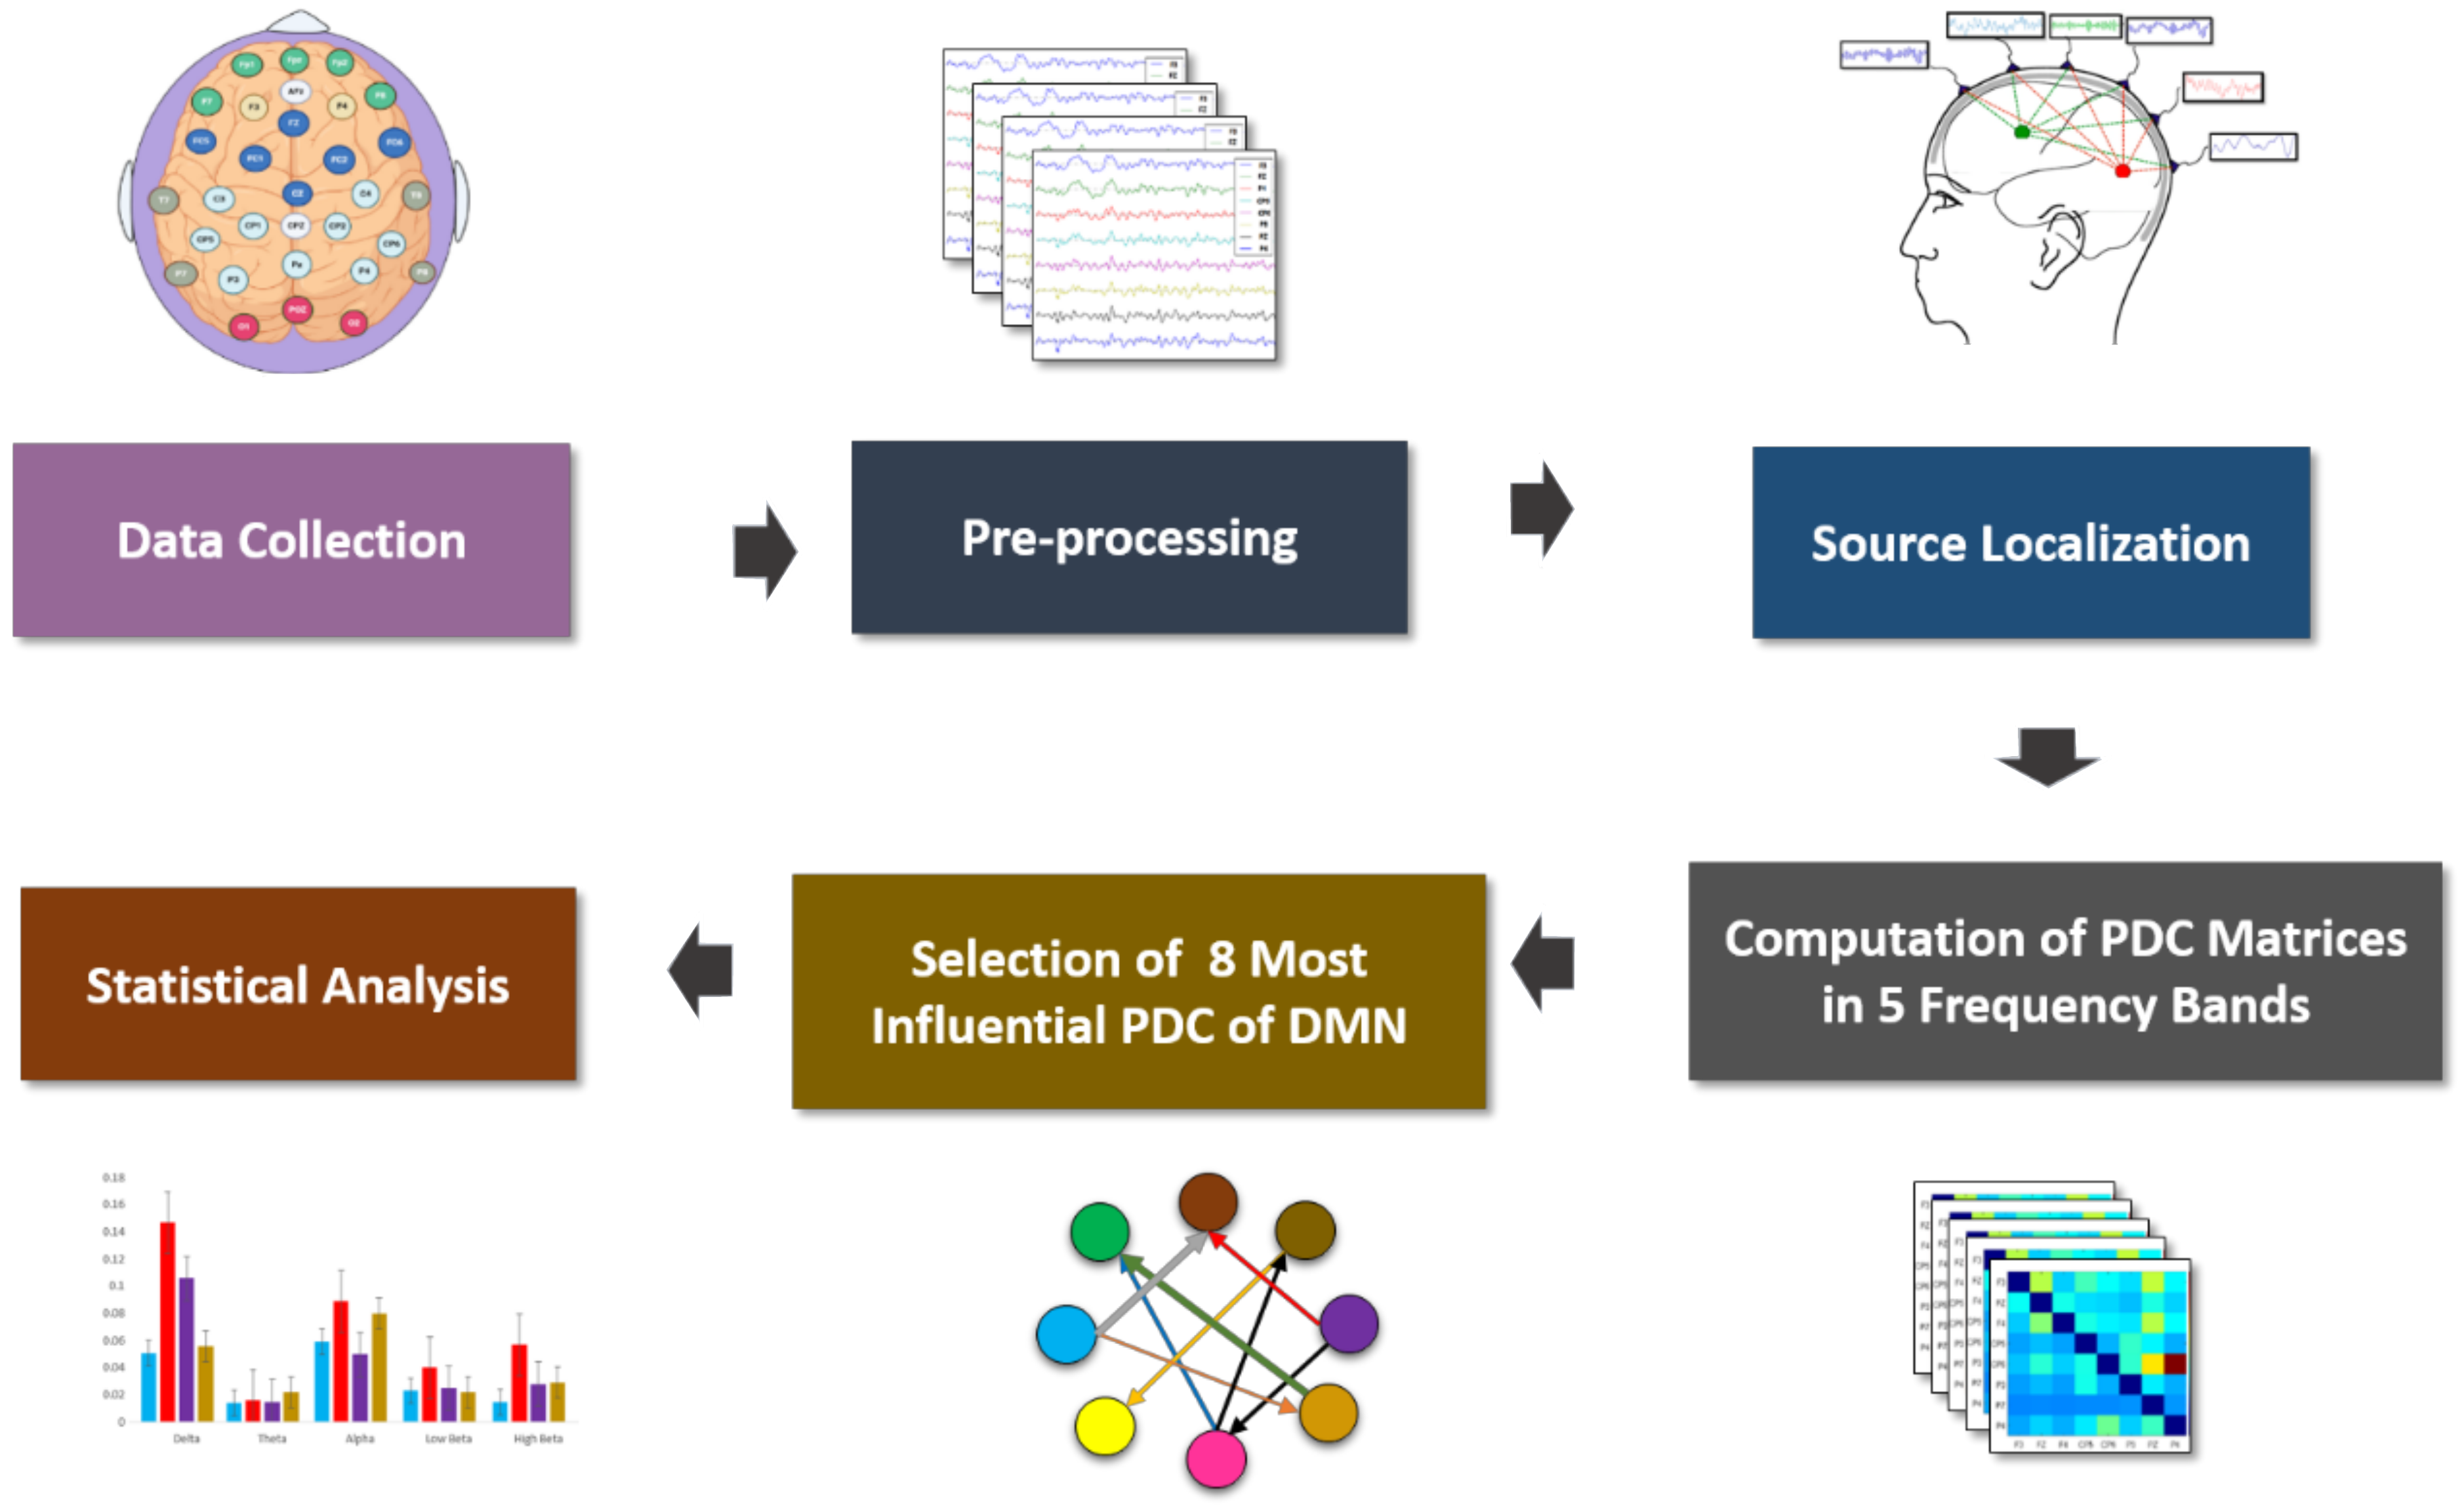
2.3. EEG Data Acquisition, Preprocessing and PDC Implementation
2.4. EEG Source Localization-Based Effective Connectivity
2.5. Clinical Assessment
2.6. Statistical Analysis
3. Results
3.1. Subjective Data Analysis
3.2. Power Analyses
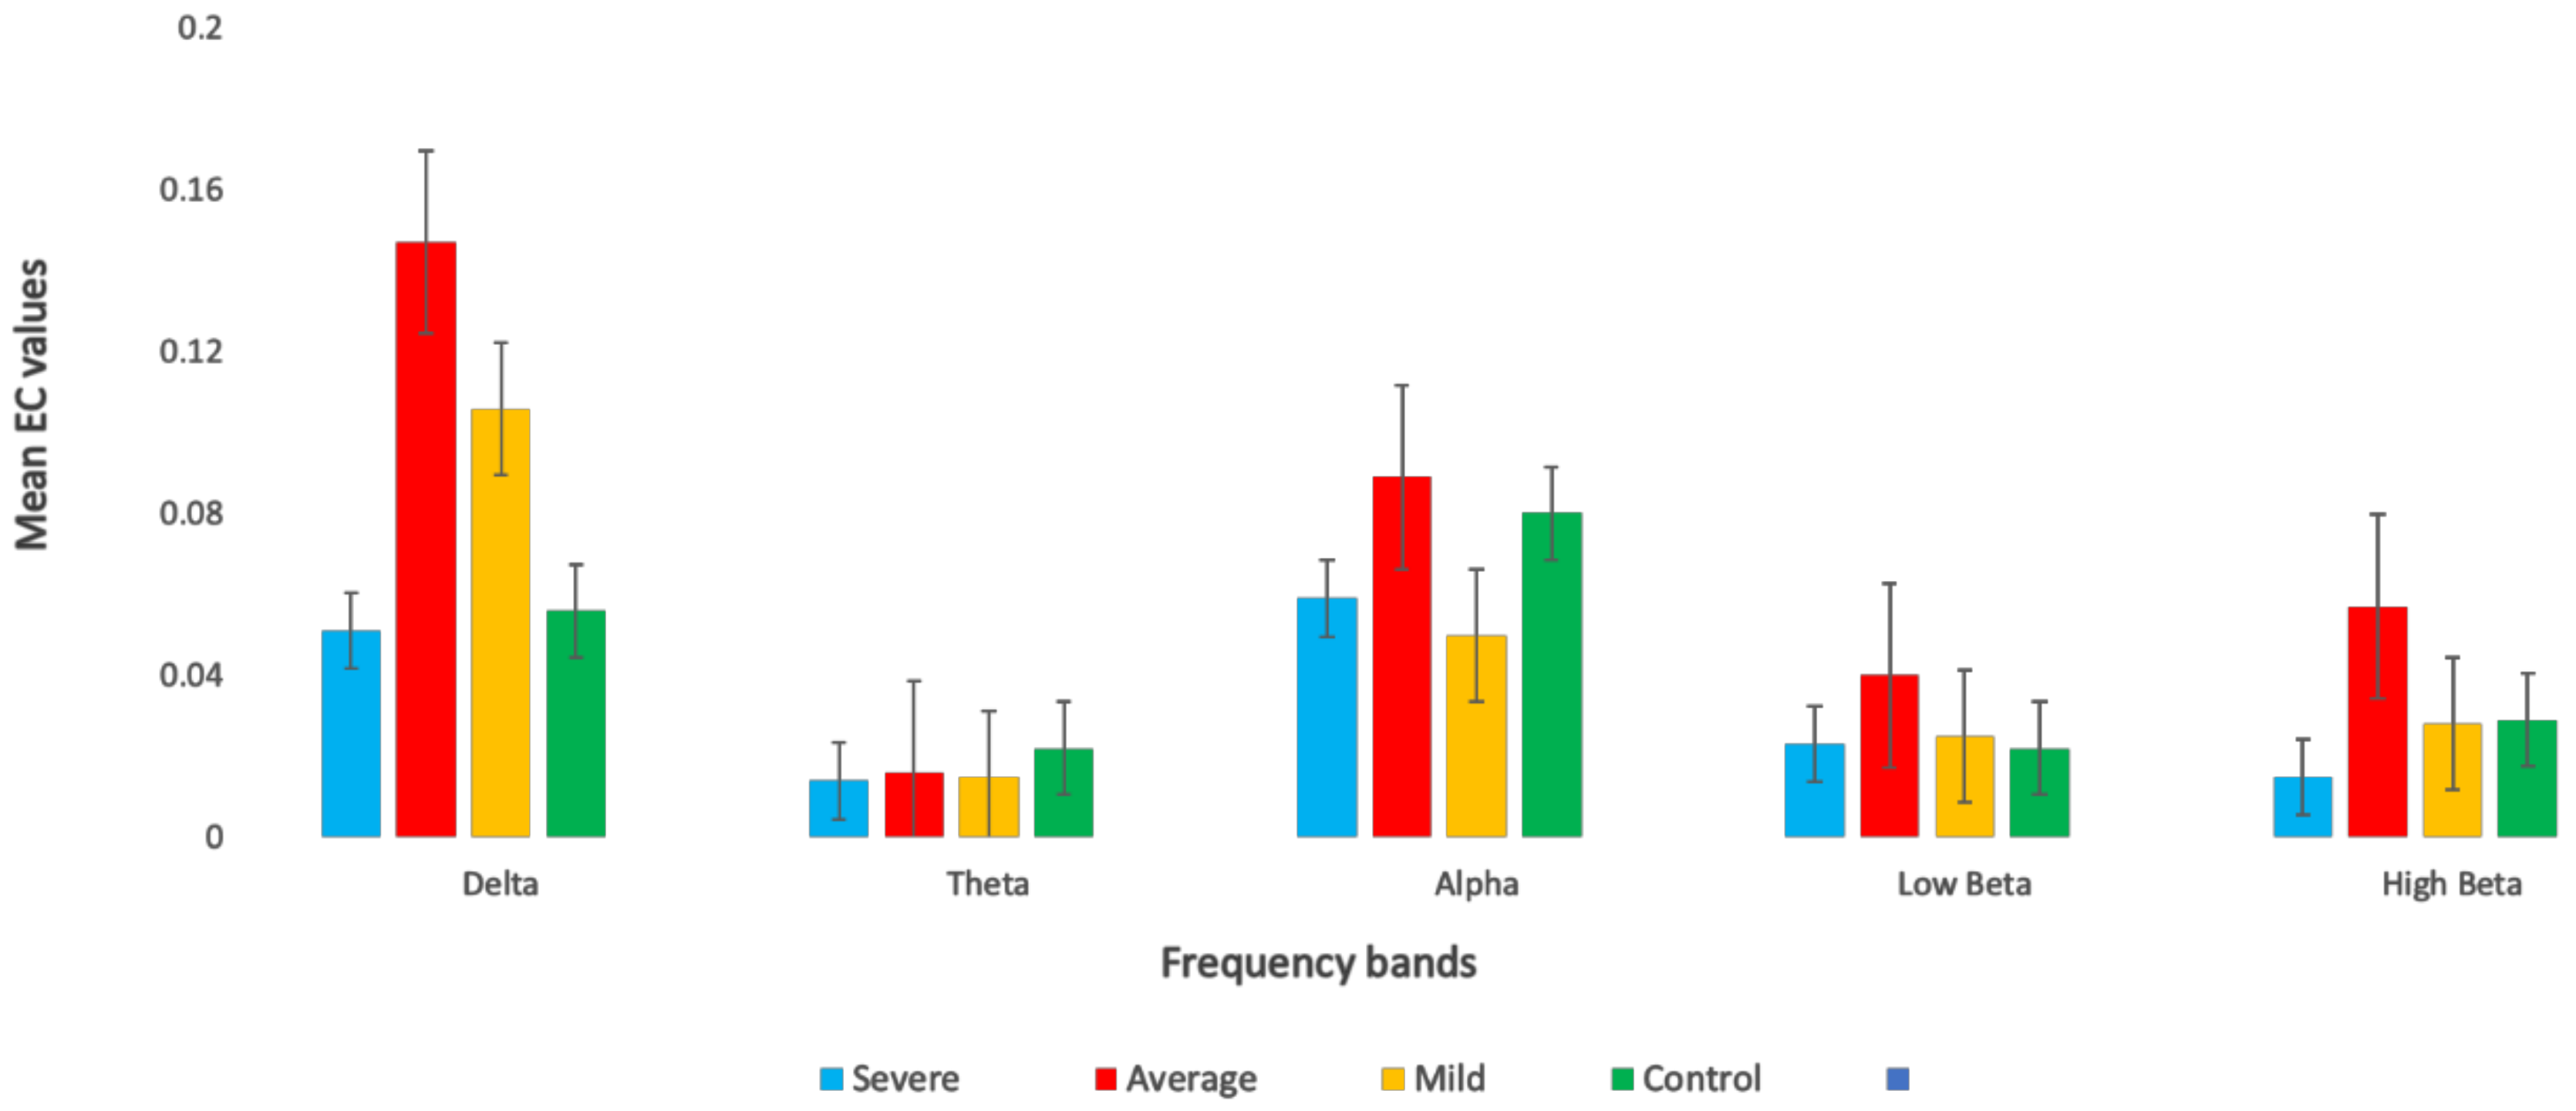
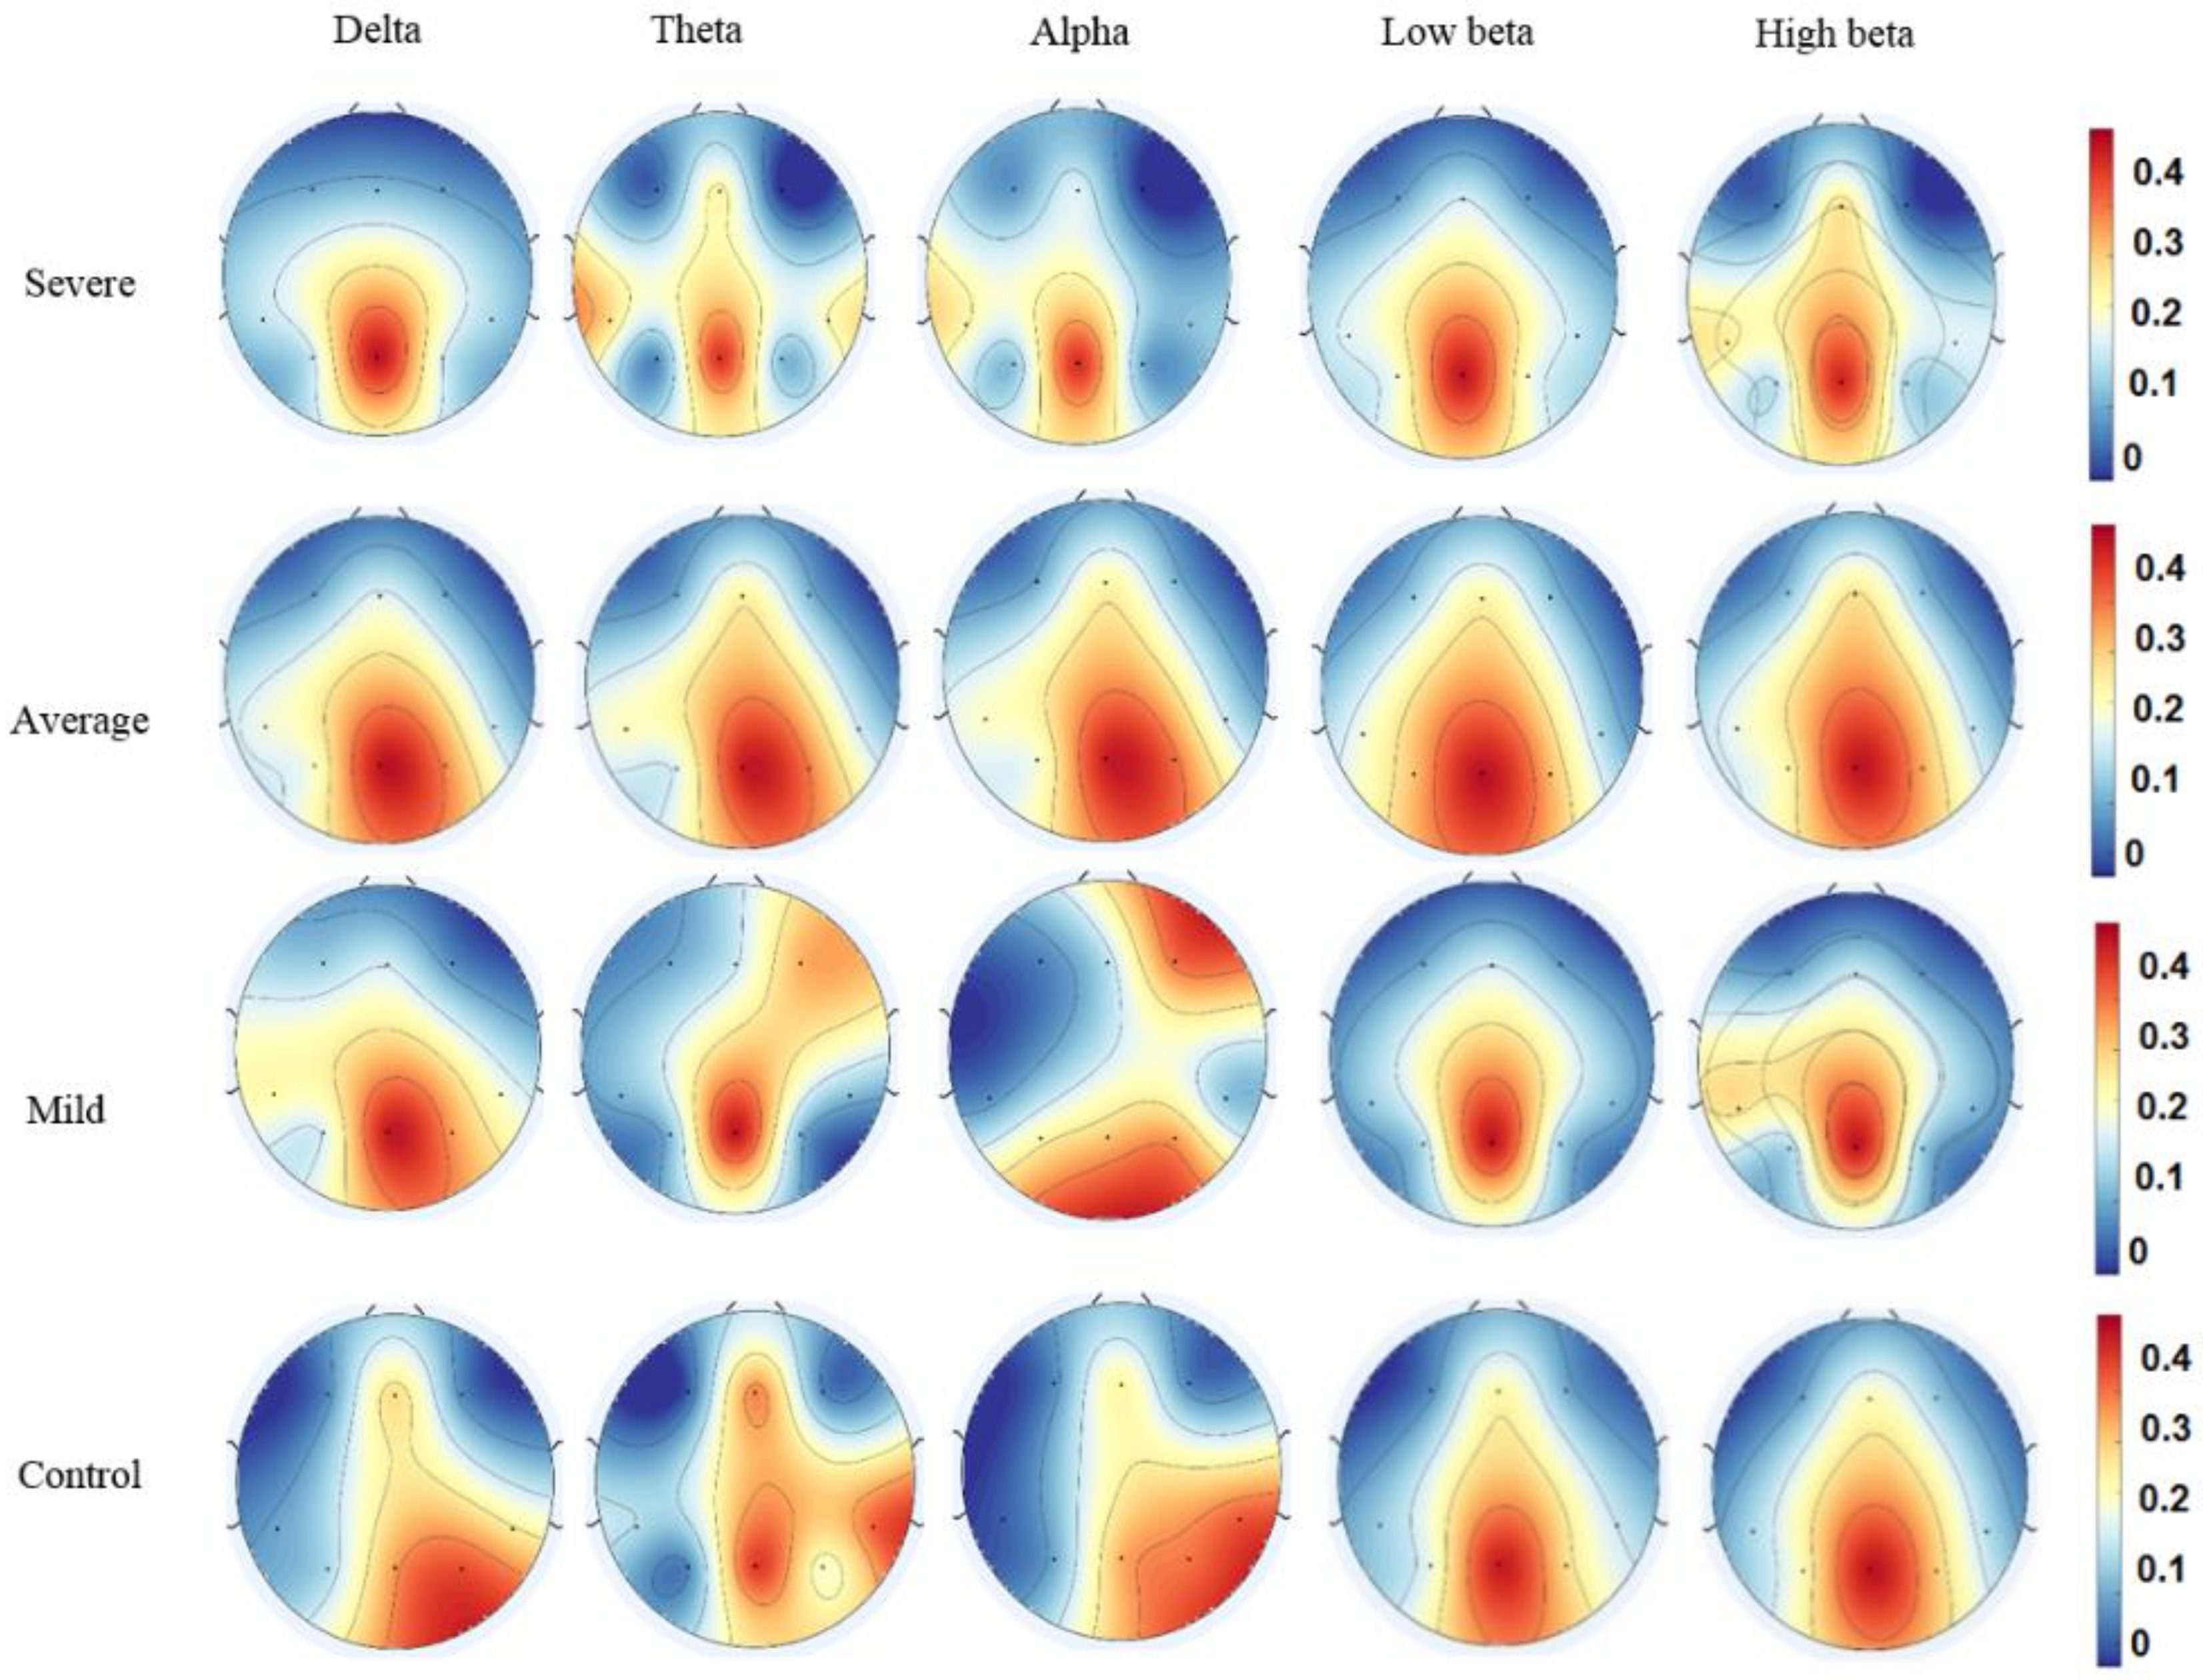
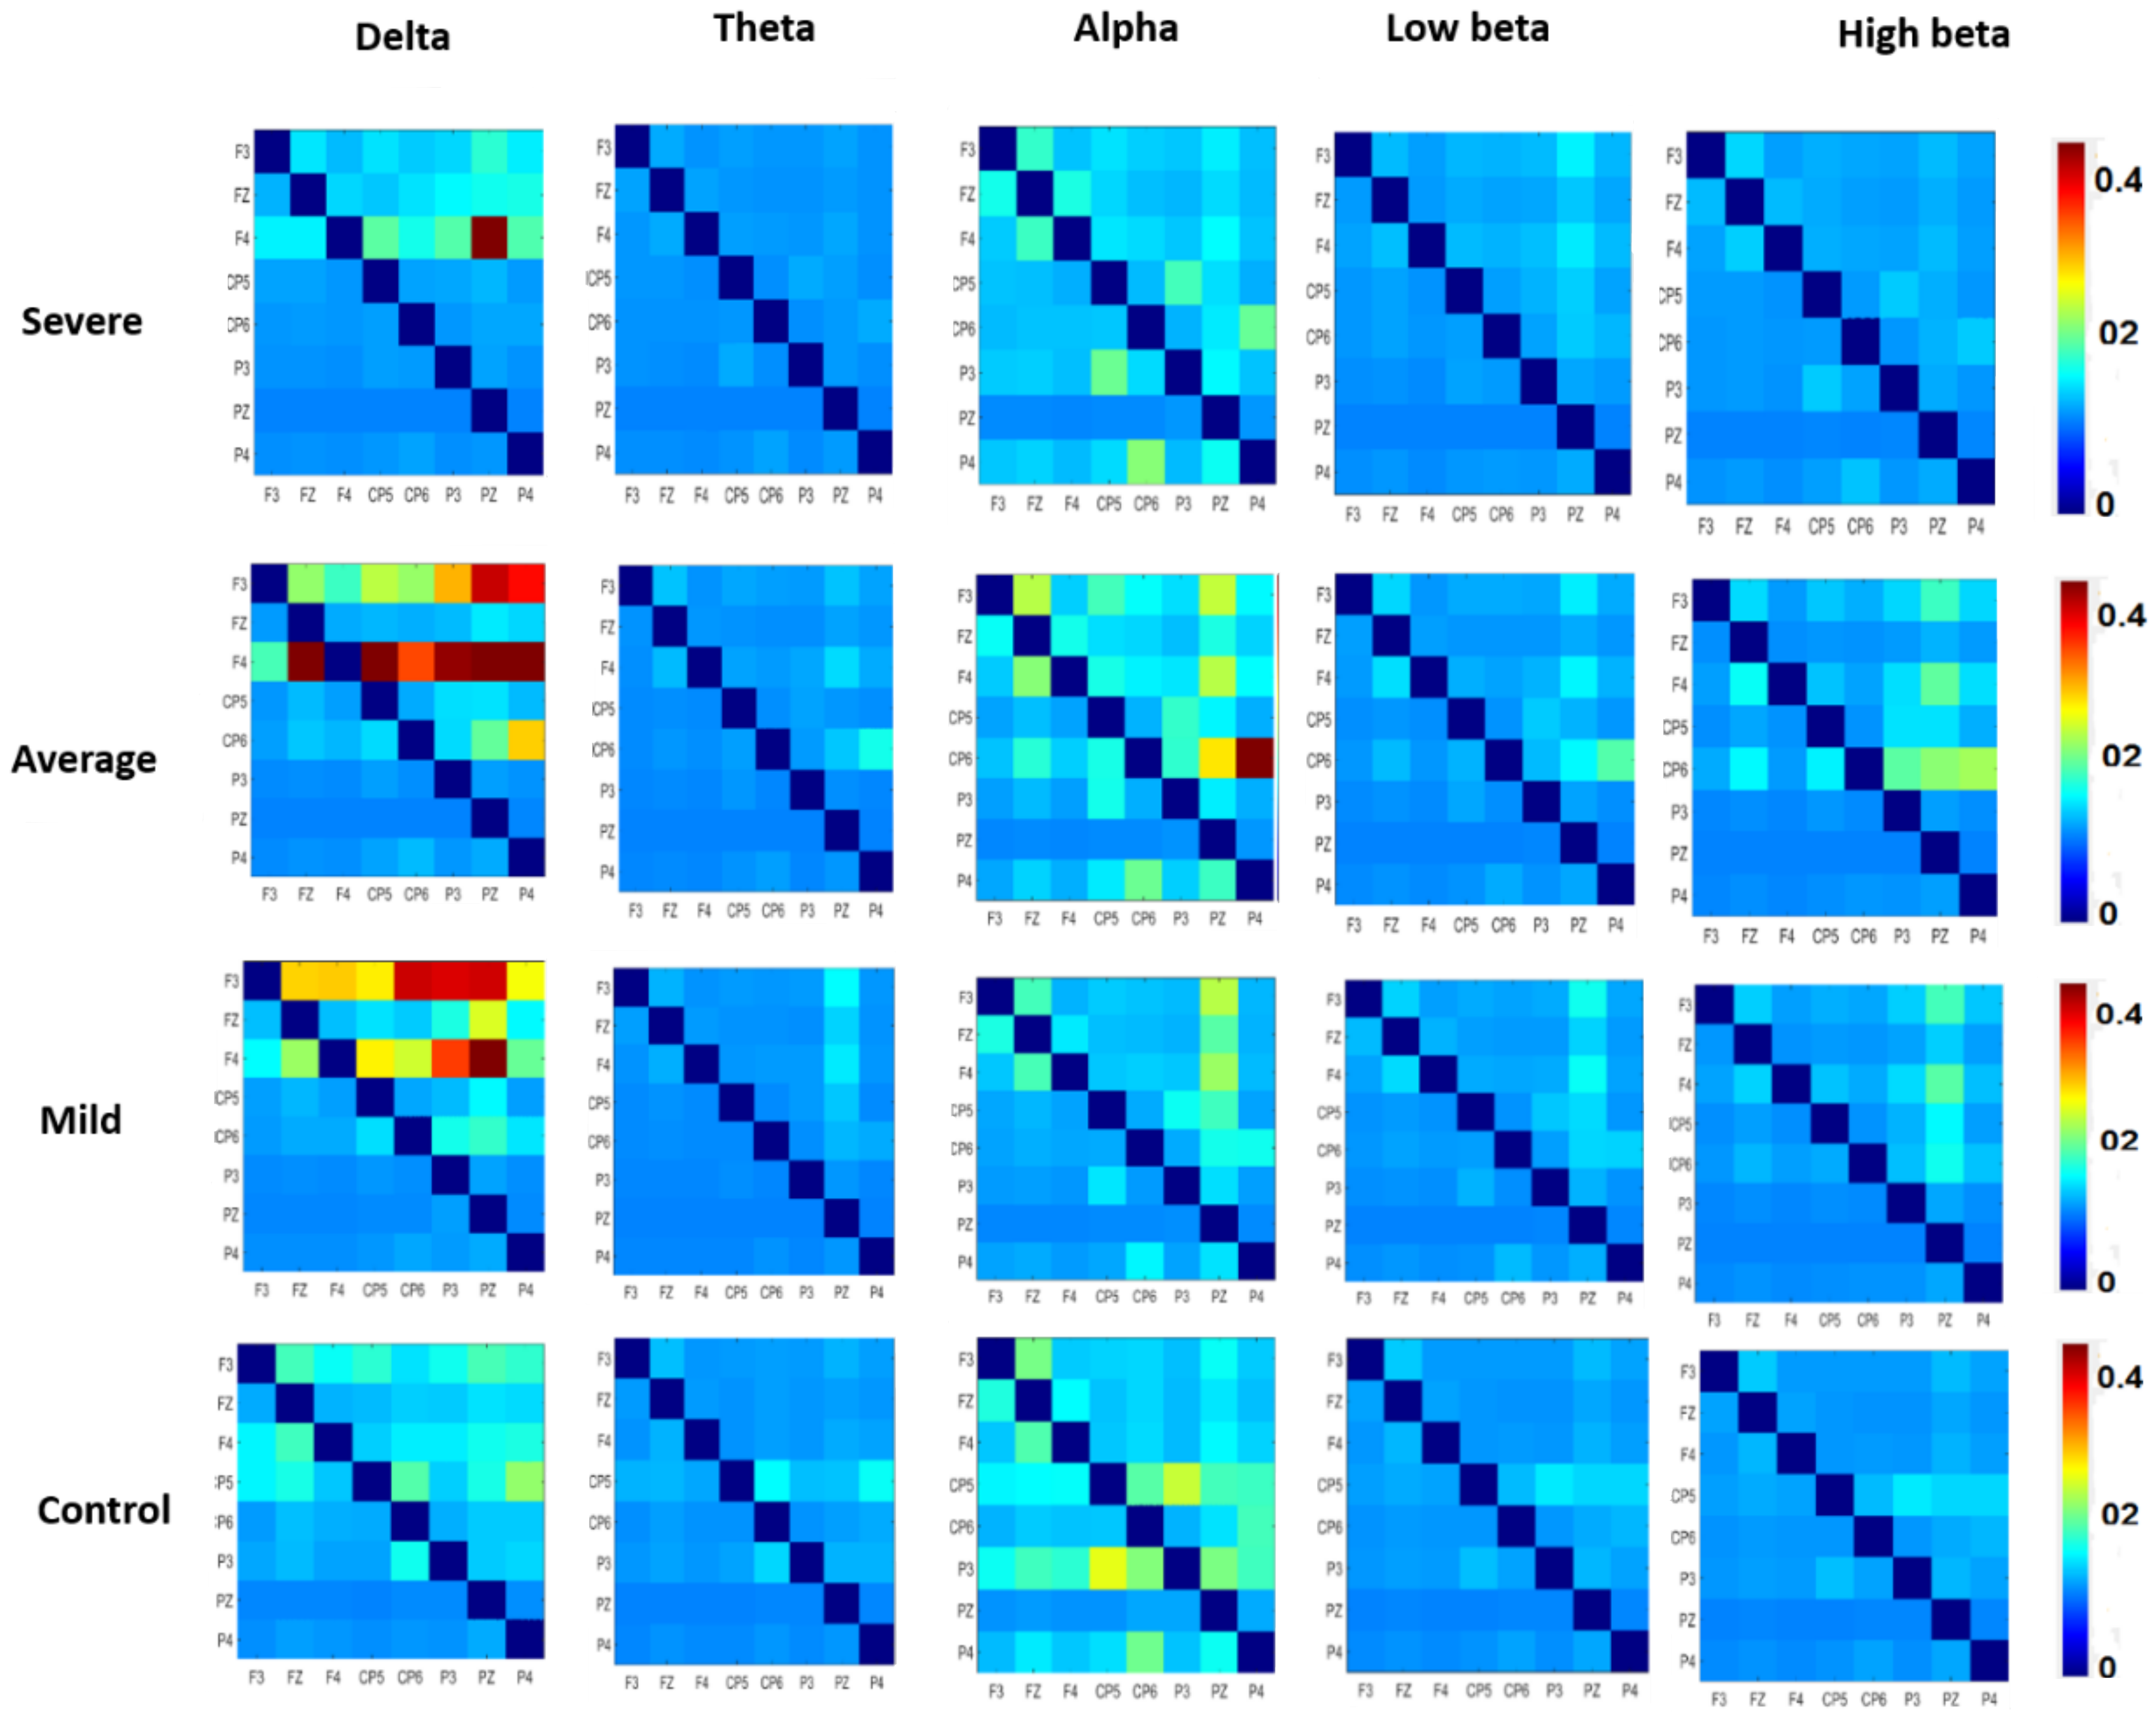
3.3. Effective Connectivity in Different Frequency Bands
3.4. Pairwise EC of DMN Components in SAD
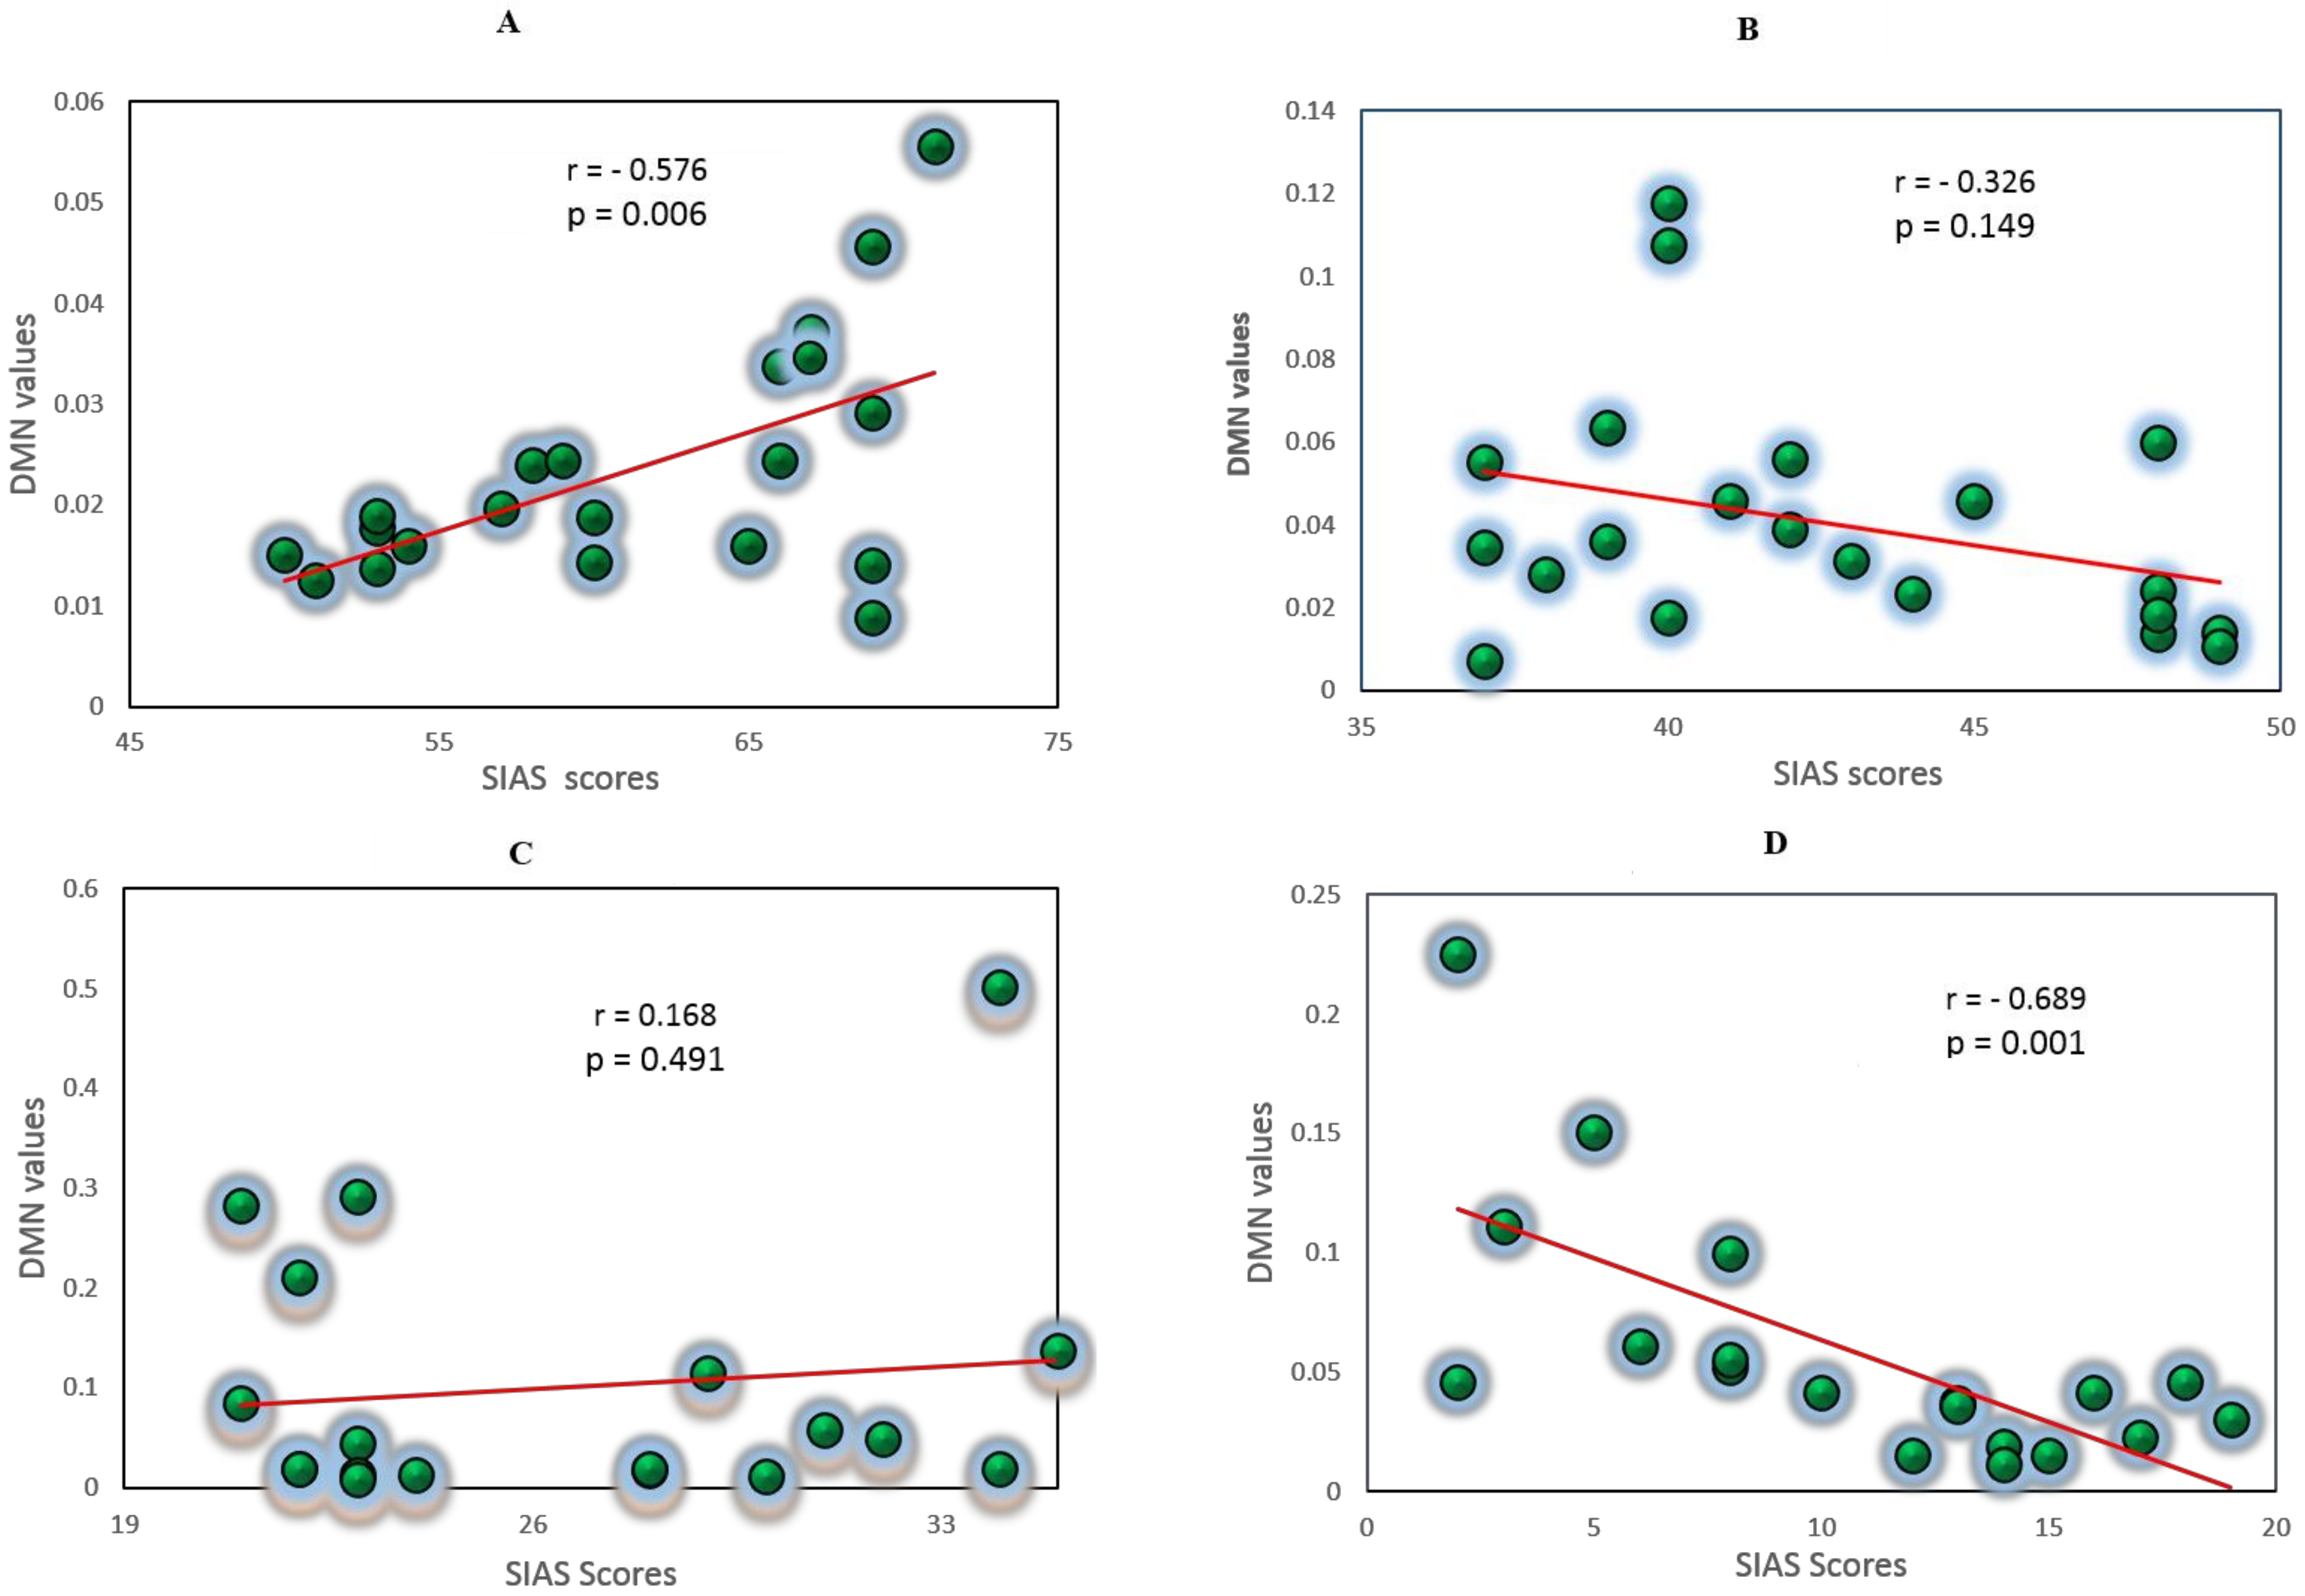
3.5. Correlation Analysis between EC Values and Self-Report Measures
4. Discussion
5. Conclusions
Supplementary Materials
Author Contributions
Funding
Institutional Review Board Statement
Informed Consent Statement
Data Availability Statement
Acknowledgments
Conflicts of Interest
Appendix A
References
- Brook, C.A.; Schmidt, L.A. Social anxiety disorder: A review of environmental risk factors. Neuropsychiatr. Dis. Treat. 2008, 4, 123–143. [Google Scholar]
- Golombek, K.; Lidle, L.; Tuschen-Caffier, B.; Schmitz, J.; Vierrath, V. The role of emotion regulation in socially anxious children and adolescents: A systematic review. Eur. Child Adolesc. Psychiatry 2019, 29, 1479–1501. [Google Scholar] [CrossRef]
- Hofmann, S.G. Cognitive factors that maintain social anxiety disorder: A comprehensive model and its treatment implications. Cogn. Behav. Ther. 2007, 36, 193–209. [Google Scholar] [CrossRef] [PubMed]
- Modini, M.; Abbott, M.J. A comprehensive review of the cognitive determinants of anxiety and rumination in social anxiety disorder. Behav. Chang. 2016, 33, 150–171. [Google Scholar] [CrossRef]
- Brühl, A.B.; Delsignore, A.; Komossa, K.; Weidt, S. Neuroimaging in social anxiety disorder-A meta-analytic review resulting in a new neurofunctional model. Neurosci. Biobehav. Rev. 2014, 47, 260–280. [Google Scholar] [CrossRef] [Green Version]
- Al-Ezzi, A.; Selman, N.K.; Faye, I.; Gunaseli, E. Electrocortical brain oscillations and social anxiety disorder: A pilot study of frontal alpha asymmetry and delta-beta correlation. J. Phys. Conf. Ser. 2020, 1529, 052037. [Google Scholar] [CrossRef]
- Sladky, R.; Höflich, A.; Küblböck, M.; Kraus, C.; Baldinger, P.; Moser, E.; Lanzenberger, R.; Windischberger, C. Disrupted effective connectivity between the amygdala and orbitofrontal cortex in social anxiety disorder during emotion discrimination revealed by dynamic causal modeling for fMRI. Cereb. Cortex 2013, 25, 895–903. [Google Scholar] [CrossRef]
- Manning, J.; Reynolds, G.; Saygin, Z.M.; Hofmann, S.G.; Pollack, M.; Gabrieli, J.D.E.; Whitfield-Gabrieli, S. Altered resting-state functional connectivity of the frontal-striatal reward system in social anxiety disorder. PLoS ONE 2015, 10, e0125286. [Google Scholar] [CrossRef] [PubMed] [Green Version]
- Liu, F.; Zhu, C.; Wang, Y.; Guo, W.; Li, M.; Wang, W.; Long, Z.; Meng, Y.; Cui, Q.; Zeng, L.; et al. Disrupted cortical hubs in functional brain networks in social anxiety disorder. Clin. Neurophysiol. 2015, 126, 1711–1716. [Google Scholar] [CrossRef] [PubMed]
- Kuru, E.; Safak, Y.; Özdemir, İ.; Tulacı, R.G.; Özdel, K.; Özkula, N.G.; Örsel, S. Cognitive distortions in patients with social anxiety disorder: Comparison of a clinical group and healthy controls. Eur. J. Psychiatry 2018, 32, 97–104. [Google Scholar] [CrossRef]
- Al-Ezzi, A.; Kamel, N.; Faye, I.; Gunaseli, E. Review of EEG, ERP, and Brain Connectivity Estimators as Predictive Biomarkers of Social Anxiety Disorder. Front. Psychol. 2020, 11, 730. [Google Scholar] [CrossRef]
- Buckner, R.L.; Andrews-Hanna, J.R.; Schacter, D.L. The brain’s default network: Anatomy, function, and relevance to disease. Ann. N. Y. Acad. Sci. 2008, 1124, 1–38. [Google Scholar] [CrossRef] [PubMed] [Green Version]
- Zhao, X.H.; Wang, P.J.; Li, C.B.; Hu, Z.H.; Xi, Q.; Wu, W.Y.; Tang, X.W. Altered default mode network activity in patient with anxiety disorders: An fMRI study. Eur. J. Radiol. 2007, 63, 373–378. [Google Scholar] [CrossRef]
- Buckner, R.L.; Vincent, J.L. Unrest at rest: Default activity and spontaneous network correlations. Neuroimage 2007, 37, 1091–1096. [Google Scholar] [CrossRef]
- Tao, Y.; Liu, B.; Zhang, X.; Li, J.; Qin, W.; Yu, C.; Jiang, T. The Structural Connectivity Pattern of the Default Mode Network and Its Association with Memory and Anxiety. Front. Neuroanat. 2015, 9, 152. [Google Scholar] [CrossRef] [Green Version]
- Desgranges, B.; Mevel, K.; Chételat, G.; Eustache, F. The default mode network in healthy aging and Alzheimer’s disease. Int. J. Alzheimers Dis. 2011, 2011, 535816. [Google Scholar]
- He, J.H.; Cui, Y.; Song, M.; Yang, Y.; Dang, Y.Y.; Jiang, T.Z.; Xu, R.X. Decreased functional connectivity between the mediodorsal thalamus and default mode network in patients with disorders of consciousness. Acta Neurol. Scand. 2015, 131, 145–151. [Google Scholar] [CrossRef] [PubMed]
- Wise, T.; Marwood, L.; Perkins, A.M.; Herane-Vives, A.; Joules, R.; Lythgoe, D.J.; Luh, W.M.; Williams, S.C.R.; Young, A.H.; Cleare, A.J.; et al. Instability of default mode network connectivity in major depression: A two-sample confirmation study. Transl. Psychiatry 2017, 7, e1105. [Google Scholar] [CrossRef] [Green Version]
- Anteraper, S.A.; Triantafyllou, C.; Sawyer, A.T.; Hofmann, S.G.; Gabrieli, J.D.; Whitfield-Gabrieli, S. Hyper-connectivity of subcortical resting-state networks in social anxiety disorder. Brain Connect. 2014, 4, 81–90. [Google Scholar] [CrossRef] [Green Version]
- Maresh, E.L.; Allen, J.P.; Coan, J.A. Increased default mode network activity in socially anxious individuals during reward processing. Biol. Mood Anxiety Disord. 2014, 4, 1–12. [Google Scholar] [CrossRef] [Green Version]
- Brühl, A.B.; Rufer, M.; Delsignore, A.; Kaffenberger, T.; Jäncke, L.; Herwig, U. Neural correlates of altered general emotion processing in social anxiety disorder. Brain Res. 2011, 1378, 72–83. [Google Scholar] [CrossRef]
- Pannekoek, J.N.; Veer, I.M.; Van Tol, M.J.; Van der Werff, S.J.A.; Demenescu, L.R.; Aleman, A.; Veltman, D.J.; Zitman, F.G.; Rombouts, S.A.R.B.; Van der Wee, N.J.A. Resting-state functional connectivity abnormalities in limbic and salience networks in social anxiety disorder without comorbidity. Eur. Neuropsychopharmacol. 2013, 23, 186–195. [Google Scholar] [CrossRef] [PubMed] [Green Version]
- Warwick, J.M.; Carey, P.; Jordaan, G.P.; Dupont, P.; Stein, D.J. Resting brain perfusion in social anxiety disorder: A voxel-wise whole brain comparison with healthy control subjects. Prog. Neuro Psychopharmacol. Biol. Psychiatry 2008, 32, 1251–1256. [Google Scholar] [CrossRef]
- Ding, M.; Chen, Y.; Bressler, S.L. 17 Granger causality: Basic theory and application to neuroscience. In Handbook of Time Series Analysis: Recent Theoretical Developments and Applications; Wiley-VCH: Weiniheim, Germany, 2006; Volume 437. [Google Scholar]
- Faul, F.; Erdfelder, E.; Lang, A.G.; Buchner, A. G*Power 3: A flexible statistical power analysis program for the social, behavioral, and biomedical sciences. Behav. Res. Methods 2007, 39, 175–191. [Google Scholar] [CrossRef]
- Association, A.P. Diagnostic and statistical manual of mental disorders. BMC Med. 2013, 17, 133–137. [Google Scholar]
- JAVA Declaration of Helsinki World Medical Association Declaration of Helsinki. Bull. World Health Organ. 2013, 79, 373–374.
- Vecchio, F.; Miraglia, F.; Curcio, G.; Della Marca, G.; Vollono, C.; Mazzucchi, E.; Bramanti, P.; Rossini, P.M. Cortical connectivity in fronto-temporal focal epilepsy from EEG analysis: A study via graph theory. Clin. Neurophysiol. 2015, 126, 1108–1116. [Google Scholar] [CrossRef]
- Al-Ezzi, A.; Kamel, N.; Faye, I.; Ebenezer, E.G.M. EEG Frontal Theta-Beta Ratio and Frontal Midline Theta for the Assessment of Social Anxiety Disorder. In Proceedings of the 2020 10th IEEE International Conference on Control System, Computing and Engineering (ICCSCE), Penang, Malaysia, 21–22 August 2020; pp. 107–112. [Google Scholar]
- Sheela, P.; Puthankattil, S.D. A hybrid method for artifact removal of visual evoked eeg. J. Neurosci. Methods 2020, 336, 108638. [Google Scholar] [CrossRef] [PubMed]
- Delorme, A.; Makeig, S. EEGLAB: An open sorce toolbox for analysis of single-trail EEG dynamics including independent component anlaysis. J. Neurosci. Methods 2004, 134, 9–21. [Google Scholar] [CrossRef] [Green Version]
- Yu, M.; Gouw, A.A.; Hillebrand, A.; Tijms, B.M.; Stam, C.J.; van Straaten, E.C.W.; Pijnenburg, Y.A.L. Different functional connectivity and network topology in behavioral variant of frontotemporal dementia and Alzheimer’s disease: An EEG study. Neurobiol. Aging 2016, 42, 150–162. [Google Scholar] [CrossRef]
- Konda, S.; Advisor, D.; Woyczynski, W.A. Fitting Models of Nonstationary Time Series: An Application to EEG Data. Ph.D. Thesis, Case Western Reserve University, Cleveland, OH, USA, 2006. [Google Scholar]
- Pascual-Marqui, R.D.; Lehmann, D.; Koukkou, M.; Kochi, K.; Anderer, P.; Saletu, B.; Tanaka, H.; Hirata, K.; John, E.R.; Prichep, L.; et al. Assessing interactions in the brain with exact low-resolution electromagnetic tomography. Philos. Trans. R. Soc. A Math. Phys. Eng. Sci. 2011, 369, 3768–3784. [Google Scholar] [CrossRef] [PubMed]
- Grech, R.; Cassar, T.; Muscat, J.; Camilleri, K.P.; Fabri, S.G.; Zervakis, M.; Xanthopoulos, P.; Sakkalis, V.; Vanrumste, B. Review on solving the inverse problem in EEG source analysis. J. Neuroeng. Rehabil. 2008, 5, 1–33. [Google Scholar] [CrossRef] [PubMed] [Green Version]
- Lopez Rincon, A.; Shimoda, S. The inverse problem in electroencephalography using the bidomain model of electrical activity. J. Neurosci. Methods 2016, 274, 94–105. [Google Scholar] [CrossRef] [PubMed] [Green Version]
- Pascual-Marqui, R.D. Discrete, 3D distributed linear imaging methods of electric neuronal activity. Part 1: Exact, zero error localization. arXiv 1985, arXiv:0710.3341. [Google Scholar]
- Liu, Q.; Farahibozorg, S.; Porcaro, C.; Wenderoth, N.; Mantini, D. Detecting large-scale networks in the human brain using high-density electroencephalography. Hum. Brain Mapp. 2017, 38, 4631–4643. [Google Scholar] [CrossRef] [PubMed] [Green Version]
- De Pasquale, F.; Della Penna, S.; Snyder, A.Z.; Lewis, C.; Mantini, D.; Marzetti, L.; Belardinelli, P.; Ciancetta, L.; Pizzella, V.; Romani, G.L.; et al. Temporal dynamics of spontaneous MEG activity in brain networks. Proc. Natl. Acad. Sci. USA 2010, 107, 6040–6045. [Google Scholar] [CrossRef] [Green Version]
- Koshino, H.; Minamoto, T.; Yaoi, K.; Osaka, M.; Osaka, N. Coactivation of the default mode network regions and working memory network regions during task preparation. Sci. Rep. 2014, 4, 5954. [Google Scholar] [CrossRef] [Green Version]
- Fransson, P. Spontaneous low-frequency BOLD signal fluctuations: An fMRI investigation of the resting-state default mode of brain function hypothesis. Hum. Brain Mapp. 2005, 26, 15–29. [Google Scholar] [CrossRef]
- Raichle, M.E.; MacLeod, A.M.; Snyder, A.Z.; Powers, W.J.; Gusnard, D.A.; Shulman, G.L. A default mode of brain function. Proc. Natl. Acad. Sci. USA 2001, 98, 676–682. [Google Scholar] [CrossRef] [Green Version]
- Greicius, M.D.; Srivastava, G.; Reiss, A.L.; Menon, V. Default-mode network activity distinguishes Alzheimer’s disease from healthy aging: Evidence from functional MRI. Proc. Natl. Acad. Sci. USA 2004, 101, 4637–4642. [Google Scholar] [CrossRef] [Green Version]
- Khan, D.; Kamel, N.; Muzaimi, M.; Hill, T. Effective Connectivity for Default Mode Network Analysis of Alcoholism. Brain Connect. 2020. [Google Scholar] [CrossRef]
- Mazziotta, J.; Toga, A.; Evans, A.; Fox, P.; Lancaster, J.; Zilles, K.; Woods, R.; Paus, T.; Simpson, G.; Pike, B.; et al. A probabilistic atlas and reference system for the human brain: International Consortium for Brain Mapping (ICBM). Philos. Trans. R. Soc. B Biol. Sci. 2001, 356, 1293–1322. [Google Scholar] [CrossRef] [PubMed]
- Valdes-Sosa, P.A.; Roebroeck, A.; Daunizeau, J.; Friston, K. Effective connectivity: Influence, causality and biophysical modeling. Neuroimage 2011, 58, 339–361. [Google Scholar] [CrossRef] [PubMed]
- Addis, D.R.; McIntosh, A.R.; Moscovitch, M.; Crawley, A.P.; McAndrews, M.P. Characterizing spatial and temporal features of autobiographical memory retrieval networks: A partial least squares approach. Neuroimage 2004, 23, 1460–1471. [Google Scholar] [CrossRef]
- Knutson, K.M.; Dal Monte, O.; Schintu, S.; Wassermann, E.M.; Raymont, V.; Grafman, J.; Krueger, F. Areas of brain damage underlying increased reports of behavioral disinhibition. J. Neuropsychiatry Clin. Neurosci. 2015, 27, 193–198. [Google Scholar] [CrossRef] [PubMed] [Green Version]
- Euston, D.R.; Gruber, A.J.; McNaughton, B.L. The Role of Medial Prefrontal Cortex in Memory and Decision Making. Neuron 2012, 76, 1057–1070. [Google Scholar] [CrossRef] [Green Version]
- Cavanna, A.E.; Trimble, M.R. The precuneus: A review of its functional anatomy and behavioural correlates. Brain 2006, 129, 564–583. [Google Scholar] [CrossRef] [Green Version]
- Wu, Y.; Wang, J.; Zhang, Y.; Zheng, D.; Zhang, J.; Rong, M.; Wu, H.; Wang, Y.; Zhou, K.; Jiang, T. The Neuroanatomical Basis for Posterior Superior Parietal Lobule Control Lateralization of Visuospatial Attention. Front. Neuroanat. 2016, 10, 32. [Google Scholar] [CrossRef] [Green Version]
- Cañas, A.; Juncadella, M.; Lau, R.; Gabarrós, A.; Hernández, M. Working memory deficits after lesions involving the supplementary motor area. Front. Psychol. 2018, 9, 765. [Google Scholar] [CrossRef] [Green Version]
- Seydell-Greenwald, A.; Ferrara, K.; Chambers, C.E.; Newport, E.L.; Landau, B. Bilateral parietal activations for complex visual-spatial functions: Evidence from a visual-spatial construction task. Neuropsychologia 2017, 106, 194–206. [Google Scholar] [CrossRef]
- Mathew, P.; Batchala, P.P.; Eluvathingal Muttikkal, T.J. Supplementary Motor Area Stroke Mimicking Functional Disorder. Stroke 2018, 49, e28–e30. [Google Scholar] [CrossRef]
- Wong, Q.J.J.; Gregory, B.; McLellan, L.F. A Review of Scales to Measure Social Anxiety Disorder in Clinical and Epidemiological Studies. Curr. Psychiatry Rep. 2016, 18, 38. [Google Scholar] [CrossRef] [PubMed]
- Thompson, T.; Kaminska, M.; Marshall, C.; Van Zalk, N. Evaluation of the social phobia scale and social interaction anxiety scale as assessments of performance and interaction anxiety. Psychiatry Res. 2019, 273, 725–731. [Google Scholar] [CrossRef] [PubMed]
- Wong, N.; Sarver, D.E.; Beidel, D.C. Quality of life impairments among adults with social phobia: The impact of subtype. J. Anxiety Disord. 2012, 26, 50–57. [Google Scholar] [CrossRef] [PubMed] [Green Version]
- Modini, M.; Abbott, M.J.; Hunt, C. A Systematic Review of the Psychometric Properties of Trait Social Anxiety Self-Report Measures. J. Psychopathol. Behav. Assess. 2015, 37, 645–662. [Google Scholar] [CrossRef]
- Drezner, Z.; Turel, O.; Zerom, D. A modified kolmogorov-smirnov test for normality. Commun. Stat. Simul. Comput. 2010, 39, 693–704. [Google Scholar] [CrossRef] [Green Version]
- Schober, P.; Boer, C.; Schwarte, L.A. Correlation Coefficients. Anesth. Analg. 2018, 126, 1763–1768. [Google Scholar] [CrossRef]
- Knyazev, G.G.; Savostyanov, A.N.; Levin, E.A. Alpha oscillations as a correlate of trait anxiety. Int. J. Psychophysiol. 2004, 53, 147–160. [Google Scholar] [CrossRef]
- Amodio, D.M.; Frith, C.D. Meeting of minds: The medial frontal cortex and social cognition. Nat. Rev. Neurosci. 2006, 7, 268–277. [Google Scholar] [CrossRef] [PubMed]
- Spreng, R.N. The Fallacy of a “Task-Negative” Network. Front. Psychol. 2012, 3, 145. [Google Scholar] [CrossRef] [PubMed] [Green Version]
- Northoff, G.; Heinzel, A.; de Greck, M.; Bermpohl, F.; Dobrowolny, H.; Panksepp, J. Self-referential processing in our brain-A meta-analysis of imaging studies on the self. Neuroimage 2006, 31, 440–457. [Google Scholar] [CrossRef]
- Qiu, C.; Feng, Y.; Meng, Y.; Liao, W.; Huang, X.; Lui, S.; Zhu, C.; Chen, H.; Gong, Q.; Zhang, W. Analysis of altered baseline brain activity in drug-naive adult patients with social anxiety disorder using resting-state functional MRI. Psychiatry Investig. 2015, 12, 372–380. [Google Scholar] [CrossRef]
- Xing, M.; Tadayonnejad, R.; MacNamara, A.; Ajilore, O.; DiGangi, J.; Phan, K.L.; Leow, A.; Klumpp, H. Resting-state theta band connectivity and graph analysis in generalized social anxiety disorder. NeuroImage Clin. 2017, 13, 24–32. [Google Scholar] [CrossRef] [Green Version]
- Coutinho, J.F.; Fernandesl, S.V.; Soares, J.M.; Maia, L.; Gonçalves, Ó.F.; Sampaio, A. Default mode network dissociation in depressive and anxiety states. Brain Imaging Behav. 2016, 10, 147–157. [Google Scholar] [CrossRef]
- Kilts, C.D.; Kelsey, J.E.; Knight, B.; Ely, T.D.; Bowman, F.D.B.; Gross, R.E.; Selvig, A.; Gordon, A.; Newport, D.J.; Nemeroff, C.B. The neural correlates of social anxiety disorder and response to pharmacotherapy. Neuropsychopharmacology 2006, 31, 2243–2253. [Google Scholar] [CrossRef]
- Chen, F.; Ke, J.; Qi, R.; Xu, Q.; Zhong, Y.; Liu, T.; Li, J.; Zhang, L.; Lu, G. Increased Inhibition of the Amygdala by the mPFC may Reflect a Resilience Factor in Post-traumatic Stress Disorder: A Resting-State fMRI Granger Causality Analysis. Front. Psychiatry 2018, 9, 516. [Google Scholar] [CrossRef] [Green Version]
- Simpson, J.R.; Snyder, A.Z.; Gusnard, D.A.; Raichle, M.E. Emotion-induced changes in human medial prefrontal cortex: I. During cognitive task performance. Proc. Natl. Acad. Sci. USA 2001, 98, 683–687. [Google Scholar] [CrossRef] [PubMed] [Green Version]
- Adolphs, R. Cognitive neuroscience: Cognitive neuroscience of human social behaviour. Nat. Rev. Neurosci. 2003, 4, 165–178. [Google Scholar] [CrossRef] [PubMed]
- Bowman, L.C.; Dodell-Feder, D.; Saxe, R.; Sabbagh, M.A. Continuity in the neural system supporting children’s theory of mind development: Longitudinal links between task-independent EEG and task-dependent fMRI. Dev. Cogn. Neurosci. 2019, 40, 100705. [Google Scholar] [CrossRef] [PubMed]
- Sheline, Y.I.; Barch, D.M.; Price, J.L.; Rundle, M.M.; Vaishnavi, S.N.; Snyder, A.Z.; Mintun, M.A.; Wang, S.; Coalson, R.S.; Raichle, M.E. The default mode network and self-referential processes in depression. Proc. Natl. Acad. Sci. USA 2009, 106, 1942–1947. [Google Scholar] [CrossRef] [PubMed] [Green Version]
- Irle, E.; Barke, A.; Lange, C.; Ruhleder, M. Parietal abnormalities are related to avoidance in social anxiety disorder: A study using voxel-based morphometry and manual volumetry. Psychiatry Res. Neuroimaging 2014, 224, 175–183. [Google Scholar] [CrossRef]
- Gentili, C.; Ricciardi, E.; Gobbini, M.I.; Santarelli, M.F.; Haxby, J.V.; Pietrini, P.; Guazzelli, M. Beyond amygdala: Default Mode Network activity differs between patients with Social Phobia and healthy controls. Brain Res. Bull. 2009, 79, 409–413. [Google Scholar] [CrossRef] [PubMed]
- Liao, W.; Chen, H.; Feng, Y.; Mantini, D.; Gentili, C.; Pan, Z.; Ding, J.; Duan, X.; Qiu, C.; Lui, S.; et al. Selective aberrant functional connectivity of resting state networks in social anxiety disorder. Neuroimage 2010, 52, 1549–1558. [Google Scholar] [CrossRef] [PubMed]
- Imperatori, C.; Farina, B.; Adenzato, M.; Valenti, E.M.; Murgia, C.; Della Marca, G.; Brunetti, R.; Fontana, E.; Ardito, R.B. Default mode network alterations in individuals with high-trait-anxiety: An EEG functional connectivity study. J. Affect. Disord. 2019, 246, 611–618. [Google Scholar] [CrossRef] [PubMed]
- Eldawlatly, S.; Oweiss, K. Graphical Models of Functional and Effective Neuronal Connectivity. In Statistical Signal Processing for Neuroscience and Neurotechnology; Elsevier Inc.: Amsterdam, The Netherlands, 2010; Chapter 5; pp. 129–174. ISBN 9780123750273. [Google Scholar]
- Al-Shargie, F.; Kiguchi, M.; Badruddin, N.; Dass, S.C.; Hani, A.F.M.; Tang, T.B. Mental stress assessment using simultaneous measurement of EEG and fNIRS. Biomed. Opt. Express 2016, 7, 3882. [Google Scholar] [CrossRef] [PubMed] [Green Version]
- Al-Shargie, F.M.; Hassanin, O.; Tariq, U.; Al-Nashash, H. EEG-Based Semantic Vigilance Level Classification Using Directed Connectivity Patterns and Graph Theory Analysis. IEEE Access 2020, 8, 115941–115956. [Google Scholar] [CrossRef]


| Group | Number of Participants | Total | Age | SIAS Score | |||
|---|---|---|---|---|---|---|---|
| Female | Male | Female | Male | Female | Male | ||
| Severe | 12 | 10 | 22 | 22.13 ± 2.78 | 23.11 ± 1.02 | 67.53 ± 6.21 | 66.81 ± 5.32 |
| Moderate | 7 | 15 | 22 | 21.98 ± 3.11 | 22.21 ± 1.25 | 55.7 3± 7.81 | 54.41 ± 6.61 |
| Mild | 12 | 10 | 22 | 22.61 ± 2.32 | 21.71 ± 2.31 | 38.32 ± 512 | 37.71 ± 5.81 |
| Control | 8 | 14 | 22 | 21.76 ± 1.73 | 23.62 ± 1.65 | 14.71 ± 6.74 | 16.61 ± 7.34 |
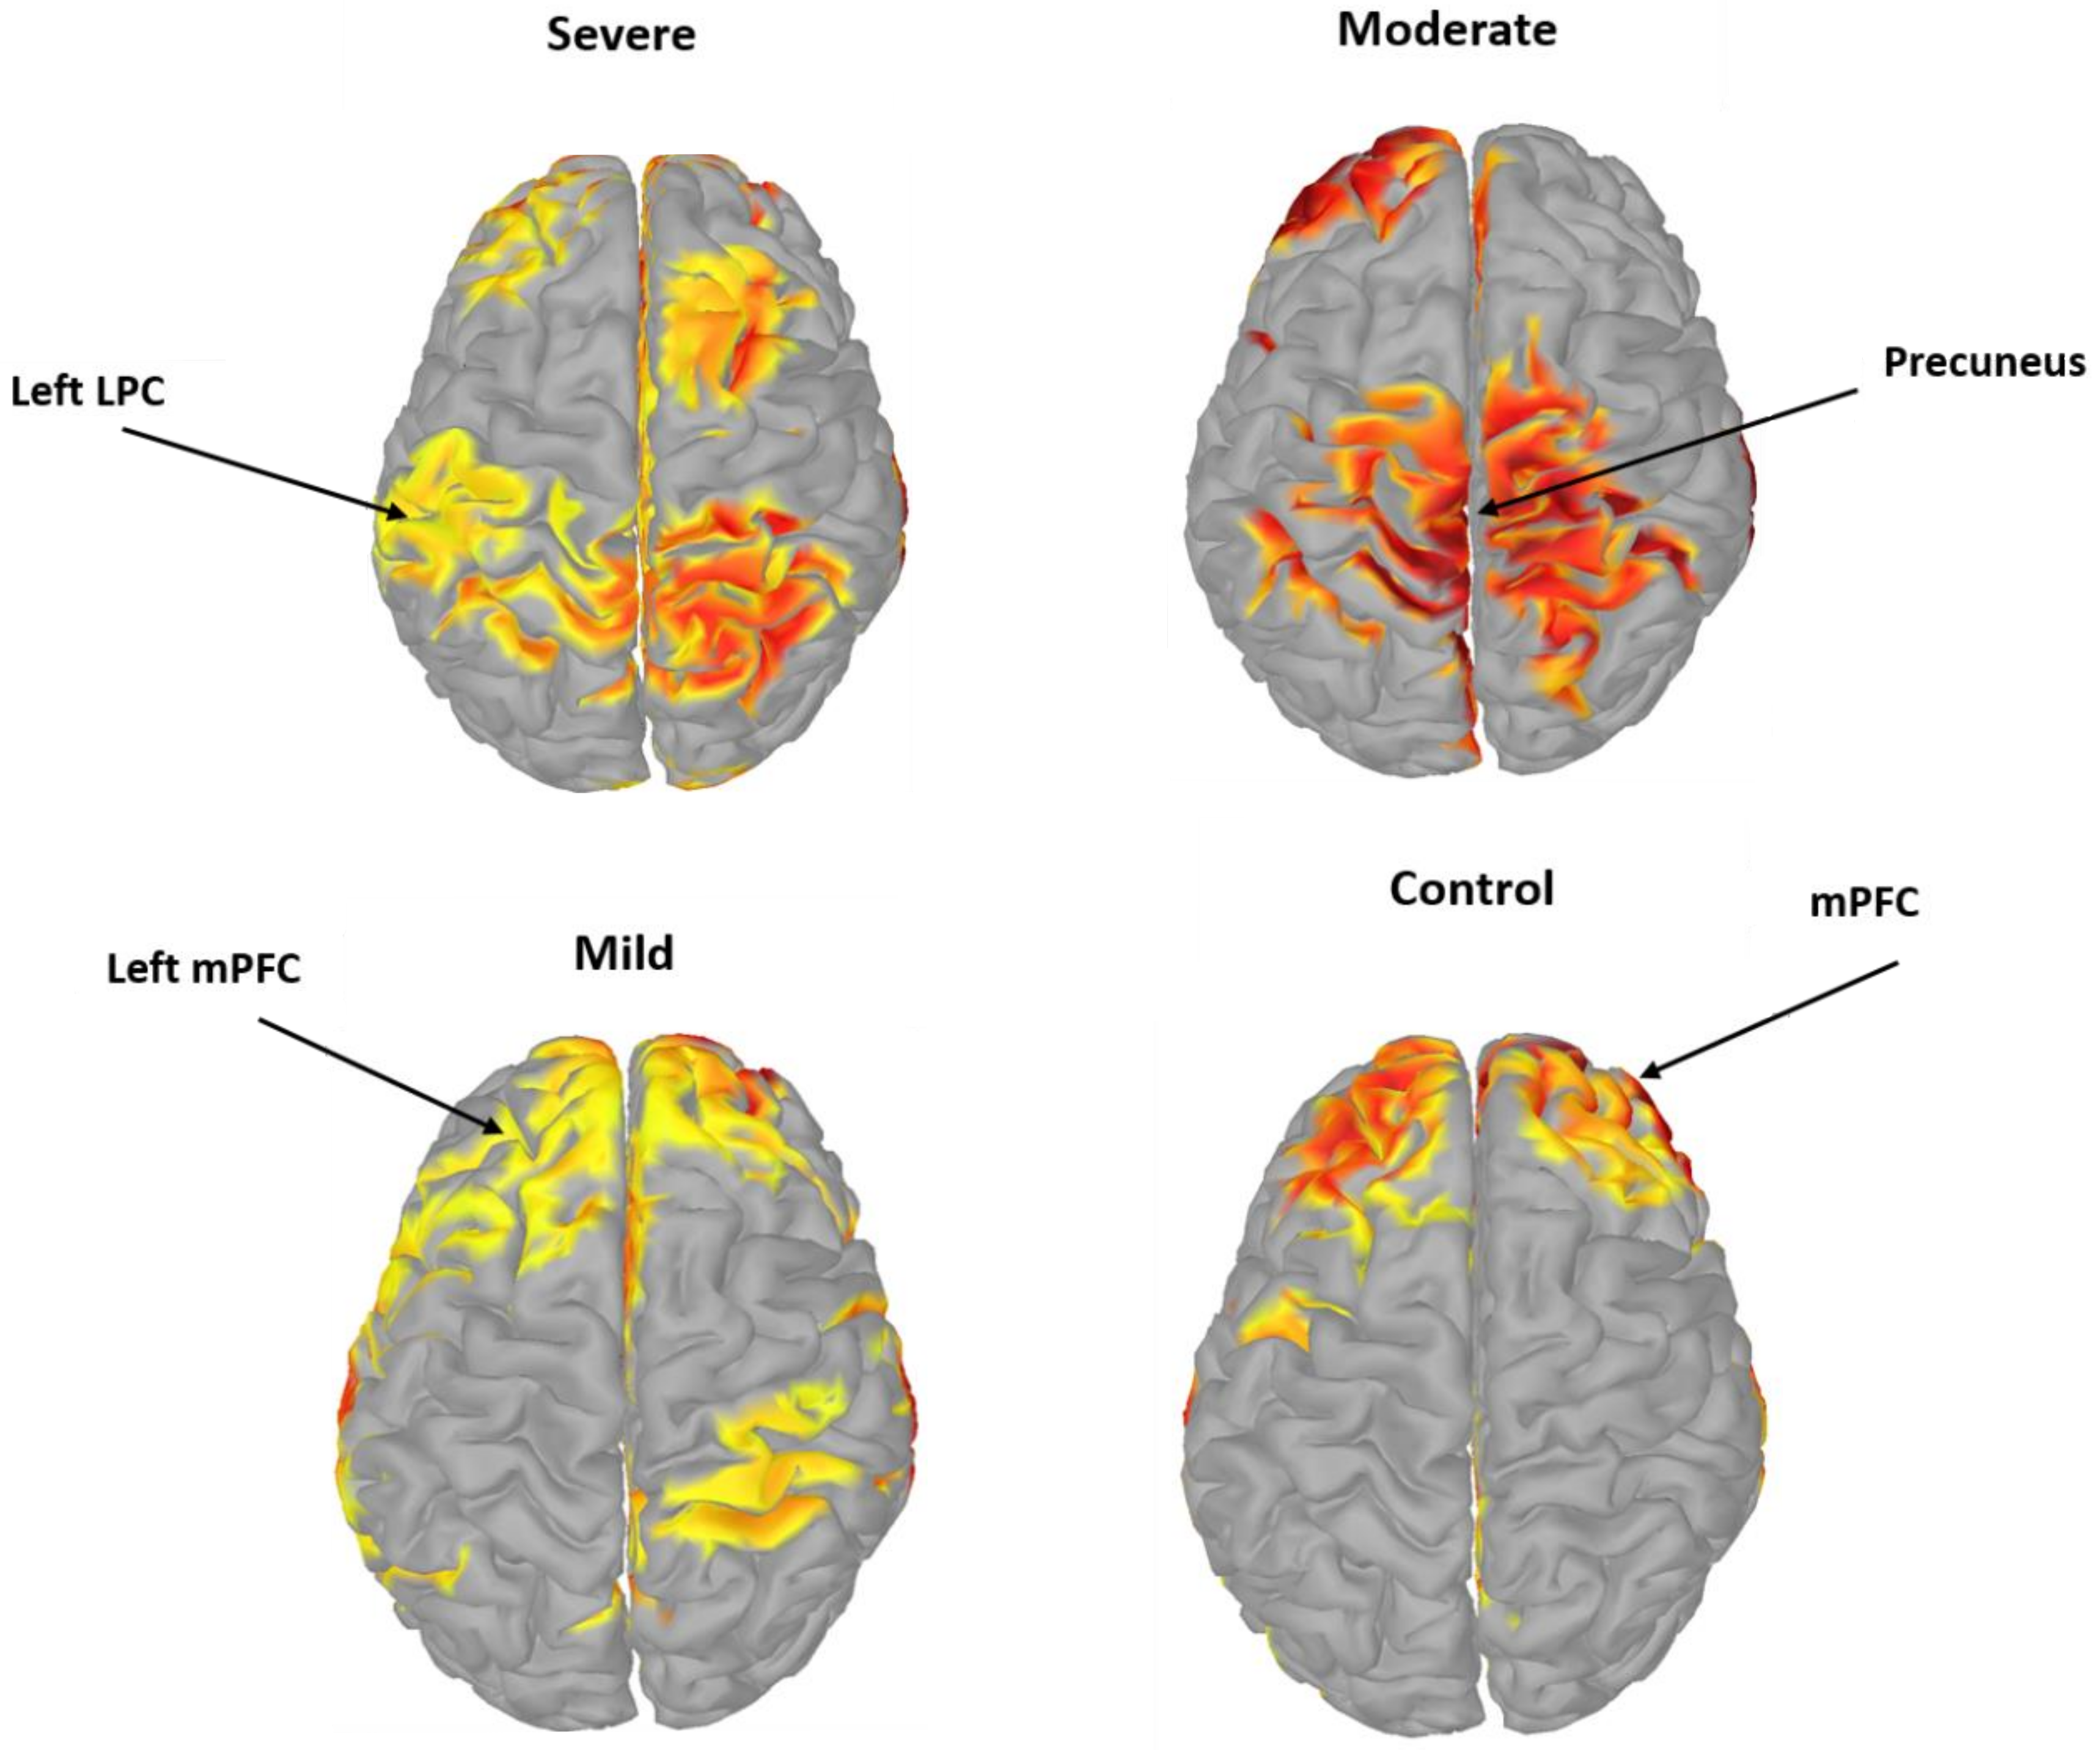
| ROI | MNI Coordinates | Anatomical Regions | BA | Function | ||
|---|---|---|---|---|---|---|
| x | y | z | ||||
| FZ | 0.6 | 40.9 | 53.9 | Central mPFC | 8,9,10 | Attention [47] |
| F3 | −35.5 | 40.9 | 32.1 | Left mPFC | 8,9,10 | Executive control of behavior [48] |
| F4 | 40.2 | 47.6 | 32.1 | Right mPFC | 8,9,10 | Memory and decision making [49] |
| PZ | 0.2 | −62.1 | 64.5 | PCC/Precuneus | 7 | Pain perception & goal processing [50] |
| P3 | −39.5 | −76.3 | 47.4 | Left LPC | 39,40 | Theory of mind [51] |
| P4 | 38.8 | −74.9 | 49.2 | Right LPC | 39,40 | Recognition and working memory [52] |
| CP5 | −62 | −42 | 32 | Left supramarginal cortex | 40 | Visuospatial processing [53] |
| CP6 | 66 | −34 | 40 | Right supramarginal cortex | 40 | Planning and motor imagery [54] |
| Band | Independent Variables | F | p Value | η2 |
|---|---|---|---|---|
| Delta | SAD Groups | 3.937 | 0.009 | 0.1 |
| Theta | SAD Groups | 2.389 | 0.069 | 0.05 |
| Alpha | SAD Groups | 3.766 | 0.001 | 0.1 |
| Low beta | SAD Groups | 0.410 | 0.196 | 0.04 |
| High beta | SAD Groups | 1.571 | 0.746 | 0.04 |
| Ref | Method | Network | No. Subjects | Main Findings |
|---|---|---|---|---|
| [20] | fMRI | DMN | 84 | Increased DMN activity in PCC and LPC. |
| [22] | fMRI | Salience network & DMN | 12 | DMN connectivity was not different between groups. |
| [75] | fMRI | DMN | 8 | SAD showed higher activation in the precuneus than HCs. |
| [76] | fMRI | DMN | 40 | The FC in the right precuneus had decreased in SAD patients as compared to HC. |
| [77] | EEG | DMN | 47 | SAD individuals showed a decrease of FC between mPFC and PCC. |
| This study | EEG | DMN | 88 | Enhanced EC between the DMN regions in SAD patients compared to HCs in resting-state. |
Publisher’s Note: MDPI stays neutral with regard to jurisdictional claims in published maps and institutional affiliations. |
© 2021 by the authors. Licensee MDPI, Basel, Switzerland. This article is an open access article distributed under the terms and conditions of the Creative Commons Attribution (CC BY) license (https://creativecommons.org/licenses/by/4.0/).
Share and Cite
Al-Ezzi, A.; Kamel, N.; Faye, I.; Gunaseli, E. Analysis of Default Mode Network in Social Anxiety Disorder: EEG Resting-State Effective Connectivity Study. Sensors 2021, 21, 4098. https://doi.org/10.3390/s21124098
Al-Ezzi A, Kamel N, Faye I, Gunaseli E. Analysis of Default Mode Network in Social Anxiety Disorder: EEG Resting-State Effective Connectivity Study. Sensors. 2021; 21(12):4098. https://doi.org/10.3390/s21124098
Chicago/Turabian StyleAl-Ezzi, Abdulhakim, Nidal Kamel, Ibrahima Faye, and Esther Gunaseli. 2021. "Analysis of Default Mode Network in Social Anxiety Disorder: EEG Resting-State Effective Connectivity Study" Sensors 21, no. 12: 4098. https://doi.org/10.3390/s21124098