
Efficient IoT-Based Control for a Smart Subsurface Irrigation System to Enhance Irrigation Management of Date Palm


Abstract
:1. Introduction
- Design and construct a modern subsurface irrigation system for date palm irrigation.
- Design and install an autonomous sensors’ network to instantly collect the volumetric moisture content for sensor-based irrigation scheduling and climatic parameters for time-based irrigation scheduling.
- Employ the ThingSpeak cloud platform to host our data, perform algorithmic analysis, create event-based alerts to the user, create event-based alerts to the user, and send instructions to the IoT devices of the applied irrigation scheduling method.
- Study the impact of the controlled subsurface irrigation system on irrigation water consumption, water productivity, and yield of date palm compared with applied traditional surface irrigation system in the experimental area.
2. Materials and Methods
2.1. Experimental Site
2.2. Description of the Controlled Subsurface Irrigation System
2.2.1. Design of Subsurface Irrigation System
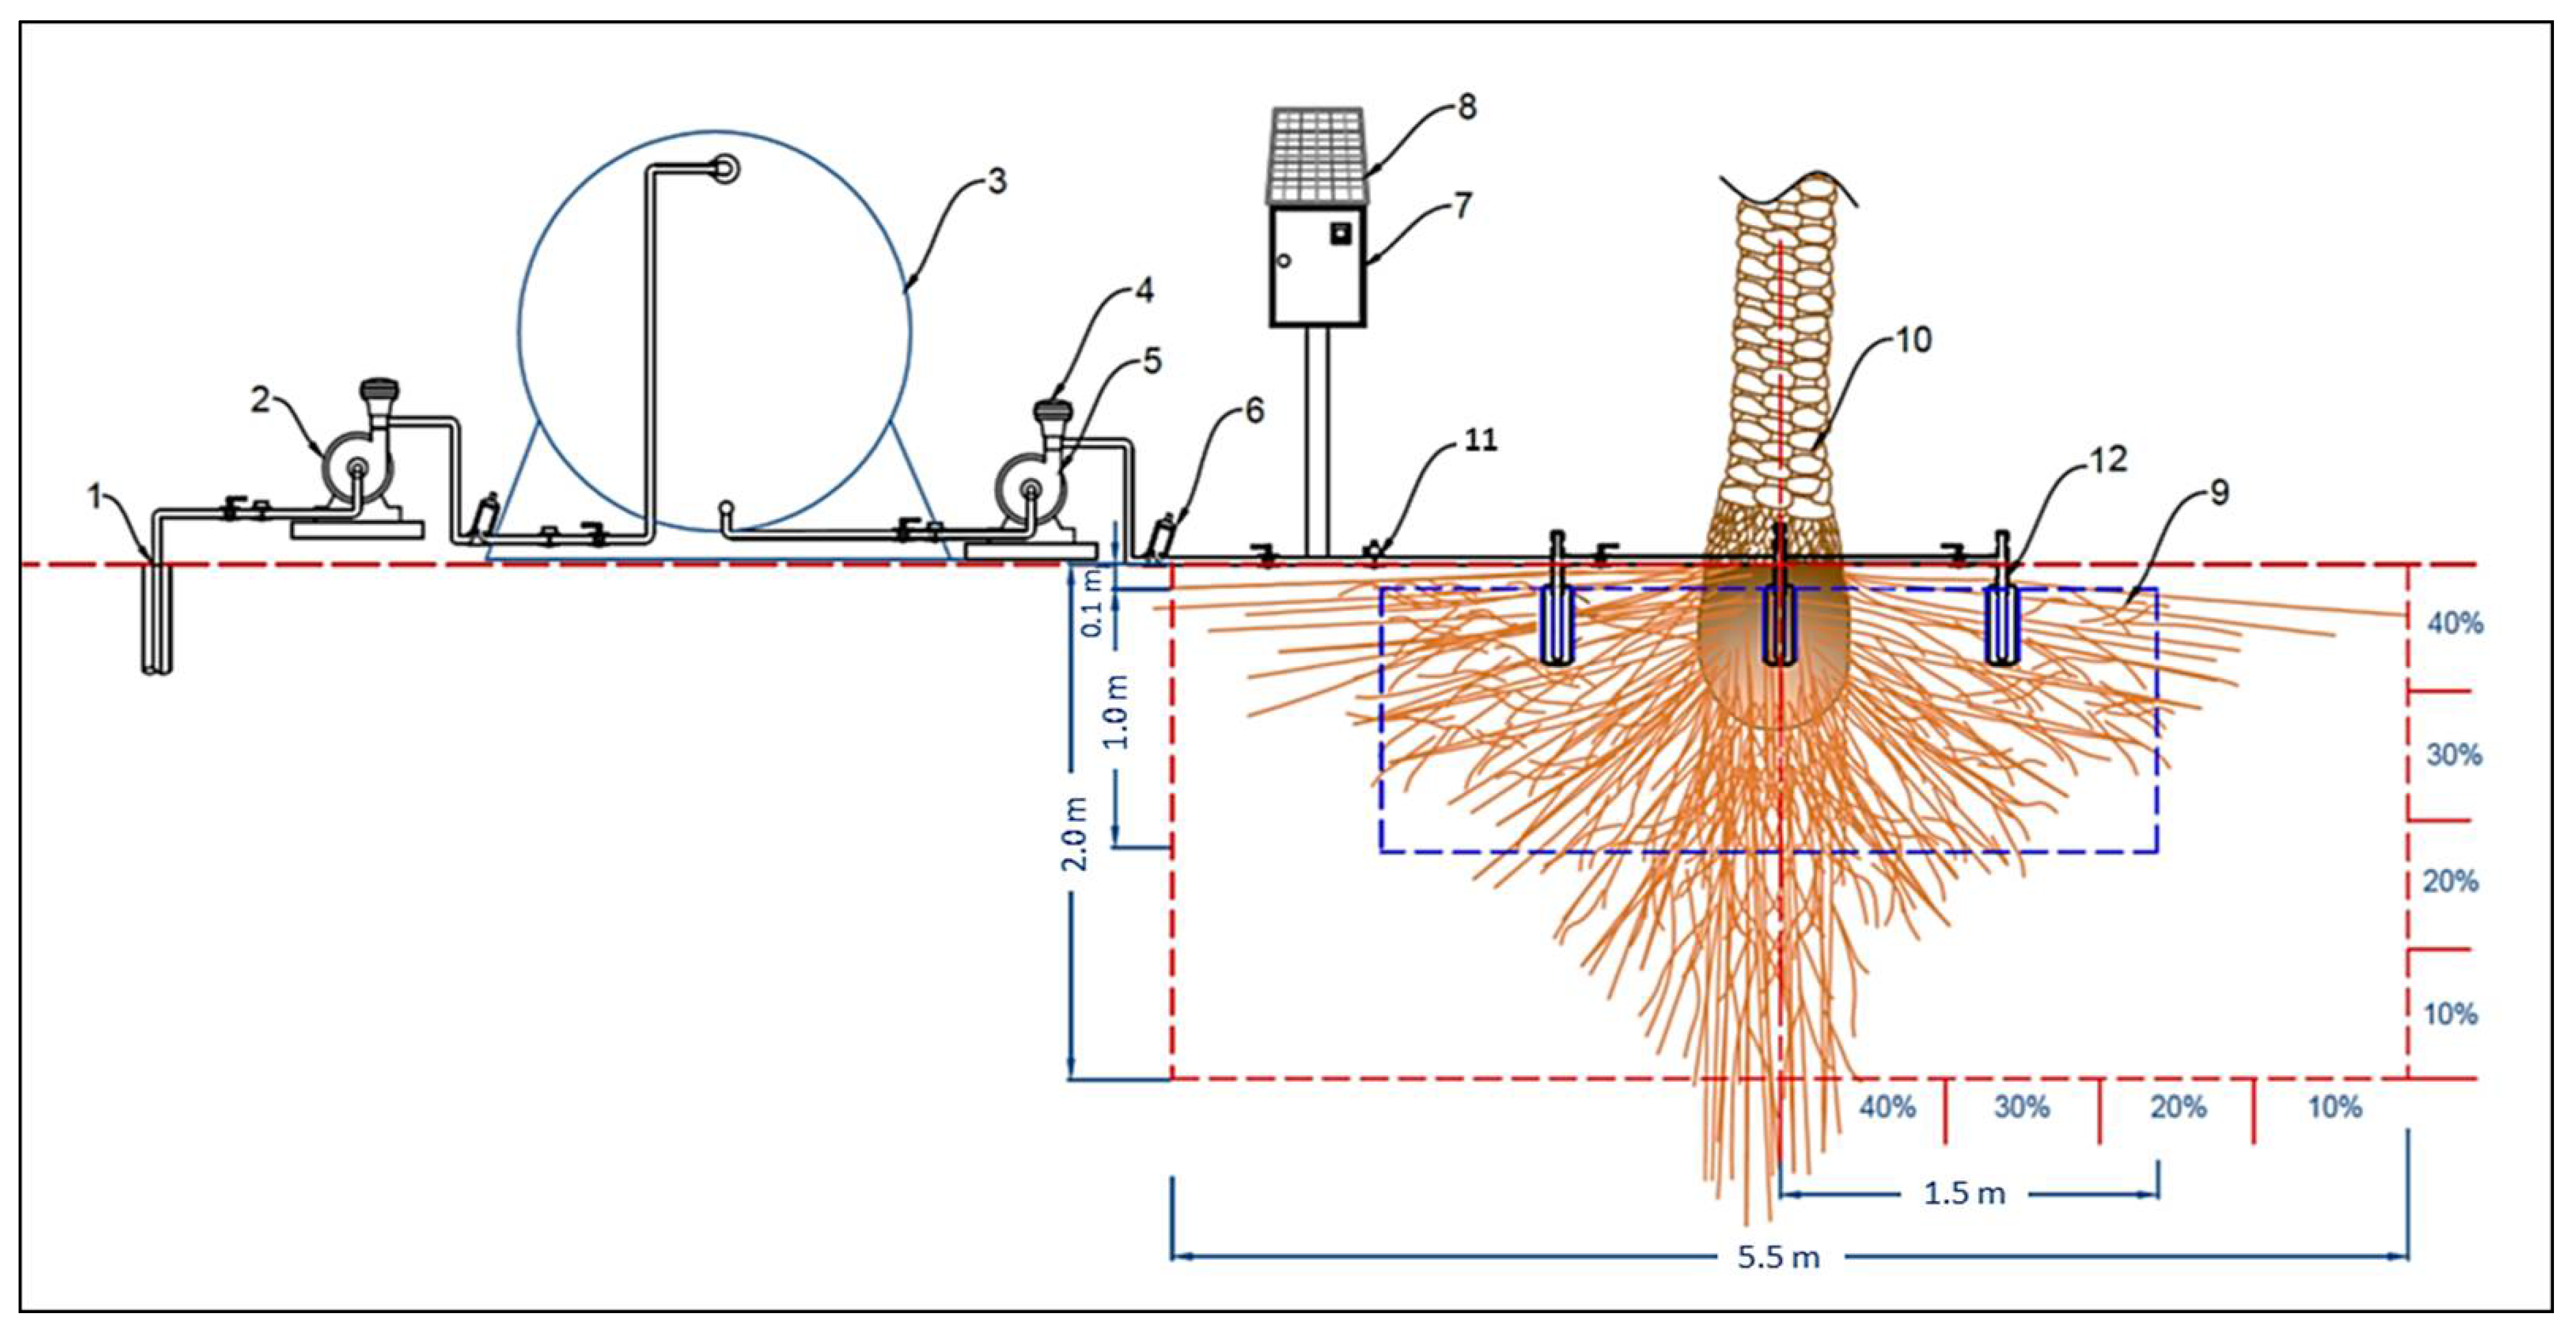
- Water source and pump set: The source of water used for the experiment was from a groundwater well at the site of the experiment. The water is pumped from the well to the water tank using a 2 kW water pump. The water tank was made of polyethylene and had a volume of 5 m3. Another water pump (1 kW) was used to supply the designed irrigation network with sufficient irrigation water at the required pressure.
- Irrigation network: The irrigation network included the mainline, sub mains, and feeder ring pipe made of high-density polyethylene (HDPE) with diameters of 0.05 m, 0.03 m, and 0.025 m. The irrigation network also the disc filters (120 mesh, 130 microns), manual valves, solenoid valves, among other irrigation accessories.
- Power source and control unit: The power source of the control unit that included the electronic devices and power source of sensors were taken from a battery (12 V, 55 Ah). A 50 W solar panel charges this battery with a charging regulator.
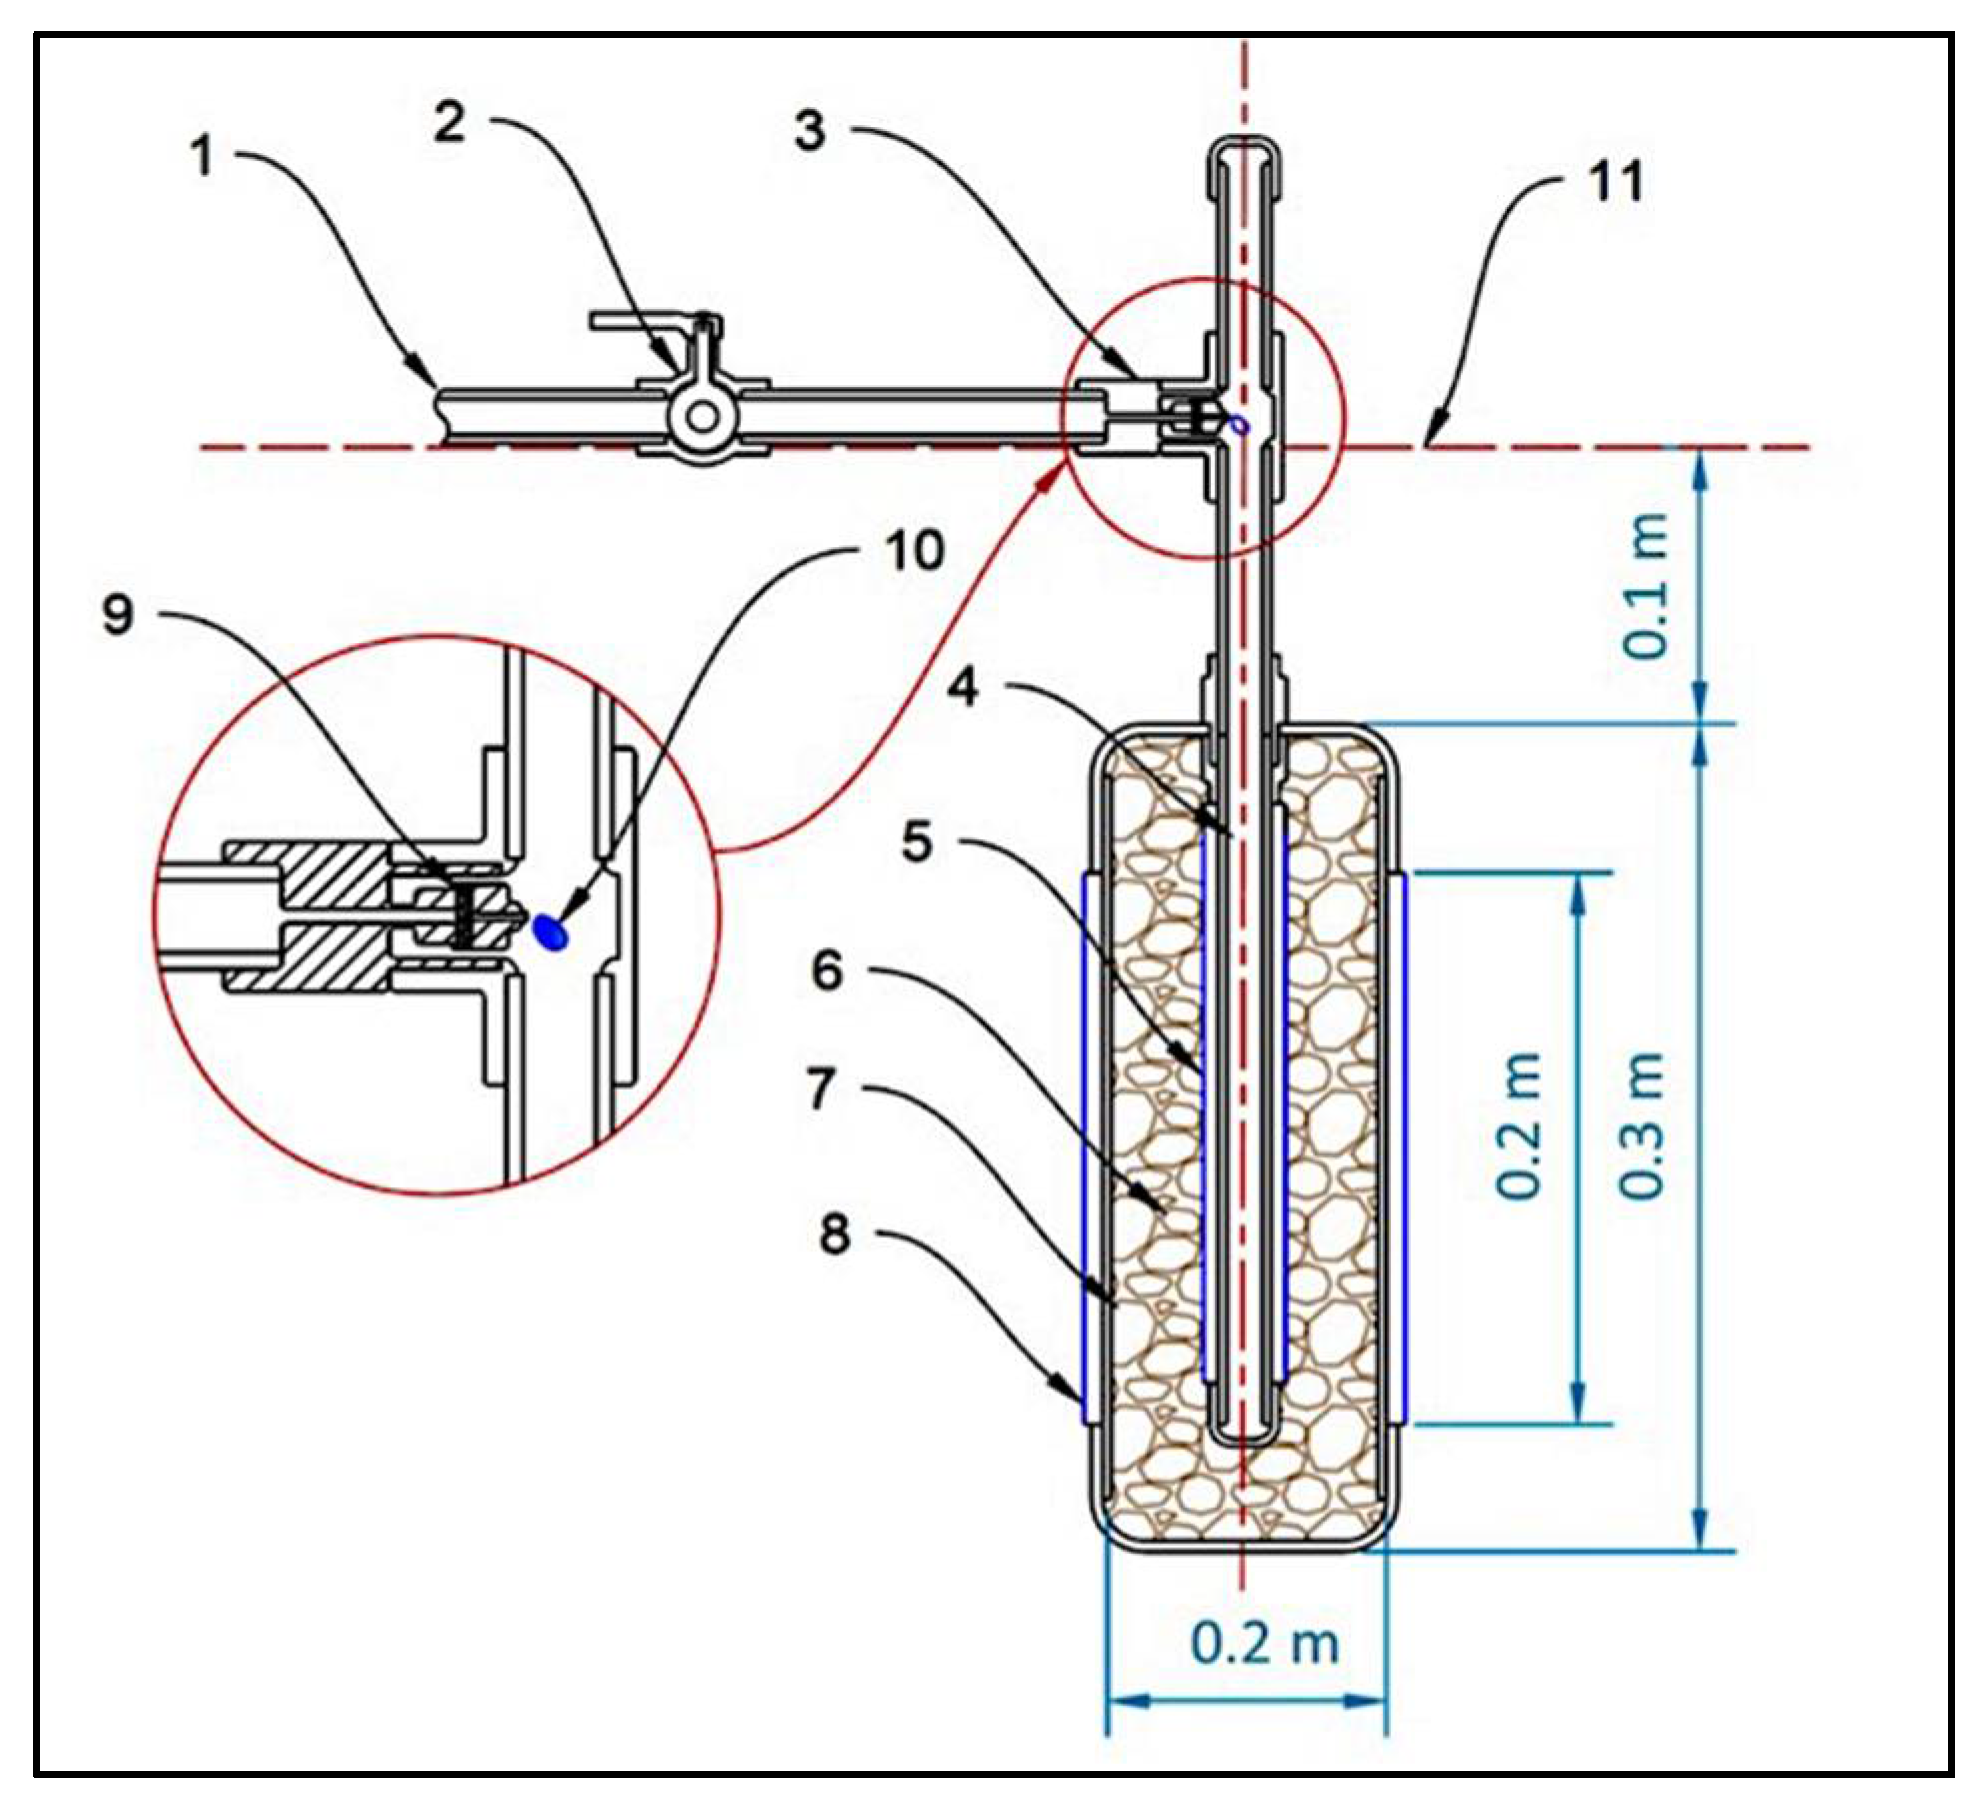
- Subsurface irrigation unit (SIU): The SIU consisted of two perforated pipes made from polyvinyl chloride (PVC) wrapped with a filtering cloth to prevent the transfer of fine soil inside the unit, as shown in Figure 2.
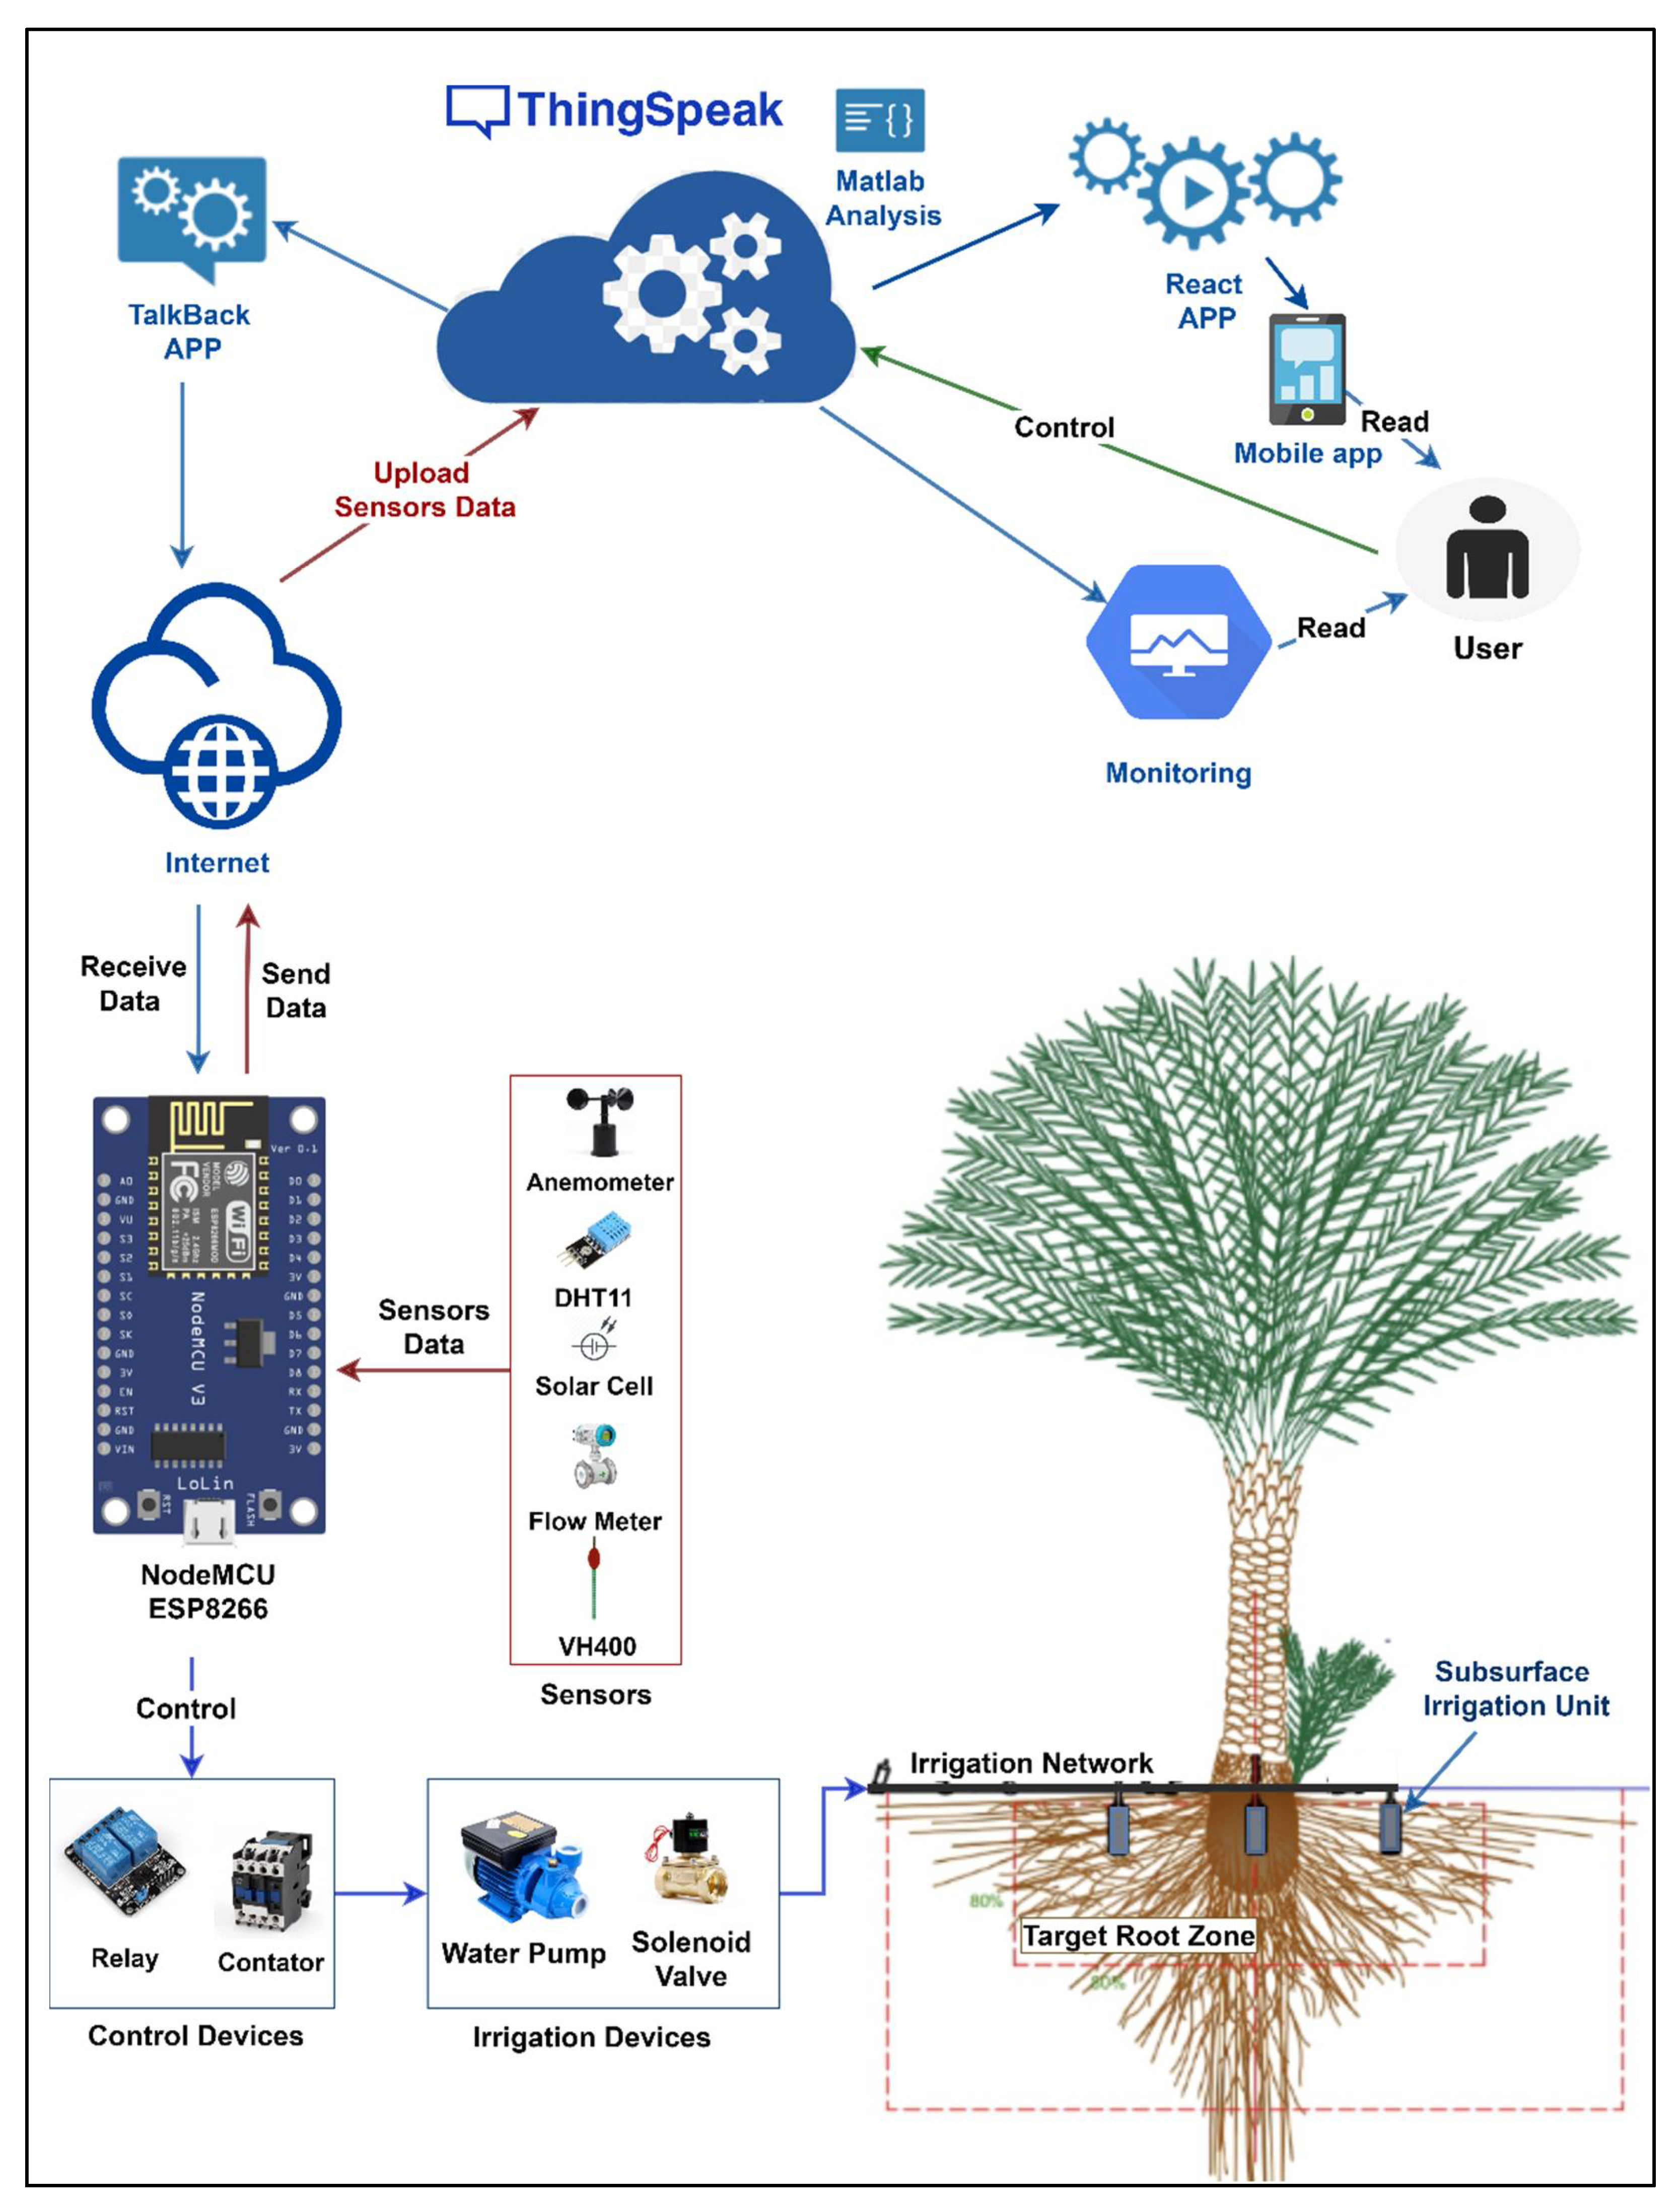
2.2.2. IoT System Architecture
- Experimental field: we conducted our experiments (for the CSIS cloud IoT solution) over nine-date palm trees divided into three replications (R1, R2, and R3). The sensors of the designed system are deployed around the center palm tree for each replicate.
- Electrical and electronic devices: we employed the following electrical and electronic devices for each replicate in our experimental field—the NodeMCU (ESP8266 Shenzhen Quine Trading Co., Ltd., Shenzhen, China) as a microcontroller unit. We used a water pump, a solenoid valve, an anemometer, and a flow meter.
- Internet in the study area: to provide the Internet in the study area, we used a data SIM card of a local communications network and a 4G Router (HUAWEI, Hunan JENET Technology Co., Ltd. Changsha, China. As soon as the SIM card is plugged in HUAWEI 4G router and turn it on, the NodeMCUs instantly have Wi-Fi access. Then the NodeMCUs immediately connect to the Internet. The router was plugged all-time with a 5 V power source using an inverter (12 V to 5 V, 2.1 A) connected with the battery of our system. No problems with internet connection were observed in the study area during the trial period. The used router can connect up to 32 wireless devices, providing a fast and stable connection for all used NodeMCUs.
- A set of sensors: we employed three VH400 sensors (Vegetronix, Inc., Riverton, Salt Lake County, UT, USA) for each replicate. It is used to measure the VWC. Each of these VH400 sensors is installed between two subsurface irrigation (SIS) units at 0.8 m from the date palm tree trunk and 0.3 m depth. We used two DHT11 sensors for measuring relative humidity percentage and air temperature in the study area. Also, we measured the solar radiation by installing two solar cells under the shadow of the center date palm tree.
- ThingSpeak cloud platform: we upload the measurements collected from the set of sensors by using the ESP8266 module to our private channel on the ThingSpeak cloud platform. We employed MATLAB Analysis, TalkBack App, and React App (Mathematical computing software, Natick, MA, USA) to make decisions through the cloud platform.
- Monitoring interface: the user uses this to monitor the graphical data generated by our private channel on the ThingSpeak cloud platform.
- (1)
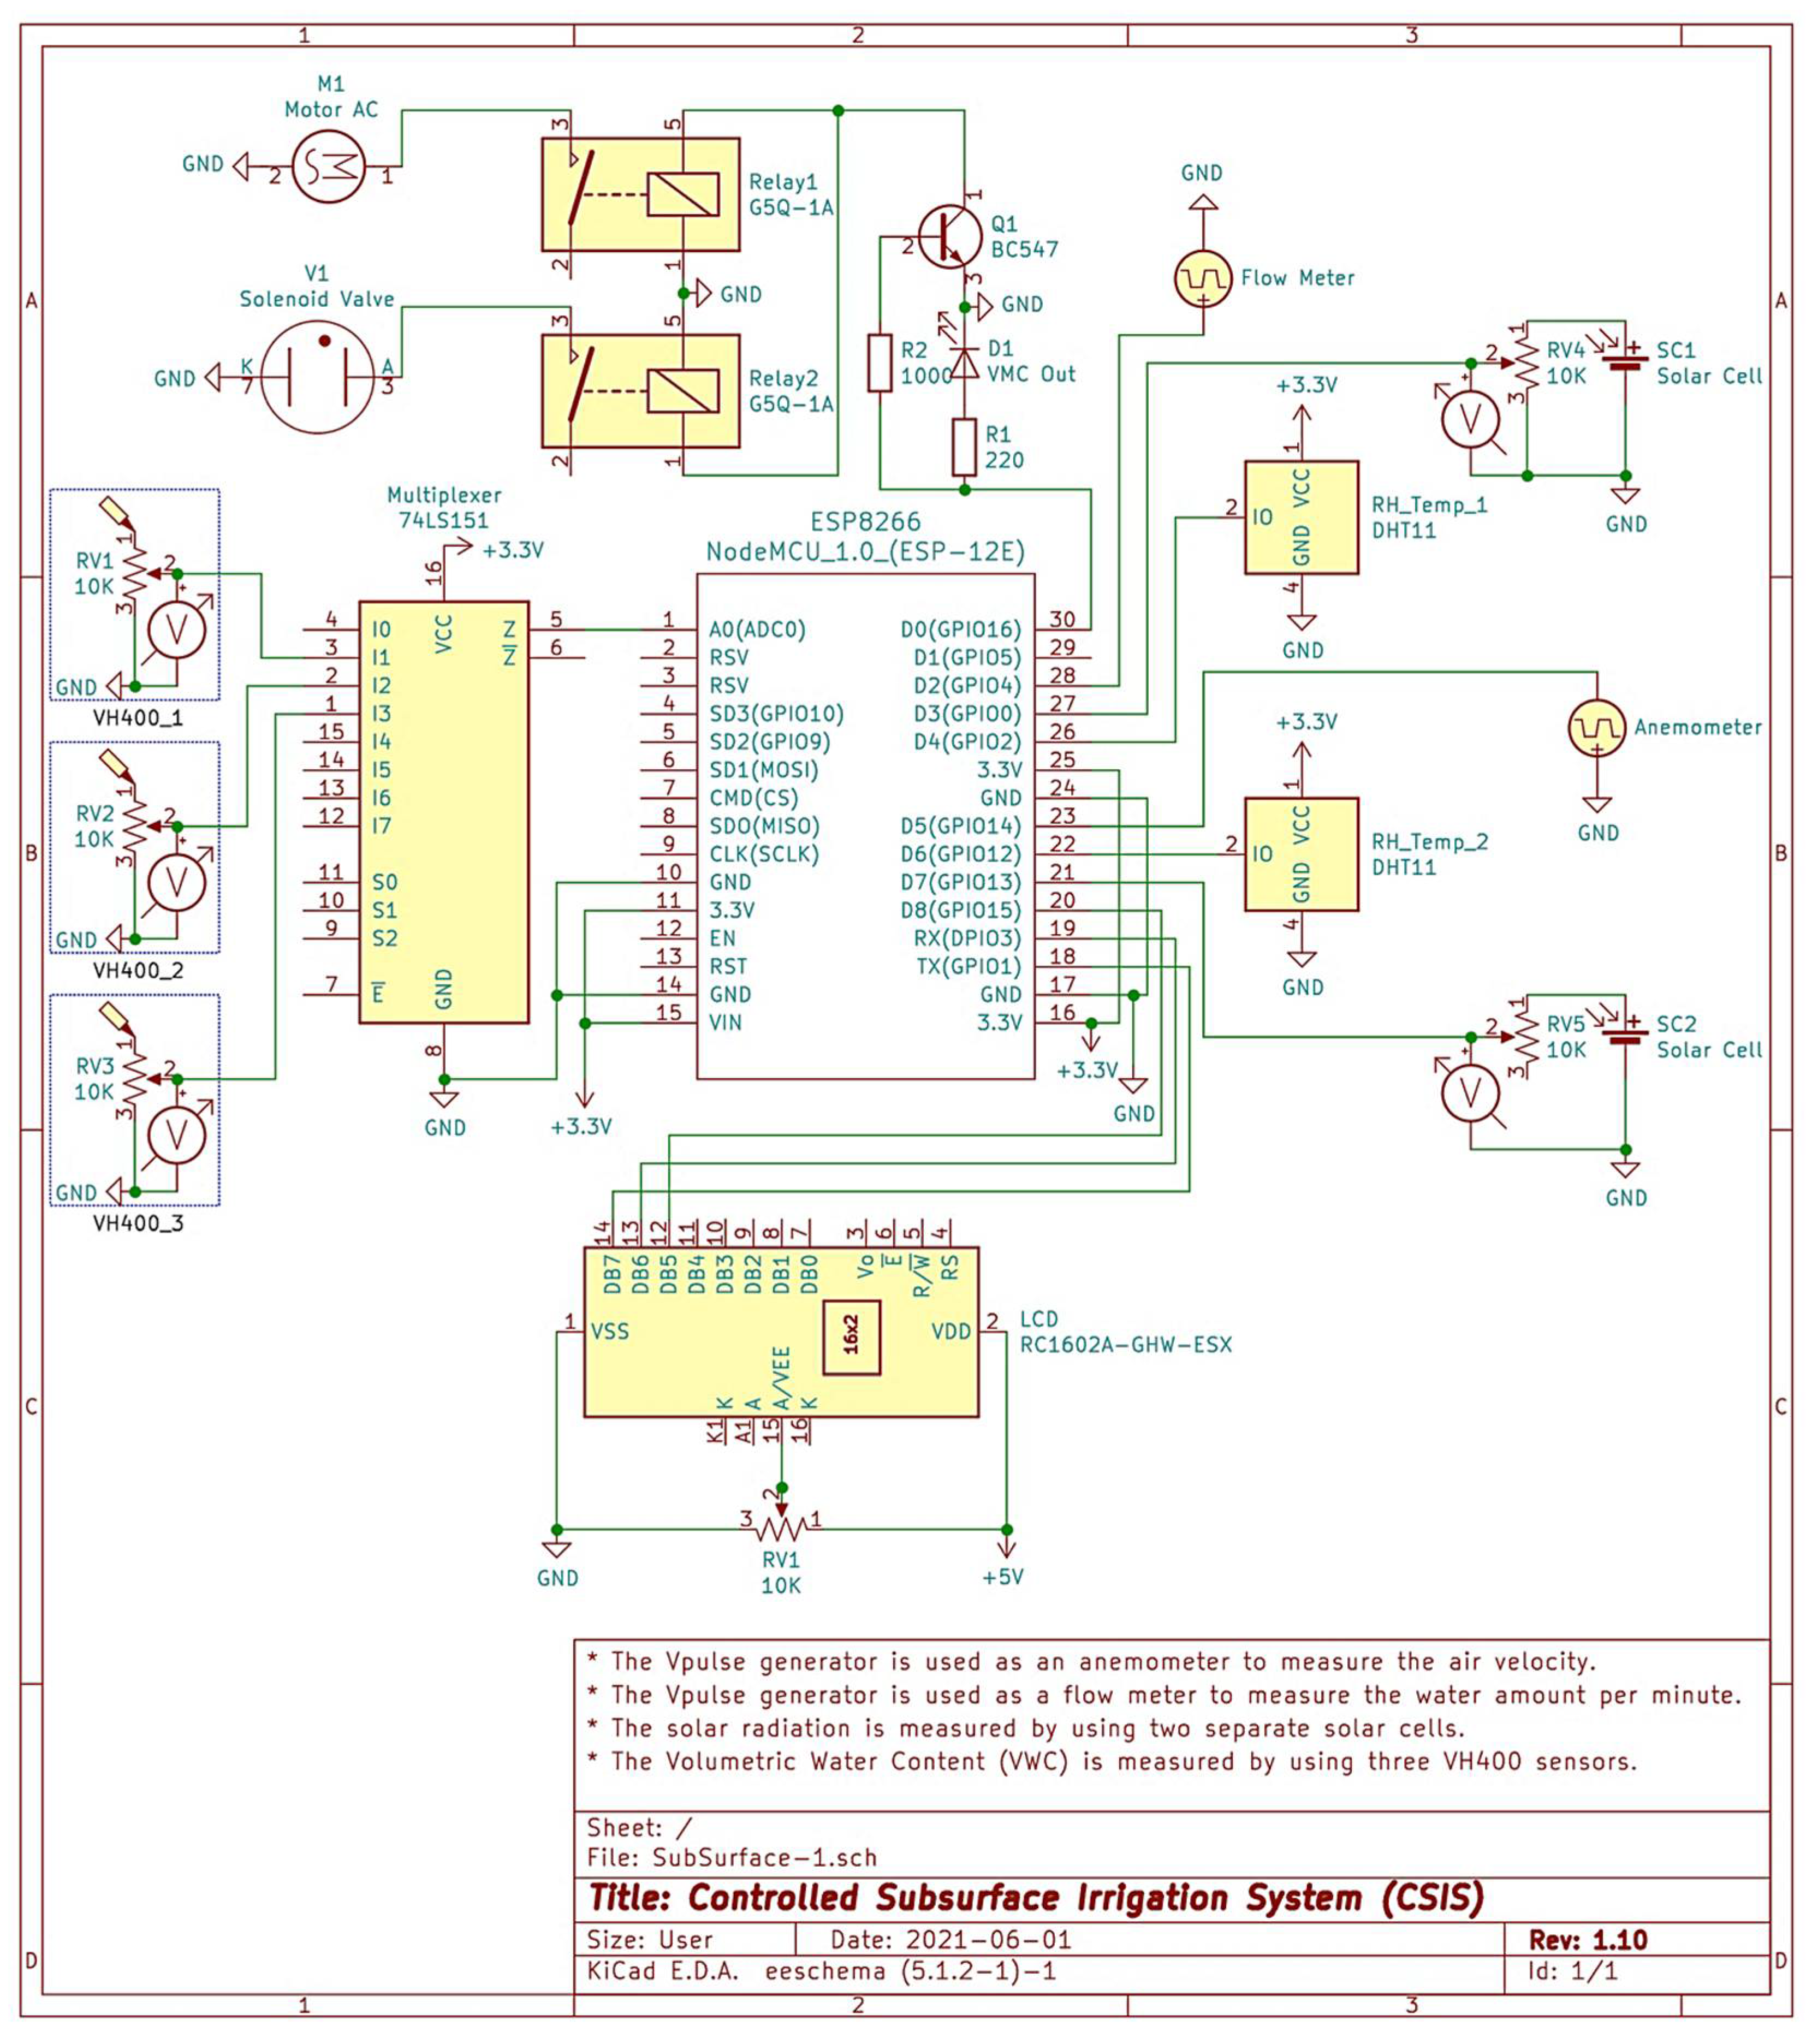
- Hardware layout
- A set of comments related to the connected devices and sensors:
- ○
- Comment 1: The Vpulse generator is used as an anemometer to measure air velocity.
- ○
- Comment 2: The Vpulse generator is used as a flow meter to measure the water amount per minute.
- ○
- Comment 3: The solar radiation is measured by using two separate solar cells.
- ○
- Comment 4: The Volumetric Water Content (VWC) is measured by using three VH400 sensors. The average reading of the three sensors is considered.
- ESP8266 NodeMCU board: In our system, we used one ESP8266 NodeMCU board. It is an open-source firmware and development board. We considered using ESP8266 module for its efficacy and simplicity for monitoring and controlling things anywhere in the world. It has 128 KB RAM and 4 MB of Flash memory for data and program storage. The ESP8266 NodeMCU is equipped with 30 pins for interfacing it with the outside world. We used 21 pins to connect all the considered electronic devices and sensors with the ESP8266 NodeMCU board. The used pins are eight power pins (3.3V and GND), 12 multiplexed GPIO pins, and one analog pin. Thus, we still have ten unused pins to do further scaling and improvements for our system in the future using the same board.
- VH400 Volumetric Water Content (VWC) Sensor: We used three VH400 VWC sensors. They are connected to A0, GPIO9, and GPIO10. They are connected to A0 through 74LS151 monolithic data multiplexer. VH400 is used primarily to stop over-watering caused by the traditional watering systems. This sensor introduces precise readings and effective soil moisture content monitoring. Once VH400 is inserted into the soil, it can accurately read in approximately 400 ms (rapid response time). Thus, it can be installed at different depths from the surface. Moreover, it consumes less than 13 mA (low power consumption rate). It is suitable for long-term use. It can be easily interfaced with any system. It can operate from −40 °C to 85 °C.
- DHT11 Digital Temperature & Humidity Sensor: We used two DHT11 sensors. They are connected to GPIO2 and GPIO12. The DHT11 sensor considers the exclusive digital signal acquisition method for sensing humidity and temperature. It is equipped with a high-performance 8-bit microcontroller. It supports long-term stability and high reliability. The accuracy of the DHT11 sensor is ±5% RH and ±2 °C while operating between 20% RH to 90% RH and 0 °C to 50 °C. The features mentioned above are behind our motivation to use such an accurate and efficient sensor for measuring relative humidity and temperature in our water conservation system.
- Flow Meter: We used a flow meter sensor to measure the water flow. It is connected to GPIO4. To calculate the flow rate in L min−1, we used a pulse counter to count the number of pulses of the flow meter sensor in exactly one-second intervals. We calculated the number of milliseconds that have passed since the last execution. Then we used the measured number of milliseconds to scale the output. Also, we applied the calibration factor to scale the outcome based on the number of pulses per second per unit of measure (L min−1) coming from the sensor. The flow rate is calculated using:where Fr is the flow rate (m3 h−1), Fc is the calibration factor, Pn is pulse number per min.
- Anemometer: This device measures the wind speed and direction. We used a three cups anemometer. It is an aluminum alloyed 4–20 mA current output wind speed sensor. It gives a pulse signal output. The start-up wind speed is 4 to 8 km h−1. It is connected to the ESP8266 through GPIO14.
- Solar Cells: We used two single solar cells to measure the solar radiation in the field of the experiment. They are connected to the ESP8266 module through GPIO0 and GPIO13.
- 74LS151 Analog Multiplexer: We used one monolithic data multiplexer. It contains full on-chip binary decoding to select the desired data source. It can choose one-of-eight data sources. It has a strobe input which must be at a low logic level to enable these devices.
- G5Q-1A Electrical Relay: We used two G5Q-1A electrical relays. They are connected to GPIO16. This kind of relay is a single-pole relay. It can switch performance for different loads ideally. The first relay in our model is used to connect the AC motor. The second relay is used to connect the solenoid valve.
- RC1602A-GHW-ESX LCD: We used one LCD in our system. It is mainly used to display some information related to doing an action at the current time. It is connected to the ESP8266 module through GPIO1, GPIO3, and GPIO5.
- (2)
- Software layout
- Requirements: We explicitly defined the measures required for the subsurface irrigation system (VWC, soil temperature, RH, and temperature). Also, the expected output from our software is identified.
- Analysis: The main code is running on the ESP8266 module is divided into multiple functions; each function is responsible for a specific task. As shown in Figure 6, we mainly have five functions:
- ○
- IntializeSensor( )
- ○
- ReadData( )
- ○
- Write2ThingSpeak( )
- ○
- SerialMonitor( )
- ○
- Print2LCD( )
- Design: The data variables/objects and operations have been identified.
- Refinement and Coding: the required algorithms and data variables/objects have been implemented.
- Verification: We introduced the verification for our software by comparing the actions taken by our system and another system for collecting the measures manually.
- The detailed description for our functions is as follows:
- IntializeSensor( ): It touches the sensors considered in our designed system for resets, calibrations, and manual readings. It should be mentioned that each sensor has a unique name that passed as an argument to the IntializeSensor( ) function to execute some tasks on that sensor. Also, a getInstruction( ) function is started to collect the user’s instructions for a specific sensor for adjustment purposes.
- ReadData( ): once the reading time is reached, the ReadData( ) function collects the requested measures from all the sensors in our designed system. This is based on the internal library of each sensor.
- Write2ThingSpeak( ): it is used to write multiple fields simultaneously to our private channel on the ThingSpeak cloud platform. The designed system does real-time measures based on the small-time interval considered to read the data from the sensors. It should be mentioned that writing the actions to ThingSpeak is done every 10 min. Thus, the average for the measured data during the last 10 min will be written to its designated field to our private channel on ThingSpeak.
- SerialMonitor( ): It sends the real measured values from each sensor to the serial monitor at the occurrence of each read interval.
- Print2LCD( ): It is responsible for sending the commands that are currently running to the LCD.
2.3. Sensors Calibration
2.4. Cloud Layout
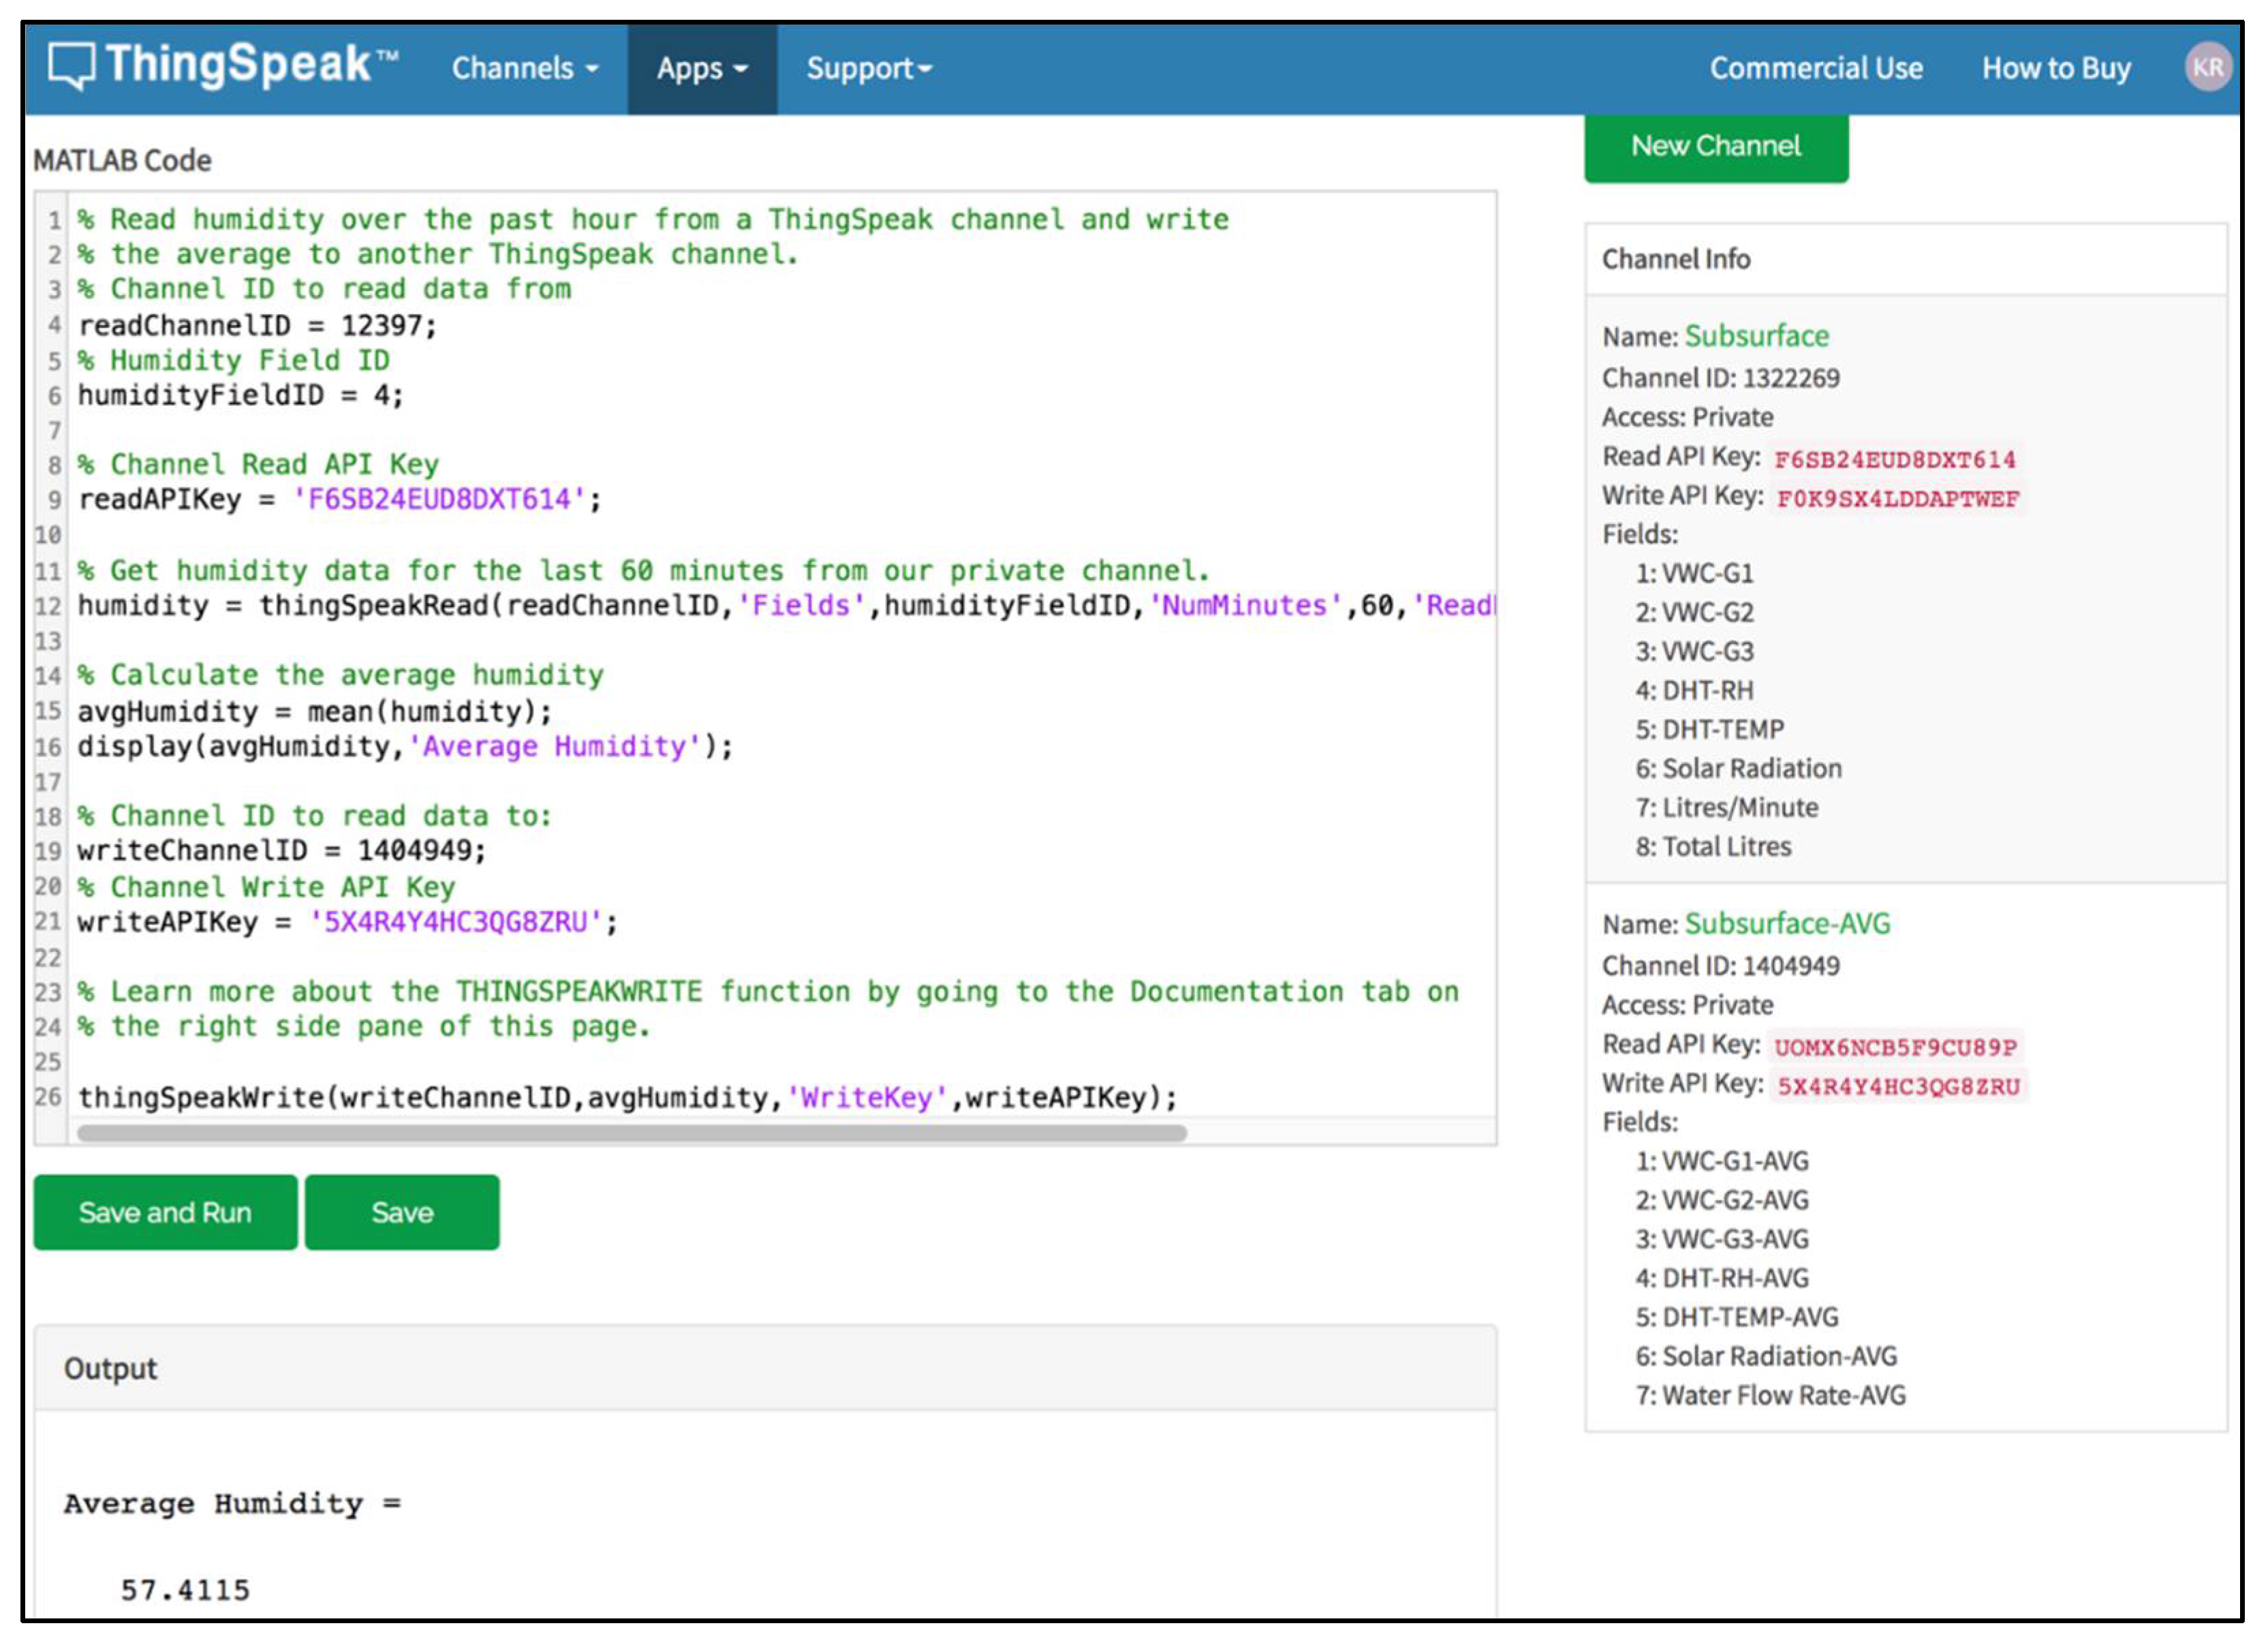
- MATLAB Analysis: It is used to investigate the collected data in our private channel. We employed the MATAB Analysis to calculate and display the average VWC (R1), VWC (R2), VWC (R3), RH, air temperature, solar radiation, and water flow rate over the last 60 min. An example for the average humidity over the past hour is shown in Figure 7. These average results are written to a new private channel and displayed to the user for monitoring. Also, we used it to analyze daily the VWC for each replicate (R1, R2, and R3) and send an email notification to a designated user. It should be mentioned that for simplicity reasons, we removed the screenshots containing the MATLAB Analysis code for the other parameters. If the last value of VWC for a specific replicate is smaller than or equal to the PWP was true six times for one hour, the notification email will be sent to the user. This indicates that there may be a problem in the water pump or any other equipment.
- React: This App is used to perform some actions when the channel data meets a certain condition. We used React App to start the MATLAB Analysis when the last value of VWC for R1, R2, or R3 is less than or equal to PWP (7%). Where the test frequency is every 10 min, and the action is running MATLAB Analysis.
- TalckBack: This App mainly enables the device to act on queued commands. We used to send the commands from our private channel after doing MATLAB Analysis to the ESP8266. Then the ESP8266, by its role, will send the commands to the designated device. For example, when the last VWC value for a specific replicate becomes less than or equal to 15% (Min Setpoint). We created a command that will be sent to the water pump and the solenoid valve to turn them ON. On the other hand, if the last VWC value for a specific replicate becomes greater than or equal to 30% (Max Setpoint), we created a command that will be sent to the water pump and the solenoid valve to turn them OFF.
2.5. Experimental Layout
2.6. Water Productivity
2.7. Statistical Analysis
3. Results and Discussion
3.1. Sensors Validation
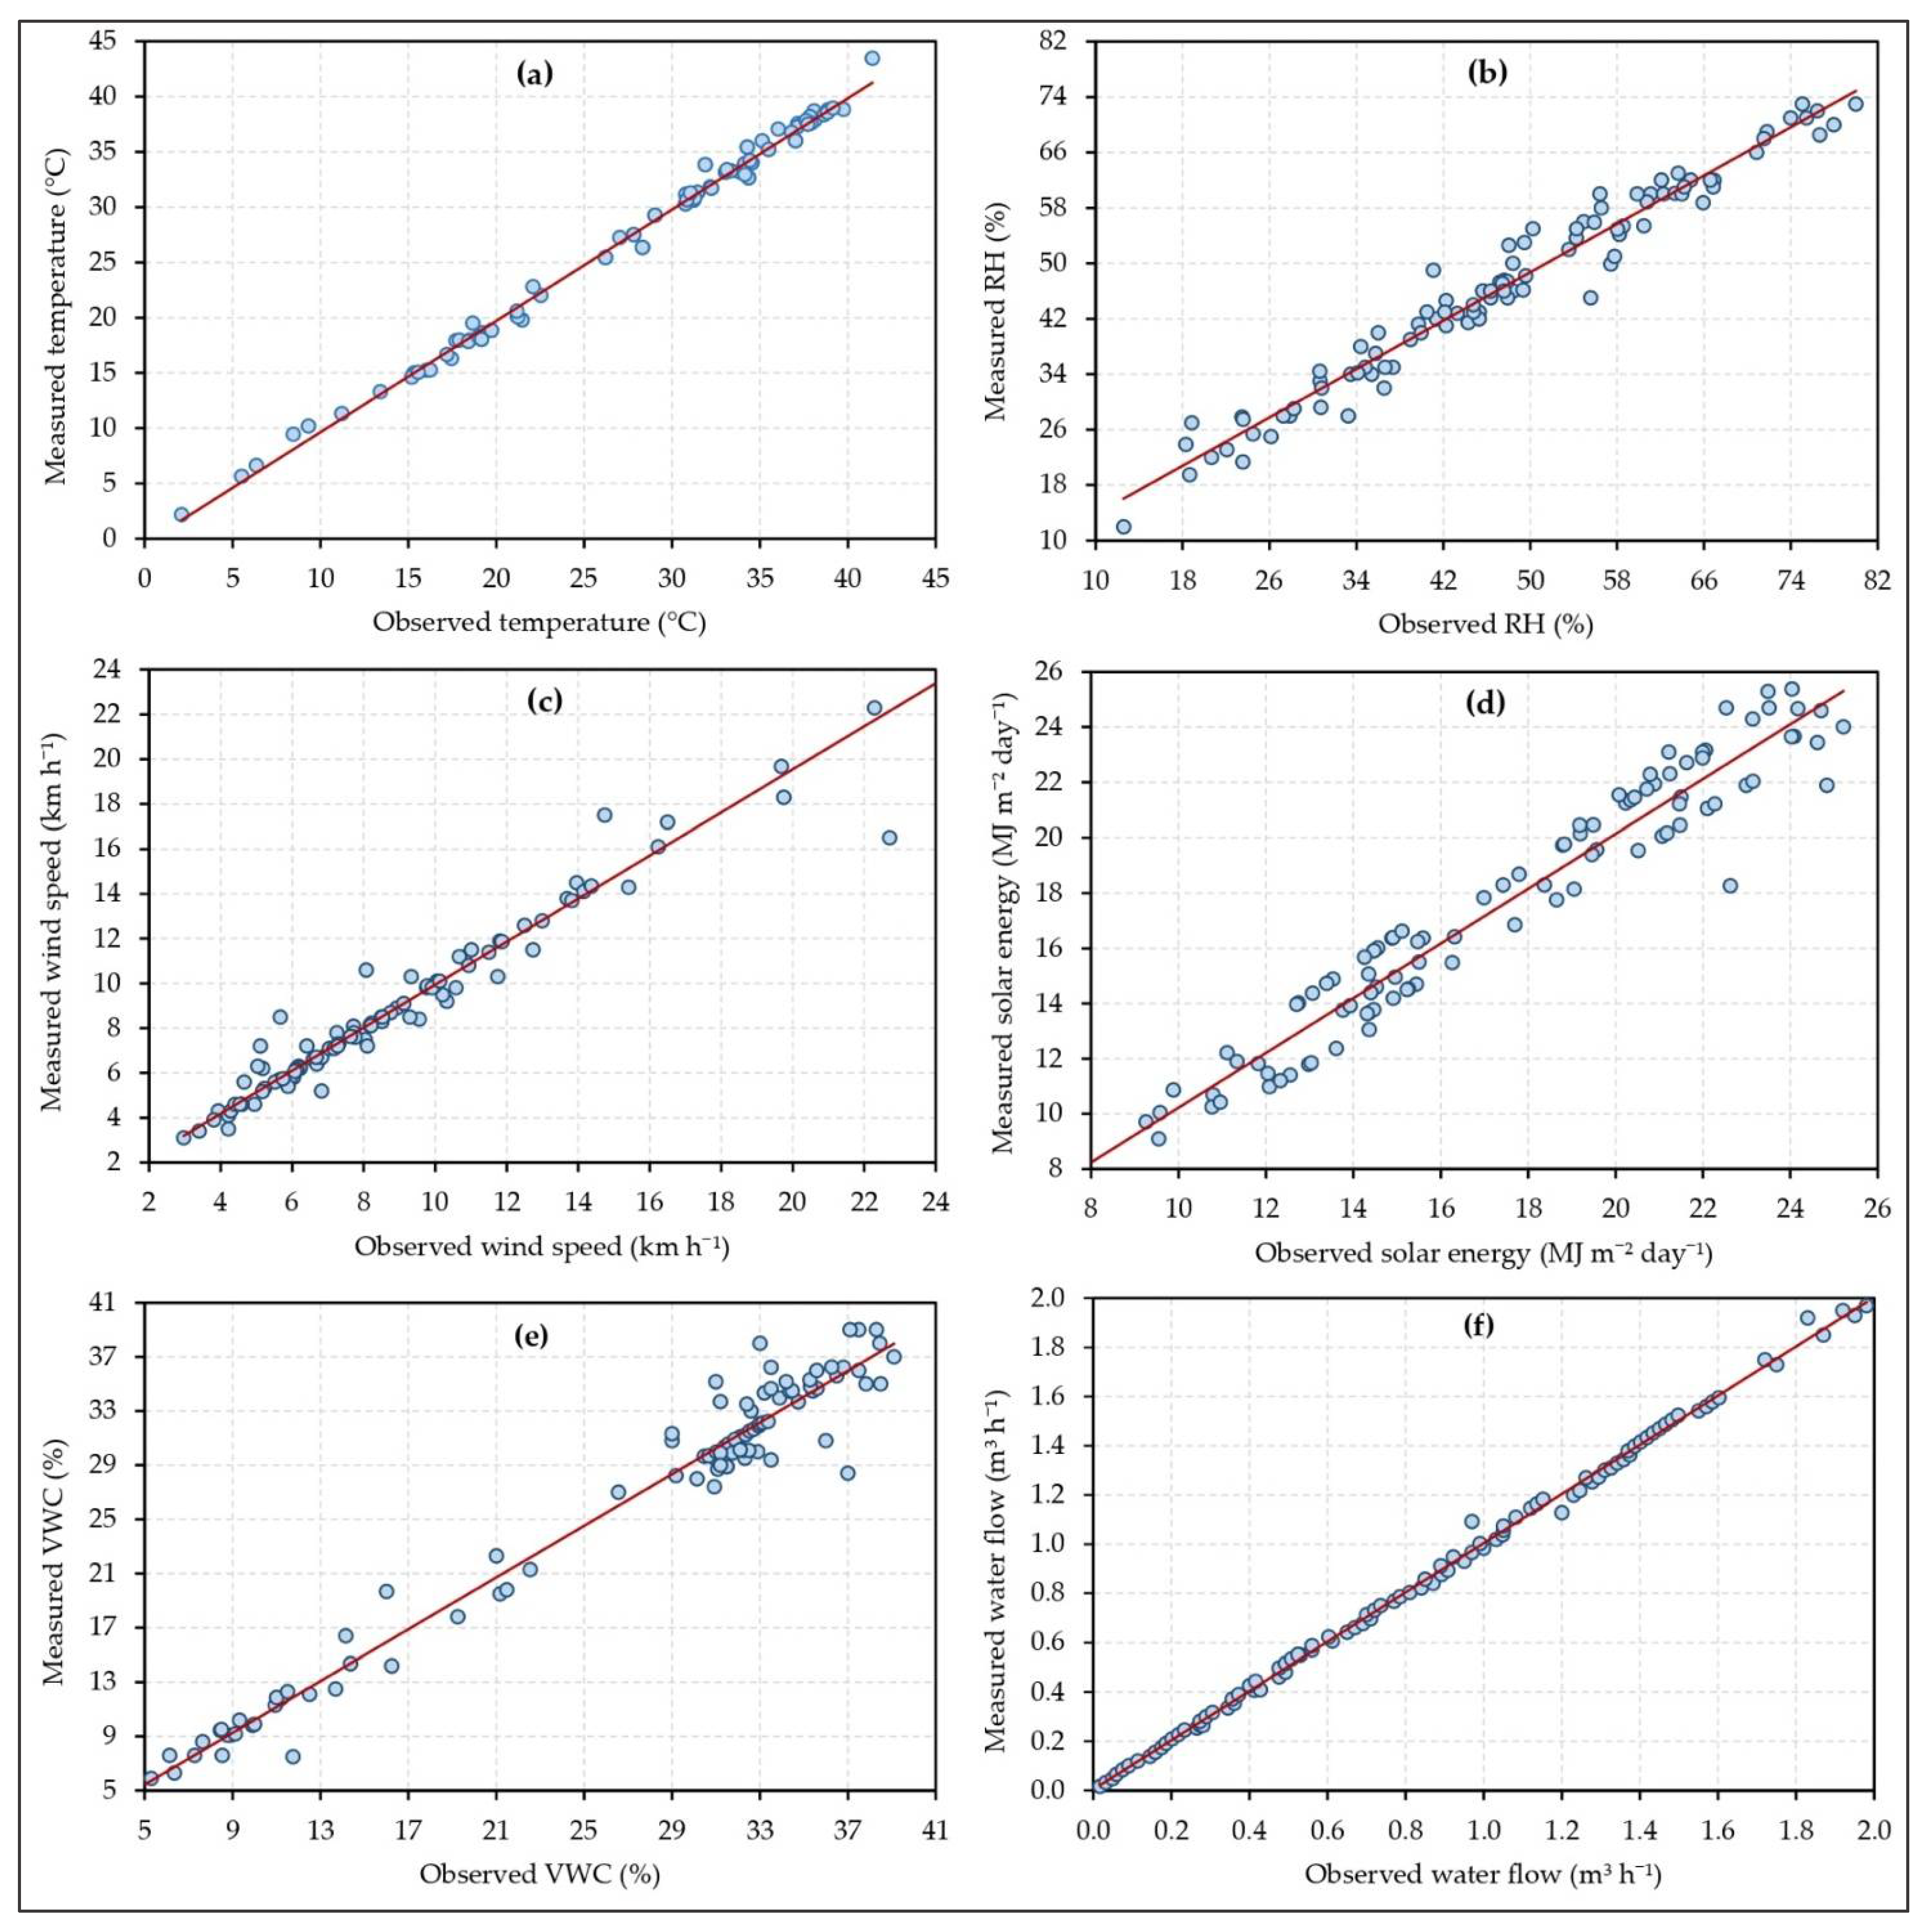
- Figure 8a: This graph represents the temperature calibration curve. The equation of the linear regression model through the temperature points is y = 1.007x – 0.434, where 1.007 is the slope and 0.434 is the temperature intercept. We used the temperature’s linear regression equation to adjust the temperature measurements collected using the DHT11 sensor. After fitting the measured temperature, the temperature’s R-squared (R2) is 0.994. This indicates that the used temperature’s linear regression equation produces non-significant differences between the observed temperature and the measured temperature.
- Figure 8b: This graph represents the RH calibration curve. The equation of the linear regression model through the RH points is y = 0.872x + 5.099, where 0.872 is the slope and 5.099 is the RH intercept. We used the RH’s linear regression equation to adjust the RH measurements collected using the DHT11 sensor. After fitting the measured RH, the RH’s R2 = 0.963. This indicates that the used RH’s linear regression equation produces non-significant differences between the observed RH and the measured RH.
- Figure 8c: This graph represents the wind speed calibration curve. The equation of the linear regression model through the wind speed points is y = 0.96x + 0.347, where 0.96 is the slope and 0.347 is the wind speed intercept. We used the wind speed’s linear regression equation to adjust the wind speed measurements collected using the anemometer. After fitting the measured wind speed, the wind speed’s R2 = 0.983. This indicates that the used wind speed’s linear regression equation produces non-significant differences between the observed wind speed and the measured wind speed.
- Figure 8d: This graph represents the solar energy calibration curve. The equation of the linear regression model through the solar energy points is y = 0.991x + 0.317, where 0.991 is the slope and 0.317 is the solar energy intercept. We used the solar energy’s linear regression equation to adjust the solar energy measurements collected using the solar cells. After fitting the measured solar energy, the solar energy’s R2 = 0.944. This indicates that the used solar energy’s linear regression equation produces non-significant differences between the observed solar energy and the measured solar energy.
- Figure 8e: This graph represents the VWC calibration curve. The equation of the linear regression model through the VWC points is y = 0.872x + 5.0949, where 0.872 is the slope and 5.0949 is the VWC intercept. We used the VWC’s linear regression equation to adjust the VWC measurements collected using the VH400 sensor. After fitting the measured VWC, the VWC’s R2 = 0.963. This indicates that the used VWC’s linear regression equation produces non-significant differences between the observed VWC and the measured VWC.
- Figure 8f: This graph represents the water flow calibration curve. The equation of the linear regression model through the water flow points is y = 0.999x + 0.004, where 0.999 is the slope and 0.004 is the water flow intercept. We used the water flow’s linear regression equation to adjust the water flow measurements collected using the flow meter. After fitting the measured water flow, the water flow’s R2 = 0.998. This indicates that the used water flow’s linear regression equation produces non-significant differences between the observed water flow and the measured water flow.
3.2. Cloud Monitoring
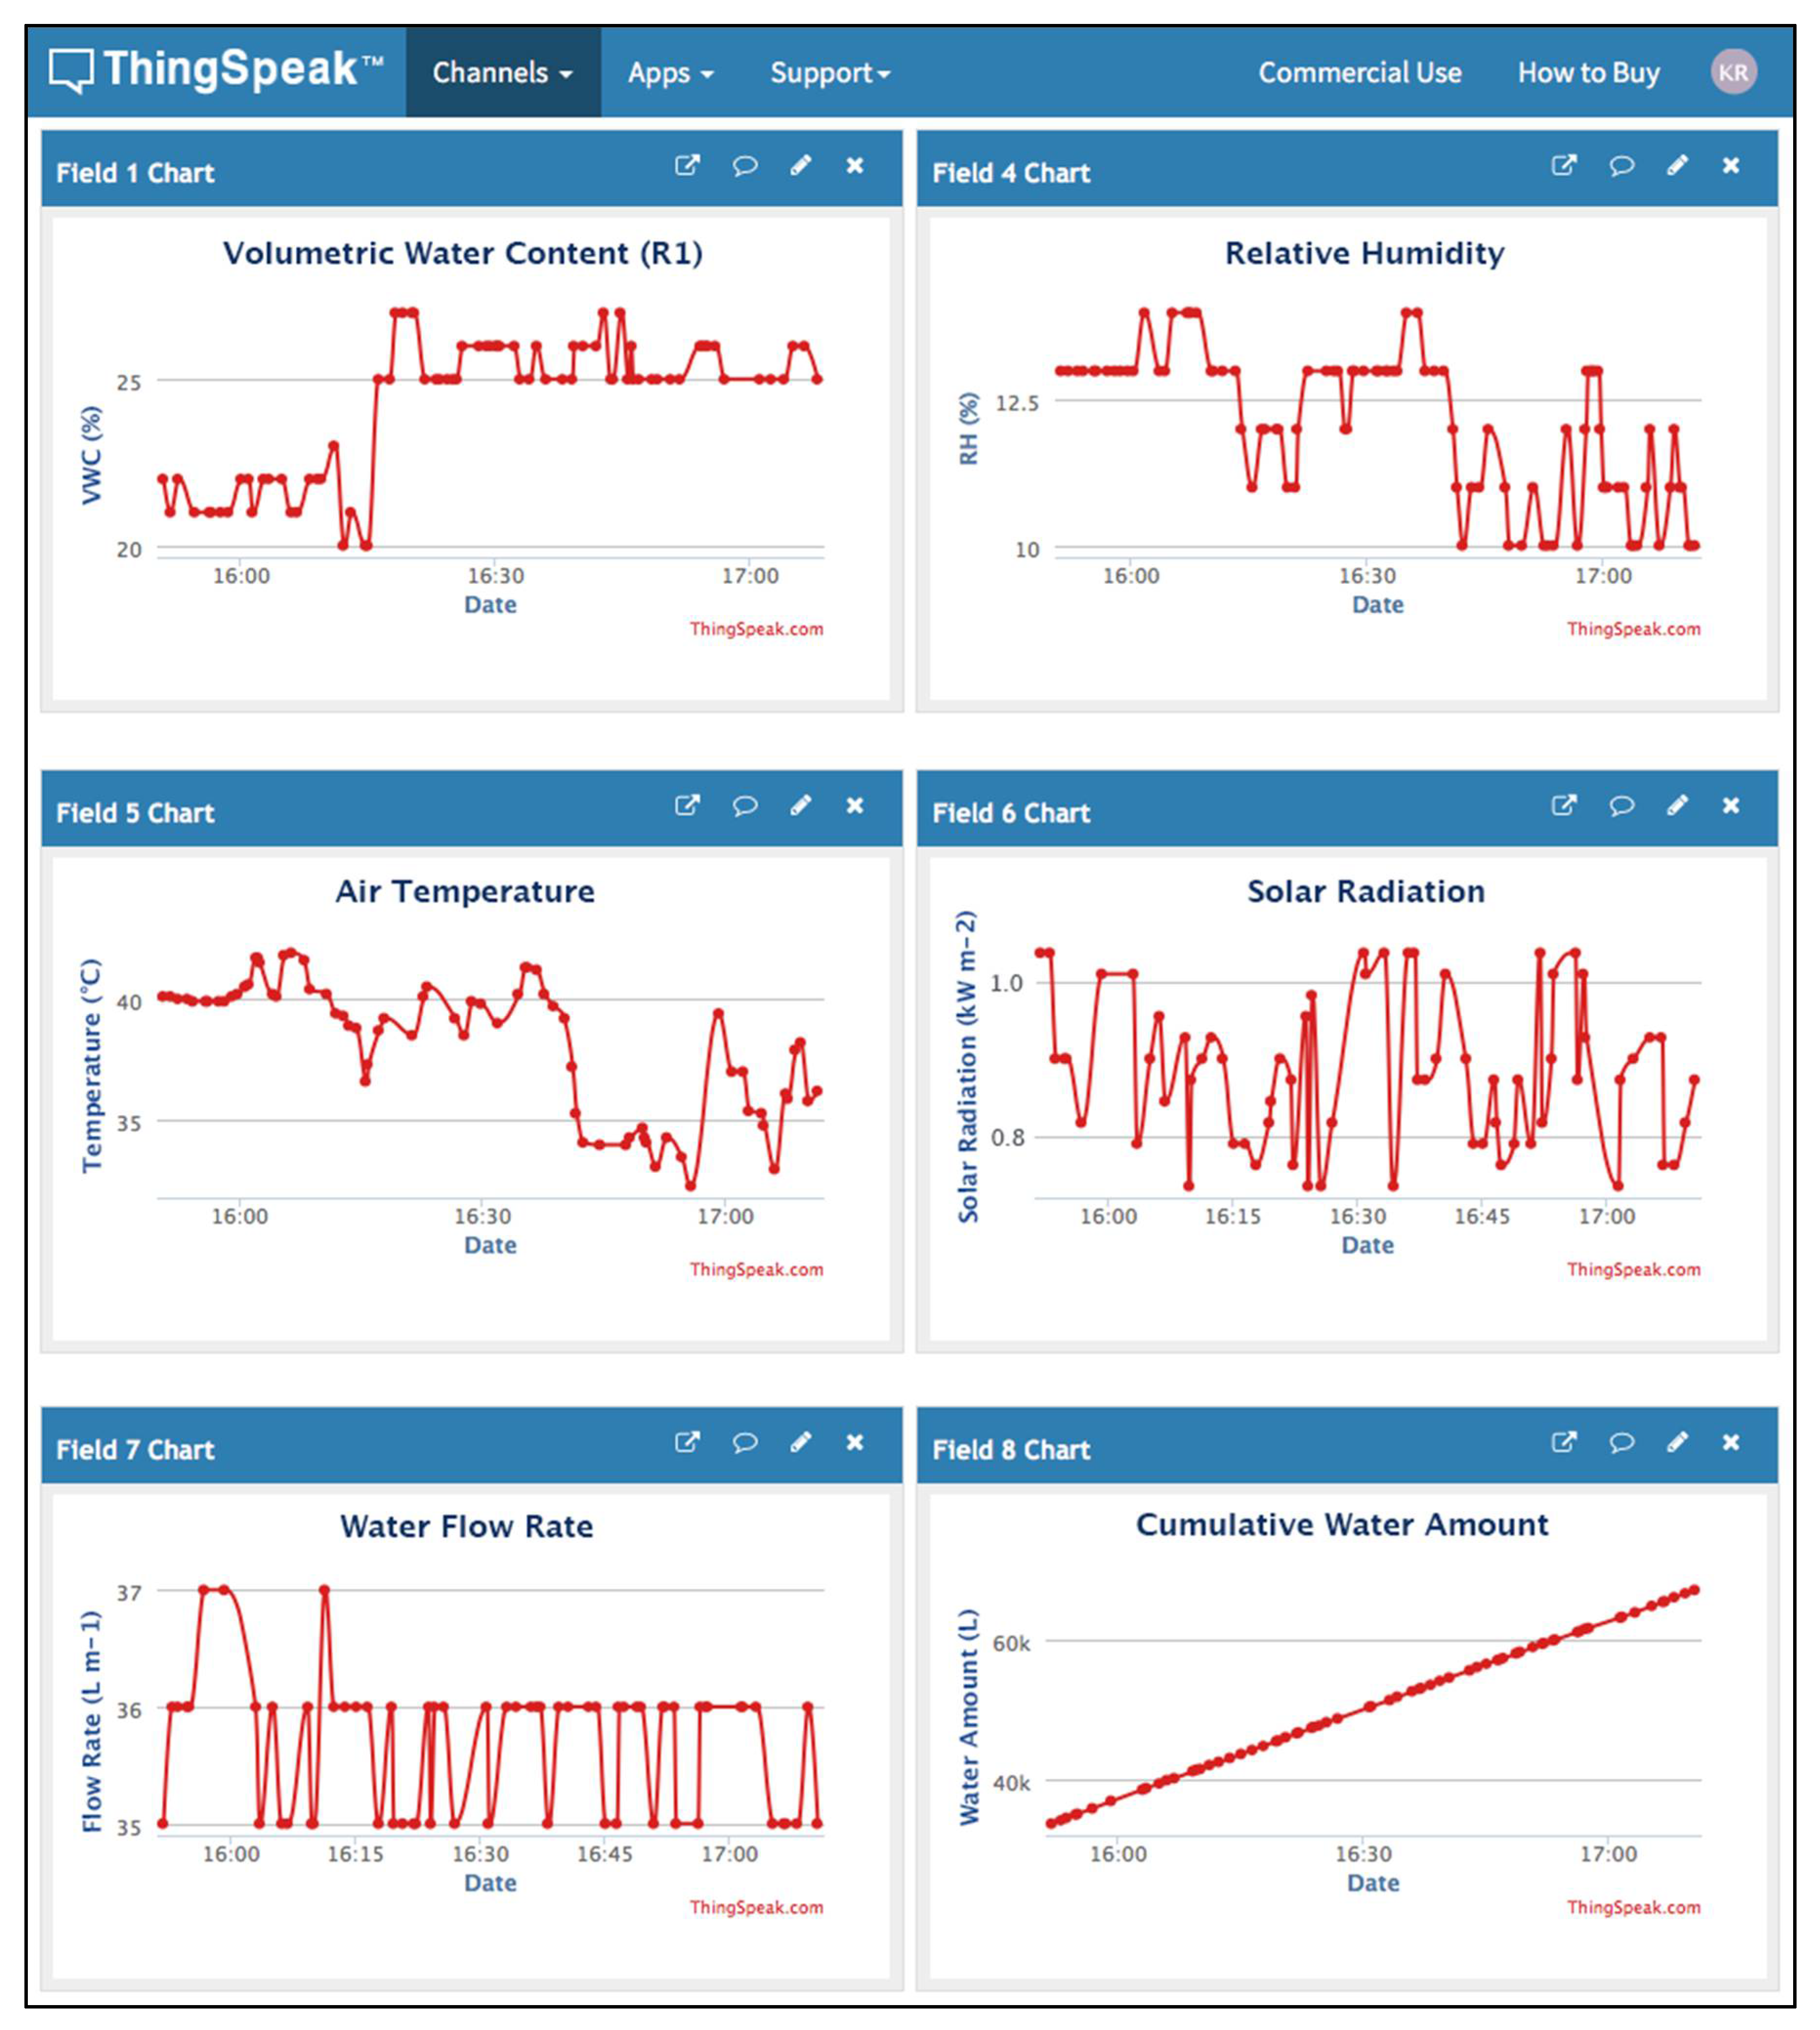
- Field 1 Chart: It shows the average real-time VWC percentage collected from three VH400 sensors for replicate R1. Each of these sensors is installed at 0.3 m depth between two subsurface irrigation units. The minimum VWC setpoint (Min VWC Setpoint) is 15%, and the maximum VWC setpoint (Max VWC Setpoint) is 35%. Our CSIS start sending instructions to the water pump to work and feed the replicate with water when the VWC average value is smaller than or equal to 15%. During the feeding time, the average VWC is also monitored. When the VWC average value becomes greater than or equal 30%, the CSIS will send instructions to the water pump to turn off. As shown in this chart, the VWC is ranging between 20% to 27% within two hours. We avoided the hysteresis ON and OFF for our devices by letting the ON and OFF instructions run between the Min Setpoint and Max Setpoint.
- Field 2 Chart: Shows the average real-time VWC percentage collected from three VH400 sensors for replicate R2.
- Field 3 Chart: Shows the average real-time VWC percentage collected from three VH400 sensors for replicate R3 (not shown in Figure 9 for simplicity reasons).
- Field 4 Chart: Shows the average real-time RH percentage collected from two DHT11 sensors for the study area. This field is used for monitoring purposes. As shown in this chart, the RH is ranging between 10% to 14% within two hours.
- Field 5 Chart: Shows the average real-time air temperature collected from two DHT11 sensors for the study area. This field is used for monitoring purposes. As shown in this chart, the air temperature is ranging between 36 °C to 45 °C within two hours.
- Field 6 Chart: Shows the average solar radiation collected from two solar cells in the study area. This field is used for monitoring purposes. As shown in this chart, the solar radiation is ranging between 10.685 MJ m−2 to 12.192 MJ m−2 within two hours.
- Field 7 Chart: Shows the water flow rate per minute collected from the flow meter for each replicate. This field is used for monitoring purposes to make sure that the AC motor is working well. As shown in this chart, the flow rate is ranging between 35 L/m to 37 L/m within two hours. It should be mentioned that the average flow rate is always 36 L/m.
- Field 8 Chart: It shows the cumulative water amount applied for each replicate. This field is used for monitoring purposes to make sure that each replicates properly received the water amount. As shown in this chart, the cumulative water amount ranges from 20,638 L to 70,914 L within two hours.
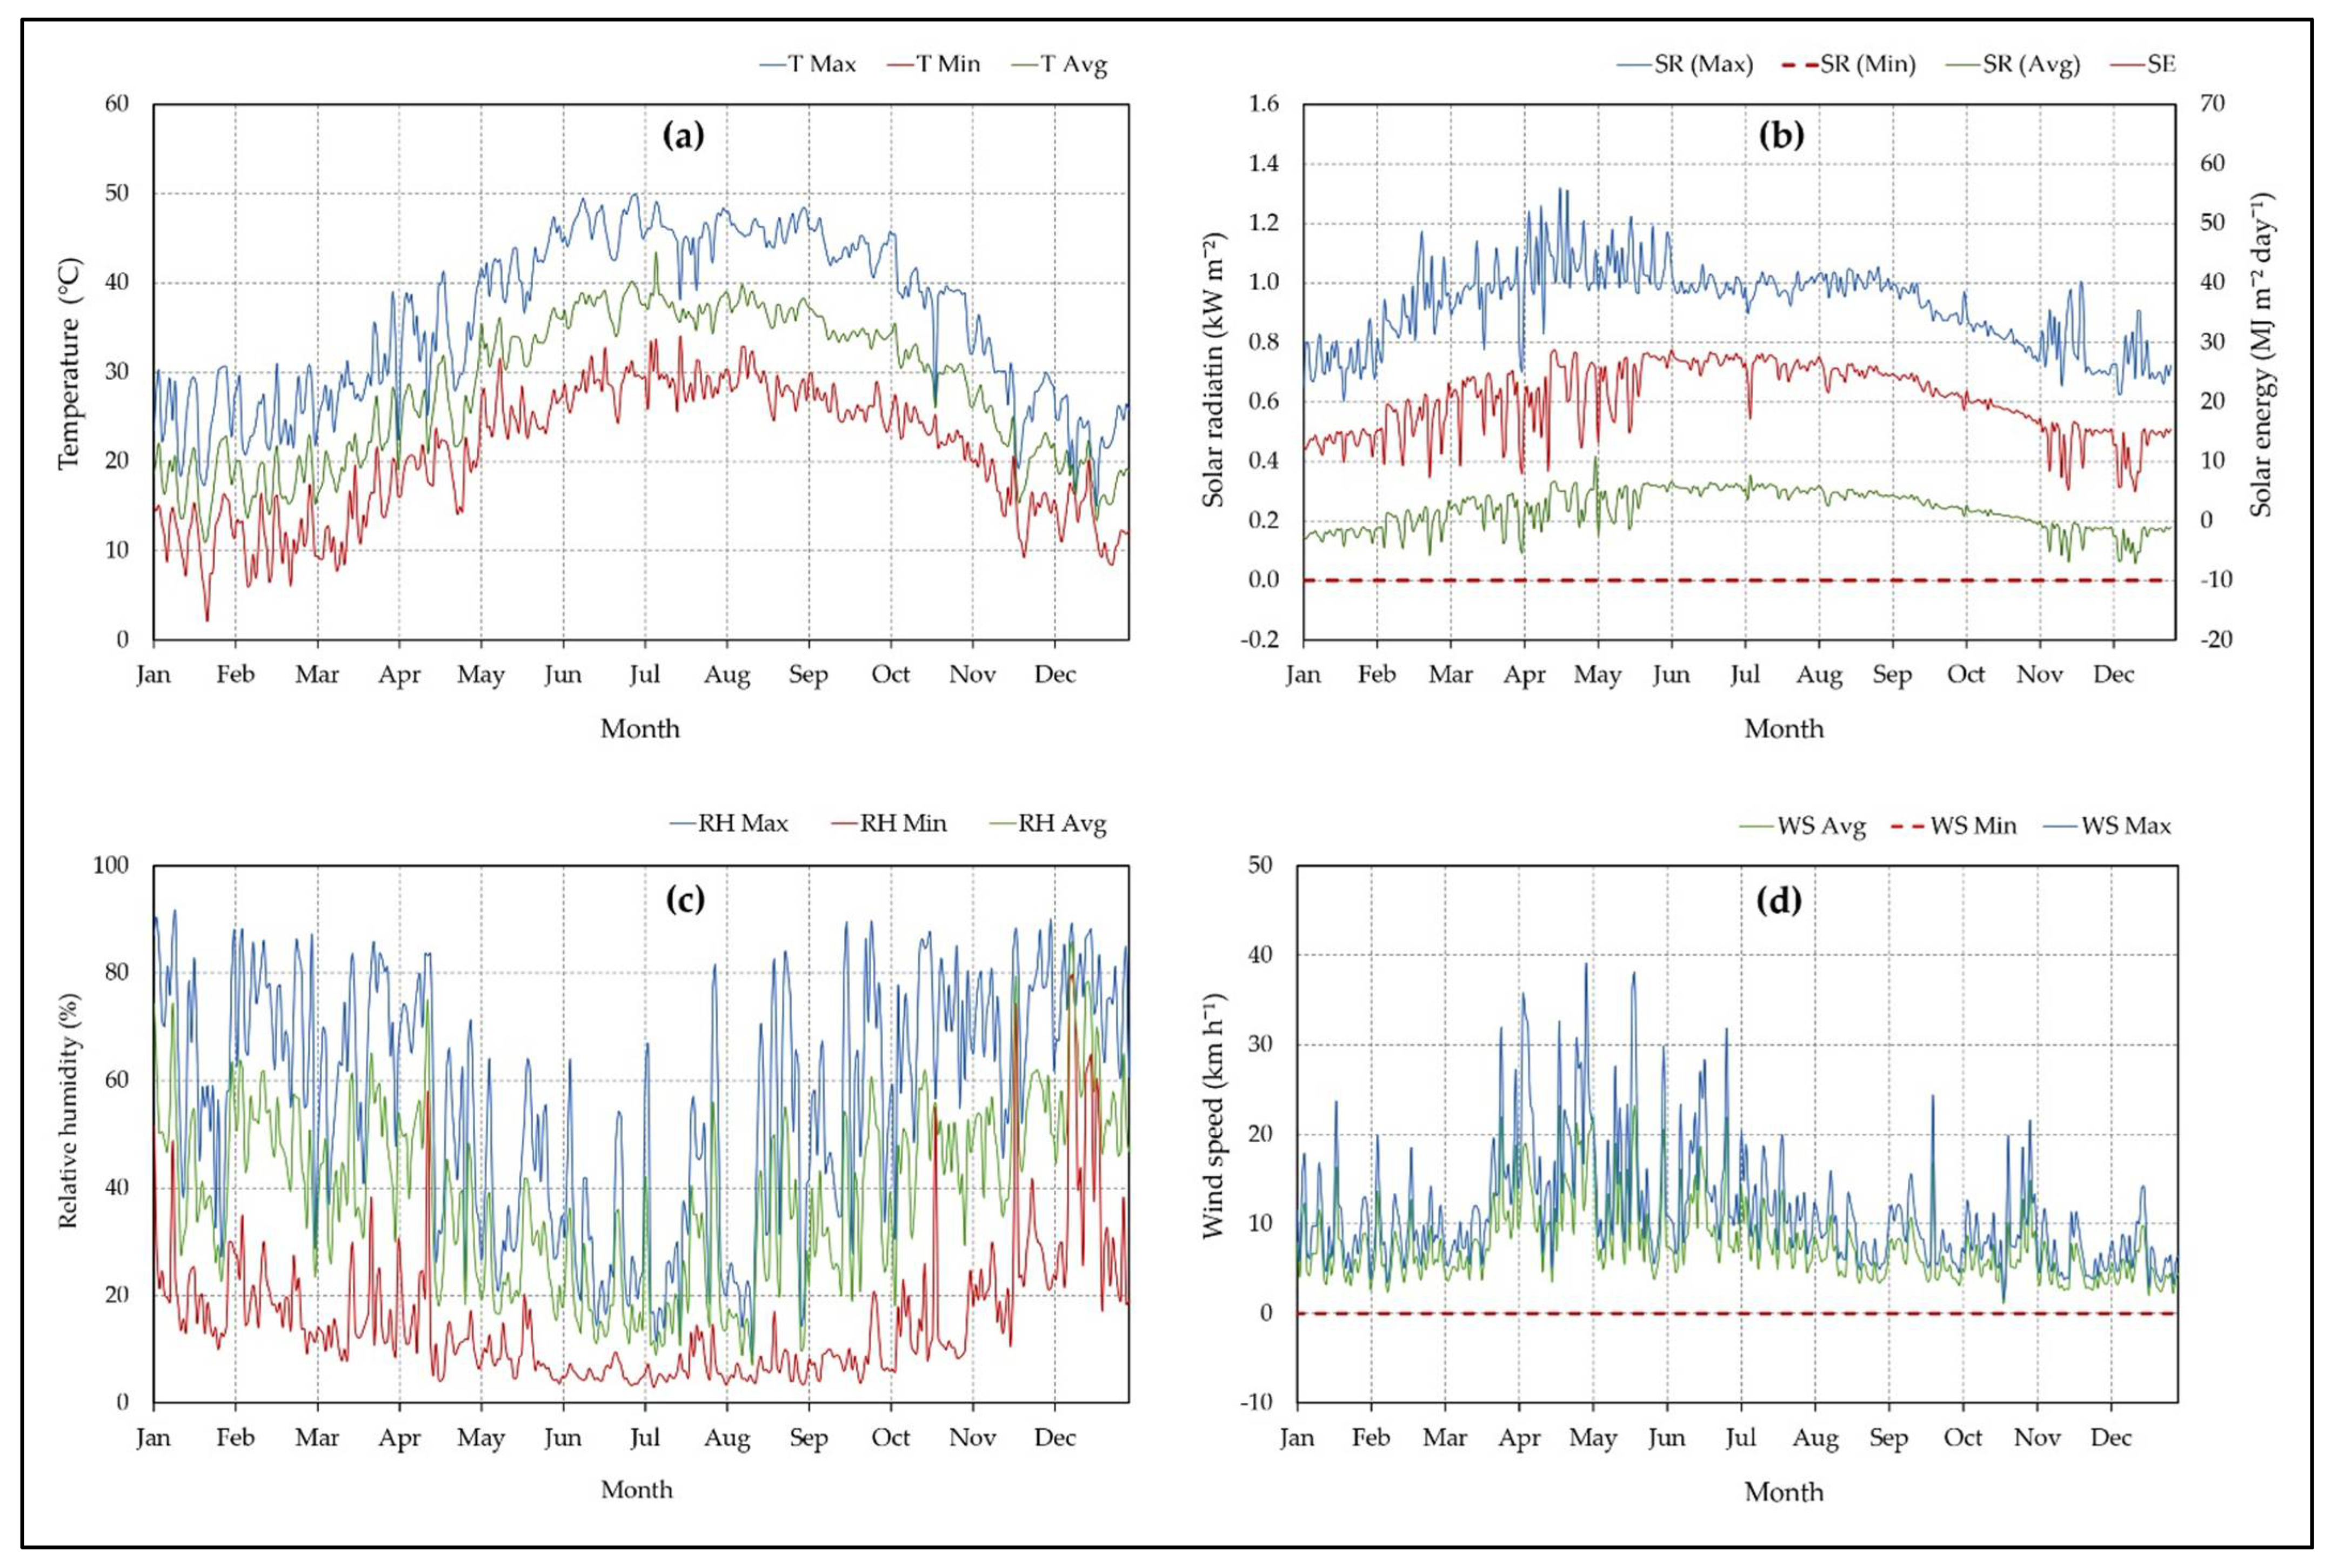
3.3. Meteorological Data of the Study Area
3.4. Sensor-Based Irrigation Schedule
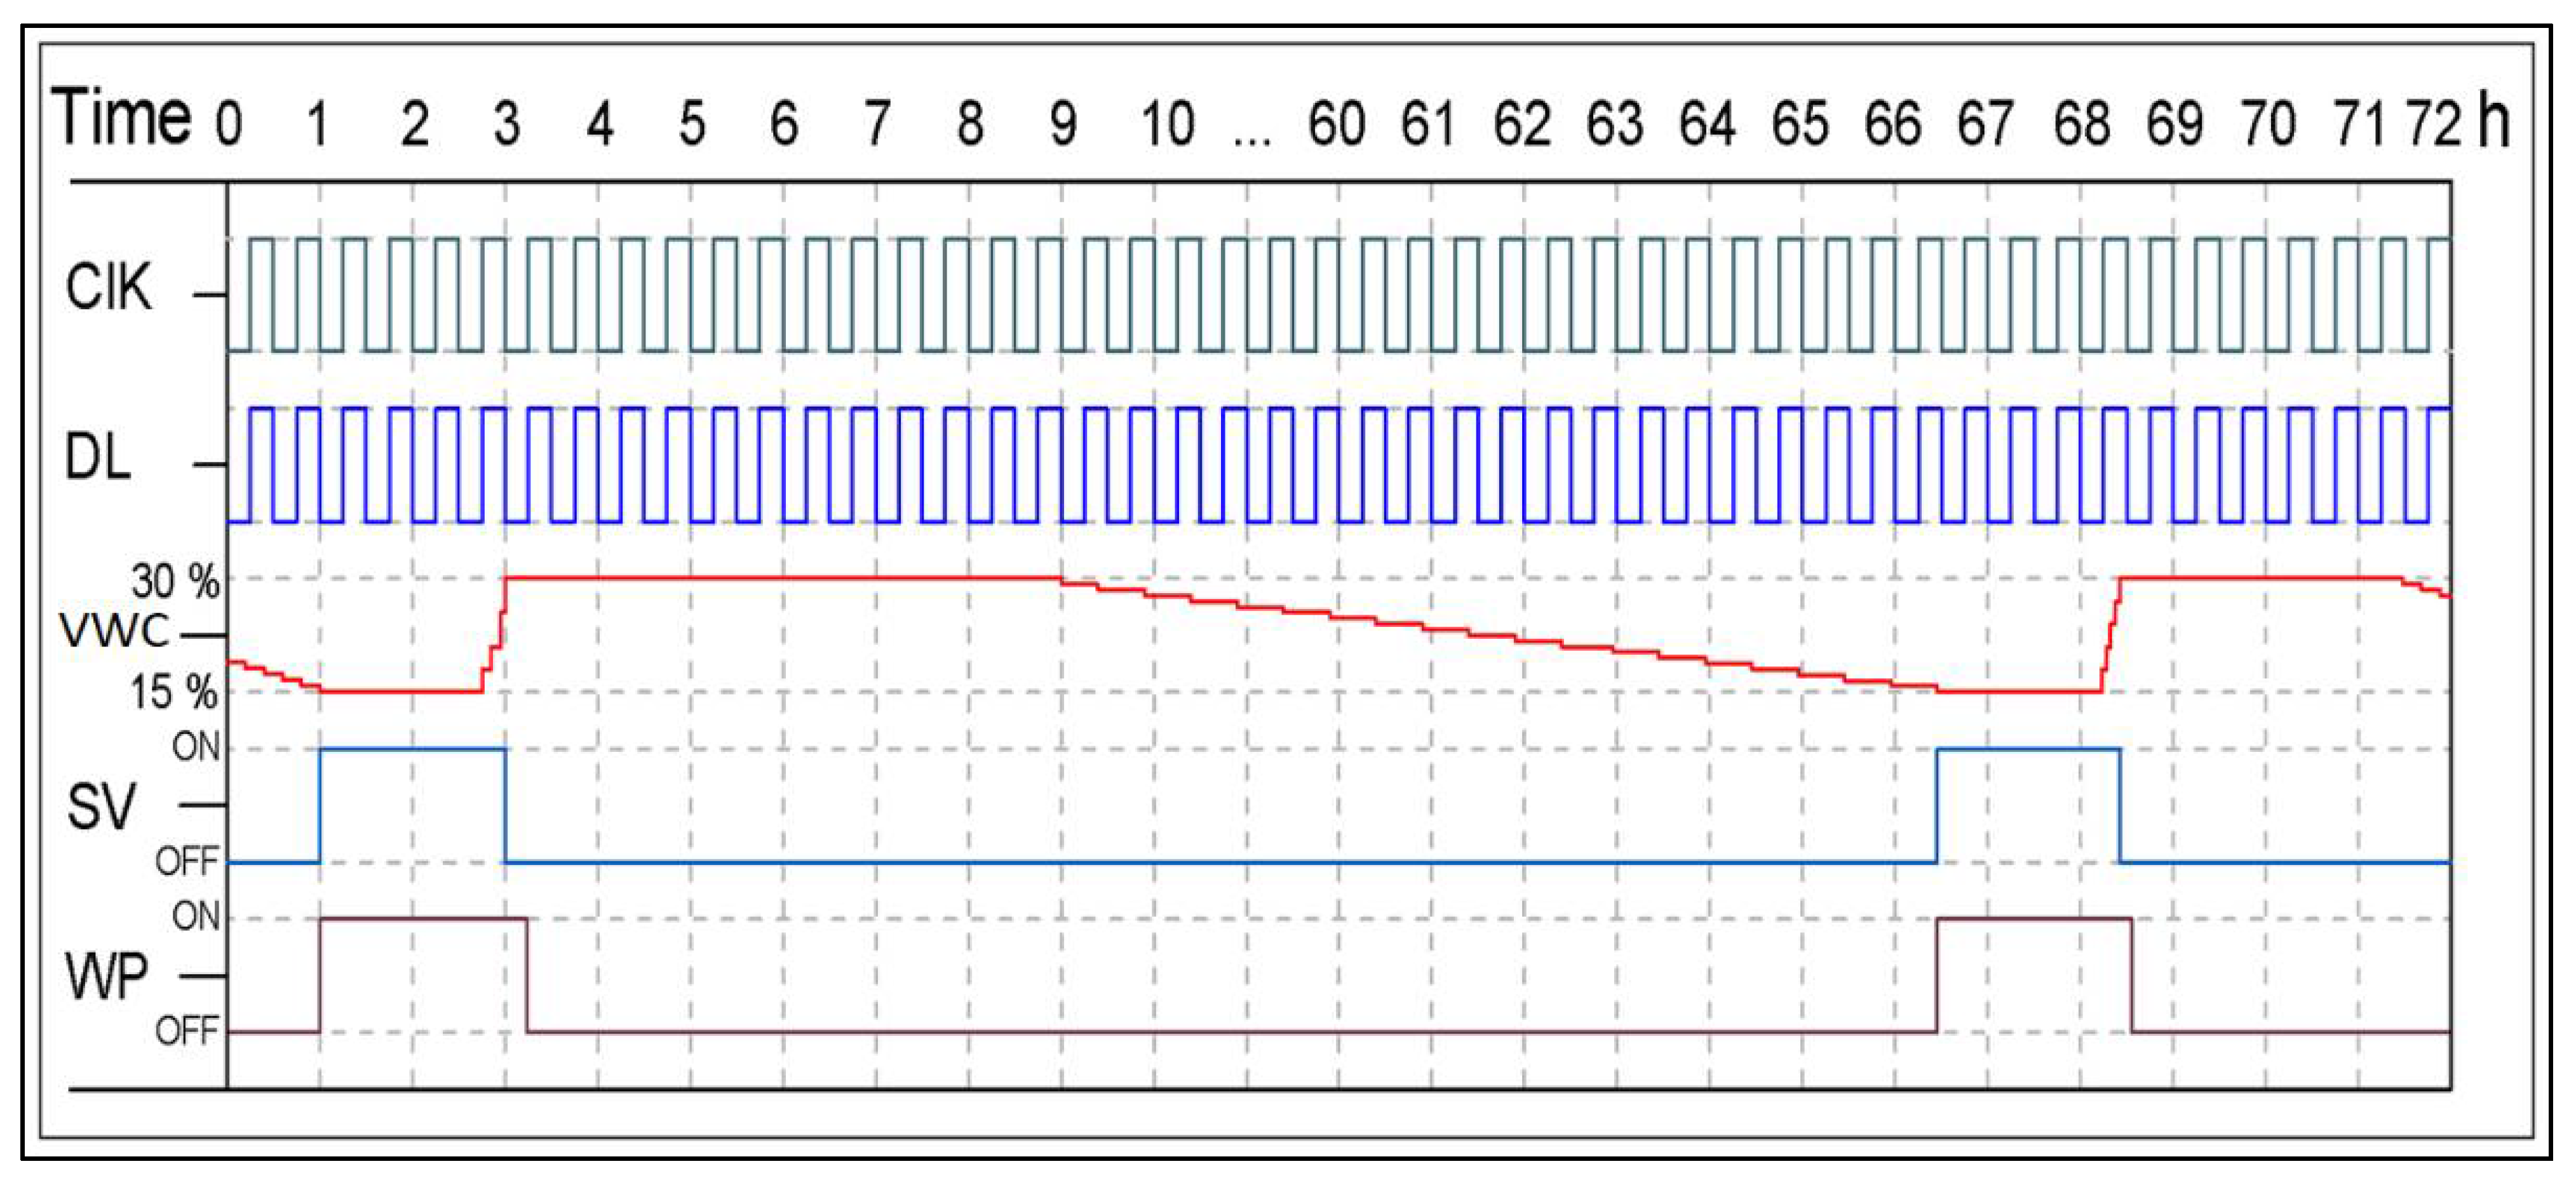
3.4.1. Timing of Actuators Operations
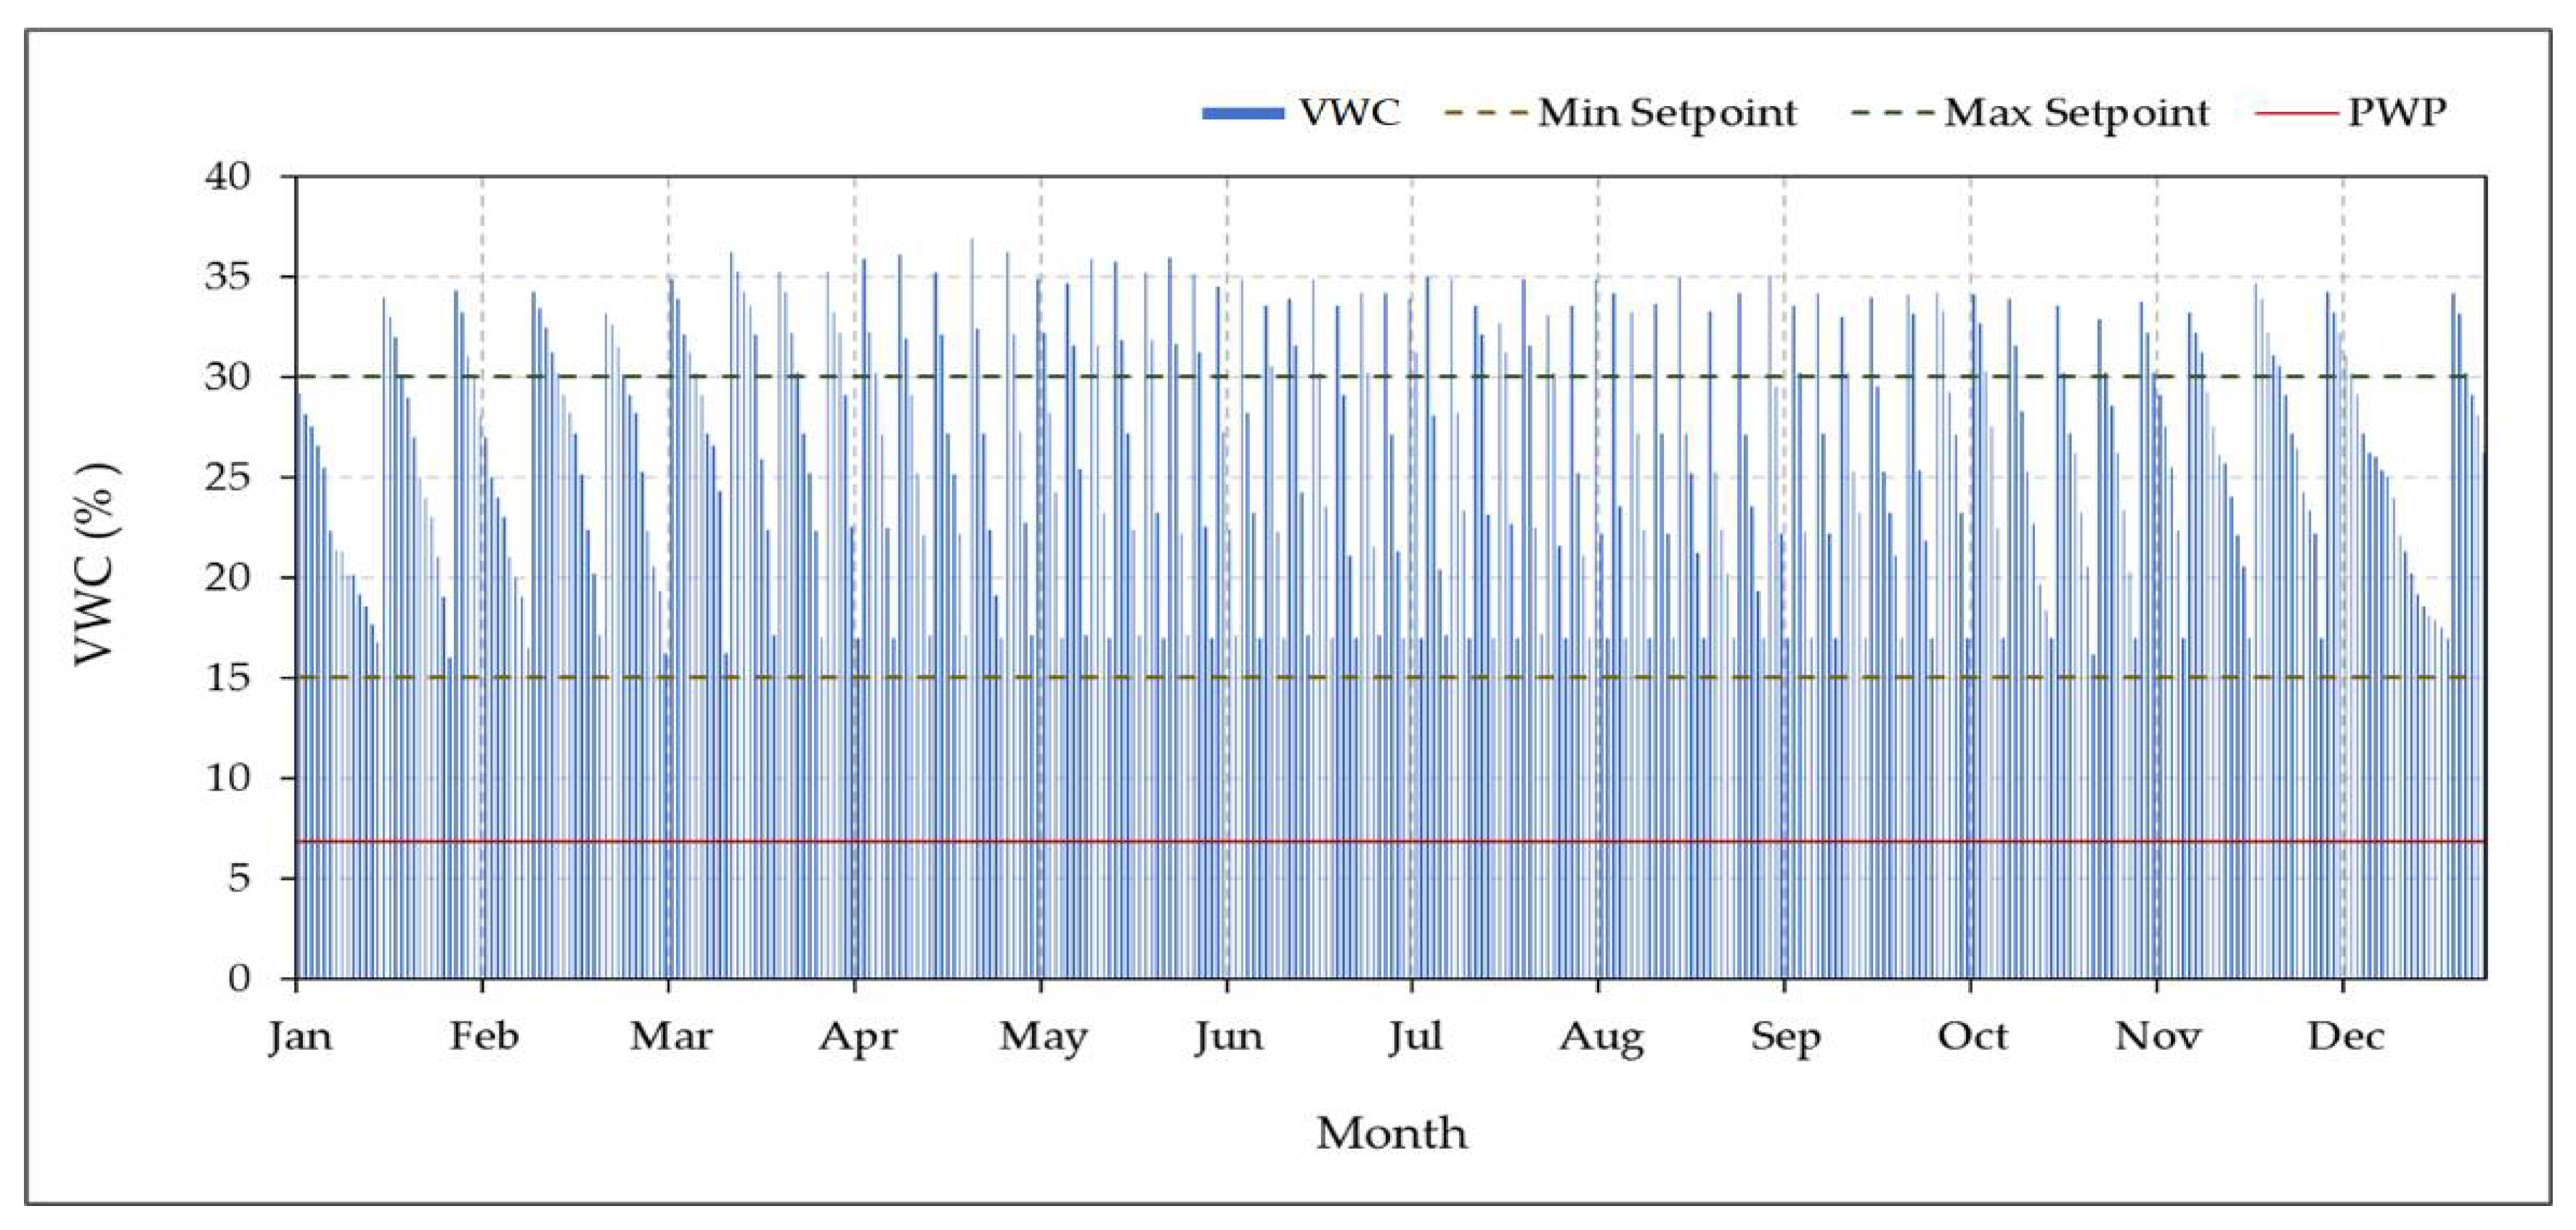
3.4.2. Monitoring of the Volumetric Water Content
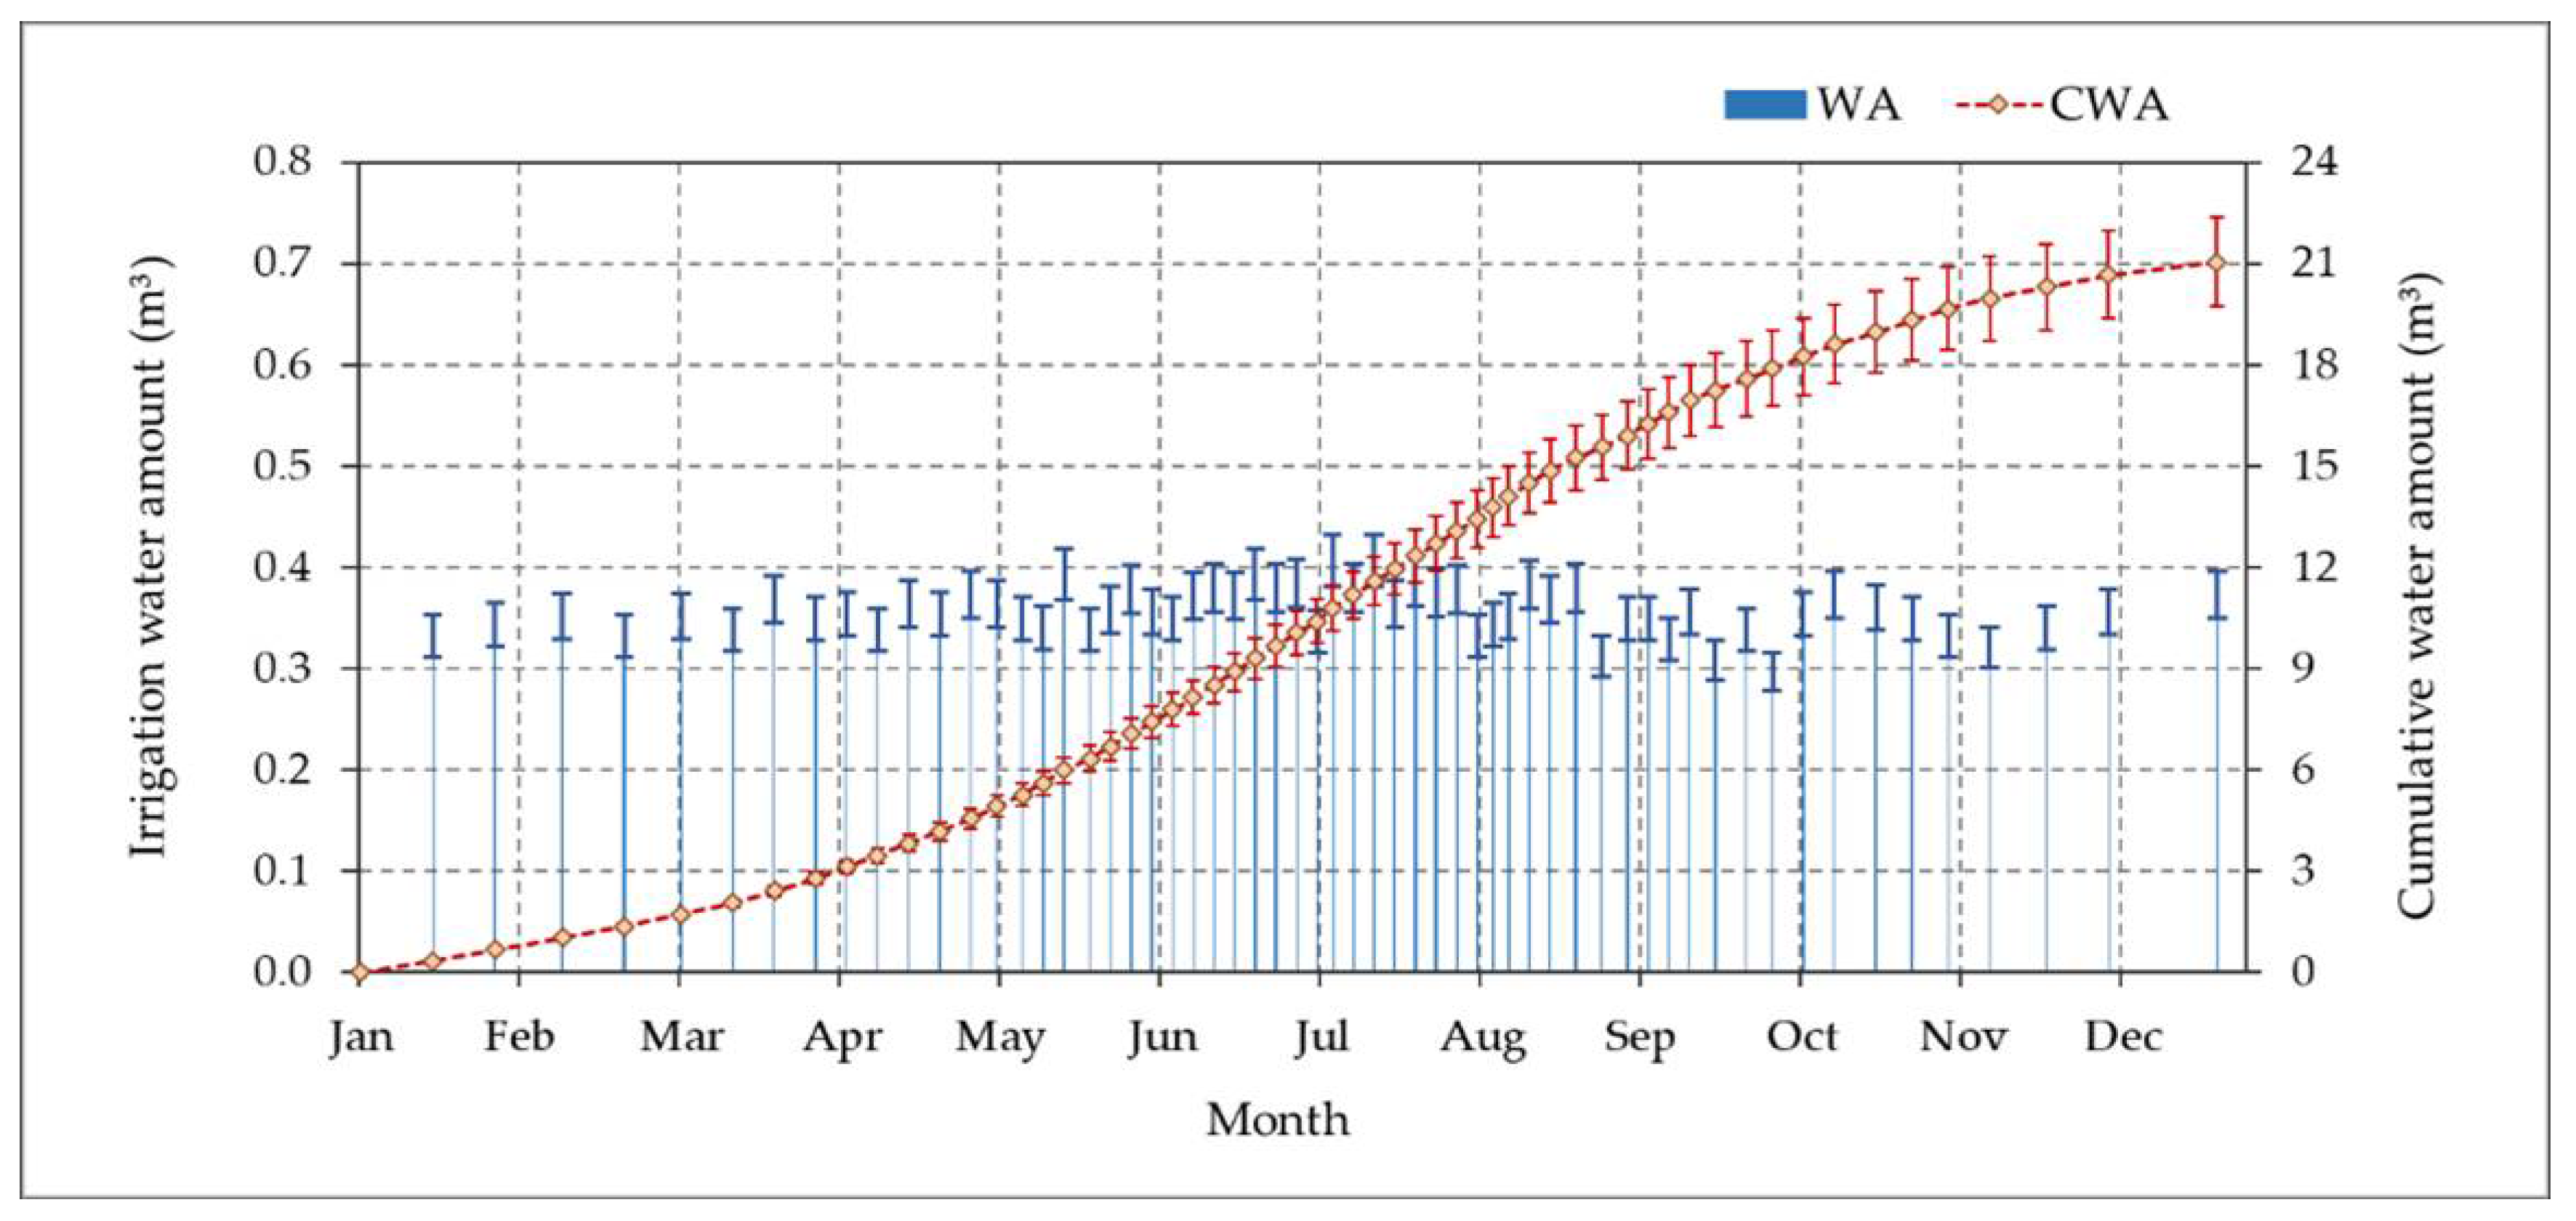
3.4.3. Monitoring of Irrigation Water Applied
3.5. Time-Based Irrigation Schedule
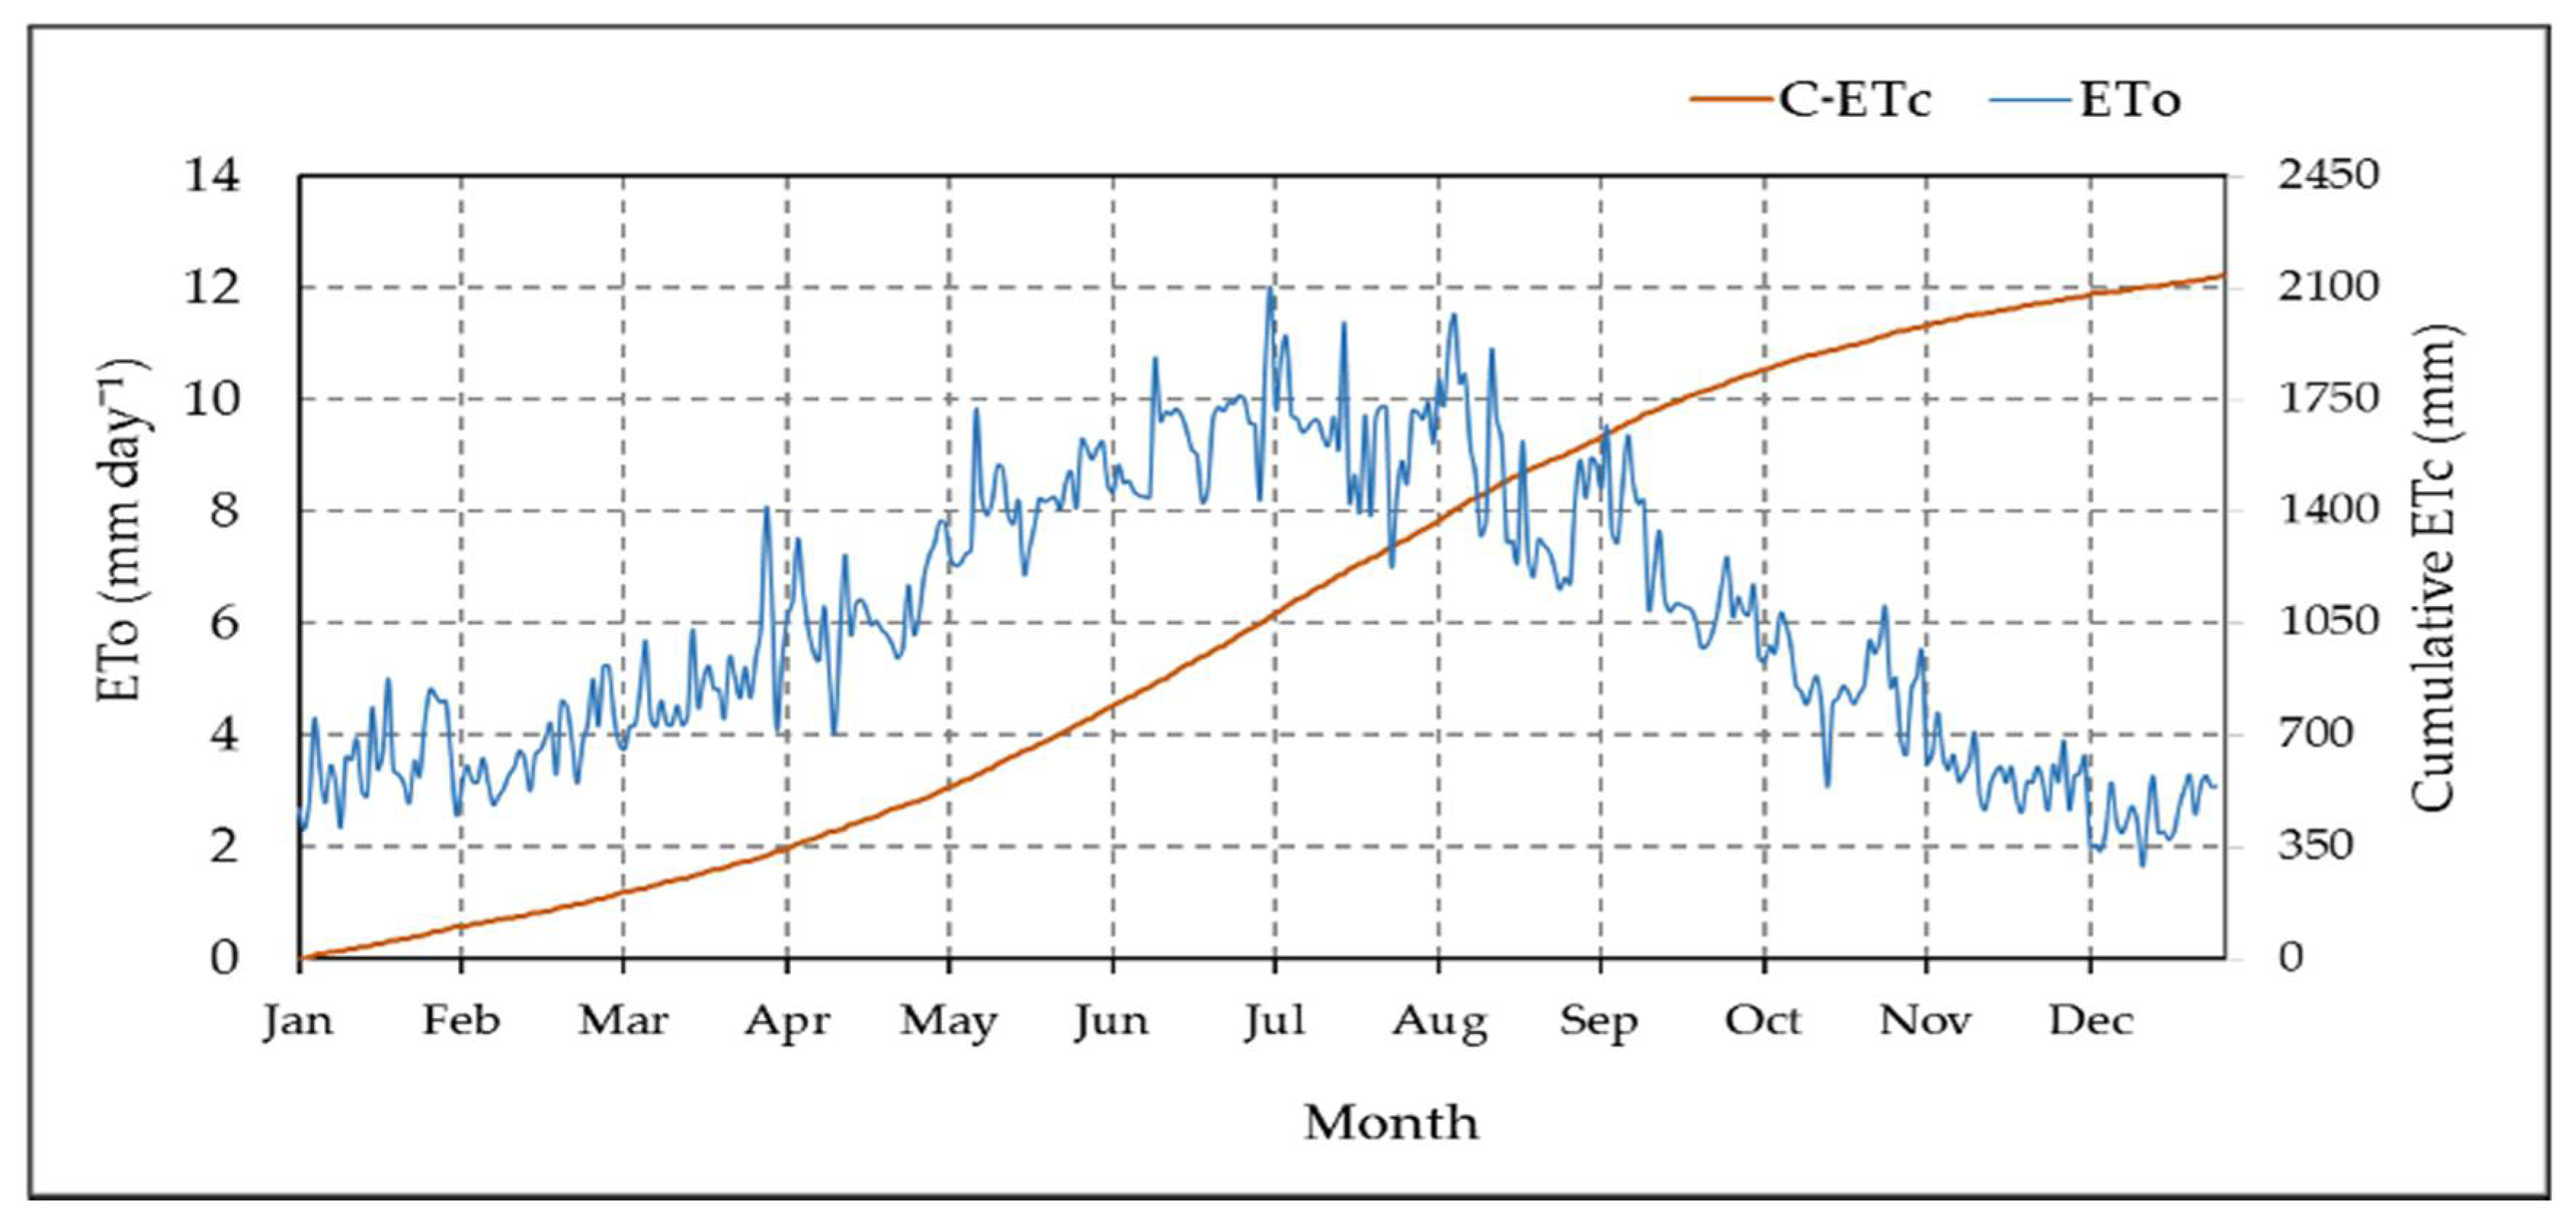
3.5.1. Crop Evapotranspiration
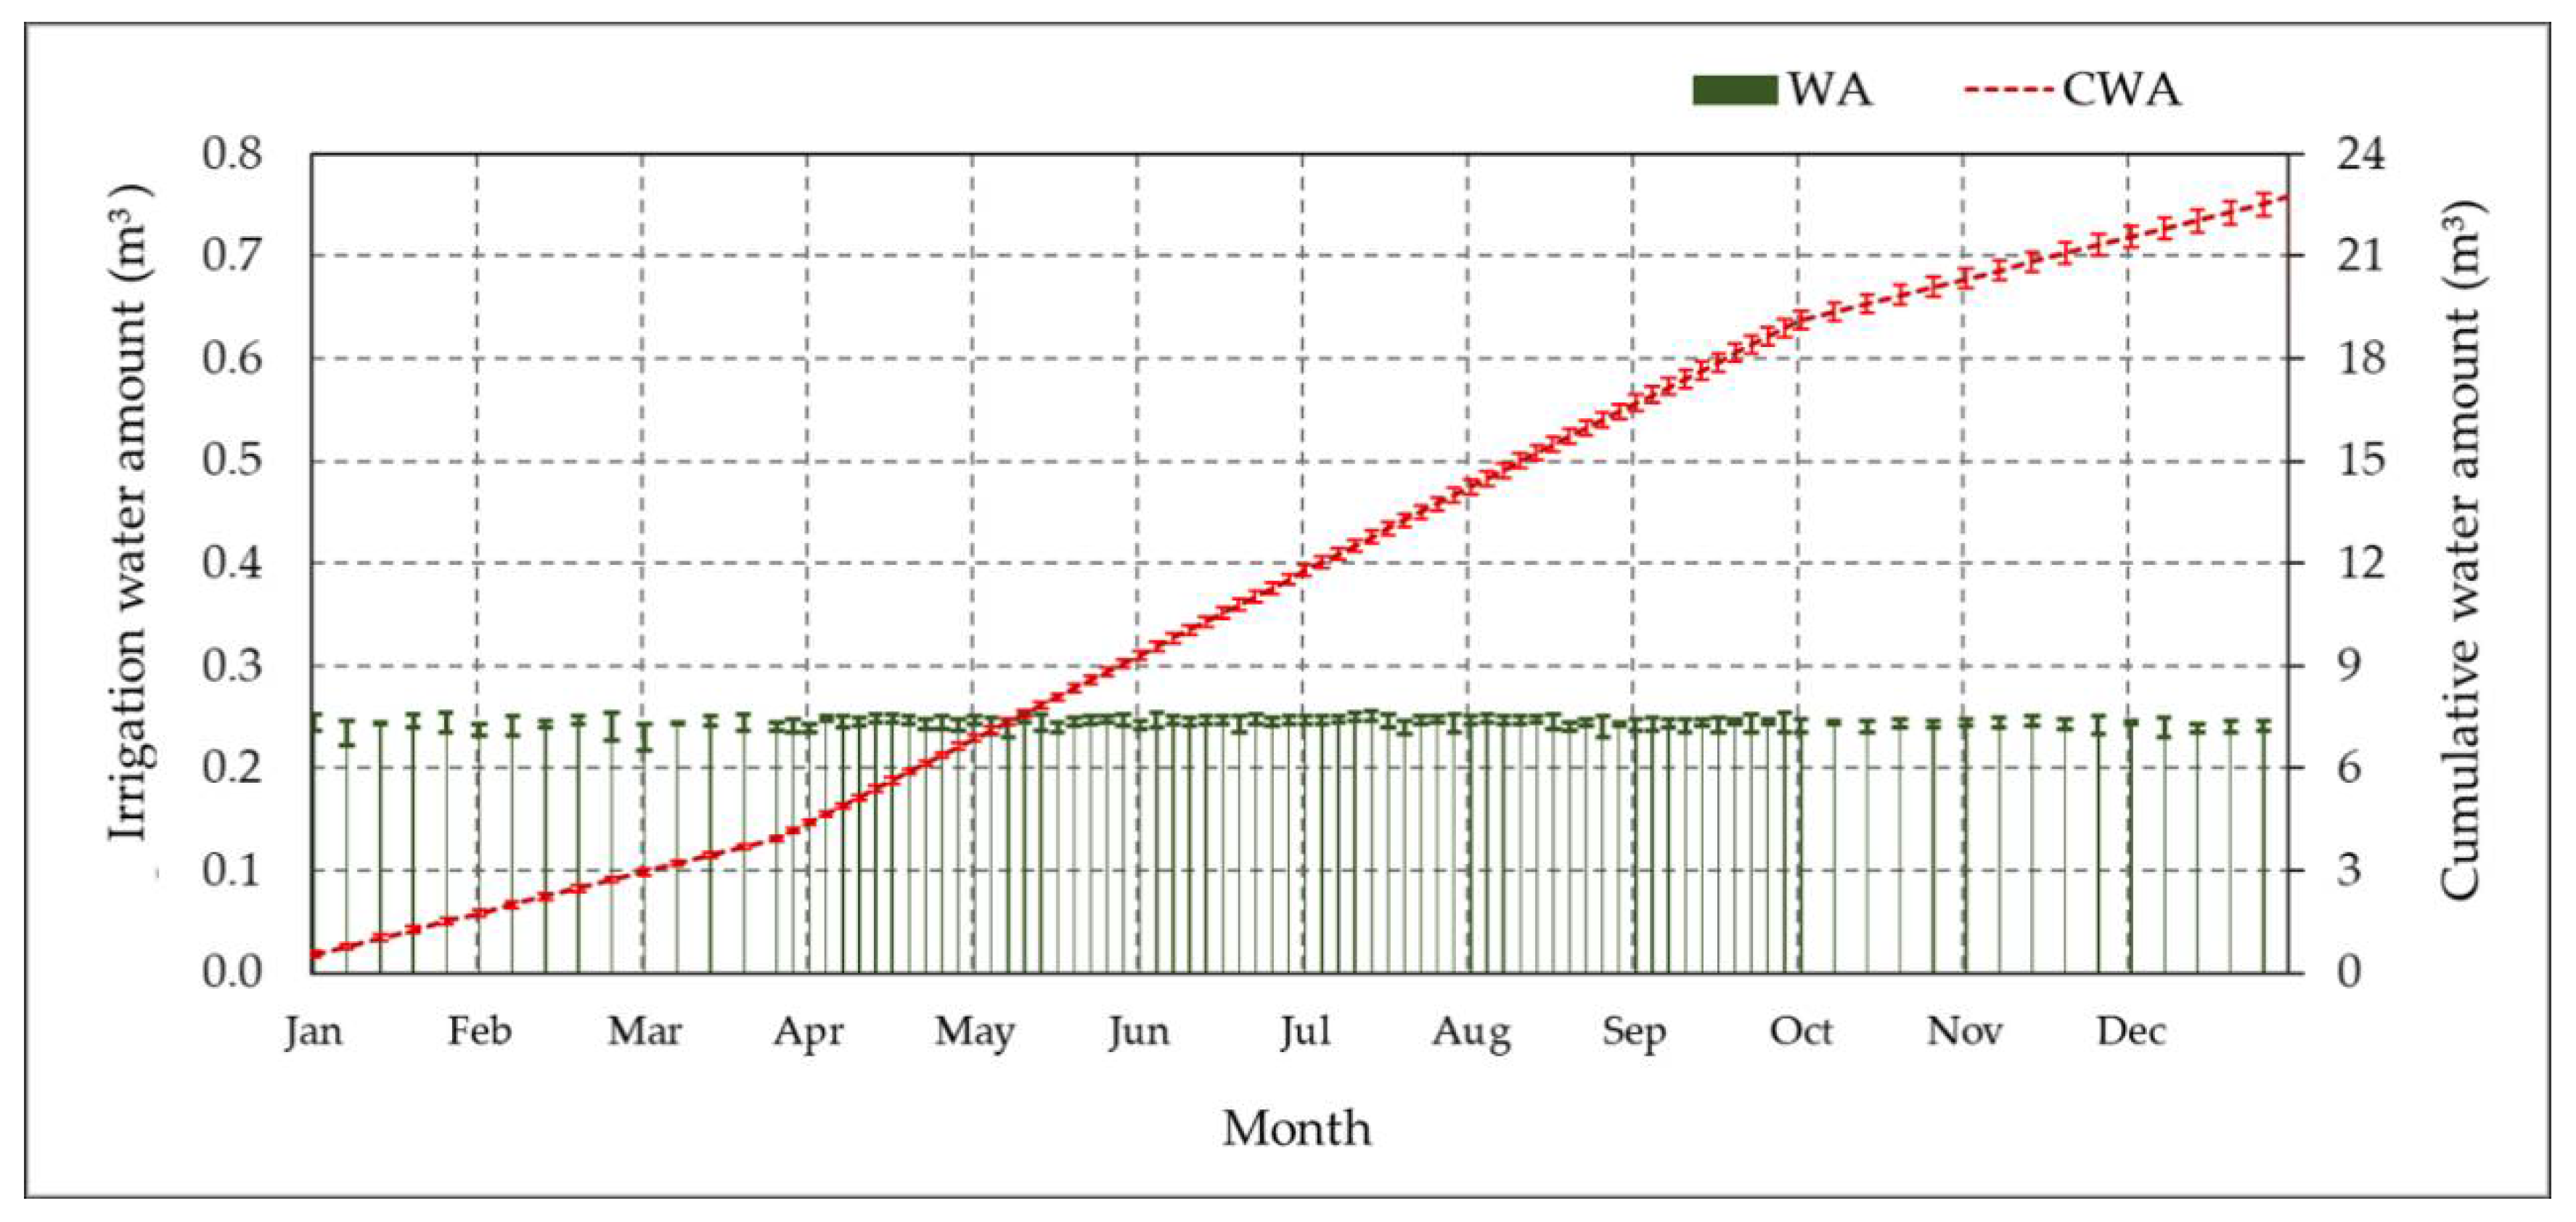
3.5.2. Monitoring of Irrigation Water Applied
3.6. Date Palm Yield and Water productivity
4. Conclusions
Author Contributions
Funding
Institutional Review Board Statement
Informed Consent Statement
Data Availability Statement
Acknowledgments
Conflicts of Interest
References
- Mohammed, M.E.A.; Alhajhoj, M.R.; Ali-Dinar, H.M.; Munir, M. Impact of a novel water-saving subsurface irrigation system on water productivity, photosynthetic characteristics, yield, and fruit quality of date palm under arid conditions. Agronomy 2020, 10, 1265. [Google Scholar] [CrossRef]
- Gonzales-Gustavson, E.; Rusiñol, M.; Medema, G.; Calvo, M.; Girones, R. Quantitative risk assessment of norovirus and adenovirus for the use of reclaimed water to irrigate lettuce in Catalonia. Water Res. 2019, 153, 91–99. [Google Scholar] [CrossRef]
- Martínez-Alvarez, V.; Martin-Gorriz, B.; Soto-García, M. Seawater desalination for crop irrigation—A review of current experiences and revealed key issues. Desalination 2016, 381, 58–70. [Google Scholar] [CrossRef]
- Sagheer, A.; Mohammed, M.; Riad, K.; Alhajhoj, M. A cloud-based IoT platform for precision control of soilless greenhouse cultivation. Sensors 2021, 21, 223. [Google Scholar] [CrossRef]
- Calera, A.; Campos, I.; Osann, A.; D’Urso, G.; Menenti, M. Remote sensing for crop water management: From ET modelling to services for the end users. Sensors 2017, 17, 1104. [Google Scholar] [CrossRef] [PubMed] [Green Version]
- Kashyap, P.K.; Kumar, S.; Jaiswal, A.; Prasad, M.; Gandomi, A.H. Towards Precision Agriculture: IoT-enabled Intelligent Irrigation Systems Using Deep Learning Neural Network. IEEE Sens. J. 2021, 1–11, preprint. [Google Scholar] [CrossRef]
- Shadeed, S. Spatio-temporal Drought Analysis in Arid and Semi-arid Regions: A Case Study from Palestine. Arab. J. Sci. Eng. 2013, 38, 2303–2313. [Google Scholar] [CrossRef]
- Liebenberg, P.J.; Zaid, A. Date palm irrigation. In Date Palm Cultivation FAO Plant Production and Protection Paper; FAO: Rome, Italy, 2002; Chapter 7. [Google Scholar]
- Abdelouahhab, Z.; Arias-Jimenez, E.J. Date Palm Cultivation; Food and Agriculture Organization (FAO): Rome, Italy, 1999. [Google Scholar]
- Baig, M.B.; Alotibi, Y.; Straquadine, G.S.; Alataway, A. Water resources in the kingdom of Saudi Arabia: Challenges and strategies for improvement. In Global Issues in Water Policy; Springer: Berlin/Heidelberg, Germany, 2020; Volume 23, pp. 135–160. [Google Scholar]
- Al-Omran, A.; Alshammari, F.; Eid, S.; Nadeem, M. Determination of date palm water requirements in Saudi Arabia. In Climate Change, Food Security and Natural Resource Management: Regional Case Studies from Three Continents; Behnassi, M., Pollmann, O., Gupta, H., Eds.; Springer International Publishing: Cham, Switzerland, 2018; pp. 179–201. ISBN 9783319970912. [Google Scholar]
- Ismail, S.M.; Al-Qurashi, A.D.; Awad, M.A. Optimization of irrigation water use, yield, and quality of “Nabbut-Saif” date palm under dry land conditions. Irrig. Drain. 2014, 63, 29–37. [Google Scholar] [CrossRef]
- Severino, G.; D’Urso, G.; Scarfato, M.; Toraldo, G. The IoT as a tool to combine the scheduling of the irrigation with the geostatistics of the soils. Future Gener. Comput. Syst. 2018, 82, 268–273. [Google Scholar] [CrossRef]
- Food and Agriculture Organization of the United (FAO); International Center for Advanced Mediterranean Agronomic Studies (CIHEAM). Proceedings of the Workshop on “Irrigation of Date Palm and Associated Crops” Faculty of Agriculture, Damascus University, Damascus, Syria, 27–30 May 2008.
- Deng, X.P.; Shan, L.; Zhang, H.; Turner, N.C. Improving agricultural water use efficiency in arid and semiarid areas of China. Agric. Water Manag. 2006, 80, 23–40. [Google Scholar] [CrossRef]
- Ahmed, T.F.; Hashmi, H.N.; Ghumman, A.R. Performance Assessment of Subsurface Drip Irrigation System Using Pipes of Varying Flexibility. Mehran Univ. Res. J. Eng. Technol. 2011, 30, 361–370. [Google Scholar]
- Liao, R.; Zhang, S.; Zhang, X.; Wang, M.; Wu, H.; Zhangzhong, L. Development of smart irrigation systems based on real-time soil moisture data in a greenhouse: Proof of concept. Agric. Water Manag. 2021, 245. [Google Scholar] [CrossRef]
- Brouwer, C.; Prins, K.; Heibloem, M. Irrigation Water Management: Irrigation Scheduling. Train. Man. 1989, 4, 66. [Google Scholar]
- Pereira, L.S. Crop Evapotranspiration-Guidelines for Computing Crop Water Requirements-FAO Irrigation and Drainage Paper 56 H2Olive3s View Project No Title View Project; FAO: Rome, Italy, 1998; Volume 300, p. D05109. [Google Scholar]
- Allen, R.G.; Pereira, L.S.; Raes, D.; Smith, M. FAO Irrigation and Drainage Paper No. 56—Crop Evapotranspiration; Food and Agriculture Organization: Rome, Italy, 1998; Volume 56, p. e156. [Google Scholar]
- Roy, S.K.; Misra, S.; Raghuwanshi, N.S.; Das, S.K. AgriSens: IoT-Based Dynamic Irrigation Scheduling System for Water Management of Irrigated Crops. IEEE Internet Things J. 2021, 8, 5023–5030. [Google Scholar] [CrossRef]
- Nam, S.; Kang, S.; Kim, J. Maintaining a constant soil moisture level can enhance the growth and phenolic content of sweet basil better than fluctuating irrigation. Agric. Water Manag. 2020, 238, 106203. [Google Scholar] [CrossRef]
- Abba, S.; Namkusong, J.W.; Lee, J.A.; Crespo, M.L. Design and performance evaluation of a low-cost autonomous sensor interface for a smart iot-based irrigation monitoring and control system. Sensors 2019, 19, 3643. [Google Scholar] [CrossRef] [Green Version]
- Abioye, E.A.; Abidin, M.S.Z.; Mahmud, M.S.A.; Buyamin, S.; AbdRahman, M.K.I.; Otuoze, A.O.; Ramli, M.S.A.; Ijike, O.D. IoT-based monitoring and data-driven modelling of drip irrigation system for mustard leaf cultivation experiment. Inf. Process. Agric. 2020. [Google Scholar] [CrossRef]
- Malbog, M.A.F.; Susa, J.A.B.; Alon, A.S.; Casuat, C.D.; Mindoro, J.N. A fuzzy rule-based approach for automatic irrigation system through controlled soil moisture measurement. Int. J. Adv. Trends Comput. Sci. Eng. 2020, 9, 2332–2337. [Google Scholar] [CrossRef]
- Vijendra, S.; Bajaj, S.; Bassi, A.; Vijendra, S.; Vijendra, S.; Bajaj, S.; Bassi, A.; Vij, A.; Vijendra, S.; Vij, A.; et al. IoT and Machine Learning Approaches for Automation of Farm Irrigation System. Procedia Comput. Sci. 2019, 167, 1250–1257. [Google Scholar]
- Al-Amoud, A.I. Date Palm Response to Subsurface Drip Irrigation. Am. Soc. Agric. Biol. Eng. 2006, 06204. [Google Scholar] [CrossRef]
- Al-Amoud, A.I. Subsurface drip irrigation for date palm trees to conserve water. Acta Hortic. 2010, 882, 103–114. [Google Scholar] [CrossRef]
- Dhehibi, B.; Salah, M.B.; Frija, A.; Aw-Hassan, A.; El Ouhibi, H.; Al Raisi, Y.M. Economic and Technical Evaluation of Different Irrigation Systems for Date Palm Farming System in the GCC Countries: Case of Oman. Environ. Nat. Resour. Res. 2018, 8, 55. [Google Scholar] [CrossRef] [Green Version]
- Bell, J.M.; Schwartz, R.; McInnes, K.J.; Howell, T.; Morgan, C.L.S. Deficit irrigation effects on yield and yield components of grain sorghum. Agric. Water Manag. 2018, 203, 289–296. [Google Scholar] [CrossRef]
- Campi, P.; Mastrorilli, M.; Stellacci, A.M.; Modugno, F.; Palumbo, A.D. Increasing the effective use of water in green asparagus through deficit irrigation strategies. Agric. Water Manag. 2019, 217, 119–130. [Google Scholar] [CrossRef]
- Al-Amoud, A.I.; Mohammad, F.S.; Al-Hamed, S.A.; Al-Abdulkader, A.M. Reference evapotranspiration and date palm water use in the kingdom of Saudi Arabia. Int. Res. J. Agric. Sci. Soil Sci. 2012, 2, 155–169. [Google Scholar]
- Adil, M.; Samia, H.; Sakher, M.; El Hafed, K.; Naima, K.; Kawther, L.; Tidjani, B.; Abdesselam, B.; Bensalah, L.M. hame.; Yamina, K.; et al. Date palm (Phoenix dactylifera L.) irrigation water requirements as affected by salinity in Oued Righ conditions, North Eastern Sahara, Algeria. Asian J. Crop Sci. 2015, 7, 174–185. [Google Scholar] [CrossRef] [Green Version]
- Bainbridge, D.A. Deep Pipe Irrigation; The Overstory# 175; Permanent Agriculture Resources: Holualoa, HI, USA, 2006. [Google Scholar]
- Manzoor Alam, S. Nutrient Uptake by Plants Under Stress Conditions. Handb. Plant Crop Stress 1999, 2, 285–313. [Google Scholar] [CrossRef]
- Mohamed, A.S.; Ali, A.A.; El-Ghany, A.; Yosri, A. Irrigation Water Management of Date Palm Under El-Baharia Oasis Conditions. Egypt. J. Soil Sci. 2018, 58, 27–44. [Google Scholar] [CrossRef] [Green Version]
- Intrigliolo, D.S.; Castel, J.R. Performance of various water stress indicators for prediction of fruit size response to deficit irrigation in plum. Agric. Water Manag. 2006, 83, 173–180. [Google Scholar] [CrossRef]
- Giusti, E.; Marsili-Libelli, S. A Fuzzy Decision Support System for irrigation and water conservation in agriculture. Environ. Model. Softw. 2015, 63, 73–86. [Google Scholar] [CrossRef]
- Osroosh, Y.; Troy Peters, R.; Campbell, C.S.; Zhang, Q. Automatic irrigation scheduling of apple trees using theoretical crop water stress index with an innovative dynamic threshold. Comput. Electron. Agric. 2015, 118, 193–203. [Google Scholar] [CrossRef]
- Intrigliolo, D.S.; Castel, J.R. Response of plum trees to deficit irrigation under two crop levels: Tree growth, yield and fruit quality. Irrig. Sci. 2010, 28, 525–534. [Google Scholar] [CrossRef]
- Al-Muaini, A.; Green, S.; Abou Dahr, W.A.; Kennedy, L.; Kemp, P.; Dawoud, M.; Clothier, B. Water use and irrigation requirements for date palms on commercial farms in the hyper-arid United Arab Emirates. Agric. Water Manag. 2019, 223, 105702. [Google Scholar] [CrossRef]
- Egea, G.; González-Real, M.M.; Baille, A.; Nortes, P.A.; Conesa, M.R.; Ruiz-Salleres, I. Effects of water stress on irradiance acclimation of leaf traits in almond trees. Tree Physiol. 2012, 32, 450–463. [Google Scholar] [CrossRef] [PubMed]
- Alikhani-Koupaei, M.; Fatahi, R.; Zamani, Z.; Salimi, S. Effects of deficit irrigation on some physiological traits, production and fruit quality of ‘Mazafati’ date palm and the fruit wilting and dropping disorder. Agric. Water Manag. 2018, 209, 219–227. [Google Scholar] [CrossRef]


| Soil Depth | Particle Size Distribution | BD (g cm−3) | Fc (%) | PWP (%) | pH | ECs (dS m−1) | HC (cm h−1) | ||
|---|---|---|---|---|---|---|---|---|---|
| Sand (%) | Silt (%) | Clay (%) | |||||||
| 0–25 | 65 | 19 | 16 | 1.57 | 15.6 | 6.8 | 8.1 | 3.22 | 4.8 |
| 25–50 | 67 | 18 | 15 | 1.55 | 16.5 | 6.7 | 7.8 | 3.21 | 4.7 |
| 50–75 | 66 | 19 | 15 | 1.58 | 16.2 | 7.1 | 7.9 | 3.18 | 4.9 |
| 75–100 | 69 | 18 | 13 | 1.59 | 16.7 | 6.5 | 8.1 | 3.24 | 4.9 |
| Mean | 66.8 | 18.5 | 14.8 | 1.6 | 16.3 | 6.8 | 8.0 | 3.21 | 4.8 |
| St. Dev. | 1.71 | 0.58 | 1.26 | 0.02 | 0.48 | 0.25 | 0.15 | 0.03 | 0.10 |
| Parameters | Statistical Metrics | ||
|---|---|---|---|
| Index of Agreement (d) | Root Mean Square Error (RMSE) | Mean Bias Error (MBE) | |
| Temperature | 0.998 | 0.780 | −0.234 |
| Relative humidity | 0.986 | 0.497 | −1.026 |
| Wind speed | 0.985 | 1.114 | 0.163 |
| Solar energy | 0.999 | 0.024 | 0.004 |
| Soil water content | 0.991 | 2.001 | −0.527 |
| Water flow | 0.995 | 0.978 | −0.053 |
| Parameters | Irrigation Methods | ||
|---|---|---|---|
| CSIS | TSI (Control) | ||
| S-BIS | T-BIS | ||
| Annual applied water in depth | 956.3 ± 52.1 A | 1034.6 ± 13.1 B | 2668.7 ± 9.5 C |
| Amount of applied water | 21.03 ± 1.13 A | 22.76 ± 0.29 B | 58.71 ± 0.21 C |
| Total yield of date palm tree | 37.57 ± 0.92 A | 34.86 ± 2.03 B | 30.97 ± 1.13 C |
| Water productivity | 1.783 ± 0.08 A | 1.440 ± 0.09 B | 0.531 ± 0.03 C |
Publisher’s Note: MDPI stays neutral with regard to jurisdictional claims in published maps and institutional affiliations. |
© 2021 by the authors. Licensee MDPI, Basel, Switzerland. This article is an open access article distributed under the terms and conditions of the Creative Commons Attribution (CC BY) license (https://creativecommons.org/licenses/by/4.0/).
Share and Cite
Mohammed, M.; Riad, K.; Alqahtani, N. Efficient IoT-Based Control for a Smart Subsurface Irrigation System to Enhance Irrigation Management of Date Palm. Sensors 2021, 21, 3942. https://doi.org/10.3390/s21123942
Mohammed M, Riad K, Alqahtani N. Efficient IoT-Based Control for a Smart Subsurface Irrigation System to Enhance Irrigation Management of Date Palm. Sensors. 2021; 21(12):3942. https://doi.org/10.3390/s21123942
Chicago/Turabian StyleMohammed, Maged, Khaled Riad, and Nashi Alqahtani. 2021. "Efficient IoT-Based Control for a Smart Subsurface Irrigation System to Enhance Irrigation Management of Date Palm" Sensors 21, no. 12: 3942. https://doi.org/10.3390/s21123942