Article

A High-Resolution Reflective Microwave Planar Sensor for Sensing of Vanadium Electrolyte

1
Electrical and Computer Engineering, University of Alberta, Edmonton, AB T6G 1H9, Canada
2
Applied Cybernetics, University of Hradec Králové, 500 03 Hradec Králové, Czech Republic
*
Author to whom correspondence should be addressed.
Sensors 2021, 21(11), 3759; https://doi.org/10.3390/s21113759
Submission received: 12 April 2021 / Revised: 12 May 2021 / Accepted: 22 May 2021 / Published: 28 May 2021
(This article belongs to the Special Issue State-of-the-Art Technologies in Microwave Sensors)

Abstract

:
Microwave planar sensors employ conventional passive complementary split ring resonators (CSRR) as their sensitive region. In this work, a novel planar reflective sensor is introduced that deploys CSRRs as the front-end sensing element at f res = 6 GHz with an extra loss-compensating negative resistance that restores the dissipated power in the sensor that is used in dielectric material characterization. It is shown that the S 11 notch of −15 dB can be improved down to −40 dB without loss of sensitivity. An application of this design is shown in discriminating different states of vanadium redox solutions with highly lossy conditions of fully charged V 5 + and fully discharged V 4 + electrolytes.

1. Introduction

During the past decade, microwave planar resonators have been found to be highly suitable for sensing applications, mainly due to their compact size, high sensitivity, low manufacturing cost, and high design flexibility [1,2,3,4,5,6,7,8,9,10]. Split ring resonators (SRR), along with their complementary version (CSRR), are the main building blocks of these sensors [11]. They provide regions that are highly sensitive to capacitive and resistive variations in the surrounding environment [12]. These metamaterial-inspired particles are used in liquid characterization [13,14,15,16,17,18,19,20,21,22,23], gas sensing [24], mechanical deformation sensing [25], temperature sensing [26,27], etc. However, they suffer from low-to-moderate quality factors that limit their applications to low-loss material sensing. Several loss-compensation techniques have been reported in the recent literature that demonstrate the impact of a negative resistance circuit on the sharpness of the transfer function of the sensor. Positive feedback is a method of recovering the lost electric field distribution, while it requires excessive components such as phase shifters in some cases [28]. Negative resistance has also shown its applications in sensing. However, possible oscillations should be considered a result of parasitic elements at high frequencies [29,30]. This work introduces a novel circuitry to cope with the excessive losses of the circuits with a negative resistance coupled to a CSRR. Therefore, the sensor, loaded with lossy medium, is compensated and its dynamic range increases with no adverse impact on the sensitivity. It is shown that the same resonance profile in terms of reflection parameter is achievable with a higher quality factor and deeper S 11 notch, and that this scheme is electronically controllable for various materials under test (MUT) with an arbitrary loss factor.
Vanadium redox flow batteries (VRFB) utilize the oxidation states of vanadium. Solid-state reactions are eliminated, and the VRFB electrodes are not prone to damage during deep discharge in contrast with intercalation-type materials used in other battery technologies [31]. The single-metal electrolyte system also reduces the cross-contamination issues that plague other types of redox flow batteries, and has superior stability and reversibility compared to other redox couples such as C r ( III ) / C r ( II ) [31,32,33]. These factors dramatically improve the lifetime of VRFBs and reduce their maintenance requirements. Due to their low energy density, they are limited to stationary applications such as backup power supplies or telecommunication applications.
Capacity loss due to imbalanced material transfer through the membrane can be easily mitigated via periodic remixing of the anolyte and catholyte [34], or automatically via a hydraulic shunt [31].
Capacity loss due to side reactions (e.g., V 2 + oxidation) must be corrected via chemical or electrochemical rebalancing of the oxidation states [31,35,36]. Accounting for these losses allows the electrolyte to be used and its indefinite life to be maintained [36]. To achieve this, a suitable monitoring method is required to detect state of charge imbalances. Open-circuit voltage is one of the most widely used techniques; however, this produces inaccuracies due to the incomplete representation of the electrode potential, and is only accurate in a balanced system [35,36,37].
Conductivity probes have been successfully used to measure the state of charge (SOC) of both half-cells [31]. This is one of the main techniques, usually requiring a separate REDOX cell operating at zero current. When both half-cells are balanced, the terminal voltage can be correlated to SOC. However, side reactions such as precipitation or V 2 + oxidation may break the balance, and the total open-circuit potential does not reflect these imbalances [38]. This method has been used to estimate SOC, but requires calibration for varied electrolyte compositions. Errors may also be introduced due to temperature fluctuations during operation. A four-pole device—an improvement upon half-cells—has two inner poles to measure the potential drop across the electrolyte when a current is passed through the outer poles. Electrode polarization errors are eliminated, but calibration is needed for varied electrolyte compositions. It is also very sensitive to the applied current (poor voltage sensitivity when low, inaccurate measurements when high) and was created to reduce polarization errors [34]. Additionally, this method may produce measurement errors due to its temperature dependence. Similar errors exist when density measurements for SOC monitoring in lead-acid batteries are used [38], and at the same time requires extensive calibration measurements. Reference electrodes implemented in both half-cells allow imbalances to be detected. However, estimation errors arise due to impurities in the reference electrodes. Additionally, recalibration during battery operation is required due to electrode potential drift. Similar to conductivity, this method is composition- and temperature-dependent.
This work presents a novel approach for monitoring losses in the electrolyte solution using a high-resolution microwave sensor that enables a noncontact sensing scheme. In this method, the sensor is not in direct contact with the electrolyte, thus reducing the temperature and displacement dependency. Furthermore, this low-cost design provides a long-lasting sensing platform due to the low maintenance required as an immediate result of the contactless measurement. High-sensitivity CSRR resonators are employed to extract minute changes inside the lossy solutions.

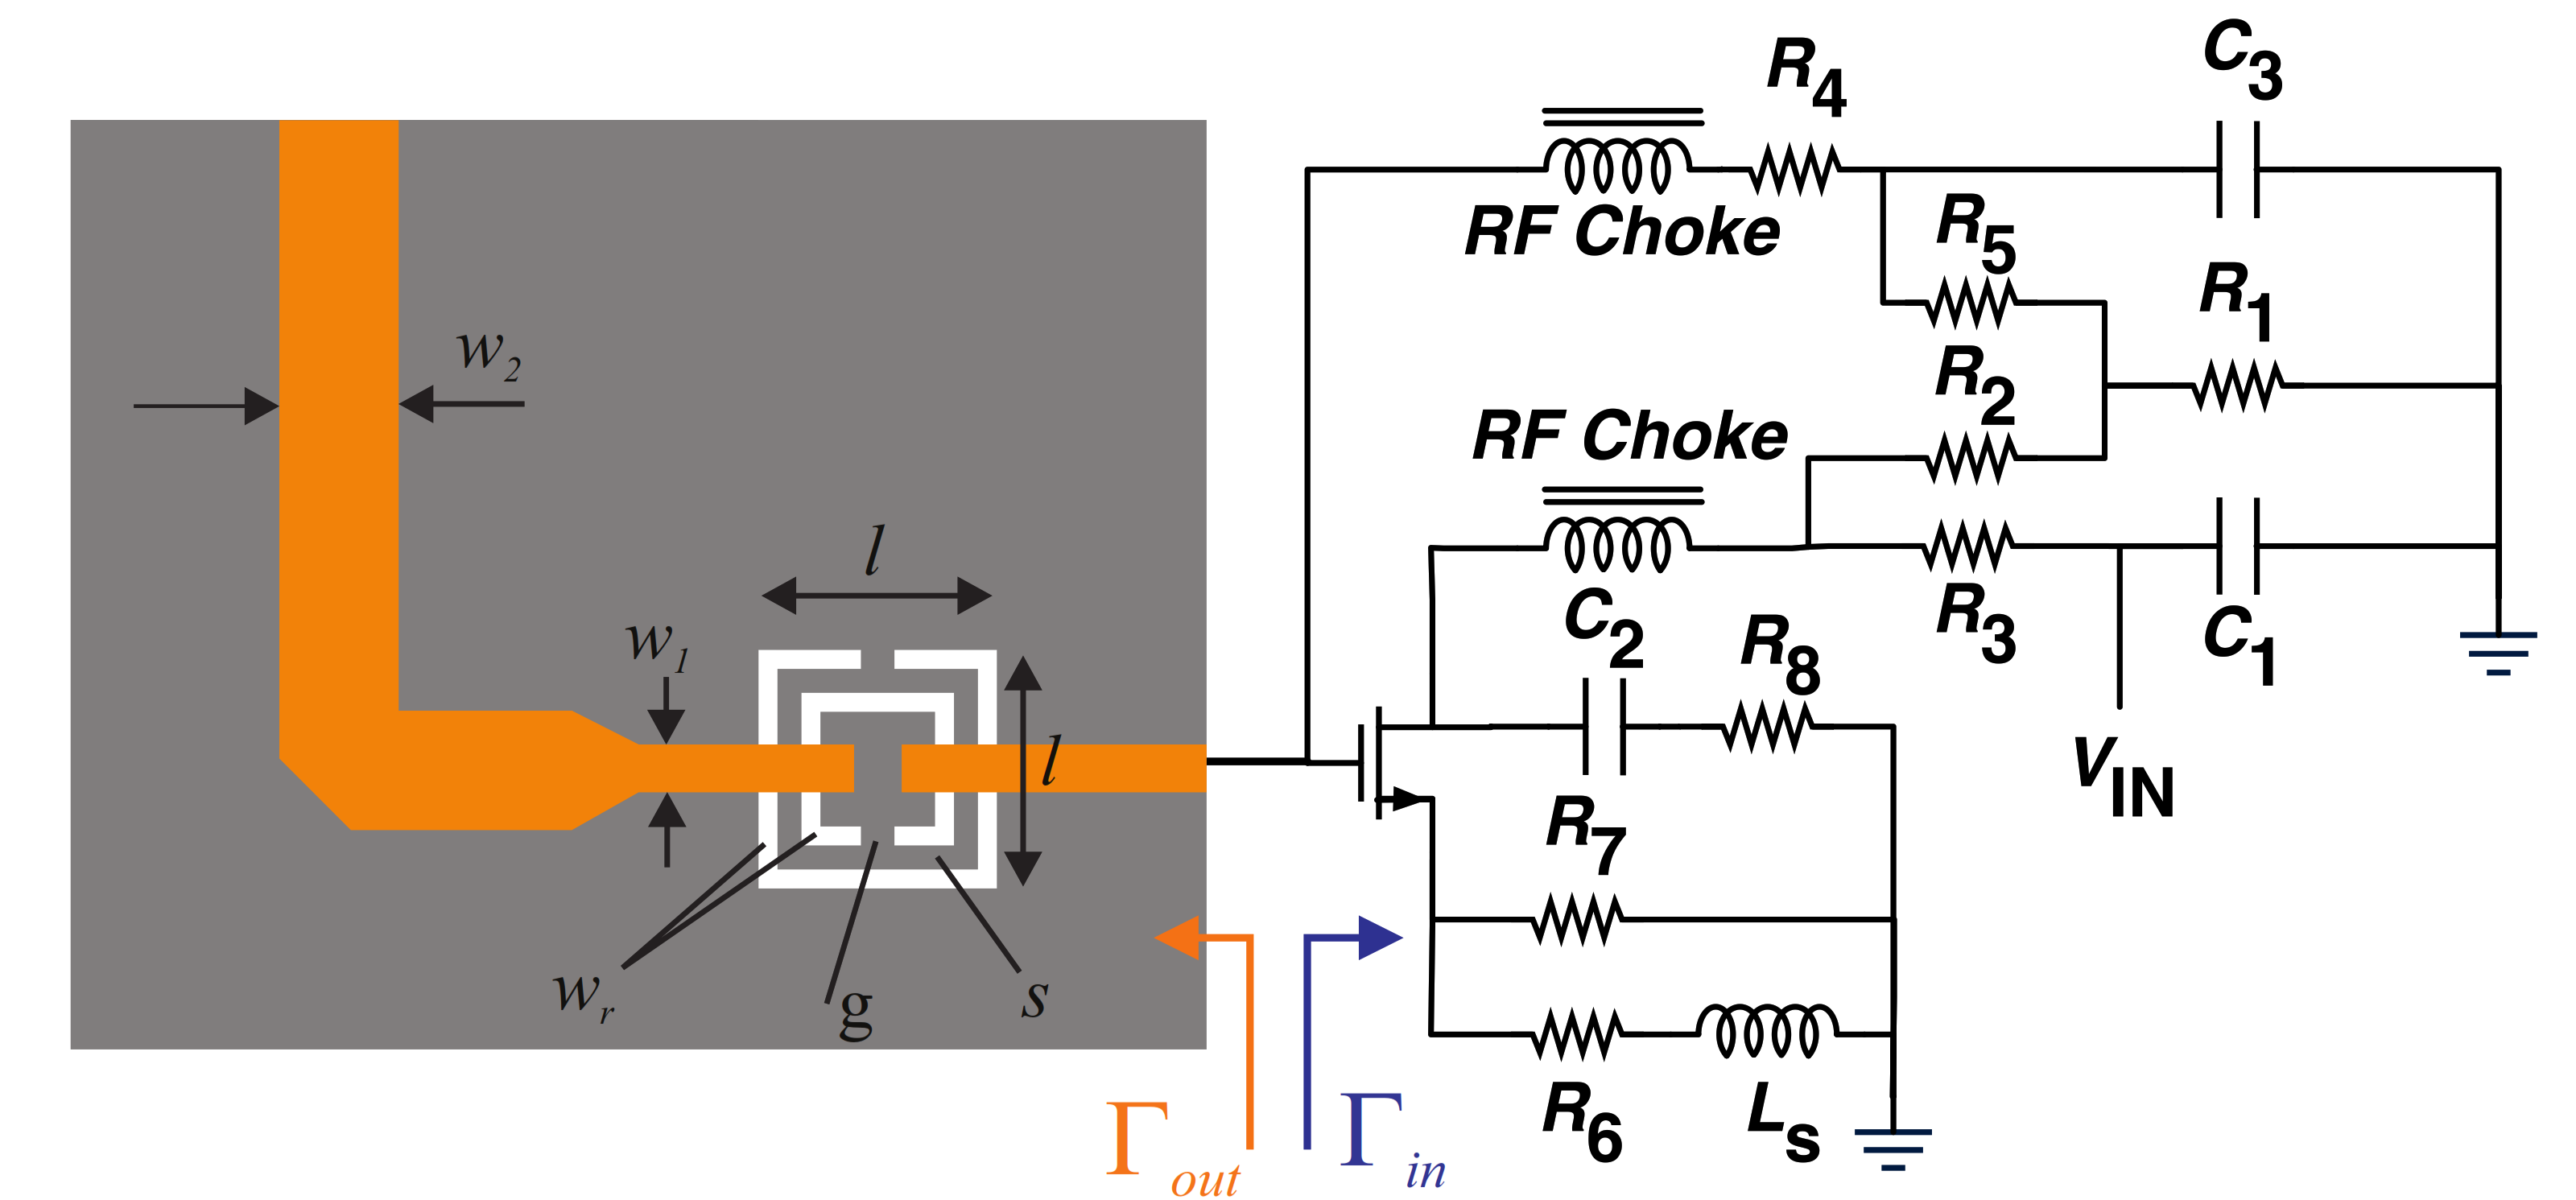
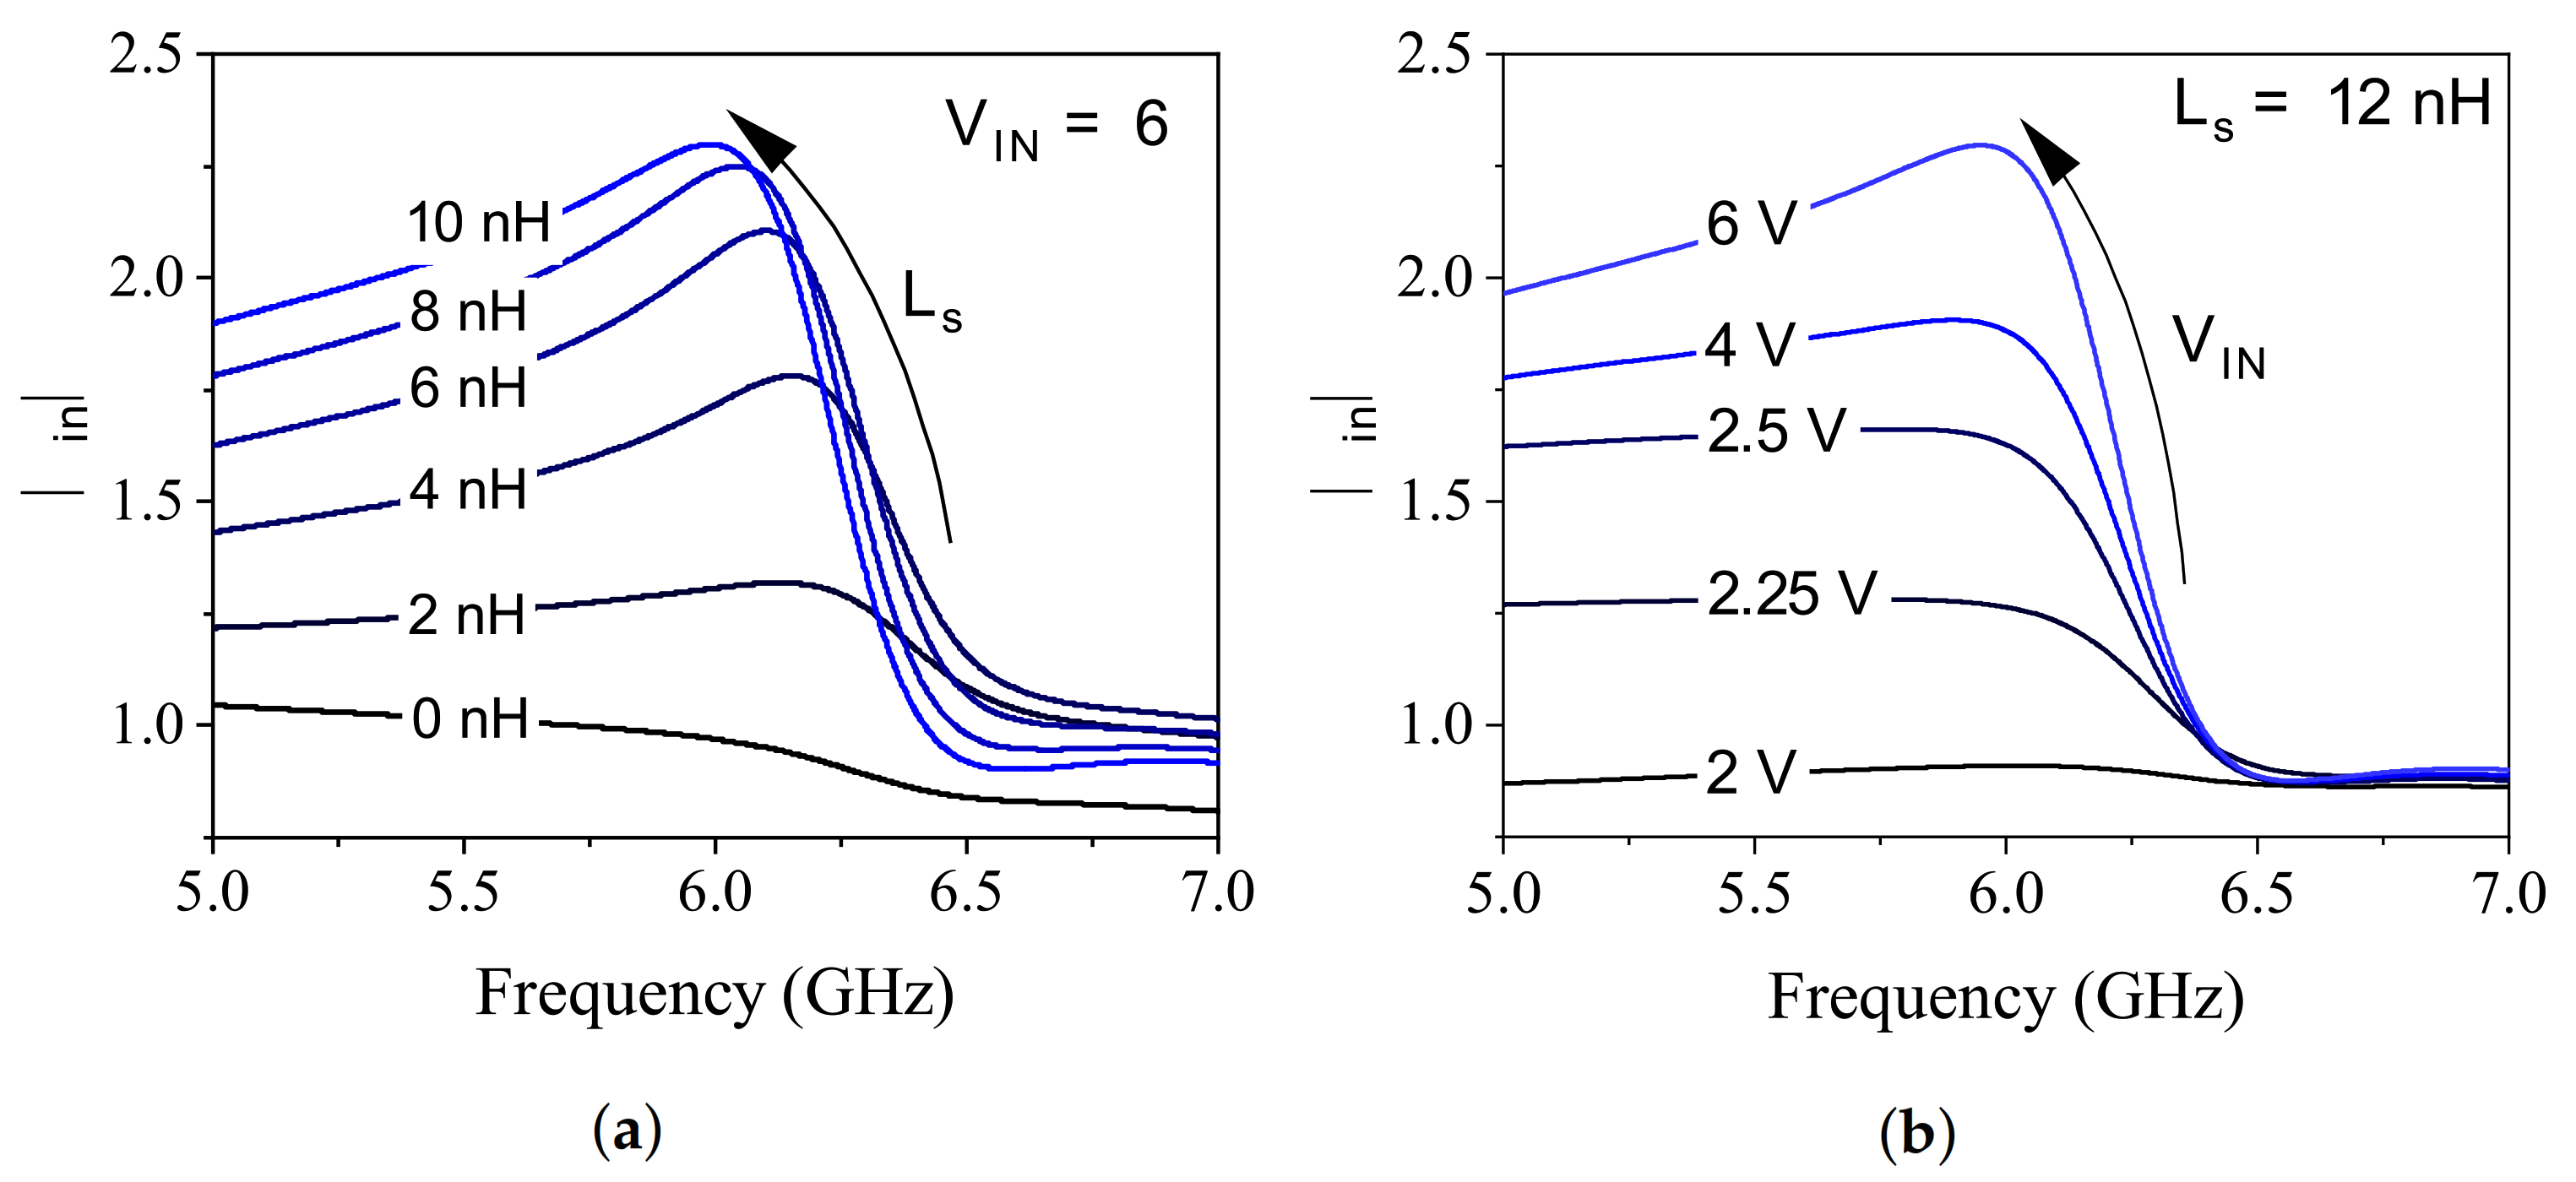
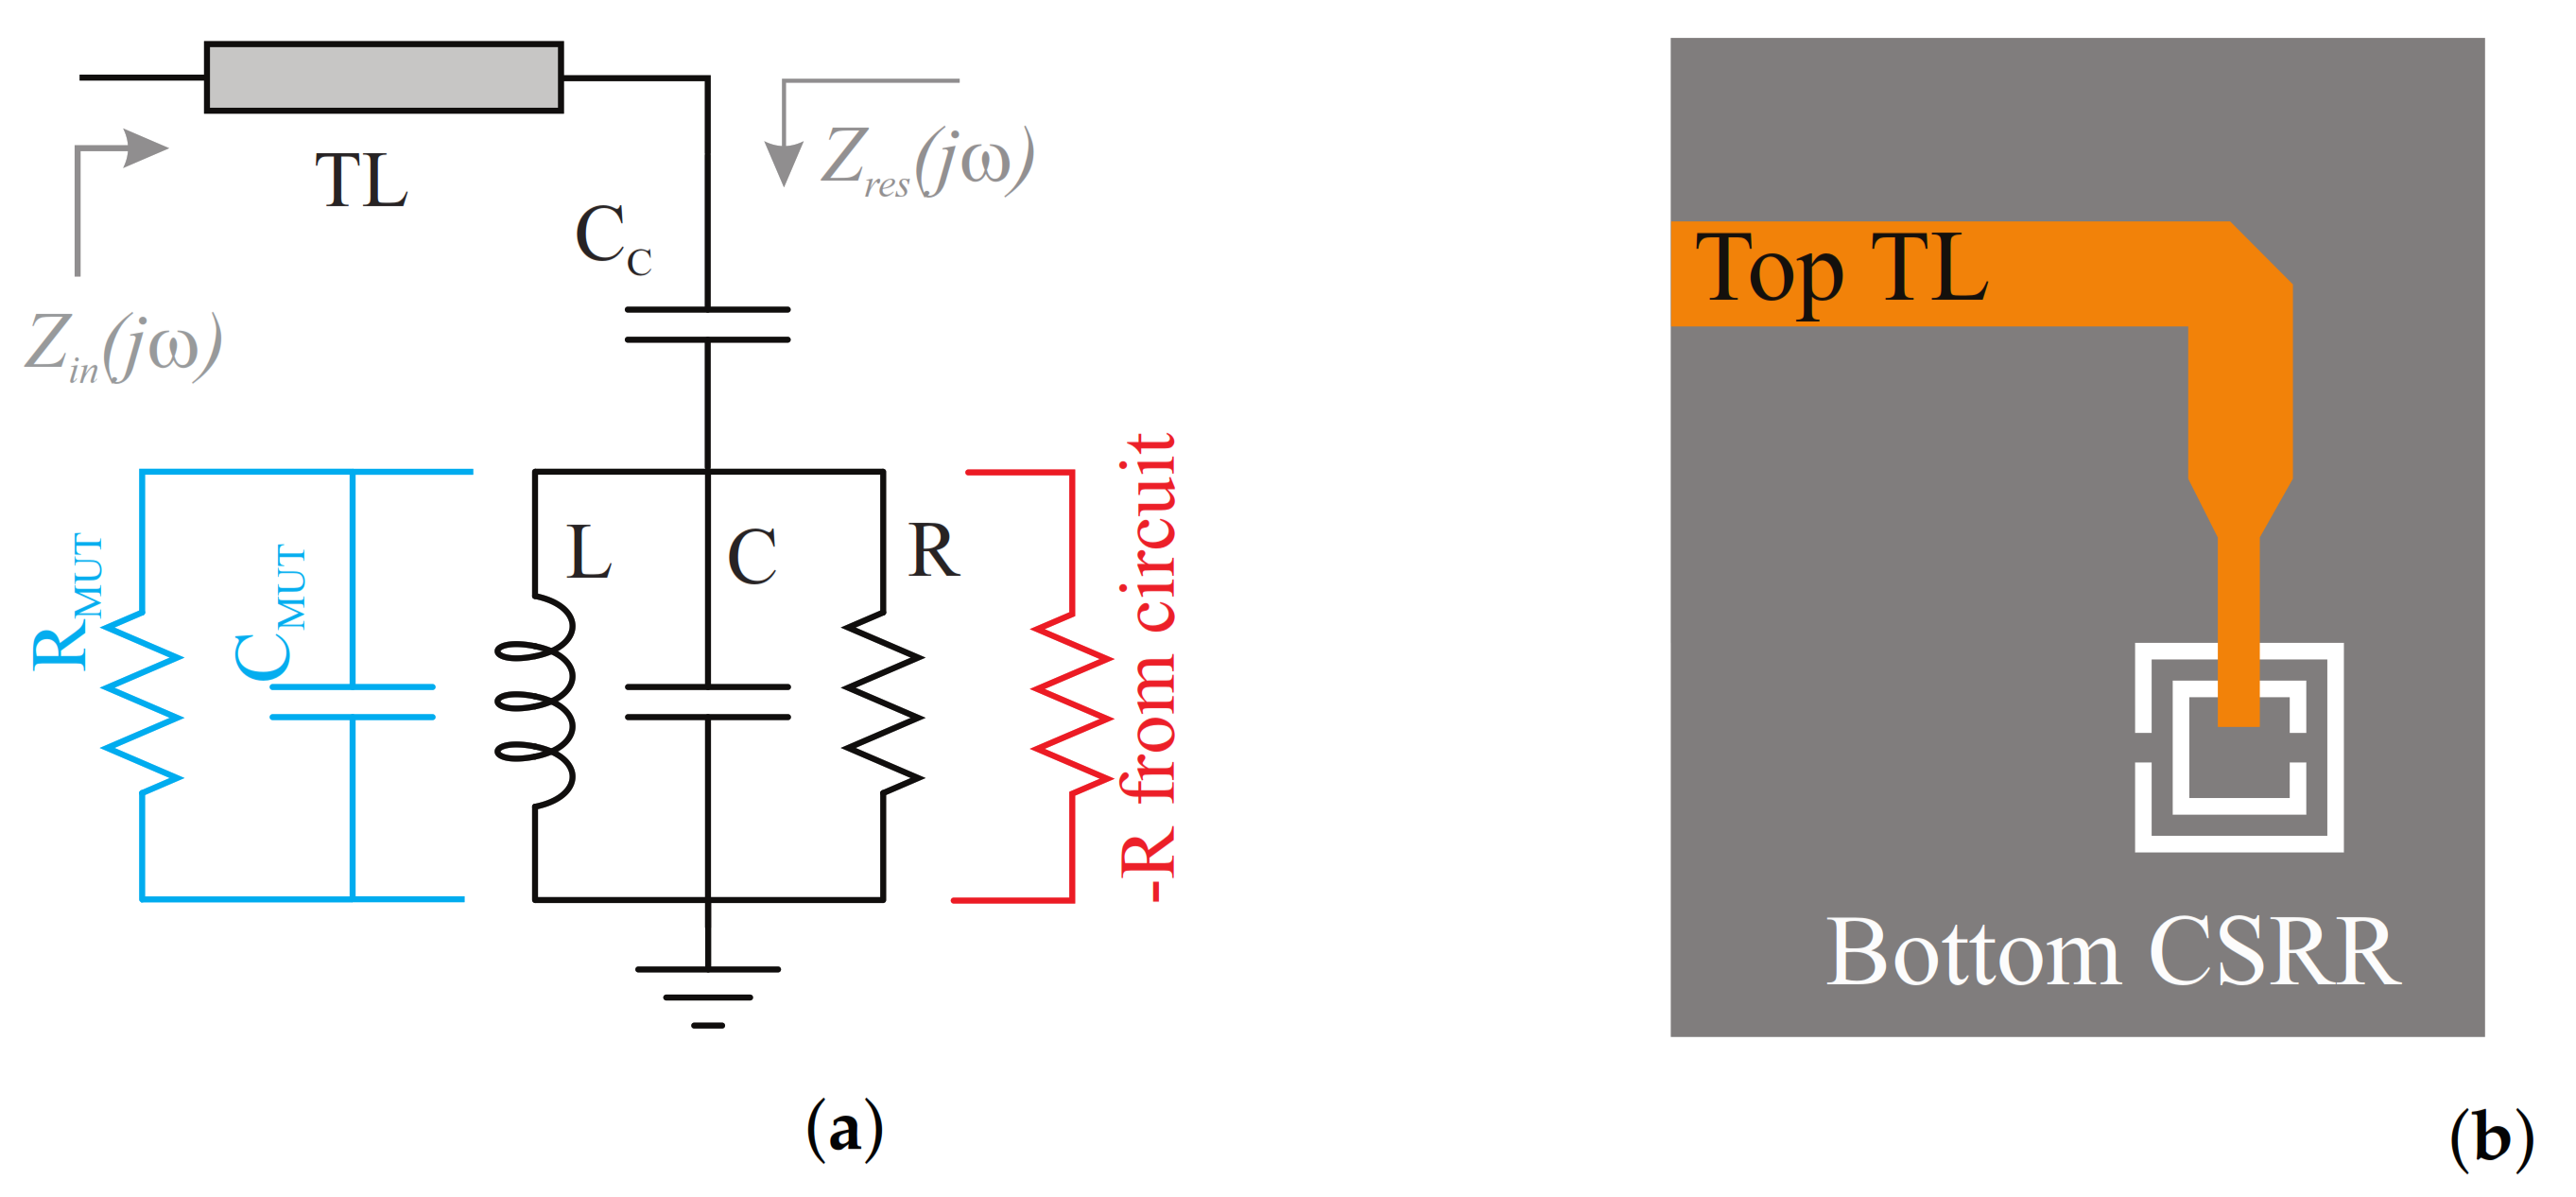
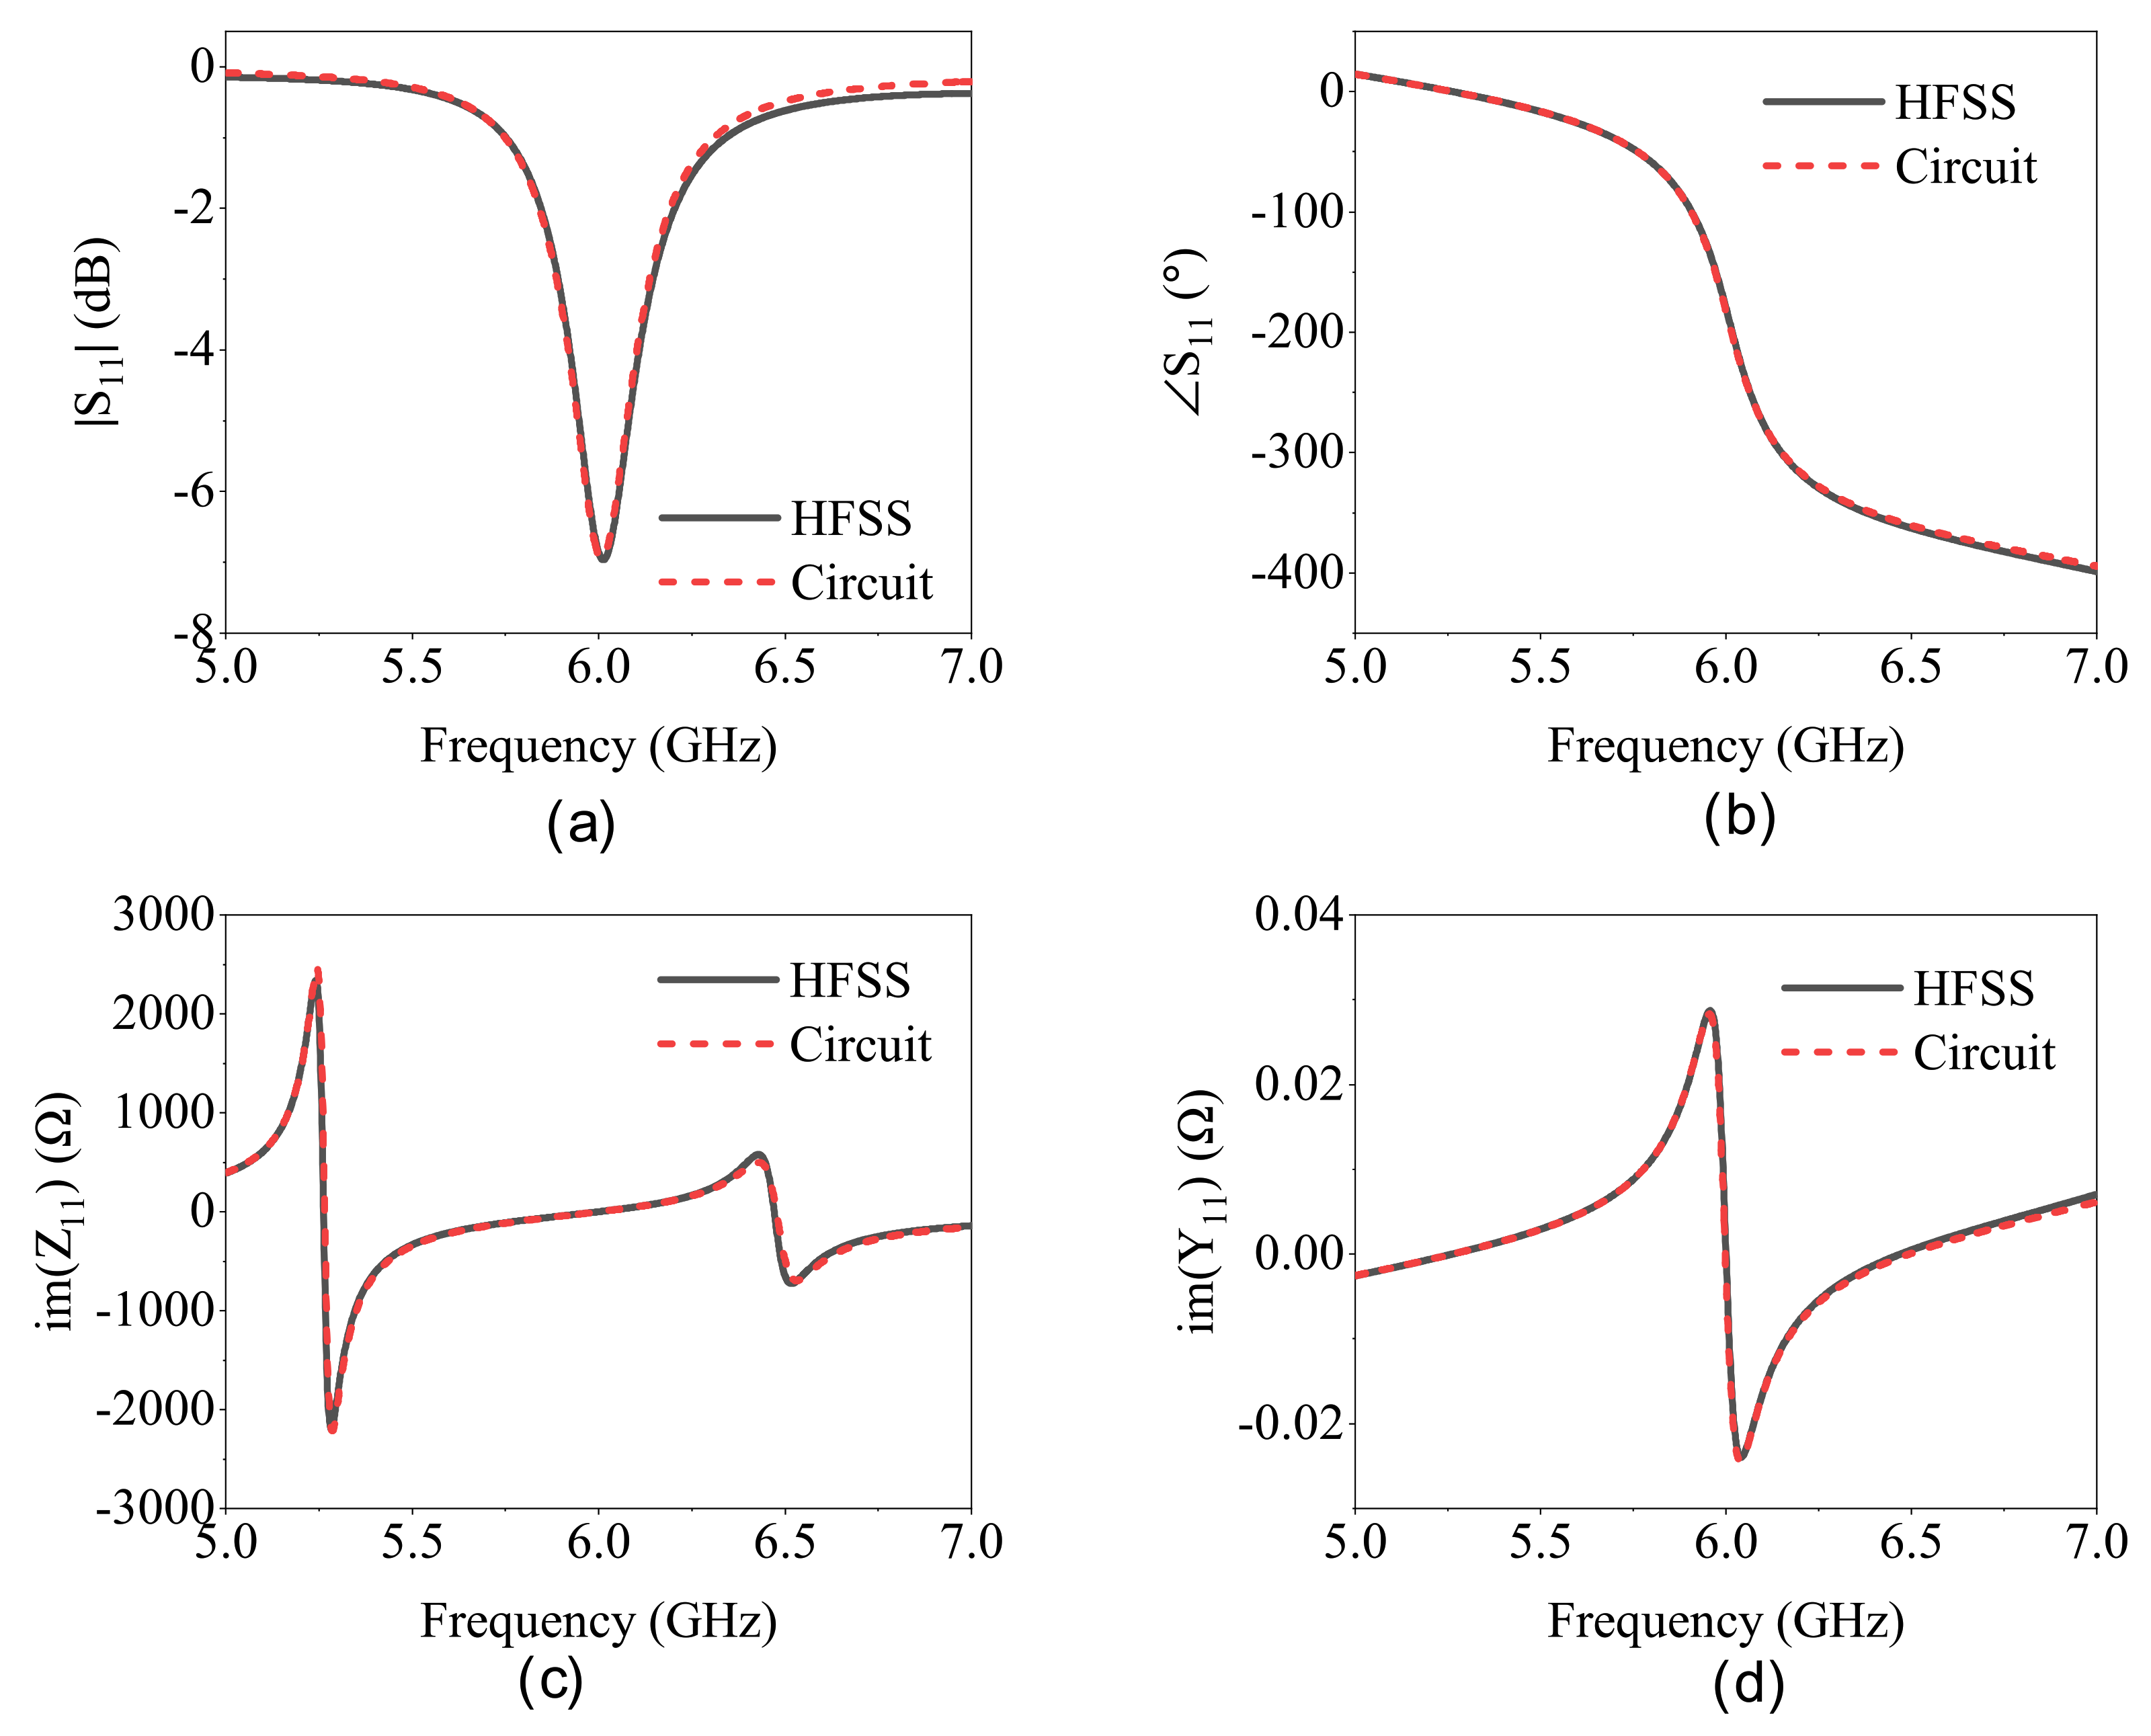
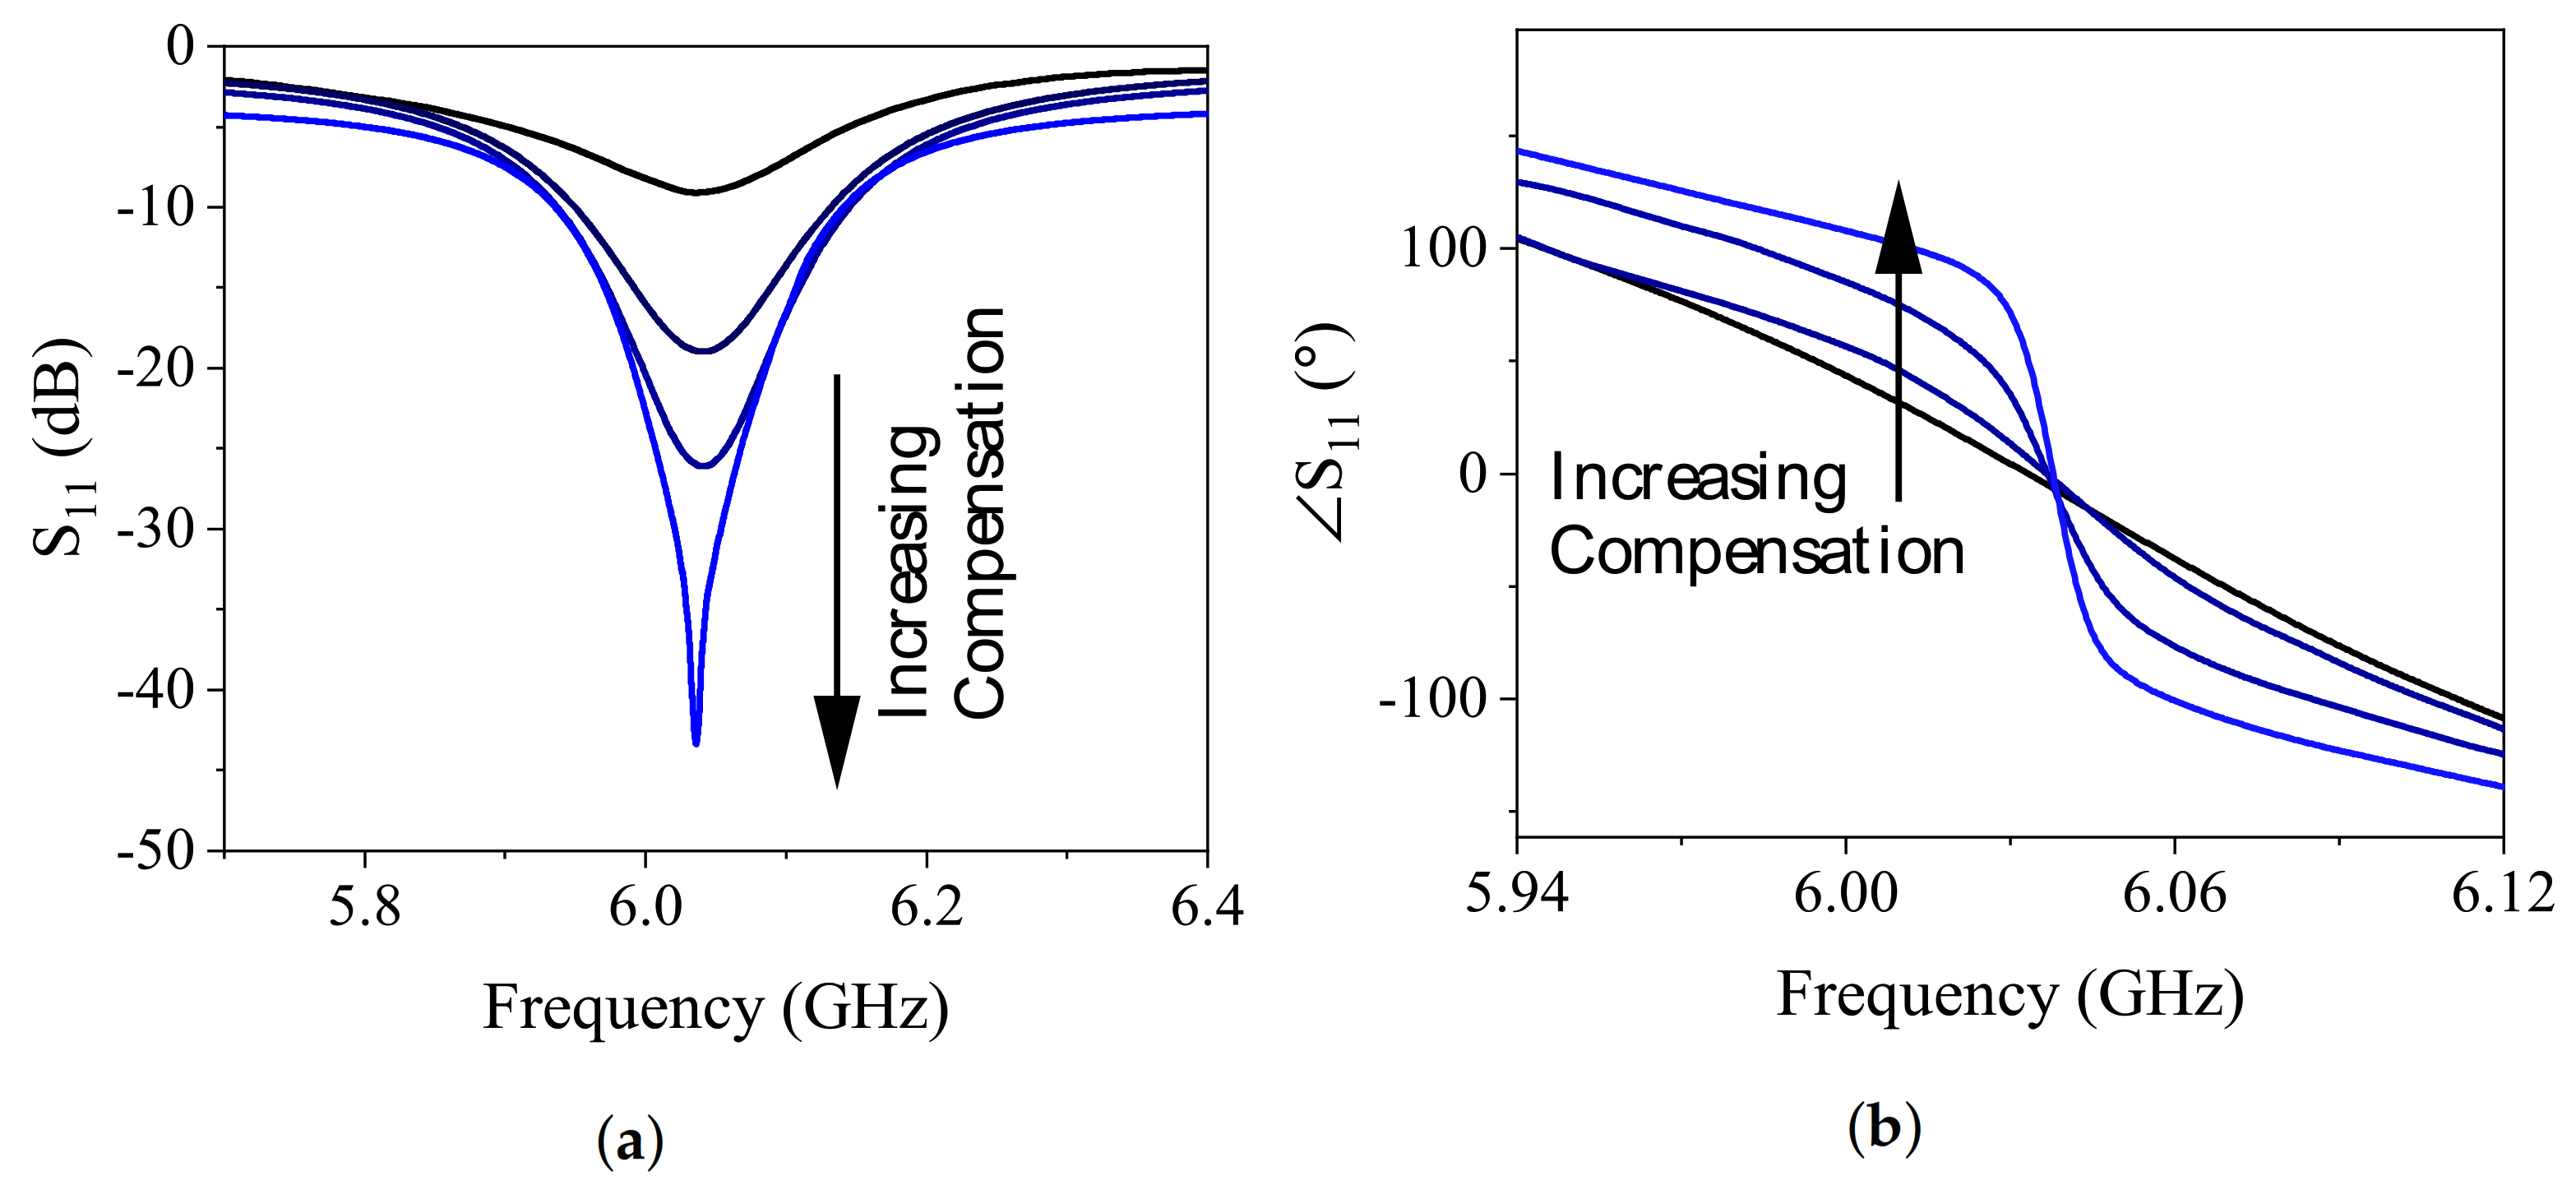
2. Sensor Design and Analysis

A CSRR was designed on Rogers 5880 substrates, with dielectric properties of ε r = 2.2, t a n δ = 0.0009, and thickness of 0.8 mm , which was the main sensing element of the reflective sensor. Its loss was modified using active circuitry on one end and it was interrogated from the other end. The choice of frequency for CSRR is tied to the dielectric properties of the loss of MUT that decreased with frequency. Thus, a relatively high value of 6 GHz was chosen, considering the fabrication tolerances of small size features. Moreover, to increase the sensitivity of the sensor, its loss was compensated with a negative resistance circuit using ATF34143 FET (Avago, San Jose, CA, USA), as shown in Figure 1. It should be noted that the sensor sensitivity will be intact as loss-compensation does not affect the frequency shifts of the sensor [2,39].
DC biasing of this PHEMT transistor uses feedback from drain to gate (through resistive division of R 1 / R 2 ) with a resistive source ( R 6 = R 7 ) to enable negative V g s = 0.63 V and ensuring I d = 25 mA, all with a single positive bias voltage of V i n = 6 V (see Table 1 for full details). According to Barkhausen criterion, oscillations at the gate node of the circuit are triggered as long as the reflections from either side follow:
| Γ i n | × | Γ o u t | > 1 .
However, partial compliance with this notion is enough for the circuit to compensate the losses occurred within CSRR using the negative resistance, wherein the circuit is not entering an oscillation mode. Loss compensation in the CSRR can be viewed as the level of restoring the lost power in the resonator at the frequency of resonance, that is directly modifying the depth of reflection. Therefore, the main goal of this study is to decrease the depth of S 11 notch, where the small capacitive/resistive variations brought about by the MUT are considerably distinguishable. To this end, the MOSFET’s stability was modified using a source degeneration inductor Ls, whose tuning resulted in increased reflection from the gate, also shown as | Γ i n | in Figure 1. This is elaborated in Figure 2a, where the reflection at ∼6 GHz improves when increasing the inductive degeneration at the source that reaches 2.28 at L s 10 nH. Once the magnitude of reflection becomes larger, the multiplication in Equation (1) also improves towards unity considering that the reflection from CSRR is typically low in resonance. Once the circuit reflection improves from ∼1 with no L s up to 128% with L s = 10 nH, the negative resistance initiated by this node also increases. The bias voltage importance in this regard also provides another electronically tunable level of loss compensation. Figure 2b illustrates that the level of compensation can be controlled with a positive bias voltage, which enables applications related to different lossy environments, suitable for a wider range of materials.
The electrical circuit model of the CSRR is elaborated in this section. Since the electrical size of the CSRR is small with respect to the guided wavelength, the structure can be described with equivalent lumped elements. In this model, the input transmission line from the measurement port is considered, which is loaded with the CSRR as half of the circuit. The other half is purely intended to provide negative resistance to compensate for the lost power, as shown in Figure 3a,b.
In this model, the resonant tank is represented by parallel R as resistance, L as inductance, and C as capacitance. This resonator was coupled capacitively to the single transmission line through the substrate, shown as capacitor C C . The resonator can potentially be loaded with an external MUT that is shown with capacitance C MUT and a lossy component R MUT . To extract the model parameters, full-wave simulations in HFSS are required. In a simpler view of the model, Z i n depends highly on Z res as the transmission line only shifts the phase of impedances according to its electrical length. Therefore, S-parameter measurement and analysis were conducted by de-embedding the transmission line length. Since there are four elements in the representation of Z res , four equations are required to accurately determine the constituent parameters. Ignoring R for simplicity, Z res can be reduced to
Z res = j L ( C + C C ) ω 2 1 C C ω ( 1 L C ω 2 )
which depicts two characteristic frequencies— f z , the frequency that nulls Z res , and f o , the frequency that nulls Y res = 1 / Z res —as follows:
f 0 = 1 2 π L C ,
f z = 1 2 π L ( C + C C ) .
These values can be verified from full-wave simulation results. At f z , the transmission line terminates at an open end due to the resonance, which coincides with the dip frequency of S 11 . Now, considering the impact of parallel resistance R on the depth of the reflection coefficient (see Figure 4a), it can be inferred from the equivalent impedance seen from Z res node at resonance frequency f z , where the imaginary part of Z res becomes zero and only the real part remains as:
S 11 ( f z ) = R C C / ( C + C C ) Z 0 R C C / ( C + C C ) + Z 0 .
This resistive impedance, seen from Z res node, impacts the depth of the resonance seen at f z . It becomes an ideally reflection-less resonance when the impedance Z res = Z 0 as the transmission line impedance. The last expression is obtained from the S 11 phase response at the frequency of resonance f o , wherein only R remains in series with C C with parallel L C resonance when viewed from the Z res node. This phase can be calculated as:
S 11 ( f 0 ) = t a n 1 2 R C C ω 1 + R 2 Z 0 2 ω 2 C C 2 .
The extracted parameters are given in the caption of Figure 3. Figure 4 represents the reflection coefficient S 11 in the magnitude (Figure 4a), phase (Figure 4b), imaginary part of impedance (Figure 4c), and admittance (Figure 4d) of the circuit model in the Advance Design System (ADS). At frequencies that cover the resonance, these coefficients are greatly congruent with the full-wave simulation in HFSS.
The simulation setup in HFSS consists of the etched ground, with dimensions listed in Table 1, loaded with a PTFE tubing that is flush with the surface of the sensor, as shown in Figure 5. The curved cylindrical shape of the tube limits its maximum interaction with the planar surface of the sensor. However, the loss-compensation scheme reinforces the electromagnetic fields around the CSRR that propagate into the tube with MUT inside [40,41,42]. The correct orientation of the tube with respect to the slots of CSRR has been demonstrated in previous works [43] to be parallel with the longest slot of the outer ring. This ensures the maximum electric field generated at the center of the slot to interact with the MUT. The magnitude of the electric field interaction with MUT is illustrated in Figure 5, which also shows that the highest fields (with red color) are present at the location of the tube. This configuration reveals the highest sensitivity, where the tube covers the longest slot. The plotting plane crossing the tube and MUT depicts | E | -fields emanating into the tube along the long slot.
Performance of the proposed sensor was evaluated using simulations of MUT with various dielectric properties inside the tube. In the first case, the losses in MUT were ignored and only permittivity was varied from 10 up to 80 with increments of 10 as well as ε r = 1 , as shown in Figure 6. It is clear that the resonance frequency, also known as f z in this analysis, reduces due to the added CMUT, as shown in Figure 3a. This behavior can also be expressed in terms of the resonance frequency change, assuming a generic planar sensor with substrate permittivity ε r sub = 1 , whose whole slots are covered by MUT with ε r MUT = 1 . Then, f z can be shown as [5]:
f z = 1 2 π L C C + C ε r sub + ε r MUT ε r sub + 1 .
This shows an inverse relationship between MUT permittivity and the resultant resonance frequency. For more clarity, it can be expressed in terms of sensitivity S as follows:
S = f f z 0 ε r MUT = 1 2 C C C ε r sub + 1 + C ε r sub + ε r MUT ,
where f z 0 represents the initial resonance frequency of ϵ MUT = 1. For small coupling between the feeding transmission line and the CSRR, where C C C , this can be simplified as:
S = 1 2 1 ε r sub + ε r MUT .
This equation shows that the sensitivity has an inverse relationship with the additional MUT permittivity and that it flattens out at values ε r MUT 10 ε r sub . This is the internal characteristic of planar CSRR, whose sensitivity is not as good at high permittivity variations. Therefore, another attempt was made to exploit the phase feature of the sensor. A comparative view of the resonance frequency of S 11 , also known as f z , with phase of S 11 extracted at f z corresponding to various MUTs is shown in Figure 7. It is obvious that the extraction of a closed form for phase is cumbersome compared to the resonance frequency. It showcases that the linearity of the frequency of resonance drops much quicker than that of the phase measured at the corresponding frequencies, as f z starts a shallow slope as soon as the MUT permittivity crosses ∼10, while phase holds higher linearity—though with slightly less sensitivity—up to a MUT permittivity value of ∼30. This improvement in the linearity helps achieve higher effective sensitivity at a broader dynamic range of MUT. Therefore, the purpose of this work is to delve into analyzing the phase response to resolve small deviations in MUT properties. Corresponding phase behavior of this simulation is also given in Figure 7.
Another exploration of the sensor response is on its behavior with respect to the loss of MUT. Figure 8 depicts the results for both magnitude and phase of S11 with MUT permittivity being constant as ε MUT = 10 , while the loss tangent tan( δ ) varies from 0 to 5 with increments of 1. It is noteworthy that loss in the MUT acts as a resistance R MUT parallel to the internal resistance of the sensor R, which mostly R MUT < R Z 0 due to the lossy nature of MUT. This results in a smaller equivalent resistance, which is closer to the line impedance Z 0 when viewed from Z res node, thus, better matching is achieved with deeper S 11 . This notion is captured in Figure 8, where lossy MUT is shown to increase the slope of phase response at the resonance frequency and the S 11 notch become deeper. Figure 9 depicts the performance comparison between the depth of S 11 and the phase of the reflection at initial resonance frequency of the passive mode. It turns out to follow the trend as discussed for permittivity measurements, where the phase response exhibits more linearity compared to the depth of S 11 with tan( δ ), ranging from 0 to the fairly high value of 5 vs. the nonlinear saturation mode occurring for S 11 depth starting around tan( δ ) = 2.

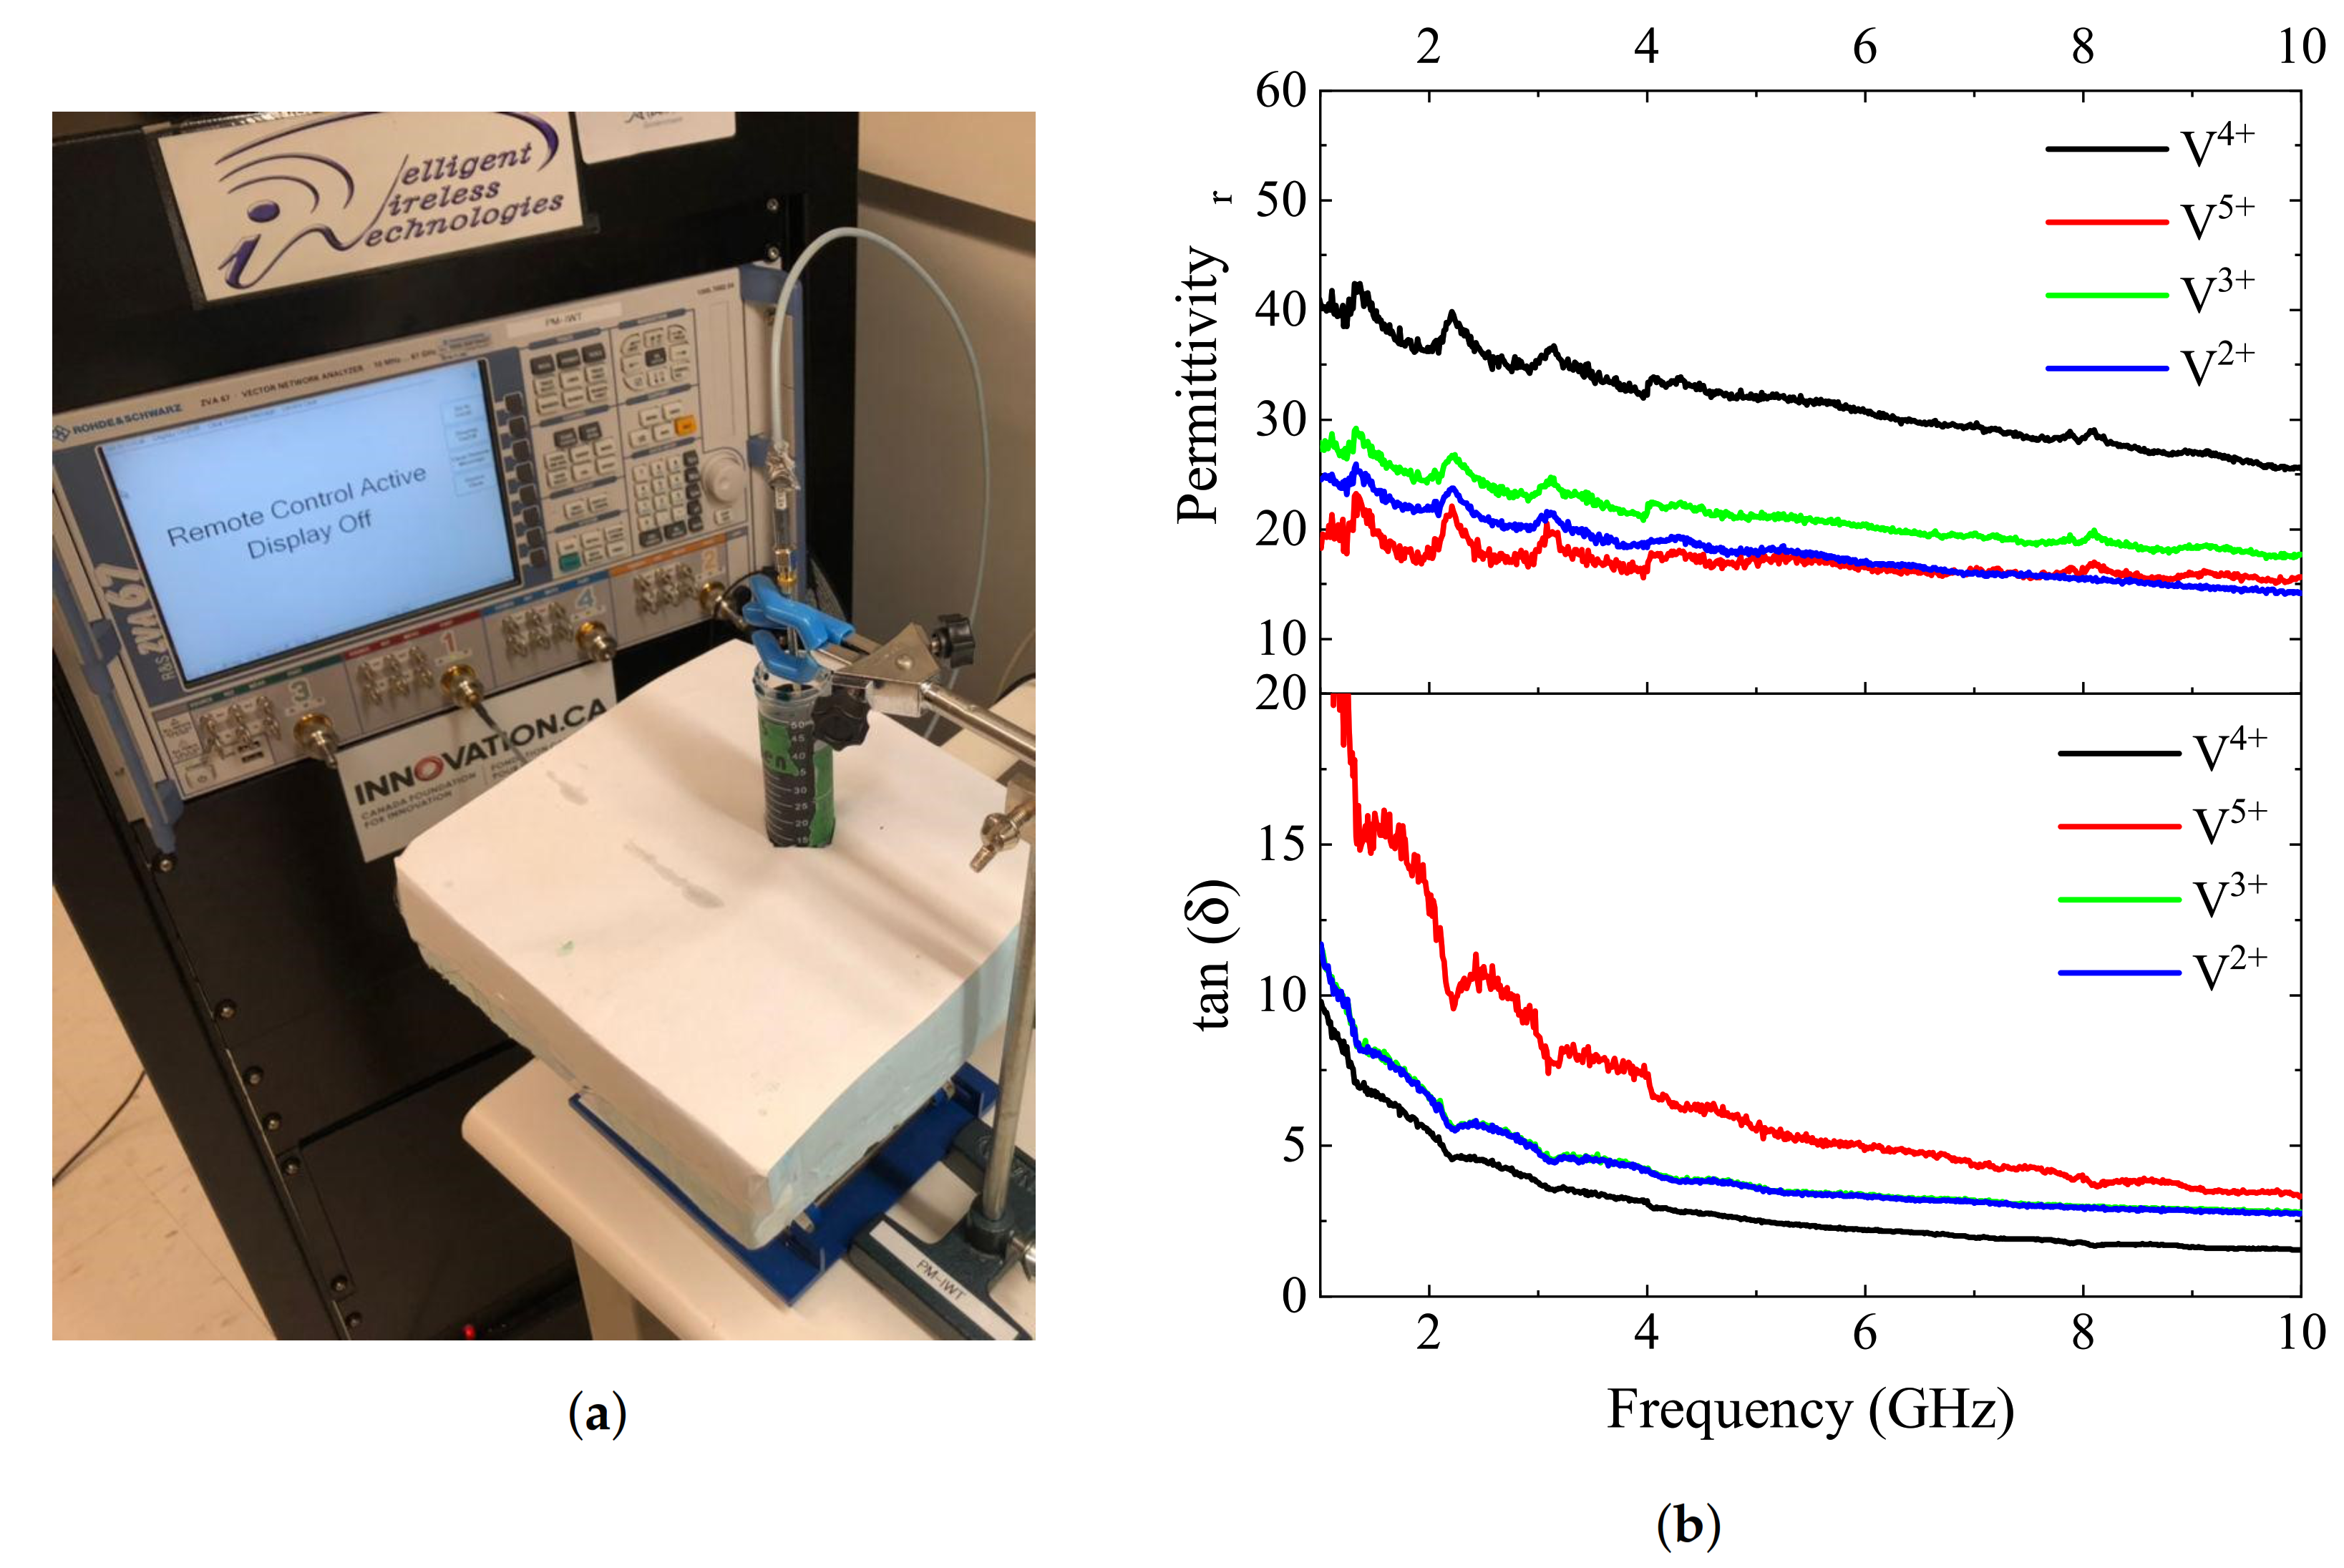
3. Vanadium Electrolyte (MUT)

A VRFB utilizes two soluble redox couples, allowing a fully liquid-state system to be created based on a single metal. These active materials are typically dissolved in an acidic electrolyte such as sulfuric acid, with a stabilization agent such as HCl or H3PO4 used to improve the vanadium ion’s solubility (and consequently the electrolyte’s energy density). The electrolyte was pumped from two reservoirs through a 2.5 k W , 40-cell stack at a nominal flow-rate of 3 L/min. A 5000 VA Quattro inverter (Victron Energy, Almere, Netherlands) was used to apply current during the charging process. A nominal current of 30 A was applied until a stack voltage of 62 V was reached. The stack was then charged under constant-voltage mode until the current reduced below 1 A. At the end of this process, V2+ and V5+ are present in the negative and positive reservoirs, respectively. Discharging was performed through a series of resistors (1.8 ohm constant), resulting in a maximum current of 45 A. Discharging was stopped after reaching a cutoff voltage of 30 V. Battery monitoring was performed using a multifunction I/O device USB-6211 (National Instruments, Austin, TX, USA). At the end of this discharging process, V2+ and V3+ are present in the negative and positive reservoirs, respectively.
During charging, the catholyte is converted from V4+ to V5+ Equation (2), while the anolyte is converted from V3+ to V2+ Equation (3) [5]:
V O ( a q ) 2 + + H 2 O ( l ) V O 2 ( a q ) + + 2 H ( a q ) + + e ,
V O ( a q ) 3 + + e V O ( a q ) 2 + .
In this work, the catholyte solution was studied in two extreme cases (fully-charged and -discharged) with microwave planar sensors to enable a noncontact sensing scheme.

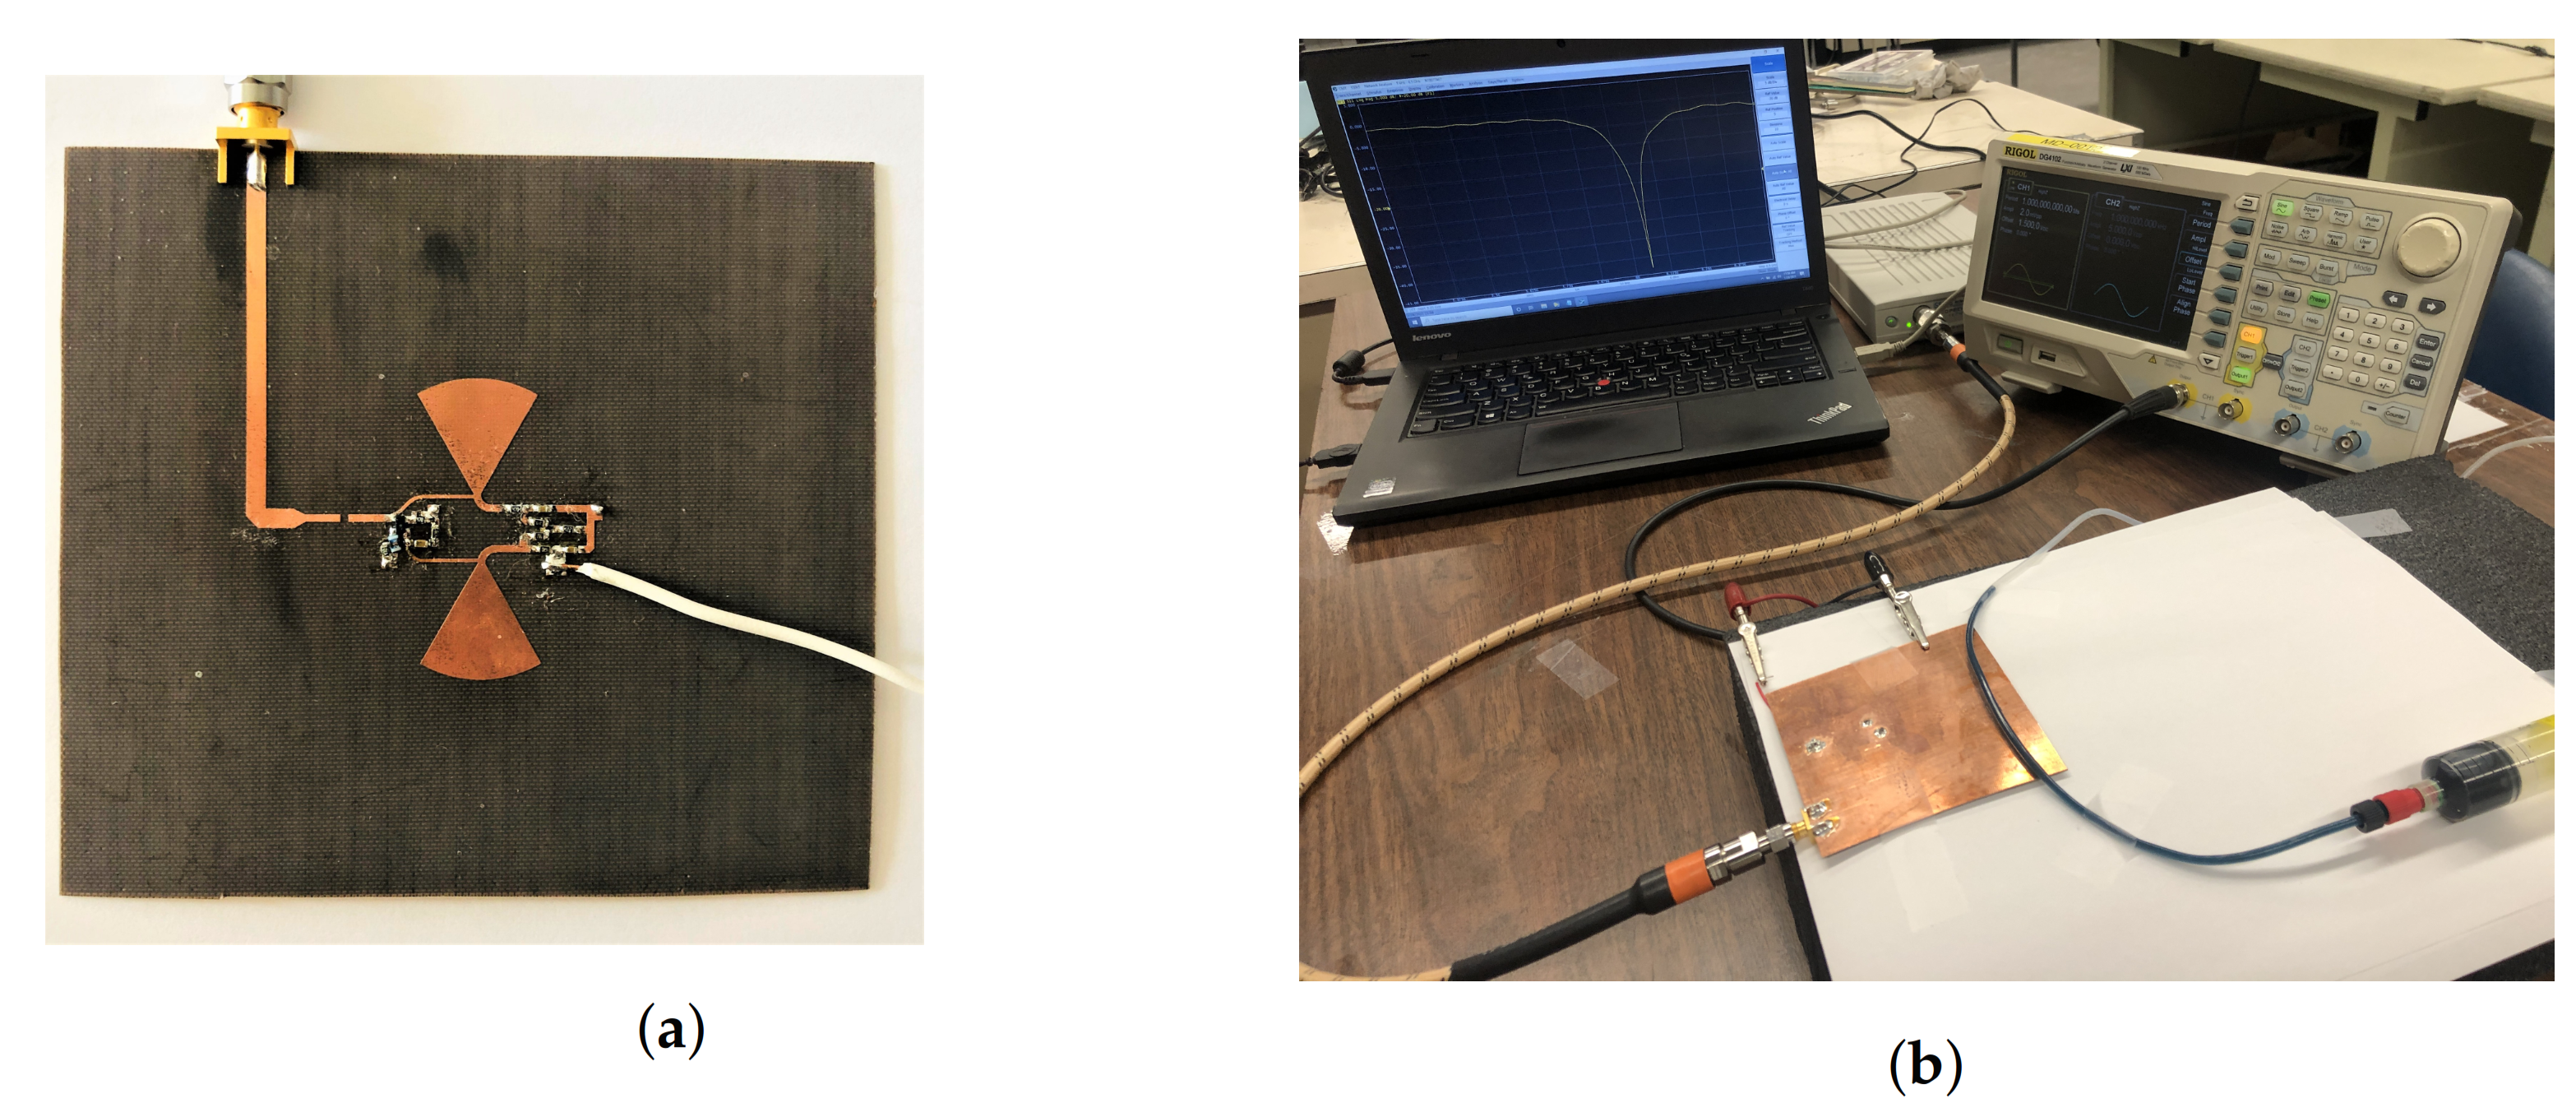
4. Measurement Results and Discussion

The proposed sensor was fabricated on Rogers 5880 substrates with dielectric properties of ε r = 2.2 , tan ( δ ) = 0.0009 , and thickness of 0.8 mm (see Figure 10). All transmission lines as well as the circuit elements are on the top side of the substrate, while the CSRR is etched out of the ground plane on the other side. Radial stubs terminating at high-impedance transmission lines comprise RF chokes. CSRR was fed with narrow transmission lines to reduce the coupling and achieve a high-quality-factor resonance.
Dielectric properties of vanadium electrolytes were measured using the standard dielectric probe setup shown in Figure 11a,b for states of both charged and discharged solutions V2+, 3+, 4+, 5+ within a frequency range of 1–10 GHz. Loss tangent information reveals the level of loss in these solutions merely due to the high concentrations of ions, and it is clear that the permittivity as well as the loss tangent values differ between V4+ and V5+ more significantly than those of V2+ and V3+. This broadness in the permittivity range implies better sensitivity when monitoring the solution containing V4+/V5+ with a microwave sensor.
The sensor’s reflection parameter was studied by applying voltage to the input with no MUT present, and the depth of S 11 increased at higher voltages, as shown in Figure 12a. In addition, the slope of the phase response, shown in Figure 12b, becomes steeper along loss-compensation, translating to an improved quality factor. This also proves the impact of negative resistance on the sensor’s energy restoration. The impact of loss compensation on the resolution can be verified by examining the quality factor of the sensor. The sharper the resonance profile, the lower the concentration change that can be inferred since the reflection profiles are more distinct. The 3-dB bandwidth of the sensor, as well as the depth of S 11 , were computed at different conditions of passive and various loss-compensation modes (i.e., denoted by V i n = 2, 4, and 6 V), as shown in Table 2. The 3-dB bandwidth was calculated with respect to the frequency span at 3-dB above the notch depth, and it is useful to assess the sharpness of the reflection curves. The lower the bandwidth, the more distinct the profile becomes, helping to sense small changes. It is evident that the higher compensation level reduces both the reflection depth and its 3-dB bandwidth almost 48 times compared with the passive condition. To assess the sensor’s performance, the following sections provide measurement results with respect to common liquids as well as the vanadium redox solution.

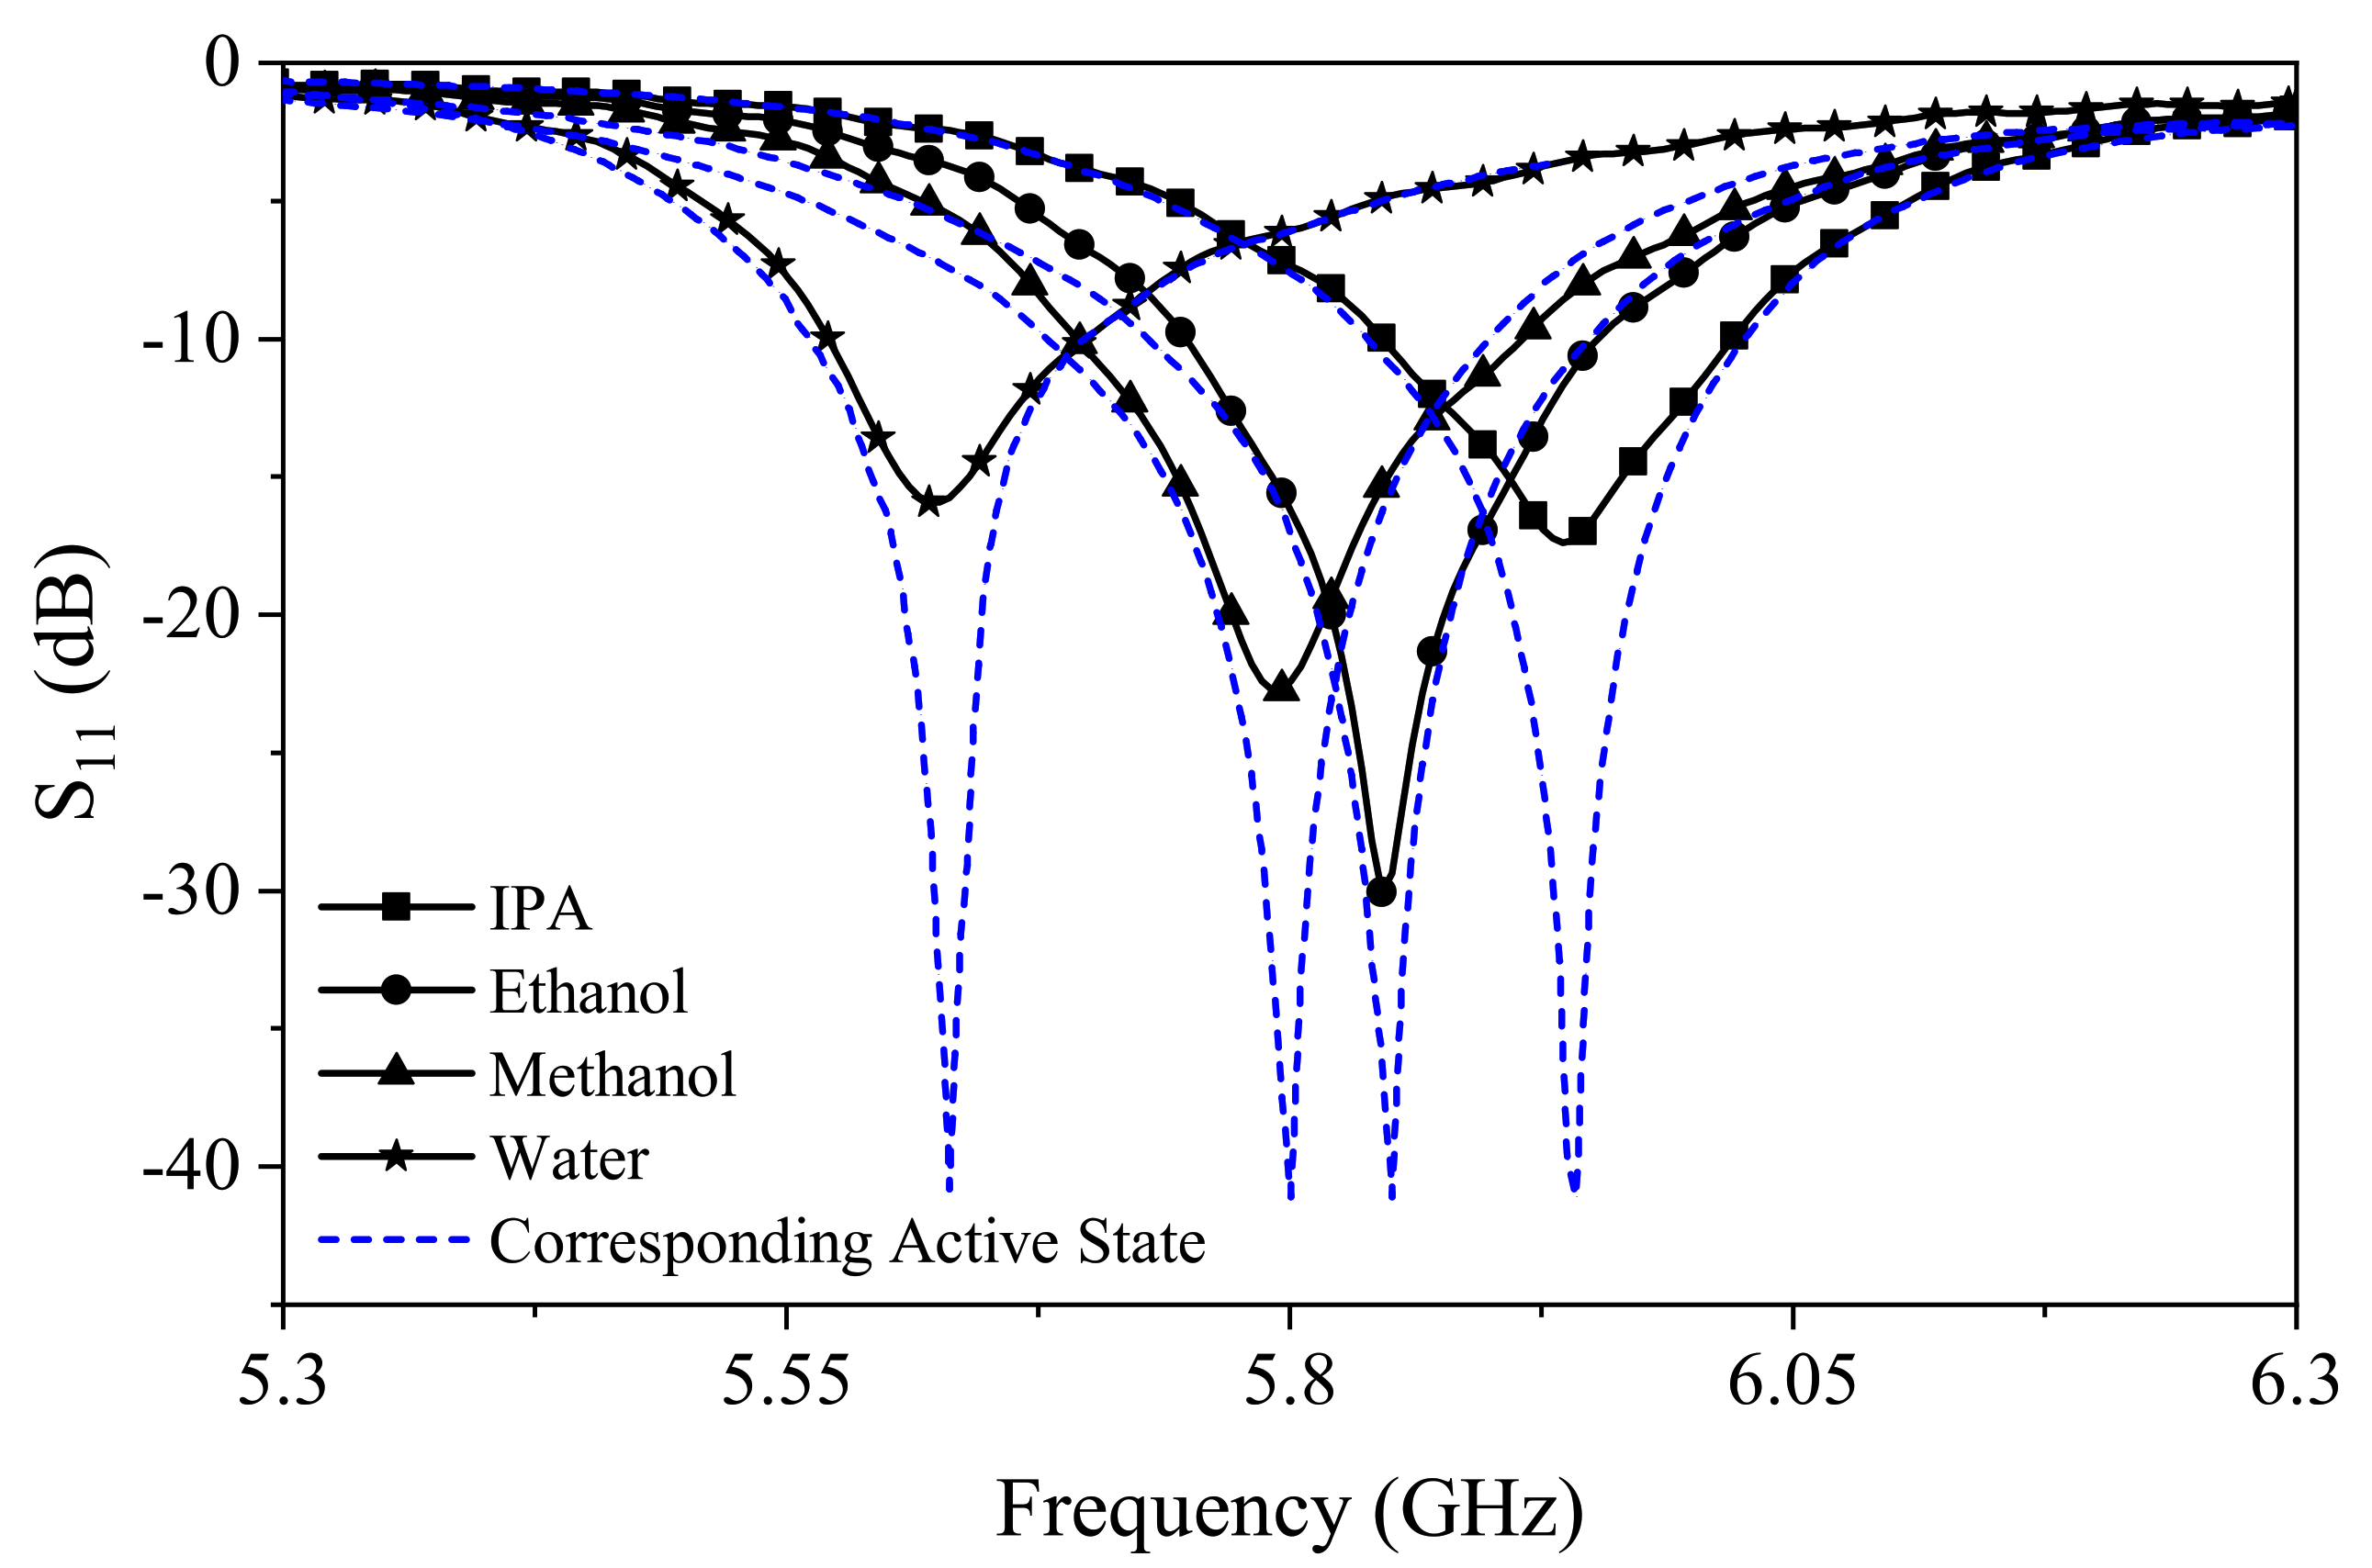
4.1. Common Liquid Measurement

To evaluate the sensor’s response, common liquids including IPA, ethanol, methanol, and water were prepared. The sensor was measured using S5065 VNA (Copper Mountain). The MUT was passed through a PTFE tubing that was secured to the sensor to ensure repeatability and reliability, as shown in Figure 10b. All liquids were injected individually, and the tube was purged with water after each measurement to remove leftover chemicals.
Figure 13 presents the reflection from the sensor under two conditions: when the negative resistance is not triggered (solid black line), and when the negative resistance is employed to compensate the loss (dashed blue line). In each MUT test, a specific bias voltage (refer to Figure 2b) was applied to deepen the S 11 profile, depending on the dielectric property of each sample. The results show that the proposed design, when filled with an MUT, is not only able to restore the original S 11 depth before filling, but also to improve the depth arbitrarily. It is clear that the sensor shows high performance when retrieving the resonance condition for lossy environments (e.g., IPA and water) from S 11 15 dB down to ∼40 dB. Having said that, the frequency of resonance at each measurement was not impacted by the negative resistance, which suggests no adverse loading impact of the circuit on the resonator. This way, one can utilize the sensor at various conditions with substantially increased resolution to recognize minute frequency/amplitude variations.

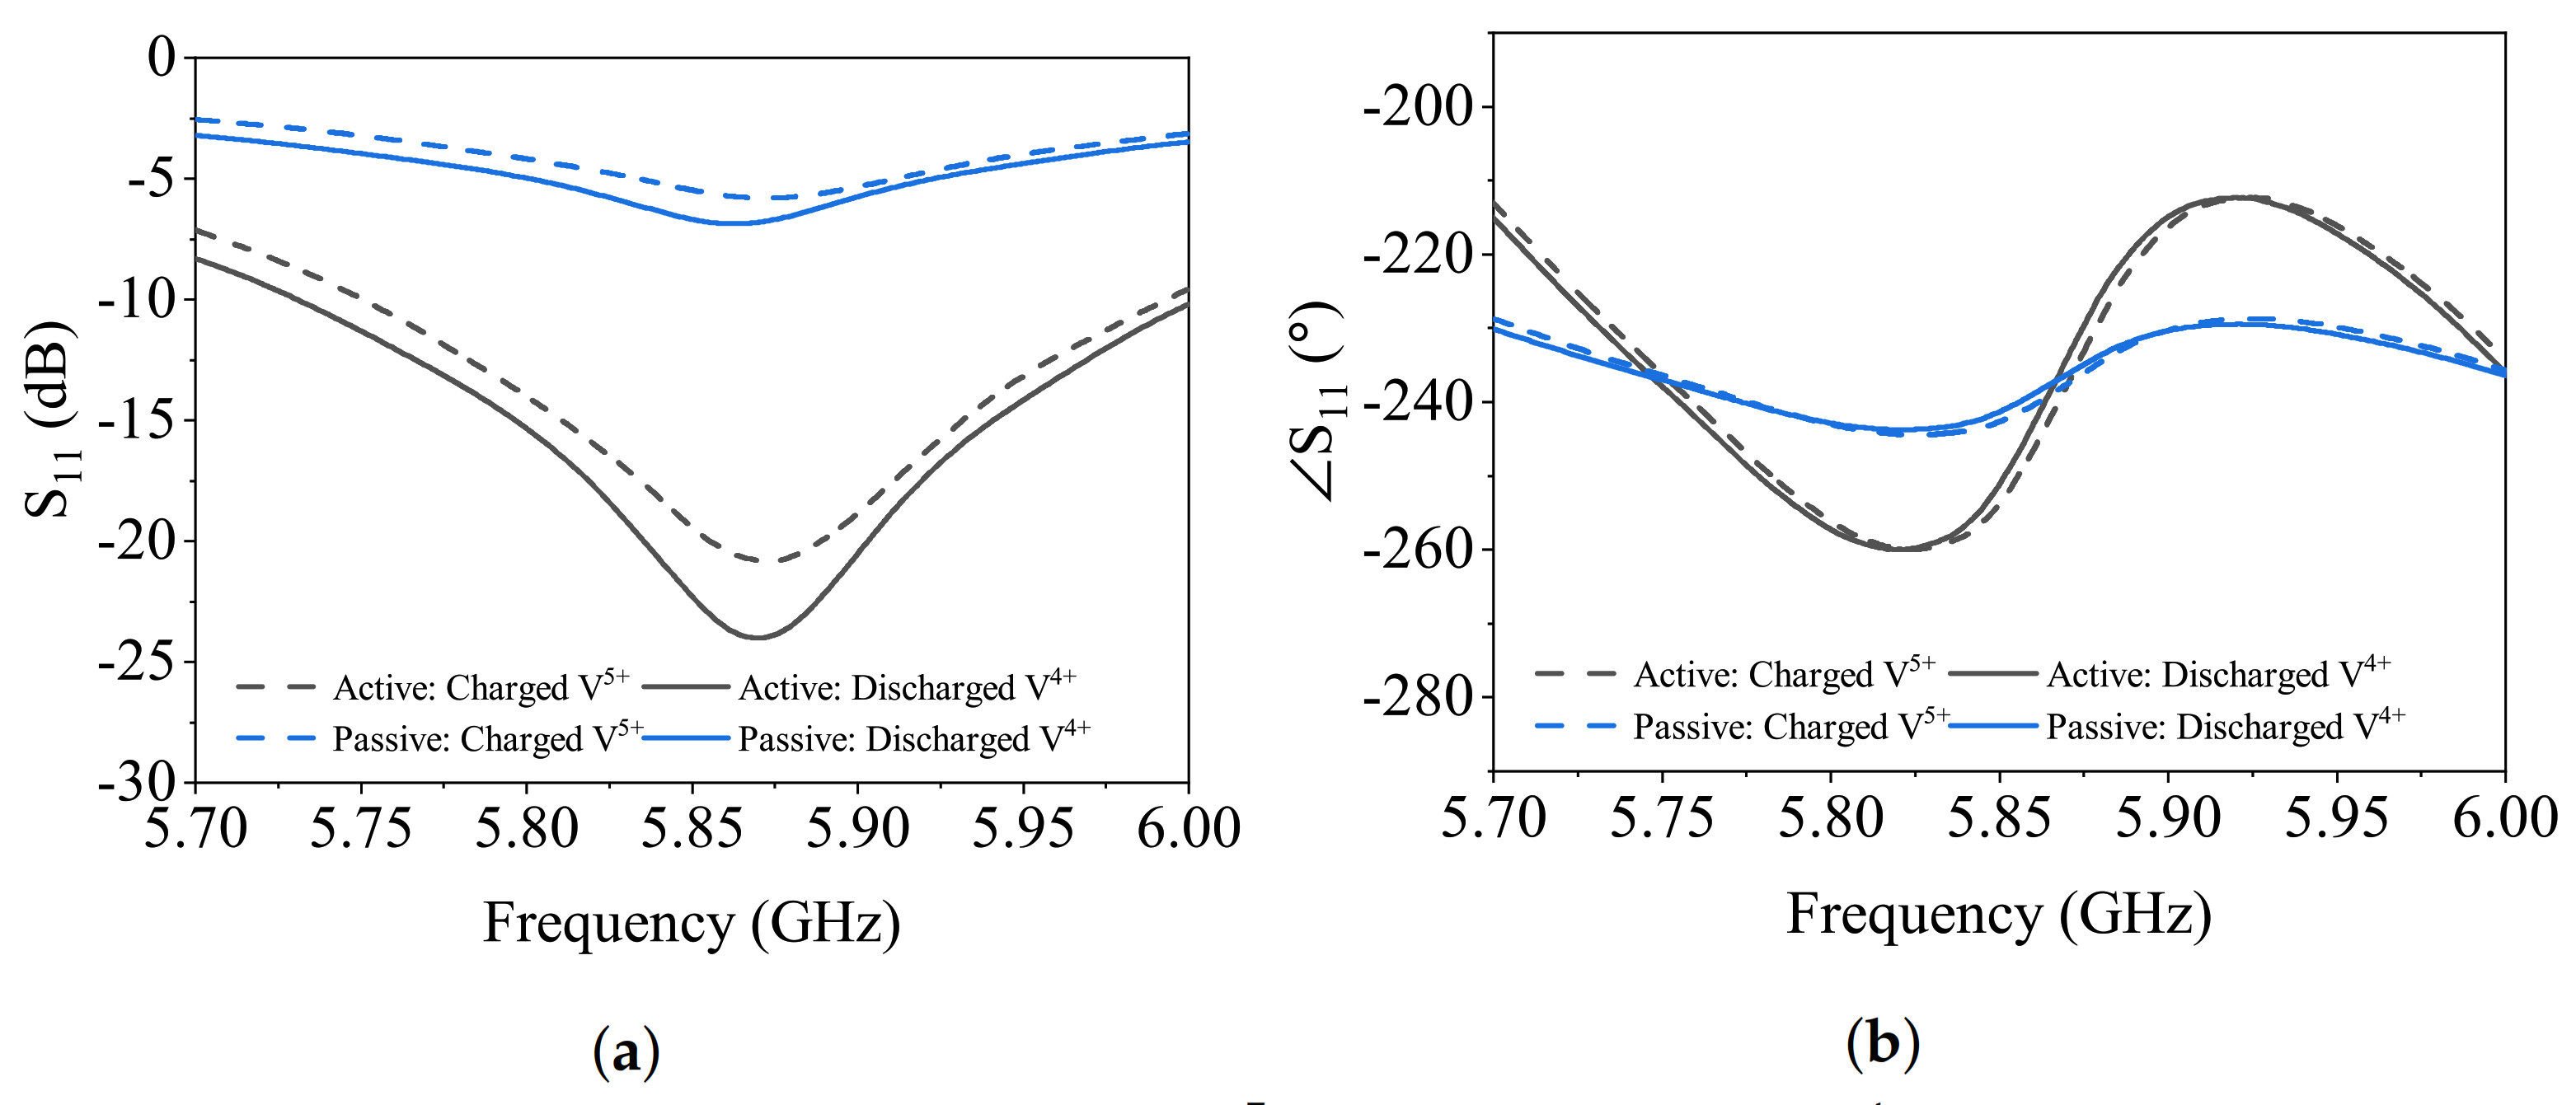
4.2. Measuring Vanadium Redox Solutions

Once the sensor was evaluated with common chemicals, the vanadium redox liquids were exposed to the sensor with the same tubing configuration and injection procedure. Two extreme cases of vanadium redox liquids include positively charged and discharged solutions. Based on the dielectric properties of these solutions measured with a dielectric probe at 6 GHz, the charged solution V 5 + is characterized with ε r = 17 j 85 , while the discharged solution V 4 + is measured ε r = 30 j 66 . Although their permittivity values are considerably different, the magnitude of loss in either state of Vanadium redox process is high enough to overshadow the permittivity that prevents the regular mode of sensor operation from distinguishing them. Therefore, negative resistance was activated to enhance the sensor dynamic range. Figure 14 showcases the difference in S 11 profile for the two liquids, which is in agreement with their dielectric permittivity. The charged solution lowers the resonance frequency more because of its higher permittivity (30 vs. 17 of discharged).In both cases of amplitude and phase of reflection, the active sensor reveals more distinct graphs, even though the sensitivity is intact.

5. Conclusions

In this work, a complementary split ring resonator is used as the planar microwave sensing element for material characterization. However, its application in a lossy environment of vanadium electrolyte solutions urged feeding this element with a negative resistance circuit to restore the lost power and compensate the loading impact from the lossy MUT. For this reason, the CSRR at 6 GHz is accompanied with a source-degenerated PHEMT. Its performance has been verified using various common chemicals including IPA, ethanol, methanol, and water. The sensor has shown considerable discrimination power for the highly lossy ion-based vanadium redox solution between the two states of fully discharged and fully charged. This sensor property is promising for its application in monitoring the state of charge in the harsh environment of vanadium electrolyte. The next step toward the operational deployment of the sensor will be a detailed examination of its discrimination ability for intermediate levels of VRFB charge.

Author Contributions

Conceptualization, P.M. and N.K.; methodology, N.K.; validation, K.S. and N.K.; formal analysis, N.K. and K.S.; resources, K.S.; writing—original draft preparation, N.K. and K.S.; writing—review and editing, P.M.; visualization, N.K.; supervision, P.M.; funding acquisition, P.M. All authors have read and agreed to the published version of the manuscript.

Funding

This work has been supported in part by the Natural Science and Engineering Research Council (NSERC) of Canada, the Future Energy System (FES), Alberta Innovates Bitumen Beyond Combustion program, and CMC Microsystems.

Institutional Review Board Statement

Not applicable.

Informed Consent Statement

Not applicable.

Data Availability Statement

The data are not publicly available due to data privacy restrictions.

Acknowledgments

The authors would like to thank Mohammad Abdolrazzaghi for constructive discussions. Rogers Corp. is highly appreciated for their generous donations in substrates.

Conflicts of Interest

The authors declare no conflict of interest.

References

  1. Abdolrazzaghi, M.; Daneshmand, M.; Iyer, A.K. Strongly Enhanced Sensitivity in Planar Microwave Sensors Based on Metamaterial Coupling. IEEE Trans. Microw. Theory Tech. 2018, 66, 1843–1855. [Google Scholar] [CrossRef] [Green Version]
  2. Abdolrazzaghi, M.; Daneshmand, M. Exploiting Sensitivity Enhancement in Micro-wave Planar Sensors Using Intermodulation Products With Phase Noise Analysis. IEEE Trans. Circ. Syst. I Regul. Pap. 2020, 67, 4382–4395. [Google Scholar] [CrossRef]
  3. Abdolrazzaghi, M.; Kazemi, N.; Daneshmand, M. An SIW Oscillator for Microfluidic Lossy Medium Characterization. In Proceedings of the 2020 IEEE/MTT-S International Microwave Symposium (IMS), Los Angeles, CA, USA, 4–6 August 2020; pp. 221–224. [Google Scholar] [CrossRef]
  4. Abdolrazzaghi, M.; Kazemi, N.; Daneshmand, M. Sensitive spectroscopy using DSRR array and Linvill negative impedance. In Proceedings of the 2019 IEEE MTT-S International Microwave Symposium (IMS), Boston, MA, USA, 2–7 June 2019; pp. 1080–1083. [Google Scholar]
  5. Su, L.; Muñoz-Enano, J.; Vélez, P.; Gil-Barba, M.; Casacuberta, P.; Martin, F. Highly Sensitive Reflective-Mode Phase-Variation Permittivity Sensor Based on a Coplanar Waveguide Terminated With an Open Complementary Split Ring Resonator (OCSRR). IEEE Access 2021, 9, 27928–27944. [Google Scholar] [CrossRef]
  6. Vélez, P.; Munoz-Enano, J.; Grenier, K.; Mata-Contreras, J.; Dubuc, D.; Martín, F. Split ring resonator-based microwave fluidic sensors for electrolyte concentration measurements. IEEE Sens. J. 2018, 19, 2562–2569. [Google Scholar] [CrossRef]
  7. Albishi, A.M.; El Badawe, M.K.; Nayyeri, V.; Ramahi, O.M. Enhancing the sensitivity of dielectric sensors with multiple coupled complementary split-ring resonators. IEEE Trans. Microw. Theory Tech. 2020, 68, 4340–4347. [Google Scholar] [CrossRef]
  8. Mosavirik, T.; Soleimani, M.; Nayyeri, V.; Mirjahanmardi, S.H.; Ramahi, O.M. Permittivity Characterization of Dispersive Materials Using Power Measurements. IEEE Trans. Instrum. Meas. 2021. [Google Scholar] [CrossRef]
  9. Albishi, A.M.; Mirjahanmardi, S.H.; Ali, A.M.; Nayyeri, V.; Wasly, S.M.; Ramahi, O.M. Intelligent sensing using multiple sensors for material characterization. Sensors 2019, 19, 4766. [Google Scholar] [CrossRef] [PubMed] [Green Version]
  10. Yeo, J.; Lee, J.I. High-sensitivity microwave sensor based on an interdigital-capacitor-shaped defected ground structure for permittivity characterization. Sensors 2019, 19, 498. [Google Scholar] [CrossRef] [PubMed] [Green Version]
  11. Martín, F.; Vélez, P.; Gil, M. Microwave Sensors Based on Resonant Elements. Sensors 2020, 20, 3375. [Google Scholar] [CrossRef] [PubMed]
  12. Alahnomi, R.A.; Zakaria, Z.; Yussof, Z.M.; Althuwayb, A.A.; Alhegazi, A.; Alsariera, H.; Rahman, N.A. Review of Recent Microwave Planar Resonator-Based Sensors: Techniques of Complex Permittivity Extraction, Applications, Open Challenges and Future Research Directions. Sensors 2021, 21, 2267. [Google Scholar] [CrossRef]
  13. Muñoz-Enano, J.; Coromina, J.; Vélez, P.; Su, L.; Gil, M.; Casacuberta, P.; Martín, F. Planar Phase-Variation Microwave Sensors for Material Characterization: A Review and Comparison of Various Approaches. Sensors 2021, 21, 1542. [Google Scholar] [CrossRef]
  14. Ebrahimi, A.; Tovar-Lopez, F.J.; Scott, J.; Ghorbani, K. Differential microwave sensor for characterization of glycerol–water solutions. Sens. Actuators B Chem. 2020, 321, 128561. [Google Scholar] [CrossRef]
  15. Muñoz-Enano, J.; Vélez, P.; Gil, M.; Martín, F. Microfluidic reflective-mode differential sensor based on open split ring resonators (OSRRs). Int. J. Microw. Wirel. Technol. 2020, 12, 588–597. [Google Scholar] [CrossRef]
  16. Ebrahimi, A.; Scott, J.; Ghorbani, K. Microwave reflective biosensor for glucose level detection in aqueous solutions. Sens. Actuators A Phys. 2020, 301, 111662. [Google Scholar] [CrossRef]
  17. Ebrahimi, A.; Scott, J.; Ghorbani, K. Dual-mode resonator for simultaneous permittivity and thickness measurement of dielectrics. IEEE Sens. J. 2019, 20, 185–192. [Google Scholar] [CrossRef]
  18. Su, L.; Mata-Contreras, J.; Vélez, P.; Martín, F. Splitter/combiner microstrip sections loaded with pairs of complementary split ring resonators (CSRRs): Modeling and optimization for differential sensing applications. IEEE Trans. Microw. Theory Tech. 2016, 64, 4362–4370. [Google Scholar] [CrossRef]
  19. Baghelani, M.; Abbasi, Z.; Daneshmand, M.; Light, P.E. Non-invasive continuous-time glucose monitoring system using a chipless printable sensor based on split ring microwave resonators. Sci. Rep. 2020, 10, 1–15. [Google Scholar]
  20. Abbasi, Z.; Niazi, H.; Abdolrazzaghi, M.; Chen, W.; Daneshmand, M. Monitoring pH level using high-resolution microwave sensor for mitigation of stress corrosion cracking in steel pipelines. IEEE Sens. J. 2020, 20, 7033–7043. [Google Scholar] [CrossRef]
  21. Baghelani, M.; Abbasi, Z.; Daneshmand, M. Noncontact high sensitivity chipless tag microwave resonator for bitumen concentration measurement at high temperatures. Fuel 2020, 265, 116916. [Google Scholar] [CrossRef]
  22. Hosseini, N.; Baghelani, M. Selective Real-Time Non-Contact Multi-Variable Water-Alcohol-Sugar Concentration Analysis during Fermentation Process using Microwave Split-Ring Resonator Based Sensor. Sens. Actuators A Phys. 2021, 325, 112695. [Google Scholar] [CrossRef]
  23. Yaroshenko, I.; Kirsanov, D.; Marjanovic, M.; Lieberzeit, P.A.; Korostynska, O.; Mason, A.; Frau, I.; Legin, A. Real-time wáter quality monitoring with chemical sensors. Sensors 2020, 20, 3432. [Google Scholar] [CrossRef] [PubMed]
  24. Singh, S.K.; Tiwari, N.K.; Yadav, A.K.; Akhtar, M.J.; Kar, K.K. Design of ZnO/N-doped graphene nanohybrid incorporated RF complementary split ring resonator sensor for ammonia gas detection. IEEE Sens. J. 2019, 19, 7968–7975. [Google Scholar] [CrossRef]
  25. Abdolrazzaghi, M.; Daneshmand, M. Multifunctional ultrahigh sensitive microwave planar sensor to monitor mechanical Motion: Rotation, displacement and Stretch. Sensors 2020, 20, 1184. [Google Scholar] [CrossRef] [PubMed] [Green Version]
  26. Kazemi, N.; Abdolrazzaghi, M.; Musilek, P.; Daneshmand, M. A Temperature-Compensated High-Resolution Microwave Sensor Using Artificial Neural Network. IEEE Microw. Wirel. Components Lett. 2020, 30, 919–922. [Google Scholar] [CrossRef]
  27. Abdolrazzaghi, M.; Kazemi, N.; Daneshmand, M. Machine Learning to Immune Microwave Sensors from Temperature Impact. In Proceedings of the 2020 IEEE International Symposium on Antennas and Propagation and North American Radio Science Meeting, Montréal, QC, Canada, 5–10 July 2020; pp. 843–844. [Google Scholar]
  28. Cui, Y.; Ge, A. A Tunable High-Q Microwave Detector for On-Column Capillary Liquid Chromatography. IEEE Trans. Instrum. Meas. 2020, 69, 5978–5980. [Google Scholar] [CrossRef]
  29. Fan, L.C.; Zhao, W.S.; Gan, H.Y.; He, L.; Liu, Q.; Dong, L.; Wang, G. A high-Q active substrate integrated waveguide based sensor for fully characterizing magneto-dielectric (MD) materials. Sens. Actuators A Phys. 2020, 301, 111778. [Google Scholar] [CrossRef]
  30. Chen, Z.; Hong, W.; Chen, J. High-Q planar active resonator based on substrate integrated waveguide technique. Electron. Lett. 2012, 48, 575–577. [Google Scholar] [CrossRef]
  31. Skyllas-Kazacos, M.; Kazacos, M. State of charge monitoring methods for vanadium redox flow battery control. J. Power Sources 2011, 196, 8822–8827. [Google Scholar] [CrossRef]
  32. Sum, E.; Skyllas-Kazacos, M. A study of the V (II)/V (III) redox couple for redox flow cell applications. J. Power Sources 1985, 15, 179–190. [Google Scholar] [CrossRef]
  33. Sum, E.; Rychcik, M.; Skyllas-Kazacos, M. Investigation of the V (V)/V (IV) system for use in the positive half-cell of a redox battery. J. Power Sources 1985, 16. [Google Scholar] [CrossRef]
  34. Ngamsai, K.; Arpornwichanop, A. Measuring the state of charge of the electrolyte solution in a vanadium redox flow battery using a four-pole cell device. J. Power Sources 2015, 298, 150–157. [Google Scholar] [CrossRef]
  35. Tang, Z.; Aaron, D.S.; Papandrew, A.B.; Zawodzinski, T.A. Monitoring the state of charge of operating vanadium redox flow batteries. ECS Trans. 2012, 41, 1. [Google Scholar] [CrossRef]
  36. Shin, K.H.; Jin, C.S.; So, J.Y.; Park, S.K.; Kim, D.H.; Yeon, S.H. Real-time monitoring of the state of charge (SOC) in vanadium redox-flow batteries using UV–Vis spectroscopy in operando mode. J. Energy Storage 2020, 27, 101066. [Google Scholar] [CrossRef]
  37. Snihir, I.; Rey, W.; Verbitskiy, E.; Belfadhel-Ayeb, A.; Notten, P.H. Battery open-circuit voltage estimation by a method of statistical analysis. J. Power Sources 2006, 159, 1484–1487. [Google Scholar] [CrossRef] [Green Version]
  38. Ressel, S.; Bill, F.; Holtz, L.; Janshen, N.; Chica, A.; Flower, T.; Weidlich, C.; Struckmann, T. State of charge monitoring of vanadium redox flow batteries using half cell potentials and electrolyte density. J. Power Sources 2018, 378, 776–783. [Google Scholar] [CrossRef]
  39. Zarifi, M.H.; Daneshmand, M. Monitoring solid particle deposition in lossy medium using planar resonator sensor. IEEE Sens. J. 2017, 17, 7981–7989. [Google Scholar] [CrossRef]
  40. Zarifi, M.H.; Wiltshire, B.; Mahdi, N.; Kar, P.; Shankar, K.; Daneshmand, M. Ultraviolet sensing using a TiO2 nanotube integrated high resolution planar microwave resonator device. Nanoscale 2018, 10, 4882–4889. [Google Scholar] [CrossRef]
  41. Zarifi, M.H.; Daneshmand, M. High-resolution RFID liquid sensing using a chipless tag. IEEE Microw. Wirel. Components Lett. 2017, 27, 311–313. [Google Scholar] [CrossRef]
  42. Zarifi, M.H.; Shariaty, P.; Hashisho, Z.; Daneshmand, M. A non-contact microwave sensor for monitoring the interaction of zeolite 13X with CO2 and CH4 in gaseous streams. Sens. Actuators B Chem. 2017, 238, 1240–1247. [Google Scholar] [CrossRef]
  43. Sharafadinzadeh, N.; Abdolrazzaghi, M.; Daneshmand, M. Investigation on planar microwave sensors with enhanced sensitivity from microfluidic integration. Sens. Actuators A Phys. 2020, 301, 111752. [Google Scholar] [CrossRef]
Figure 1. Schematic of the reflective sensor.
Sensors 21 03759 g001
Figure 2. (a) Impact of inductive generation on Γ i n . (b) Bias voltage on Γ i n
Sensors 21 03759 g002
Figure 3. (a) Circuit model with extracted parameters as L = 0.59 nH, C = 1.037 pF, CC = 0.18 pF, and R = 1.47 kΩ. (b) CSRR interrogation.
Sensors 21 03759 g003
Figure 4. Comparison between full-wave simulations of CSRR and its circuit model in (a) S 11 , (b) S 11 , (c) im Z 11 , and (d) im Y 11 .
Sensors 21 03759 g004
Figure 5. Simulation setup in HFSS with E field demonstration on the surface of the CSRR as well as the cross-section of MUTs above it.
Sensors 21 03759 g005
Figure 6. (a) Phase and (b) magnitude of S11 response in simulation of various MUT properties, assuming tan(δ) = 0, while ε r MUT = 10:10:80 and ε r MUT = 1.
Sensors 21 03759 g006
Figure 7. Comparison between frequency and phase sensitivity.
Sensors 21 03759 g007
Figure 8. (a) Phase and (b) magnitude of S11 response in simulations of various MUT properties, assuming ε r MUT = 10, while tan(δ) = 0:1:5.
Sensors 21 03759 g008
Figure 9. Comparison between S 11 depth and phase sensitivity.
Sensors 21 03759 g009
Figure 10. (a) Fabricated sensor, top view; (b) test setup.
Sensors 21 03759 g010
Figure 11. (a) Dielectric probe test setup, (b) Dielectric probe measurement results for permittivity and loss tangent of vanadium electrolytes.
Sensors 21 03759 g011
Figure 12. Reflection parameter modified due to negative resistance in (a) magnitude and (b) phase.
Sensors 21 03759 g012
Figure 13. Common liquid measurement with/without loss compensation.
Sensors 21 03759 g013
Figure 14. Measurement result for charged (V5+) and discharged (V4+) redox solutions: (a) mmagnitude and (b) phase.
Sensors 21 03759 g014
Table 1. Dimensions of the sensor with component values.
R 1 R 2 R 3 R 4 R 5 R 6 = R 7
220 k Ω 1.8 k Ω 50 Ω 50 Ω 10 Ω 75 Ω
C 1 = C 3 C 2 l w 1 w 2 s = g
0.1 μ F 100 μ F 5 mm 1 mm 2 mm 0.4 mm
Table 2. Performance comparison of passive and active sensor values.
ParameterPassive V in = 2 V V in = 4 V V in = 6 V
Depth of S 11 −9−18.9−26−43.3
3-dB BW1758357.53.6
Publisher’s Note: MDPI stays neutral with regard to jurisdictional claims in published maps and institutional affiliations.

