Article

First-Principle Studies of the Vibrational Properties of Carbonates under Pressure

by
Yurii N. Zhuravlev
1 and
Victor V. Atuchin
2,3,4,*
1
Institute of Basic Sciences, Kemerovo State University, 650000 Kemerovo, Russia
2
Research and Development Department, Kemerovo State University, 650000 Kemerovo, Russia
3
Laboratory of Optical Materials and Structures, Institute of Semiconductor Physics, SB RAS, 630090 Novosibirsk, Russia
4
Department of Applied Physics, Novosibirsk State University, 630090 Novosibirsk, Russia
*
Author to whom correspondence should be addressed.
Sensors 2021, 21(11), 3644; https://doi.org/10.3390/s21113644
Submission received: 21 April 2021 / Revised: 17 May 2021 / Accepted: 19 May 2021 / Published: 24 May 2021
(This article belongs to the Special Issue Numerical Modeling for the Sensor Application)

Abstract

:
Using the density functional theory with the hybrid functional B3LYP and the basis of localized orbitals of the CRYSTAL17 program code, the dependences of the wavenumbers of normal long-wave ν vibrations on the P(GPa) pressure ν(cm−1) = ν0 + (dv/dPP + (d2v/dP2P and structural parameters R(Å) (R: a, b, c, RM-O, RC-O): ν(cm−1) = ν0 + (dv/dR) − (RR0) were calculated. Calculations were made for crystals with the structure of calcite (MgCO3, ZnCO3, CdCO3), dolomite (CaMg(CO3)2, CdMg(CO3)2, CaZn(CO3)2) and aragonite (SrCO3, BaCO3, PbCO3). A comparison with the experimental data showed that the derivatives can be used to determine the P pressures, a, b, c lattice constants and the RM-O metal-oxygen, and the RC-O carbon-oxygen interatomic distances from the known Δν shifts. It was found that, with the increasing pressure, the lattice constants and distances R decrease, and the wavenumbers increase with velocities the more, the higher the ν0 is. The exceptions were individual low-frequency lattice modes and out-of-plane vibrations of the v2-type carbonate ion, for which the dependences are either nonlinear or have negative dv/dP (positive dv/dR) derivatives. The reason for this lies in the properties of chemical bonding and the nature of atomic displacements during these vibrations, which cause a decrease in RM-O and an increase in RC-O.

1. Introduction

Carbonates are among the most common minerals in the earth crust, and they play a key role in the dynamics of many geological processes [1]. How spectral characteristics of the infrared absorption and Raman scattering depend on pressure is of considerable research interest, since it allows us to study the behavior of carbonates in extreme natural conditions, including the deep mantle of the Earth. Knowing a physical and chemical property of carbonates, as the main carriers of carbon subduction in the Earth interior, is crucial for understanding the deep carbon cycle and related geological processes on the planet [2].
Vibrational modes of carbonates, among other materials with complex ions, are of particular interest since they are a convenient model for studying the “internal” modes of ions, along with the “external” modes that arise due to intragranular movements, complex ion rotations and metal cation vibrations [3]. There is another important reason for studying the vibrational modes of carbonates at a high pressure. It is known that the ruby fluorescence scale is widely recognized as the most reliable and convenient calibration for determining the pressure value in the experiments at high temperatures in a diamond anvil cell [4]. The use of such pressure scale requires a specified laser set up and a spectrometer to actuate and measure the corresponding fluorescence lines. However, this classical optical system is not always available in infrared spectroscopic experiments. It would be useful to develop a secondary pressure reference based on the calibrated shift of the IR-active modes of another convenient crystal phase, for which the internal CO 3 2 vibration modes of ions in carbonates can be chosen. In particular, the possibility of using carbonate crystals as pressure sensors was exemplified by the selection of calcite and dolomite [5]. The specific features of carbonates vibrational spectra are the segregation of vibration modes into lattice (0–400 cm−1) and intramolecular modes of four types: deformations in the carbonate ion plane (ν4, 650–720 cm−1), deformations outside the plane (ν2, 840–910 cm−1), symmetric stretching (ν1, 1000–1100 cm−1) and asymmetric stretching (ν3, 1350–1600 cm−1) [6].
The experimental measurements of the infrared absorption spectra (IRS) of magnesite (MgCO3) within the frequency range of 100–1800 cm−1, depending on the pressure up to 28.8 GPa, were performed in [7]. The large Gruneisen parameter values for the translational modes were explained there by the fact that the pressure-induced changes in the interatomic distances in the [MgO6] octahedra are significantly greater than in the CO 3 2 ions, which remained practically rigid. In [8], the behavior of the infrared and Raman spectra (RS) of magnesite in the pressure range 0–50 GPa was studied within the density functional theory (DFT), taking into account the third-order perturbation. Further, high pressure Raman spectroscopy up to 27 GPa was used to study a single crystal of magnesite in [9], and it was shown that the wavenumbers of all single-degenerate modes increased almost linearly with the increasing pressure. The first-principle studies of thermodynamic and elastic properties of magnesite under pressure were held in the local approximation (LDA) DFT in [10]. Raman spectroscopy, in combination with X-ray diffraction and DFT calculations, was used in [11] to establish the magnesite phase stability.
The behavior of natural calcite minerals at a high pressure up to 75 GPa was studied using Raman laser spectroscopy and theoretical DFT calculations in [12]. The behavior of otavite (CdCO3) at the pressure up to 23 GPa was studied using RS and DFT calculations with the PBE gradient functional in [13]. It was shown that the calcite-type structure remains stable to a pressure of at least 19 GPa. A combined IRS and high-pressure RS study of a natural CaMg0.98Fe0.02(CO3)2 dolomite sample was carried out in [14]. Here, the data obtained in the framework of DFT with the LDA and PBE exchange-correlation functionals and the plane wave basis were used to interpret the infrared and Raman spectra measured in the ranges of 500–2000 cm−1 and 100–1200 cm−1, respectively. In [15], the studies of the properties of a natural dolomite sample without iron admixture were carried out for pressures up to 40 GPa and the far IR band.
The infrared spectrum of cerussite (PbCO3) in the aragonite structure for pressures up to 41 GPa was measured in a diamond anvil cell in [16]. Infrared spectroscopy was used to study the vibrational spectrum of viterite (BaCO3) at the pressure up to 8 GPa to determine the boundaries of a metastable trigonal phase [17]. It was shown that all the carbonate group vibrational modes up to 7 GPa pressure, with the exception of the out-of-plane ν2 deformation vibration, shift towards higher wavenumbers. The phase behavior of strontianite (SrCO3) was studied up to 78 GPa experimentally using RS and theoretically using the PBE functional in [18]. In [19], joint studies were carried out using the methods of infrared absorption and Raman scattering on a sample of a synthetic strontianite crystal, providing the basis for a pressure-temperature phase diagram.
Of considerable interest is the comparative analysis of the spectroscopic characteristics of carbonates of various structural types. The aragonite, magnesite and dolomite Raman spectra were studied under pressure up to 25 GPa in [20]. It was shown that the changes in wavenumbers under pressure are greater for lattice modes than those for intramolecular ones, as evidenced by the mode anharmonic parameters. The thermodynamic and thermoelastic properties of magnesite, calcite, aragonite, dolomite and siderite were predicted using IRS and RS [21]. The pressure- and temperature-induced frequency shifts of the Raman vibrational modes of the natural aragonite, calcite, dolomite and magnesite minerals were obtained [22]. Finally, the IRS and RS were measured for aragonite, stronzianite, cerussite and viterite [6], where it is shown that Gruneisen isobaric and isothermal parameters are in the range of 0.9–3.5 for the lattice vibrational modes below 350 cm−1, and less than 0.4 for the CO 3 2 internal modes above 650 cm−1.
This work is aimed at the systemic study, by computer modeling methods, of the behavior of the vibrational spectra of simple and double metal carbonates under pressure. Previously, such combined approach was successfully applied for the exploration of structural, electronic and spectroscopic characteristics of crystal materials related to different chemical classes [23,24,25,26,27,28]. The main regularities of changes in the parameters of the vibrational modes, the quantitative dependences of the wavenumbers on pressure and structural parameters of carbonates, as well as the possibility of determining the structural characteristics from the known wavenumber shifts, will be established. Such dependences are valuable in studying the characteristics of carbonate crystals by noncontact nondestructive optical methods [29,30,31].

2. Calculation Method

The study of metal carbonates spectroscopic parameters as a function of pressure is based on the first principles of the Hartree-Fock theory (HF) and the density functional theory that are well combined in the CRYSTAL17 program code [32,33]. The calculations used the B3LYP hybrid functional, which includes the 20% HF exchange with the BECKE exchange functional [34] and the LYP correlation functional [35]. The basic functions were chosen as a linear combination of localized Gaussian-type atomic orbitals. Full-electron basis sets for carbon, oxygen, magnesium and calcium atoms from [36] were used. The POB-DZVP basis was used for zinc atoms [37]. For strontium and barium, the pseudopotential basis sets from [38] were used, and for lead—those from [39]. The inverse space is discretized using a Monkhorst-Pack [40] grid with 216 independent k-points in the irreducible part of the Brillouin zone for trigonal crystals and 64 points—for orthorhombic ones. The accuracy of self-negotiation procedure was above 10−9 au. (1 au. = 27.21 eV). The wavenumbers of harmonic vibrations of the lattice atoms were calculated using the FREQCALC procedure [41,42]. The harmonic frequencies of phonons at Γ point (k = 0, the center of the Brillouin zone) were obtained from the diagonalization of the mass-weighted matrix of the second energy derivatives, with respect to atomic displacements [43].
To describe the wavenumbers dependence on the P (GPa) pressure, the Gruneisen mode parameter is used [7]: γ i = ( B 0 / ν i ) ( ν i / P ) , where νi is the wavenumber of the i-vibrational mode (cm−1), V is the unit cell volume (Å3), B0 is the isothermal volume compression modulus (GPa) determined from the Birch-Murnaghan constitutive equation [44]: P ( V ) = 3 B 0 2 ( x 7 x 5 ) ( 1 + 3 4 ( B 1 4 ) ( x 2 1 ) ) ,   x = ( V / V 0 ) 1 / 3 ,   B 1 = ( B / P ) T , the first derivative of the pressure modulus being x = 1. The wavenumber pressure derivatives were calculated numerically from the quadratic interpolation ν ( P ) = ν 0 ( P = 0 ) + ( d ν / d P ) · P + ( d 2 ν / d P 2 ) · P 2 . The accuracy of this procedure is controlled by the correlation coefficient K = i = 1 N ( y i f i t y f i t ¯ ) 2 / i = 1 N ( y i d a t a y d a t a ¯ ) 2 , where the average value of y ¯ = 1 N i = 1 N y i . The temperature in these calculations was not taken into account and, by default everywhere, it is equal to absolute zero.

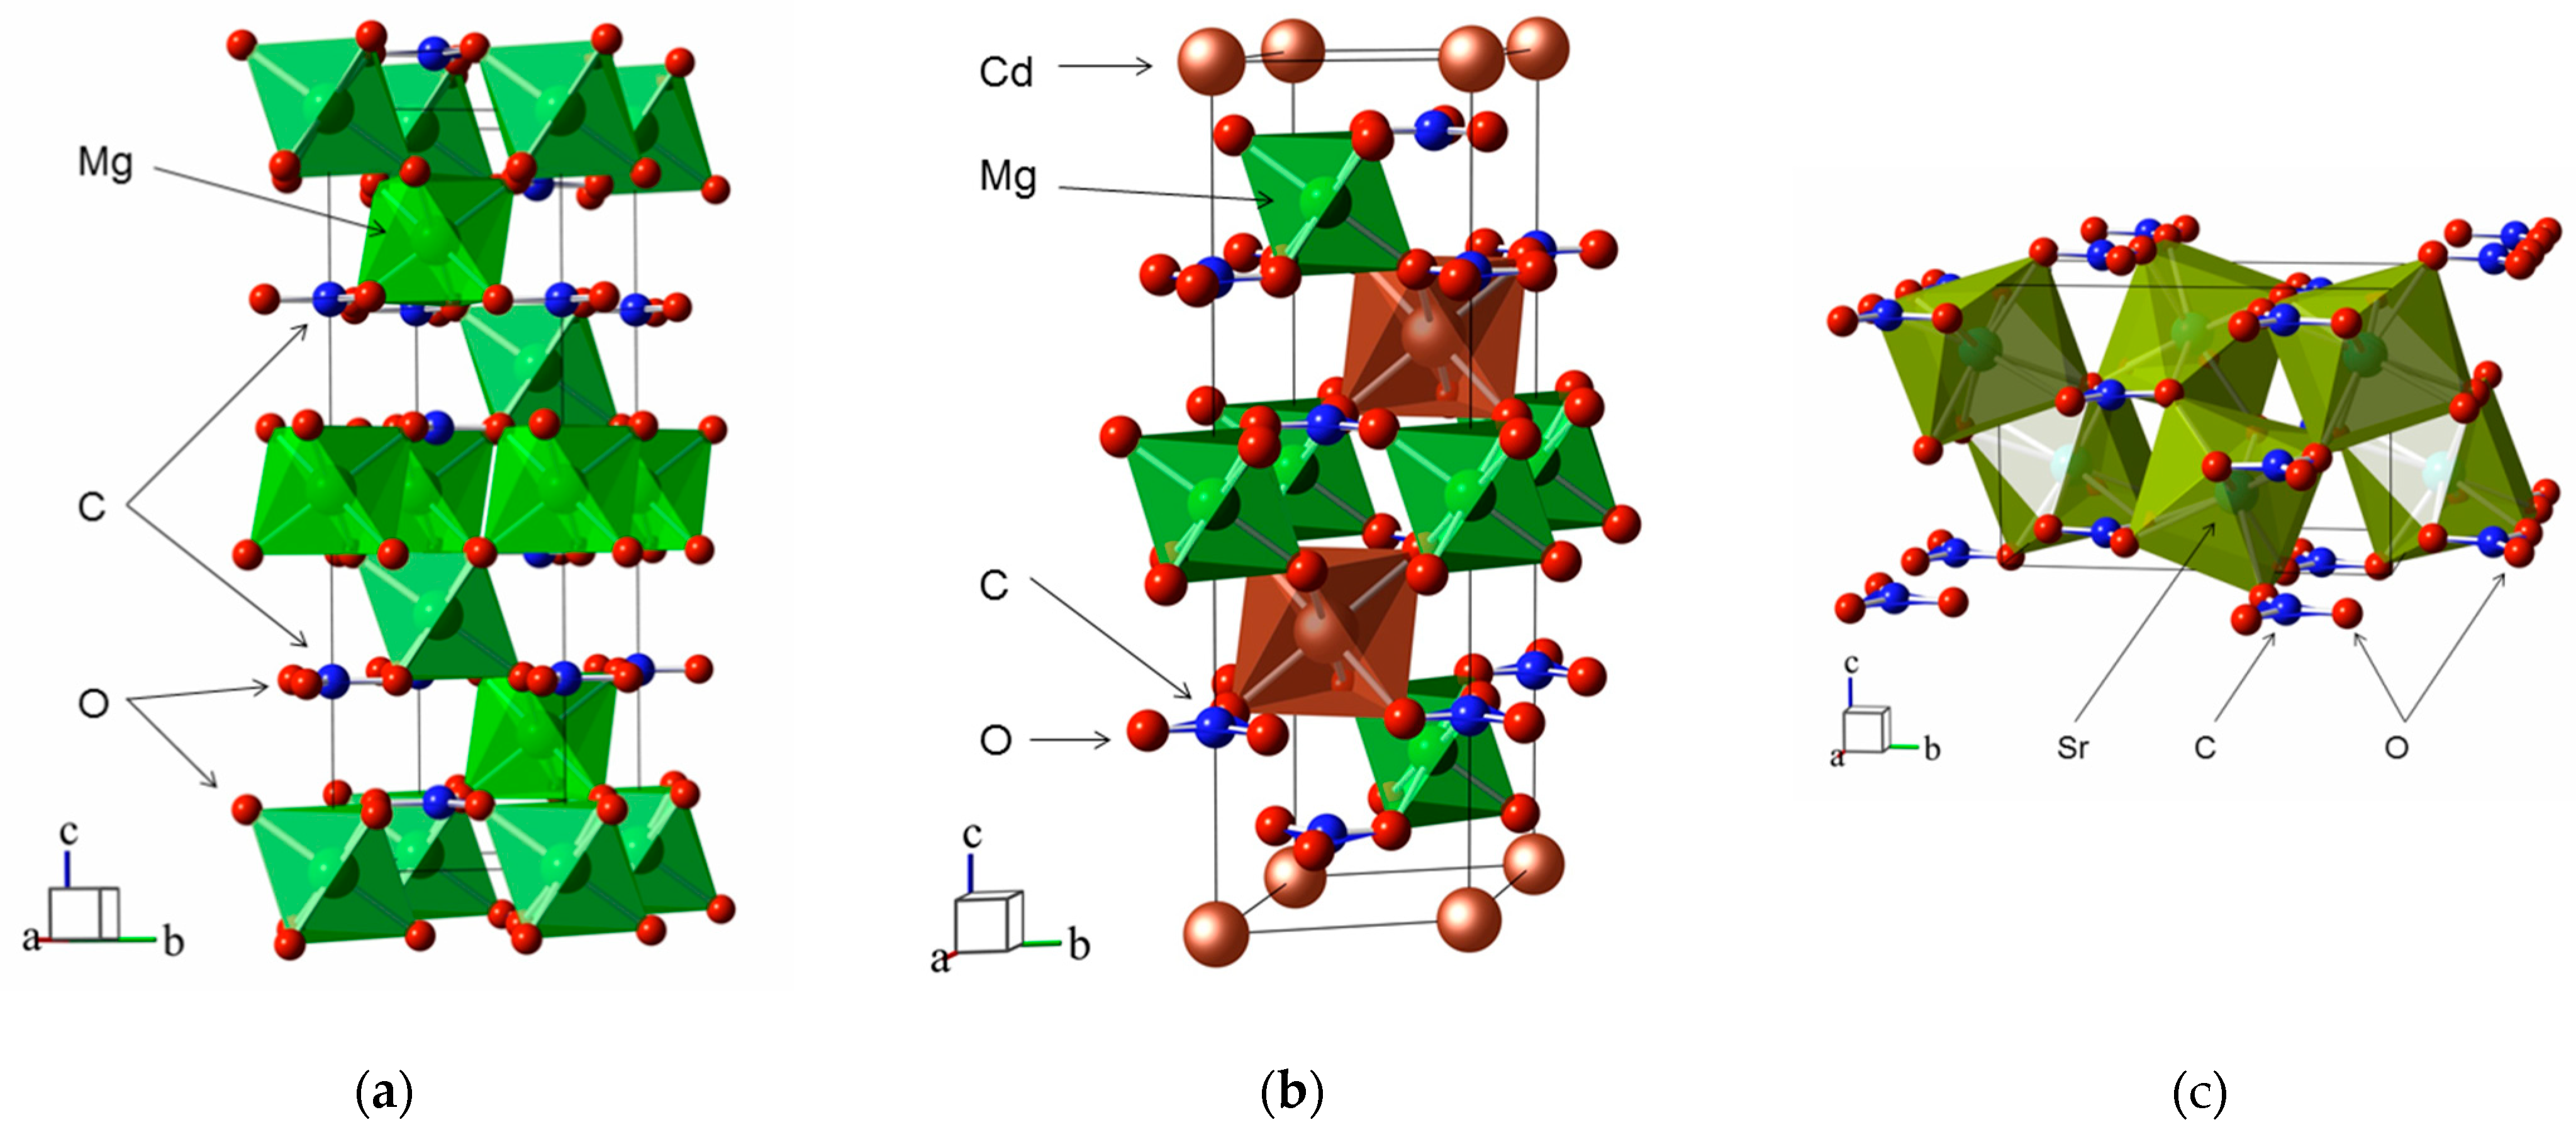
3. Crystal Structure and Pressure

To determine the parameters of carbonate crystal structure, a complete optimization for lattice constants and atomic positions coordinates was performed. The starting values used are the data known from the literature for magnesite [9], smithsonite (ZnCO3) [45], otavite [46], dolomite [47], minocordite (CaZn(CO3)2) [48], CdMg(CO3)2 [49], strontianite, cerussite and viterite [50]. The obtained lattice constants and interatomic distances (Table 1) are in a good agreement with the experimental values. Deviations do not exceed 3% for natural minerals and 1% for synthetic crystals [51].
To study the effect of the P pressure, hydrostatic compression was set in the range of 0–10 GPa, and then the resulting structure was optimized while maintaining the V cell volume. The obtained dependences V(P) were used to determine the V0, B0, B1 state equation parameters, the a(P), b(P), c(P) lattice constant dependences and the interatomic distances: RM-O(P)—for metal-oxygen, and RC-O(P)—for carbon-oxygen. The linear compression modules B x = x · P / x   ( x : a ,   b ,   c ,   R M O ,   R C O ) were determined from the obtained dependences. The derivative was calculated by linear interpolation. The interatomic distances and lattice constants can then be obtained by the formula x ( P ) = x 0 ( 1 P / B x ) . The parameters of state equation and linear compressibility modules obtained this way are shown in Table 2.
The typical crystal structures of carbonates from the calcite, dolomite and aragonite families are shown in Figure 1. Carbonates of the calcite family MCO3 (M: Mg, Zn, Cd) belong to the R 3 ¯ c space group and contain two formula units (Z = 2) in a unit cell, which volume increases with the atomic radius growth of the RM cation [52] as V03) = 9.919 + 52.21·RM. As the pressure increases, the a, c lattice constants and interatomic distances decrease linearly. The Ba, Bc moduli in MgCO3 that characterize this decrease for the same pressure range are consistent with the experimental data [53]. In rhombohedral lattices, the M2+ cations and CO 3 2 anions are arranged in layers perpendicular to the c axis, and, so, the compressibility along the a axis is almost three times less than that along the c axis. The atoms in the CO 3 2 groups are bound together by strong internal C-O bonds and weaker M-O bonds in octahedra [MO6], and, so, the former are practically incompressible and RM-O decrease quite rapidly with the increasing pressure.
Double carbonates with a dolomite structure belong to the R 3 ¯ (Z = 2) space group. This structure consists of alternating layers of [CaO6] and [MgO6] octahedra arranged sequentially along the c axis and separated by the CO 3 2 plane groups in the parallel ab plane. There is also a significant anisotropy of compressibility along the axes a and c: Ba/Bc = 3.1 (3.0 in [47]). The unit cell volume in double carbonates grows with an increase in the arithmetic mean cation radius; however, as in calcites, there are no ordinary change patterns in the volume and linear compressibility moduli.
SrCO3, PbCO3 and BaCO3 carbonates have an aragonite-type structure and belong to the space group Pmcn (Z = 4). The orthorhombic crystal structure consists of coplanar CO 3 2 triangles parallel to the ab plane and the [MO9] (M2+: Sr, Pb, Ba) polyhedra located along the c axis. The cation layers in an approximately hexagonal tightly packed structure alternate with anion layers. There is also a significant compressibility anisotropy: it is minimal along the a axis and maximal along the c axis. In BaCO3, the b constant dependence has a nonlinear character and is described by the quadratic function b ( Å ) = 8.933 0.042 · P + 0.004 · P 2 with the correlation coefficient of 0.998. For the average distances <M-O> and <C-O>, the linear dependence is preserved and the rate of their decrease with the increasing pressure is −0.013 Å/GPa and −0.001 Å/GPa (−0.013 and −0.003 Å/GPa as in [54]), respectively.

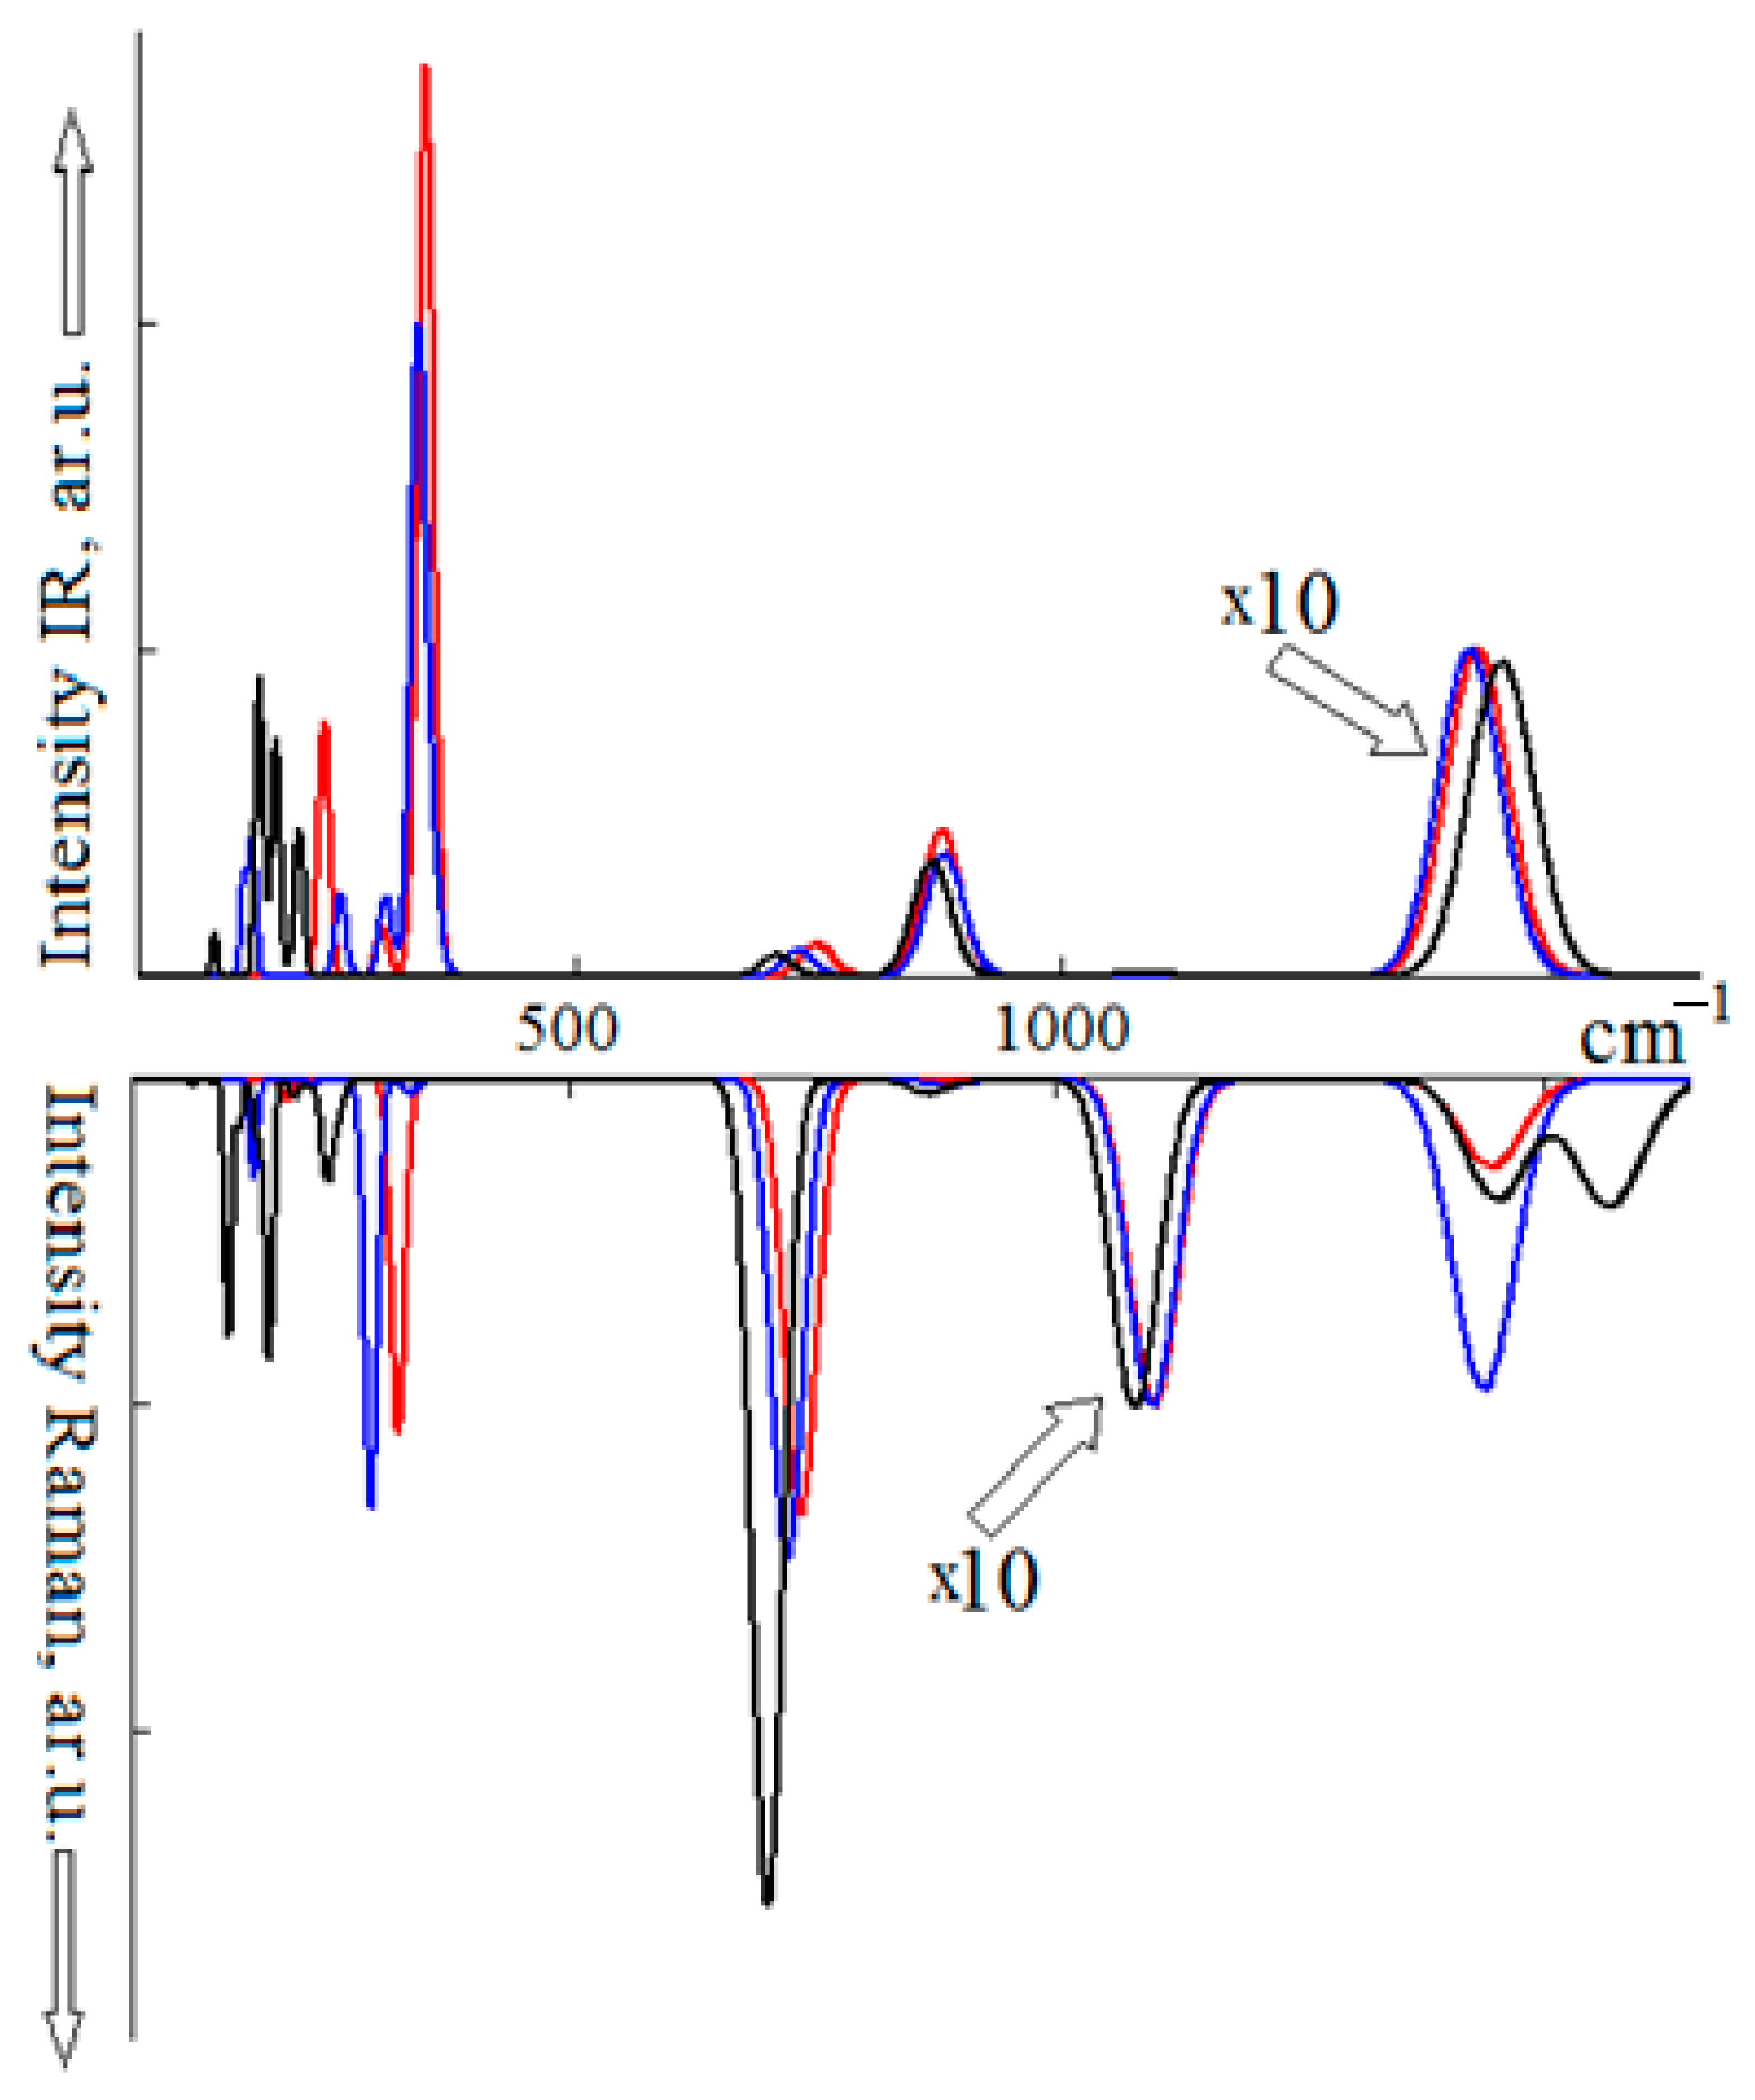
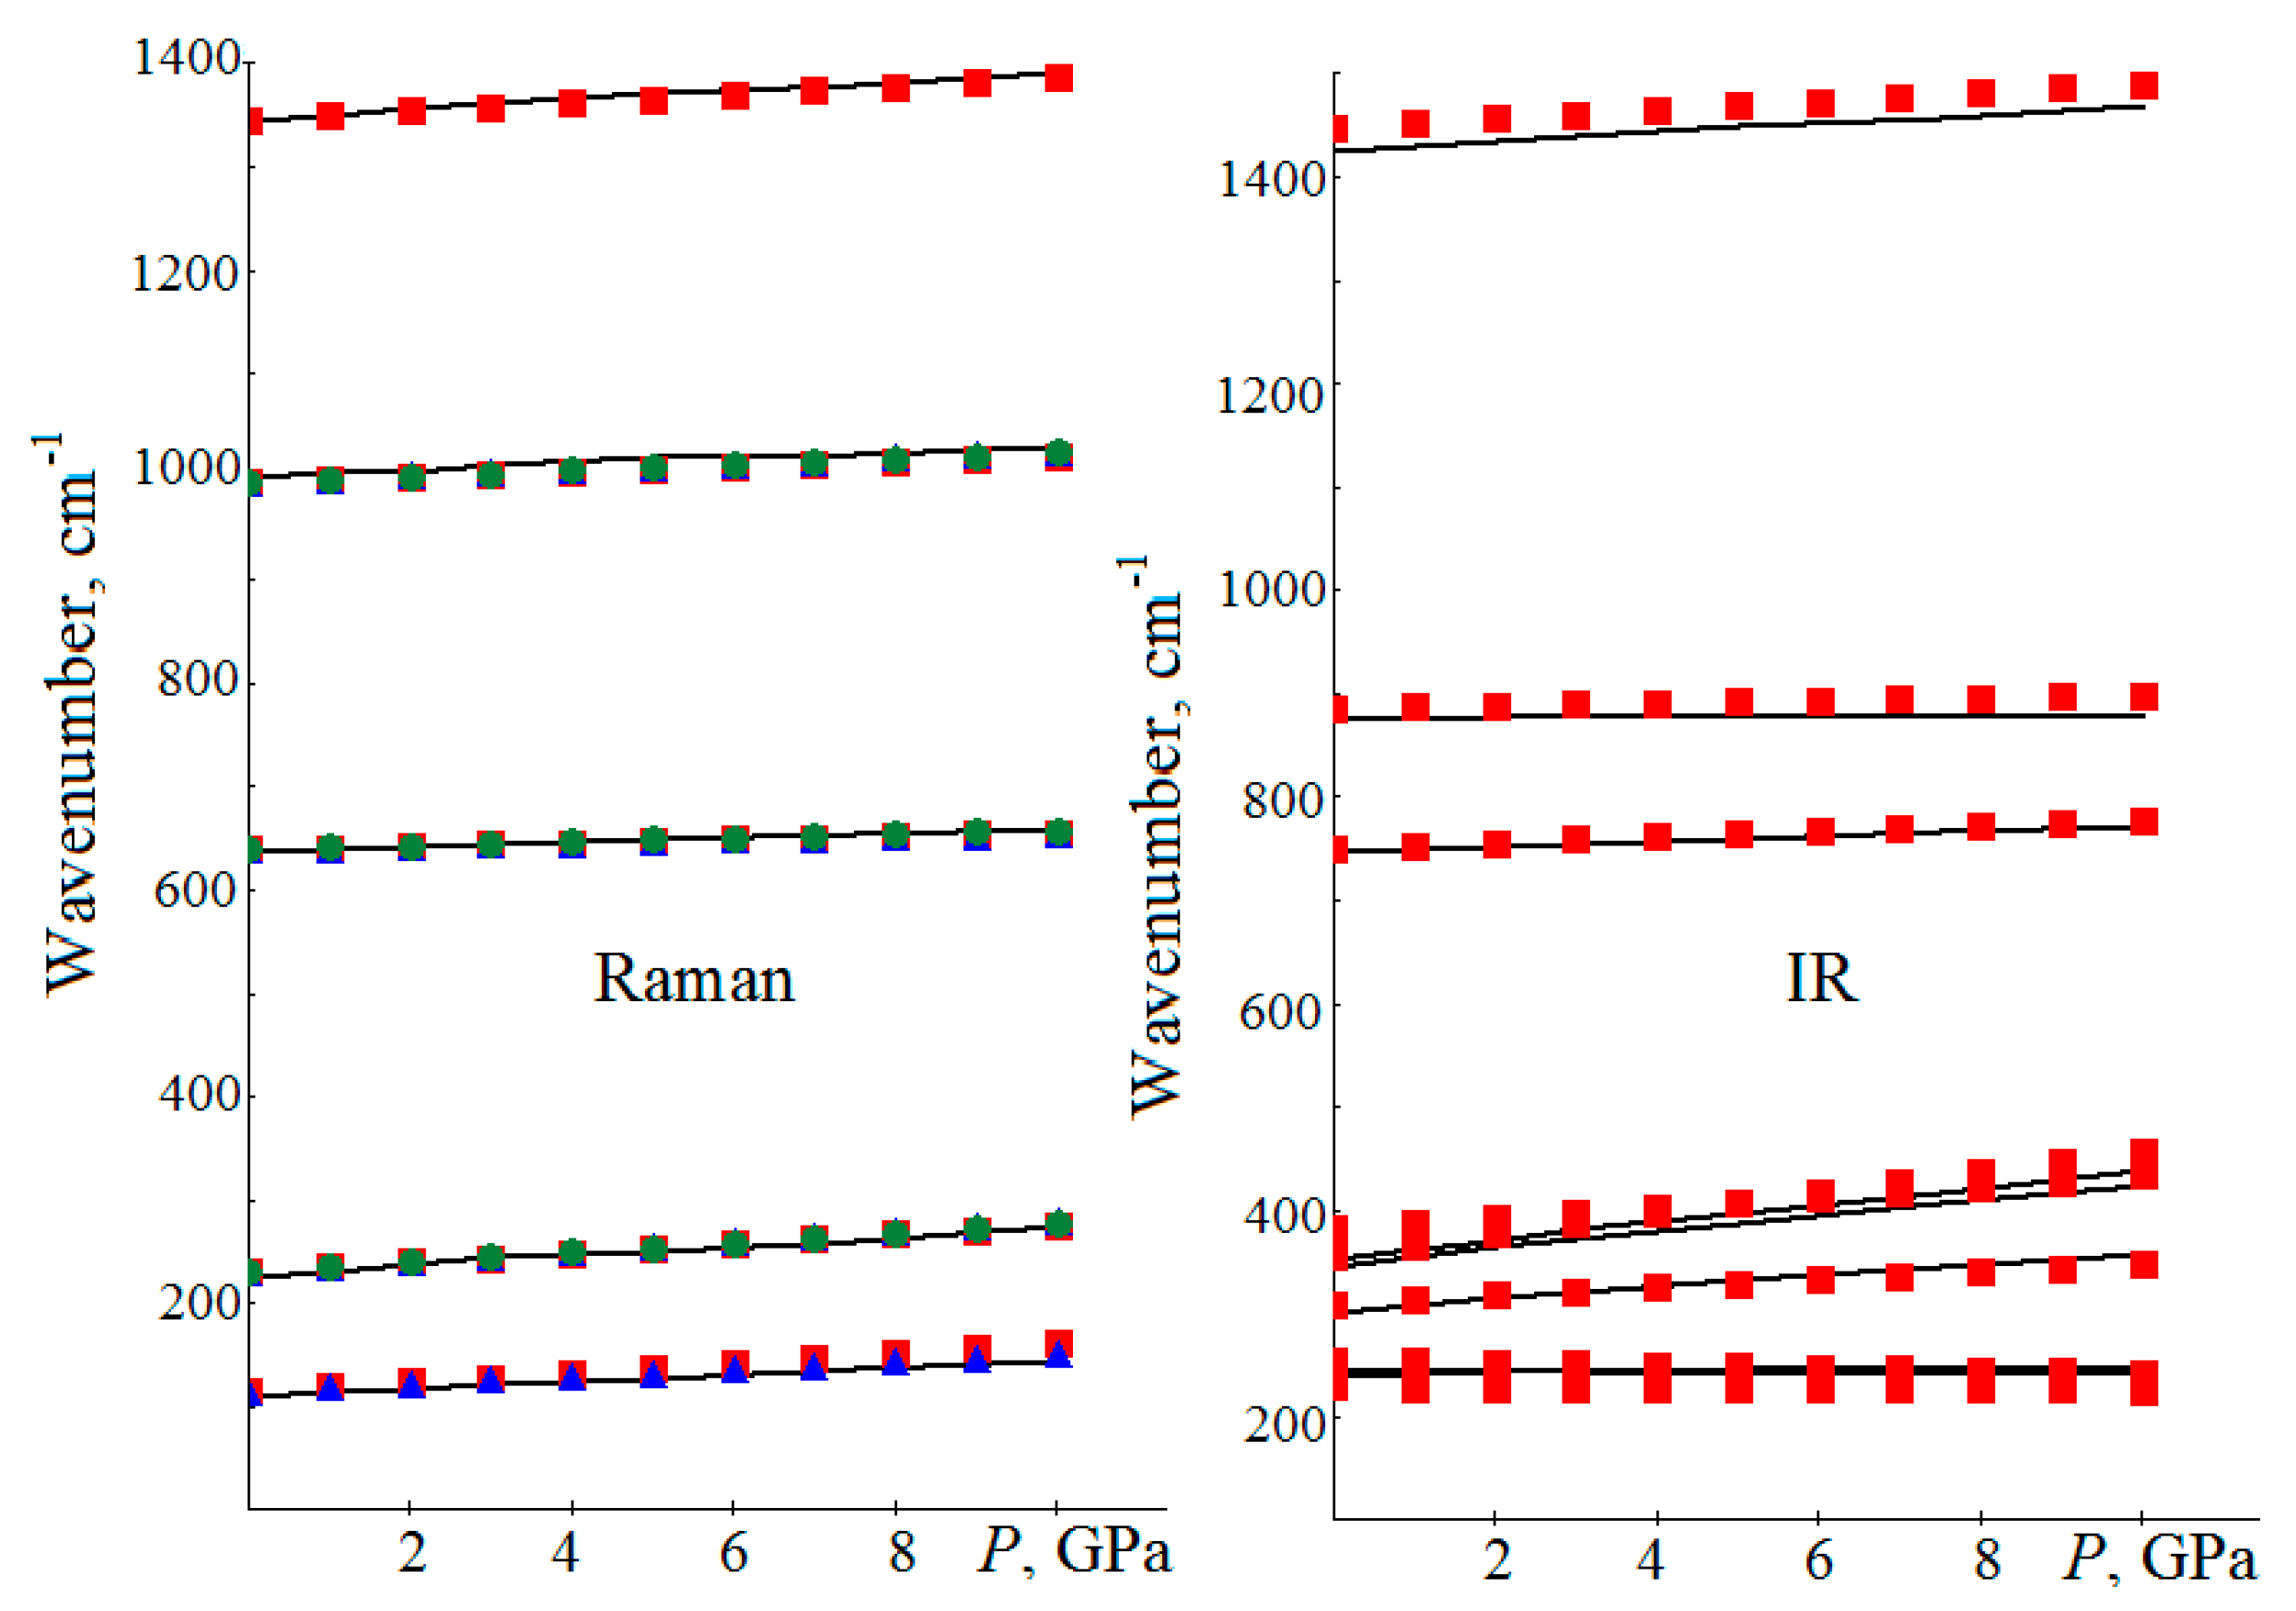
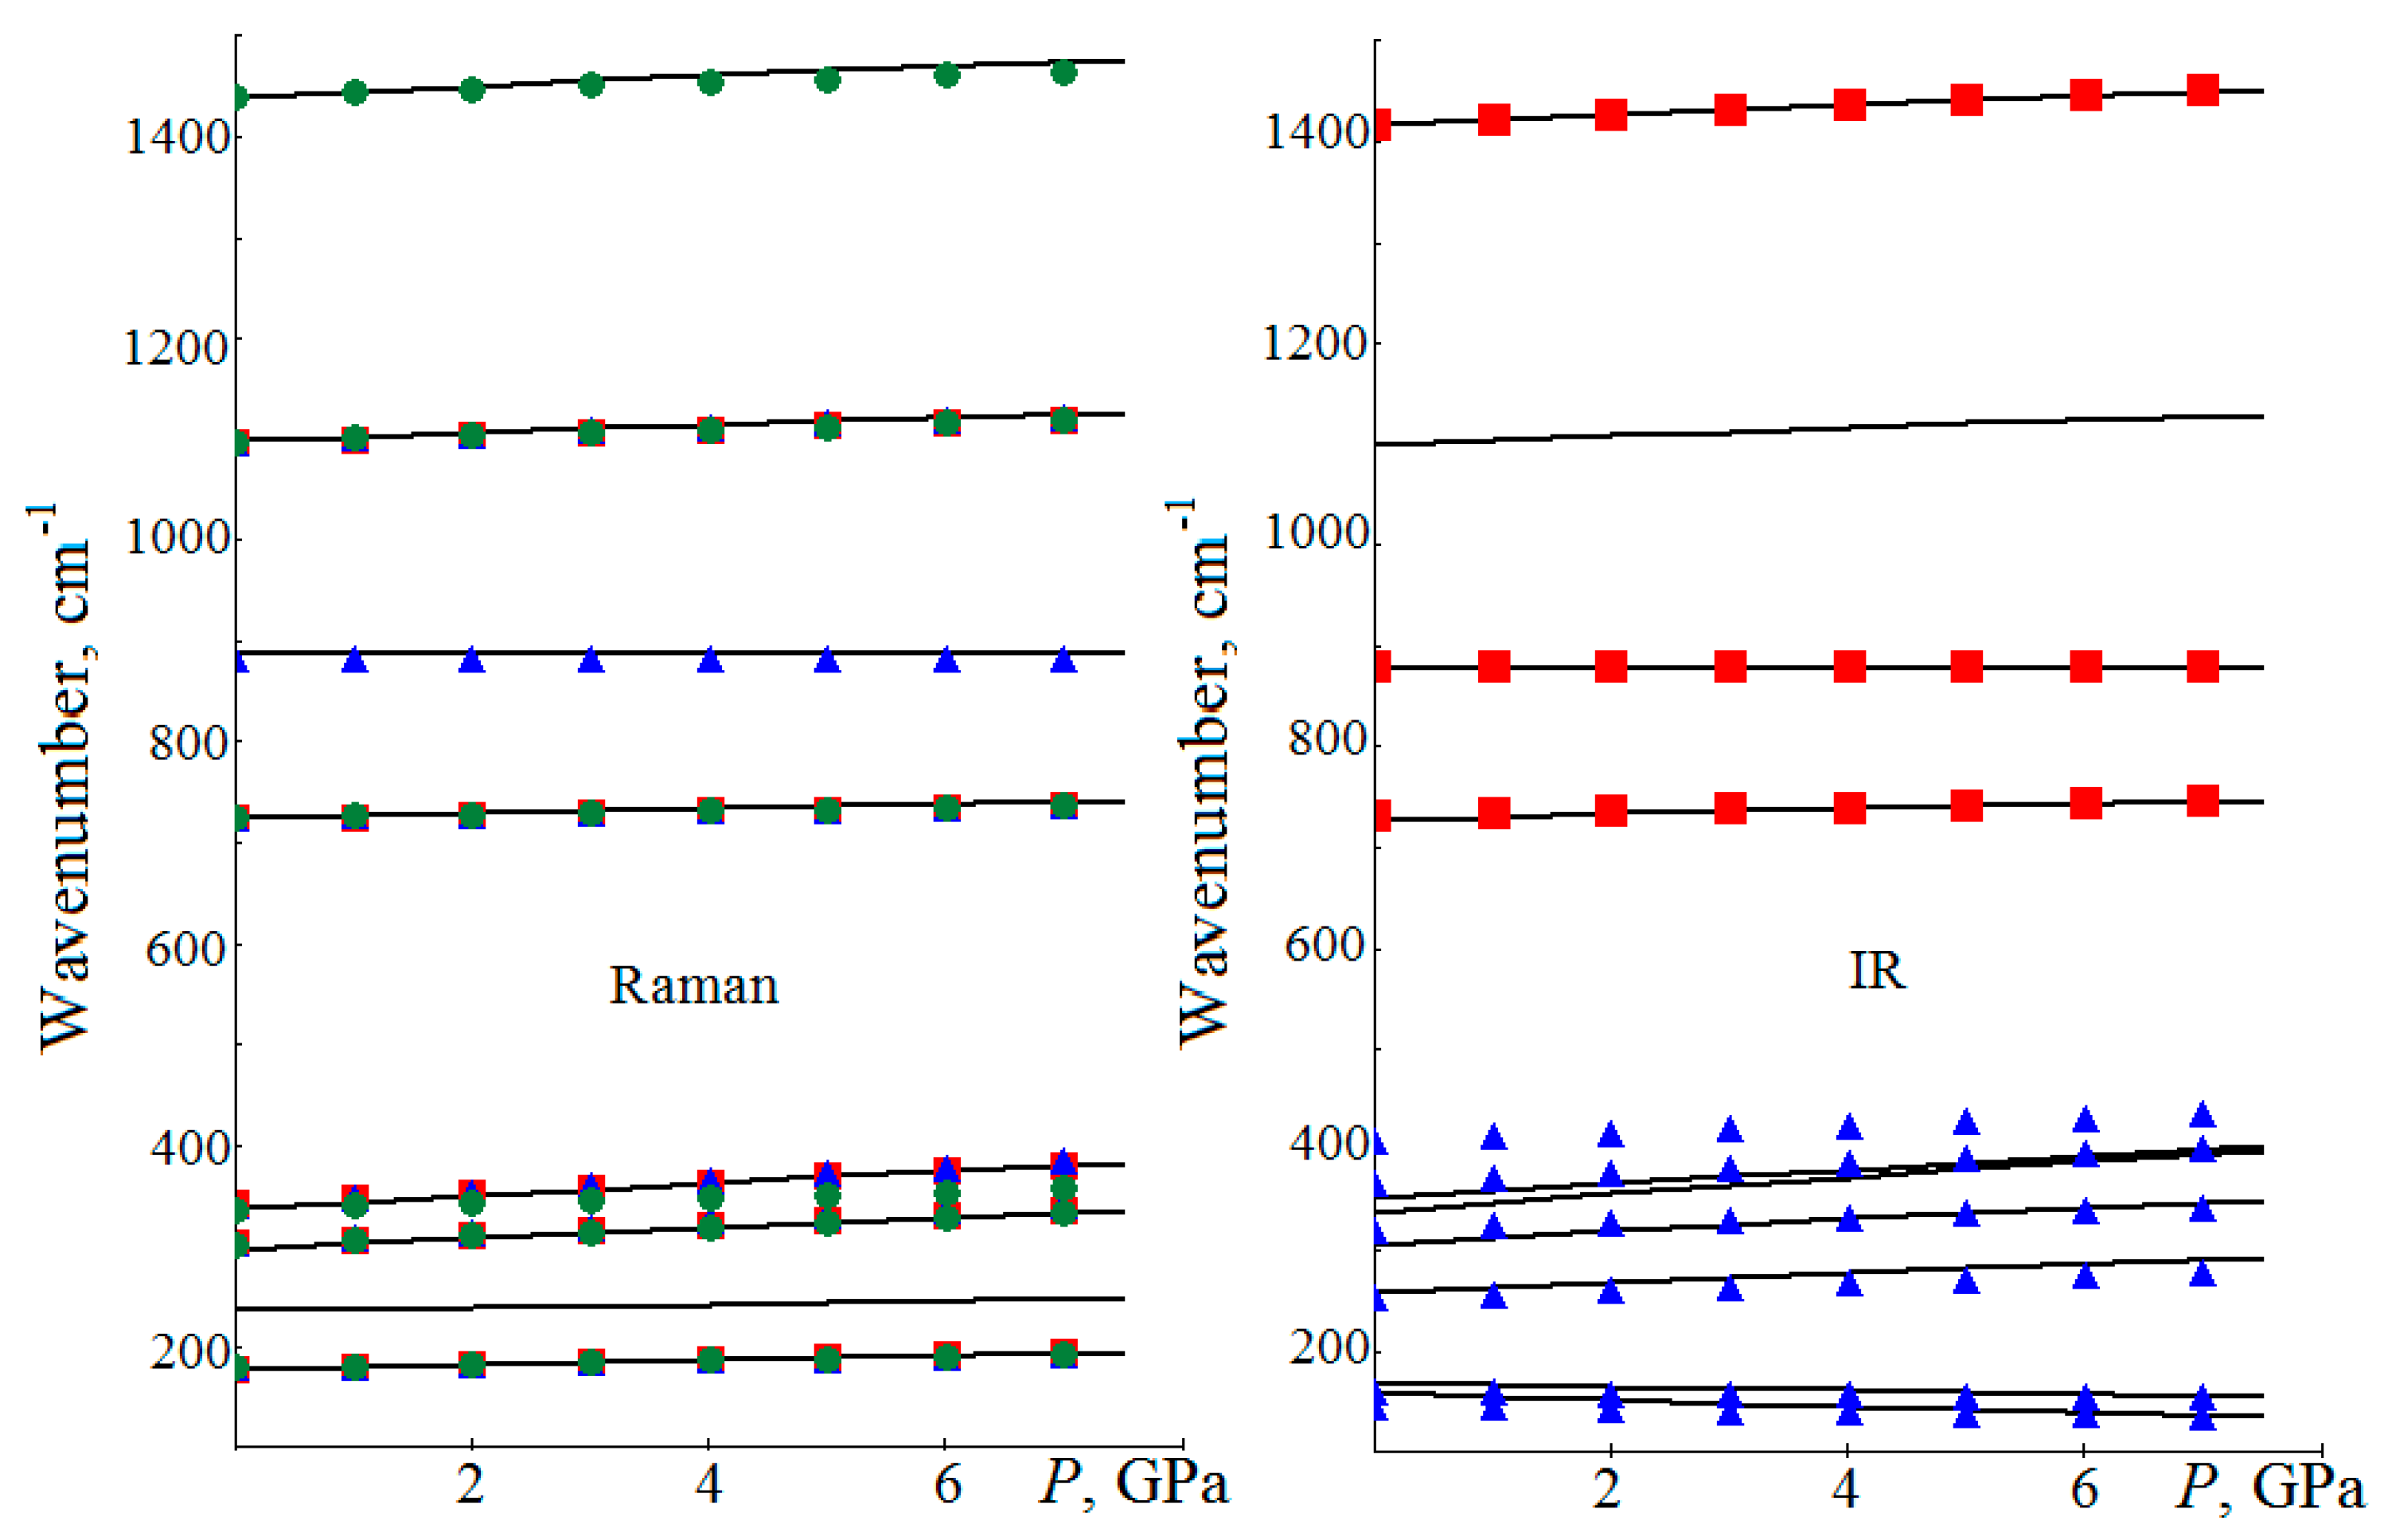
4. Vibrational Spectra under Pressure

The decrease in the interatomic distances under hydrostatic pressure is accompanied by an increase in the wavenumbers of vibrational modes. Therefore, the energy of zero vibrations E 0 = i = 1 N h ν i / 2 grows with the increasing pressure and this dependence can be described by E 0 ( kJ / mol ) = E 0 + ( d E 0 / d P ) · P + ( d 2 E 0 / d P 2 ) · P 2 , which coefficients, in terms of a Z formula unit, are given in Table 3. There is a linear correlation between the zero vibrations energy and the M cation atomic mass [55] (the average for cations in double carbonates): E0 (kJ/mol) = 50.797 − 0.041·M.
The M-O and C-O interatomic distances change differently with the increasing pressure, and, so, the wavenumbers of the CO 3 2 intramolecular vibrations can be expected to vary slightly, compared to the wavenumbers of lattice vibrations. Lattice vibrations are divided into translational (T) vibrations involving cations and anions and rotational (L) vibrations for anions. For the center of Brillouin zone (Γ), the crystal vibrational modes can be classified by irreducible representations of the point symmetry group. For crystals with a calcite structure, the total vibrational representation is decomposed into irreducible ones: Γtot = A1g(RS) + 3A1u + 3A2g + 3A2u(IRS) + 4Eg(RS) + 6Eu(IRS), where IRS means modes active in the infrared spectrum, and RS stands for modes active in the Raman spectrum. For the dolomite structure, the expansion of the vibrational representation has the form: Γtot = 4Ag(RS) + 6Au(IRS) + 4Eg(RS) + 6Eu(IRS); respectively, for aragonite: Γtot = 9Ag + 6B1g(RS) + 9B2g(RS) + 6B3g(RS) + 6Au + 9B1u(IRS) + 6B2u(IRS) + 9B3u(IRS). The numbers before the irreducible representations indicate the number of vibrational modes of this type.
In calcites, the A2u (Au in dolomite) symmetry modes with the polarization along the c axis must be more pressure-dependent than the Eu symmetry modes with the polarization perpendicular to this axis. In aragonites, the B2u vibrational modes have the polarization E||a, B3u-E||b, B1u-E||c. Of particular interest are the vibrational modes, which wavenumbers do not increase with the increasing pressure, but rather decrease. They have a negative pressure derivative and a negative Gruneisen parameter. According to the literature, these include the ν2-type mode of the Au [14] and Ag [22] symmetries of dolomite, the B1u, B3u, Ag and B2g modes of aragonite [56], viterite [17], cerussite [16] and strontianite [19]. The low-wavenumber lattice vibrations in dolomite also have negative mode parameters [8].
The infrared and Raman spectra obtained by the Gaussian broadening of the normal MgCO3, CaMg(CO3)2 and SrCO3 long-wave vibrational modes are shown in Figure 2. For other carbonates, the spectra have a qualitatively similar form [51]. The MgCO3 IRS is dominated by an intense (assumed to be 100%) band formed by the v3 Eu-symmetry mode with the wavenumber of 1423 cm−1. The other two intramolecular modes, v2 and v4, have significantly lower intensities of 4 and 1%, and wavenumbers of 874 and 745 cm−1, respectively. In CaMg(CO3)2, the positions of these bands maxima do not change significantly: 1415 (Eu), 877 (Au) and 726 cm−1 (Eu). Nor does their intensity change. The allowed v1 type vibration has a near-zero intensity. In SrCO3, due to a decrease in the anion symmetry, the number of vibrational modes increases, and it does not affect the v3 maxima position: 1455 (B3u) cm−1, 1439 (B2u) cm−1; ν2: 864 (B1u) cm−1, v4: 705 (B3u) cm−1.
In the Raman spectra of MgCO3, CaMg(CO3)2 and SrCO3, the v1 vibration intensity (taken as 100%) dominates, having the wavenumbers of 1099 (A1g), 1097 (Ag), 1079 (Ag) cm−1, respectively. Against this background, other fluctuations are less noticeable. So, for v4, the intensity in MgCO3 equals 13%, in CaMg(CO3)2—15% and in SrCO3—11%. The v3 band in strontianite has two maxima at 1450 (B3g) and 1565 cm−1 (B2g) with intensities of 4%; one maximum at 1437 cm−1 in dolomite and 1444 cm−1 in magnesite. As for the v2 band, its intensity in all carbonates does not exceed 1%, and the maximum is in the region of ~870 cm−1.
The values of the ν0 wavenumbers and their pressure derivatives /dP, d2ν/dP2 are summarized in Table 4, Table 5 and Table 6. The Gruneisen mode parameter γi can easily be obtained using the data from these tables and the B0 values from Table 2. Further, in Table 4, Table 5 and Table 6, the d2P/2 derivatives are given, with the help of which, along with the (/dP)−1 value, it is possible to calculate the pressure from a known wavenumber: P ( v ) = ( d P / d v ) · ( v v 0 ) + ( d 2 P / d v 2 ) · ( v v 0 ) 2 . The dv/da derivatives are also given for calculating the a lattice constant: a ( v ) = a 0 + ( d a / d v ) · ( v v 0 ) or the wavenumber: v ( a ) = v 0 + ( d v / d a ) · ( a   a 0 ) . To calculate other (b, c, RM-O, RC-O) geometric parameters of the lattice, the fact that there are linear dependences between them under pressure will be used. For example, for aragonite [56] in the 0–15 GPa range, the following relations are fulfilled: b(Å) = b0 + 1.325·(aa0) (0.997), c(Å) = c0 + 1.824·(aa0) (0.995). Therefore, the db/da, dc/da, dRM-O/da, dRM-O/da derivatives can be calculated and, consequently, the necessary /dR = (/da)/(dR/da) can be determined. For example, to calculate the derivative of dc/da, the data in Table 1 and Table 2: dc/da = (c0/a0)·(Ba/Bc) are needed. For MgCO3, this method gives the value of 7.378, and in the direct calculation—that of 7.376.
The pressure dependences of magnesite wavenumbers for five vibrational modes active in the Raman spectrum and eight modes active in the infrared spectrum are shown in Figure 3. The wavenumbers of all modes observed in RS continuously and almost linearly increase with the increasing pressure. The values of the i/dP derivatives obtained in this research (Table 4) are in a satisfactory agreement with the available experimental data [9,22,53]. The discrepancies do not concern the curve shapes, they concern only their displacements relative to the calculated and measured ν0 values. Thus, using the described calculation algorithm and the ν(P) numerical dependences from [9], for the 0–12 GPa pressure range, vT(cm−1) = 212 + 4.213·P − 0.076·P2 (0.999) is obtained. There is also a satisfactory agreement for the Gruneisen mode parameters obtained earlier experimentally in [20] and theoretically in [10].
Here is an example of calculating an unknown pressure from a known v wavenumber. To do this, the Eg(T) MgCO3 lattice vibration is chosen. Using the derivatives of Table 4, the following is obtained: P(GPa) = (5.541)−1·(νTνT,0) + 0.606·10−3·(νTνT,0)2 (0.994), and for the experimental data from [9]: P(GPa) = 0.176·(νTνT,0) + 0.698·10−3·(νTνT,0)2 (0.999). In [9], the ΔνT shift is 28 cm−1 at 5.58 (±0.06) GPa and the first theoretical formula yields P = 5.53 GPa, the second experimental formula—5.48 GPa. For the ν1 intramolecular vibration, according to [9], at the specified pressure for the Δν1 = 18 cm−1 shift, we obtain it using the theoretical formula 5.54 GPa, while the experimental one yields 5.60 GPa. Thus, the derivative values obtained in Table 4 allow us to calculate the external pressure on the sample according to the known displacement of the wavenumber fairly accurately.
The IRS-active modes can also be used to determine pressures. For this purpose, the data from [7] for the ν3 intramolecular vibration is used, where for the pressure of 6.2 ± 0.3 GPa, the shift Δν3 = 20 cm−1 is determined. Using only the first derivatives, the pressure of 4.73 GPa for dP/ from [7] can be calculated, the same as 4.23 GPa from [8]. In this research, for the derivative 4.347 cm−1/GPa, 4.60 GPa is obtained, and it is less than the experimental data. The quadratic interpolation of experimental values according to the formula P(GPa) = 0.325·(Δν3) − 1.489·10−3·(Δν3)2 yields the value of 6.5 GPa, which is in a satisfactory agreement with the experiment. The exact pressure value can only be obtained for the cubic dependence, which coefficients can be found in [7].
There is a linear relationship between the wavenumbers and pressure, as well as between the lattice geometric parameters and pressure. This means that, between νi and the lattice parameters (a, c, RM-O, R-C-O), there is also a linear relationship. For example, for the νT RS mode in MgCO3, the relation between its wavenumber and the a lattice constant is satisfied: νT(cm−1) = νT,0 − 600·(aa0). For the experimental values of a = 4.595 Å lattice constant [53] at the pressure of 4.20 GPa and a0 = 4.628 Å in the absence of pressure, the formula yields ΔνT = 19.8 cm−1 (18.1 cm−1 in [9]). At the pressure of 6.1 GPa in [44] Δa = −0.042 Å, and, so, for the ν3 IRS active mode, the result is Δν3 = 21.1 cm−1. In the [7] experiment at 6.2 GPa, this shift is 20 cm−1. There is also an inverse relationship: a(Å) = a0 − 600−1·(νTνT,0). For the above experimental data for the νT mode, this formula gives a lattice constant value of 4.593 Å. For the Δν1 shift at the pressure of 4.08 GPa [9], according to a(Å) = a0 − 360−1·(Δν1) formula, the lattice constant will be equal to 4.606 Å. According to [53], this corresponds to the pressure of 4.2 GPa. Thus, the study of how the Raman scattering and infrared absorption spectra of calcites depend on pressure makes it possible to determine the structural parameters from the known wavenumbers and vice versa. At the same time, to improve the prognosis accuracy, instead of the (P = 0) equilibrium theoretical values of the ν0 wavenumbers and the a0 lattice constants, it is necessary to use experimental data.
The above-mentioned linear dependences do not work for all vibrations. For the lattice symmetry modes Eu(L) and A2u(L) in MgCO3, the ν(P), ν(R) dependences have a pronounced nonlinear character. In CdCO3, the /dP derivative is negative, while the /da is positive, and it means that the wavenumber v decreases with the increasing P pressure and the geometric parameters of the R lattice decrease. There are no such anomalies in ZnCO3. The nonlinear dependences are also observed for the intramolecular out-of-plane ν2 vibrations in MgCO3 and ZnCO3. In CdCO3, the linear relationship with the correlation coefficient of 0.99 is retained, but the derivatives /dP and /da are equal to −0.25 cm−1/GPa, and +40 cm−1/Å, respectively.
In the lattice vibrations of the Eu(L) symmetry in MgCO3, the metal and carbon atoms move in opposite directions in the ab plane, and the oxygen atoms rotate in the c-axis direction. For the A2u(L) symmetry, the metal and carbon atoms move in the opposite directions along the c axis, and the oxygen atoms move along the c axis synchronously with the carbon atom and rotate in the ab plane. For the ν2 type vibrations, the metal and carbon atoms are displaced along the c axis, opposite to the oxygen atoms. Thus, with these fluctuations, there is a decrease in the RM-O distances and an increase in the RC-O ones.
To explain the anomalous behavior with the appearance of increasing pressure of Eu(L), A2u(L) lattice modes and the ν2 intramolecular mode, the results of chemical bond parameter calculations are used. With the increasing pressure and decreasing interatomic distances, the chemical binding strength of the atoms in the CO 3 2 group and the cationic polyhedra changes. The chemical bond can be quantitatively characterized by the amount of PA-B atom electron cloud overlap population. The overlap population on the Mg-O line equals 0.034 e (e is the electron charge), Cd-O is 0.05 e, and it does not depend on the metal-oxygen distance. Only in ZnCO3, as the distance decreases, the population increases according to PZn-O(e) = 0.077 − 0.065·(RZn-ORZn-O,0). As the RM-O distance decreases, the effective charge of the Mg2+, Cd2+ and Zn2+ cation decreases at the rates of −0.43, −0.43 and −0.88 |e|/Å, respectively. Thus, the Coulomb energy of its interaction with oxygen increases in the absolute value in MgCO3, and decreases faster in CdCO3 than in ZnCO3.
There are linear relations between the changes in the distances ΔRC-O = RC-ORC-O,0 and the C-O link population overlap: PC-O(e) = 0.3 + 3.367·ΔRC-O in MgCO3, PC-O(e) = 0.37 + 2.573·ΔRC-O in ZnCO3 and PC-O(e) = 0.469 + 1.325·ΔRC-O in CdCO3. This means that, as the RC-O distance increases, the PC-O population grows and the chemical binding strength increases. Thus, the negative shifts of Eu(L), A2u(L) and the ν2 wavenumbers under pressure are explained by the changes in the M-O and C-O chemical bonds.
In the dolomite IRS-absorption (Figure 4), as the pressure increases, the modes above 200 cm−1 shift towards larger wavenumbers, and the modes below 200 cm−1 shift towards smaller values [8]. In [14], it is shown that for the natural dolomite in the wavenumber range of 500–1800 cm−1, the v2 mode decreases with the increasing pressure at a rate of −0.13 cm−1/GPa, while for the v4 and v3 modes, the Gruneisen parameter is positive. In RS, with the increasing pressure, the lattice vibrations of Eg and Ag symmetry with wavenumbers 178, 301, 340 cm−1 increase with the velocities of 2.83. 5.53. 6.11 cm−1/GPa (2.72, 5.40, 6.79 cm−1/GPa in this contribution), respectively. For intramolecular vibrations [22], with the increasing pressure, only v2 decreases and its Gruneisen parameter is 0.01.
In [5], it is proposed to use dolomite as a pressure sensor and, in determining pressure, the empirical formula P(GPa) = 0.371·[(νLνT) − (νL0νT0)] is obtained. In our calculations for the 0–8 GPa interval, the coefficient in this formula is 0.392. Here is an example of using this formula. In [22], for lattice vibrations, derivatives T/dP, L/dP are 2.83 and 5.53 cm−1/GPa, according to which, at the pressure of 5 GPa, ΔνT = 14.15 cm−1 and ΔνL = 27.65 cm−1. Then, according to the given empirical formula, with these shifts, we get the same 5.0 GPa, and 5.3 GPa with the coefficient adopted in this paper. The use of the derivatives from Table 5 for the νT, νL experimental values allows us to obtain 5.0 and 4.9 GPa, respectively, and they coincide with the values measured in [22].
For the lattice and intramolecular vibrational modes active in the Raman spectra, except for v2, the wavenumbers have a linear dependence on the structural parameters. For example, in dolomite, for the v1 mode, the dependence on the a lattice constant has the form of ν1(cm−1) = v10 − 260·(aa0) with the correlation coefficient of 0.999. According to [38], for the pressure of 5.59 GPa, the Δa difference is 0.053 Å, which yields a shift of Δν1 = 14 cm−1 according to this formula. This value differs by 2 cm−1 from the experimental one [22].
In CaMg(CO3)2, for the IRS-active low-frequency lattice modes of Au, Eu symmetry, the wavenumbers decrease with the increasing pressure and with the decreasing structural parameters: νA2u(cm−1) = 159 + 342·(aa0), νEu(cm−1) = 168 + 186·(aa0). The Gruneisen mode parameter for the out-of-plane v2 vibration in double carbonates is negative. In CaMg(CO3), it is equal to 0.07, in CdMg(CO3)2—0.03 and in CaZn(CO3)2—0.001. The nonlinear dependences of ν2(P) and ν2(R) are observed for them, when the wavenumber practically does not change with the increasing pressure and decreasing lattice parameters. Due to the special behavior of Au, Eu lattice symmetry modes and the v2 mode, they are excluded from Table 5.
According to the data of experimental studies of active vibrations pressure dependence in the Raman spectra [6,18,57,58] the rate of increase in the v4 wavenumbers grows with the increasing pressure in strontianite, viterite and cerussite as 1.67, 1.7 and 0.72 cm−1/GPa. The linear coefficients 1.62, 2.1 and 0.72 cm−1/GPa obtained in this research are consistent with these data. The experiments in viterite [6] show a significantly higher rate for the ν1 mode—3.2 cm−1/GPa and for the ν3 mode—9.05 cm−1/GPa. In cerussite, the positions of these bands maxima, practically, do not change, while the velocities become much smaller: 2.4 and 4.4 cm−1/GPa. For the v2 PbCO3 mode, the maxima are set at 839, 838 cm−1, which, with increasing pressure, shift to lower wavenumber values with velocities of 1.38, 1.61 cm−1/GPa. The negative values of the Ag symmetry derivative v2 mode are also obtained in this research: −2.46 cm−1/GPa b SrCO3, −1.48 cm−1/GPa b BaCO3 and −1.37 cm−1/GPa in PbCO3. The low intensity modes are not given in Table 6.
It follows from Table 6 that the v4, v1 and v3 wavenumbers grow with the increasing pressure at the greater speed, the greater their v0 values are. There is a linear dependence of wavenumbers on the structural parameters. For example, in BaCO3 Δν1Ag(cm−1) = −300·(aa0). According to [45], in viterite at the pressure of 3.94 GPa, the a lattice parameter decreases by −0.042 Å, which allows to predict an increase in Δν1 by 12.6 cm−1 using this formula. It agrees well with the value of 12.61 cm−1, which is obtained in case the experimental derivative /dP from [6] is used. The decrease in the average RBa-O distance at the same pressure is −0.065 Å. Since dRBa-O/da = 1.189, the /dRBa-O coefficient will be equal to 252 cm−1/Å, which yields the increment Δν1 = 16.4 cm−1: i.e., to calculate the frequency shifts, one can use not only the lattice constants, but also the known interatomic distances.
To verify the values of the derivatives obtained in this research (Table 6), the study [50] is appropriate. In this contribution, for PbCO3, the unit cell parameters and wavenumbers under pressure were measured simultaneously by X-ray diffraction and Raman spectroscopy, respectively. Thus, at 6.6 GPa, the a lattice constant decreased by −0.0908 Å, the c constant—by −0.311 Å, while the value of the v1 wavenumber increased by 13.4 cm−1. For the distance formula at the value /da = 200 cm−1/Å, the shift is 18.2 cm−1 and 12.9 cm−1 for dv/dc = 42 cm−1/Å, i.e., the difference for the c constant is less significant. Now let us illustrate the reverse calculation, when the pressure and distances can be determined from the known experimental shift Δν1. For the quadratic dependence of Table 6, the result of 5.1 GPa is obtained. This is less than the results obtained when the inverse values of the dv/dP derivative from [58]—5.82 GPa, from [6]—5.58 GPa, from [57]—5.3 GPa are used. Taking into account the inverse values of the derivatives, the distances will be as follows: Δa = 0.067 Å, Δc = 0.319 Å. The experimental values of the wavenumber derivative, with respect to the /da lattice constant, can be obtained from the known a(P) and v(P) dependences by calculating linear coefficients (/dP)·(dP/da). Thus, according to [58], the first derivative in the product for v1 is 2.232 cm−1/GPa, the second is 75.669 GPa/Å, which gives the target value of 168.8 cm−1/Å. For the c-axis, this will be 48.2 cm−1/Å.
The experimental studies of the pressure dependence of the vibrations active in the IR spectra were performed for SrCO3 in [19], BaCO3 in [17] and PbCO3 in [16]. The maxima of the v1 band in these carbonates are 1071, 1059, 1051 cm−1, respectively, and the dν/dP velocities are 2.81, 3.8, 1.8 cm−1/GPa. Here are the results of these calculations: 3.08, 3.22, 2.5 cm−1/GPa consistent with these data. In the theoretical considerations, there is a good linear relation between the wavenumbers v4, v1 and v3, pressure and structural parameters. For example, for the B2u and B3u symmetry modes of the v3 band, in SrCO3 Δν3B2u(cm−1) = −372·(a − a0), Δν3B3u(cm−1) = −358·(aa0). The situation is different with the v2 type modes. For both B1u and B3u symmetry vibrations, the wavenumbers dependence on the pressure, as well as on the R distances, is nonlinear. The exception is BaCO3, where ν2B1u(cm−1) = 869 + 137·(aa0). For this vibration, carbon atoms in C O 3 2 move synchronously for all the molecules in the cell in the positive direction of the c axis, opposite to the oxygen atoms. In the B3u symmetry vibration, the carbon and oxygen atoms shift asynchronously so that the RC-O distances decrease for adjacent layers and increase in one layer. Because of this, the intensities of these modes differ by almost two hundredfold.

5. Conclusions

The dependence of normal long-wave v vibration wavenumbers on the P pressure: ν(cm−1) = ν0 + (/dPP + (d2ν/dP2P2 and R (a, b, c lattice constants, RM-O, RC-O interatomic distances) lattice structure parameters was studied using the density functional theory with the hybrid B3LYP function and the basis of localized atomic orbitals of the CRYSTAL17 package for carbonates with the structure of calcite, dolomite and aragonite: v(cm−1) = ν0 + (/dR)·(RR0). The inverse problem can be solved with the help of the obtained values of derivatives using the known frequency shifts Δν = vν0 and determining the pressure P(GPa) = (/dP)−1·Δν + (d2P/dv2)·Δν2 and the structural parameters: R(Å) = R0 − (dR/dP)−1·Δν. The comparison of the obtained theoretical and known experimental data confirms the efficiency of this technique.
For lattice and intramolecular vibrations active in the Raman spectra, it was obtained that the higher the pressure and the lower the structural parameters, the higher the ν0 for each type of vibrations. For the intramolecular vibrations of the ν4 type (deformations in the CO 3 2   plane ), v1 (symmetric stretching in the plane), v3 (asymmetric stretching in the plane), the Gruneisen mode parameter is usually 0.3–0.4 in calcites, dolomites and 0.1–0.2 in aragonites. The second derivative d2ν/dP2, characterizing the nonlinearity degree of the ν(P) dependence, is greater for the v3 mode in carbonates with a heavy cation.
For the low-wavenumber lattice vibrations active in the infrared spectra, it is not possible to describe the dependences of wavenumbers on pressure and structural parameters in linear or quadratic forms. In carbonates with the dolomite and otavite structure, the /dP derivatives are negative, the da/dP ones are positive; the wavenumbers decrease with the increasing pressure and increase with the decreasing a lattice constants. For the v2 mode (out-of-plane deformation displacements of CO 3 2 groups), as the pressure increases, a shift of the wavenumbers towards smaller values or nonlinear displacements towards larger ones is observed. The Gruneisen parameter is the size of −0.05 order, and the da/dP derivative is positive.
The v2 negative frequency shift is associated with the layered structure of carbonates and strong compressibility anisotropy, when the linear modulus along the c axis is 3–4 times less than in the perpendicular direction. For vibrations active in the infrared spectra, when the symmetry allows for cation atom displacements along the c axis, with carbon and oxygen atoms in the phase opposite to them, and for vibrations active in the Raman spectra, when of cation atoms displacements are forbidden, anions move towards each other, the RM-O distances decrease, and those of RC-O increase. With the increasing distances, the overlap population increases and the C-O connection increases. As the RM-O distances decrease, metal atom charges decrease, while those of oxygen increase so that their electrostatic interaction energy increases. Thus, in calcite, dolomite and aragonite structures, the v2 negative shift under pressure is explained by the strengthening of metal-oxygen bonds, and it reduces the deformation force constant outside the plane, as well as by an increase in the cation-oxygen attraction.
The analytical dependences of the vibrational mode wavenumbers on pressure or cell parameters, as obtained in the present study, can be applied in the design of pressure sensors and sensors for the determination of solid solution structure on the base of IRS and RS spectra of carbonate crystals.

Author Contributions

Conceptualization Y.N.Z. and V.V.A.; methodology, Y.N.Z.; software, Y.N.Z.; writing—review and editing, V.V.A.; funding acquisition, V.V.A. All authors have read and agreed to the published version of the manuscript.

Funding

This research was funded by Russian Science Foundation, grant number 21-19-00046.

Institutional Review Board Statement

Not applicable.

Informed Consent Statement

Not applicable.

Data Availability Statement

Not applicable.

Acknowledgments

This work was supported by the Russian Science Foundation (21-19-00046).

Conflicts of Interest

The authors declare no conflict of interest.

References

  1. Shatskiy, A.F.; Litasov, K.D.; Palyanov, Y.N. Phase relations in carbonate systems at pressures and temperatures of lithospheric mantle: Review of experimental data. Russ. Geol. Geophys. 2015, 56, 113–142. [Google Scholar] [CrossRef]
  2. Shena, J.; Lib, S.; Wang, S.; Teng, F.; LiLi, Q.; Liu, Y. Subducted Mg-rich carbonates into the deep mantle wedge. Earth Planet. Sci. Lett. 2018, 503, 118–130. [Google Scholar] [CrossRef]
  3. White, W.B. The Carbonate Minerals. In The Infrared Spectra of Minerals; Farmer, V.C., Ed.; Mineralogical Society: London, UK, 1974. [Google Scholar]
  4. Ferraro, J.R. Vibrational Spectroscopy at High External Pressures: The Diamond Anvil Cell; Academic Press: Orlando, FL, USA, 1984. [Google Scholar]
  5. Yuan, X.; Xiong, X.; Zhang, G.; Mayanovic, R.A. Application of calcite, Mg-calcite, and dolomite as Raman pressure sensors for high-pressure, high-temperature studies. J. Raman Spectrosc. 2020, 51, 1248–1259. [Google Scholar] [CrossRef]
  6. Wang, X.; Ye, Y.; Wu, X.; Smyth, J.R.; Yang, Y.; Zhang, Z.; Wang, Z. High-temperature Raman and FTIR study of aragonite-group carbonates. Phys. Chem. Miner. 2019, 46, 51–62. [Google Scholar] [CrossRef]
  7. Grzechnik, A.; Simon, P.; Gillet, P.; McMillan, P. An infrared study of MgCO3 at high pressure. Phys. B Condens. Matter 1999, 262, 67–73. [Google Scholar] [CrossRef]
  8. Clark, S.J.; Jouanna, P.; Haines, J.; Mainprice, D. Calculation of infrared and Raman vibration modes of magnesite at high pressure by density-functional perturbation theory and comparison with experiments. Phys. Chem. Miner. 2010, 38, 193–202. [Google Scholar] [CrossRef]
  9. Liang, W.; Li, Z.; Yin, Y.; Li, R.; Chen, L.; He, Y.; Dong, H.; Dai, L.; Li, H. Single crystal growth, characterization and high-pressure Raman spectroscopy of impurity-free magnesite (MgCO3). Phys. Chem. Miner. 2018, 45, 423–434. [Google Scholar] [CrossRef]
  10. Yao, C.; Wu, Z.; Zou, F.; Sun, W. Thermodynamic and elastic properties of magnesite at mantle conditions: First-principles calculations, Geochem. Geophys. Geosyst. 2018, 19, 2719–2731. [Google Scholar] [CrossRef]
  11. Binck, J.; Bayarjargal, L.; Lobanov, S.S.; Morgenroth, W.; Luchitskaia, R.; Pickard, C.J.; Milman, V.; Refson, K.; Jochym, D.B.; Byrne, P.; et al. Phase stabilities of MgCO3 and MgCO3-II studied by Raman spectroscopy, X-ray diffraction, and density functional theory calculations. Phys. Rev. Mater. 2020, 4, 055001. [Google Scholar] [CrossRef]
  12. Liu, J.; Caracas, R.; Fan, D.; Bobocioiu, E.; Zhang, D.; Mao, W.L. High-pressure compressibility and vibrational properties of (Ca,Mn)CO3. Am. Miner. 2016, 101, 2723–2730. [Google Scholar] [CrossRef]
  13. Minch, R.; Seoung, D.-H.; Ehm, L.; Winkler, B.; Knorr, K.; Peters, L.; Borkowski, L.A.; Parise, J.B.; Lee, Y.; Dubrovinsky, L.; et al. High-pressure behavior of otavite (CdCO3). J. Alloys Compd. 2010, 508, 251–257. [Google Scholar] [CrossRef]
  14. Efthimiopoulos, I.; Jahn, S.; Kuras, A.; Schade, U.; Koch-Muller, M. Combined high-pressure and high-temperature vibrational studies of dolomite: Phase diagram and evidence of a new distorted modification. Phys. Chem. Miner. 2017, 44, 465–476. [Google Scholar] [CrossRef]
  15. Efthimiopoulos, I.; Germer, M.; Jahn, S.; Harms, M.; Reichmann, H.J.; Speziale, S.; Schade, U.; Sieber, M.; Koch-Müller, M. Effects of hydrostaticity on the structural stability of carbonates at lower mantle pressures: The case study of dolomite. High Press. Res. 2018, 39, 1–14. [Google Scholar] [CrossRef] [Green Version]
  16. Catalli, K.; Santillan, J.; Williams, Q. A high pressure infrared spectroscopic study of PbCO3-cerussite: Constraints on the structure of the post-aragonite phase. Phys. Chem. Miner. 2005, 32, 412–417. [Google Scholar] [CrossRef]
  17. Chaney, J.; Santillán, J.D.; Knittle, E.; Williams, Q. High-pressure infrared and Raman spectroscopic study of BaCO3: The aragonite, trigonal and Pmmn structures. Phys. Chem. Miner. 2015, 42, 83–93. [Google Scholar] [CrossRef]
  18. Biedermann, N.; Speziale, S.; Winkler, B.; Reichmann, H.J.; Koch-Muller, M.; Heide, G. High-pressure phase behavior of SrCO3: An experimental and computational Raman scattering study. Phys. Chem. Miner. 2017, 44, 335–343. [Google Scholar] [CrossRef] [Green Version]
  19. Efthimiopoulos, I.; Muller, J.; Winkler, B.; Otzen, C.; Harms, M.; Schade, U.; Koch-Muller, M. Vibrational response of strontianite at high pressures and high temperatures and construction of PT phase diagram. Phys. Chem. Miner. 2019, 46, 27–35. [Google Scholar] [CrossRef]
  20. Gillet, P.; Biellmann, C.; Reynard, B.; McMillan, P. Raman Spectroscopic studies of carbonates. Part I: High-pressure and high-temperature behavior of Calcite, Magnesite, Dolomite and Aragonite. Phys. Chem. Miner. 1993, 20, 1–18. [Google Scholar] [CrossRef]
  21. Matas, J.; Gillet, P.; Ricard, Y.; Meartinez, I. Thermodynamic properties of carbonates at high pressures from vibrational modelling. Eur. J. Miner. 2000, 12, 703–720. [Google Scholar] [CrossRef]
  22. Farsang, S.; Facq, S.; Redfern, S.A.T. Raman modes of carbonate minerals as pressure and temperature gauges up to 6 GPa and 500 °C. Am. Miner. 2018, 103, 1988–1998. [Google Scholar] [CrossRef]
  23. Zhuravlev, Y.N.; Korabel’nikov, D.V. An ab initio study of the vibrational properties of alkaline-earth metal nitrates and their crystallohydrates. Opt. Spectr. 2017, 122, 929–936. [Google Scholar] [CrossRef]
  24. Atuchin, V.V.; Liang, F.; Grazhdannikov, S.; Isaenko, L.I.; Krinitsin, P.G.; Molokeev, M.S.; Prosvirin, I.P.; Jiang, X.; Lin, Z. Negative thermal expansion and electronic structure variation of chalcopyrite type LiGaTe2. RSC Adv. 2018, 8, 9946–9955. [Google Scholar] [CrossRef] [Green Version]
  25. Plazyan, T.L.; Zhuravlev, Y.N. The first-principle studies of the elastic, electronic, and vibrational properties of L-alanine. Struct. Chem. 2019, 30, 1243–1255. [Google Scholar] [CrossRef]
  26. Vinnik, D.A.; Prosvirin, I.P.; Zhivulin, V.E.; Wang, N.; Jiang, X.; Trofimov, E.A.; Zaitseva, O.V.; Gudkova, S.A.; Nemrava, S.; Zherebtsov, D.A.; et al. Crystal growth, structural characteristics and electronic structure of Ba1-xPbxFe12O19 (x = 0.23 − 0.80) hexaferrites. J. Alloys Compd. 2020, 844, 156036. [Google Scholar] [CrossRef]
  27. Korabel’nikov, D.V.; Zhuravlev, Y.N. Semi-empirical calculations for crystals under pressure at fixed temperatures: The case of guanidinium perchlorate. RSC Adv. 2020, 10, 42204–42211. [Google Scholar] [CrossRef]
  28. Denisenko, Y.G.; Atuchin, V.V.; Molokeev, M.S.; Wang, N.; Jiang, X.; Aleksandrovsky, A.S.; Krylov, A.S.; Oreshonkov, A.S.; Sedykh, A.E.; Volkova, S.S.; et al. Klaus Müller-Buschbaum, Negative thermal expansion in one-dimension of a new double sulfate AgHo(SO4)2 with isolated SO4 tetrahedra. J. Mater. Sci. Technol. 2021, 76, 111–121. [Google Scholar] [CrossRef]
  29. Moroz, T.N.; Edwards, H.G.M.; Zhmodik, S.M. Detection of carbonate, phosphate minerals and cyanobacteria in rock from the Tomtor deposit, Russia, by Raman spectroscopy. Spectrochim. Acta Part Mol. Biomol. Spectrosc. 2021, 250, 119372. [Google Scholar] [CrossRef]
  30. Gao, J.; Yuan, X.; Chen, B.; Liu, Z.; Su, W. High-pressure phase transformation of carbonate malachite Cu2(CO3) (OH)2 driven by [CuO6] regularization and [CO3] rotation. Geosci. Front. 2021, 12, 965–973. [Google Scholar] [CrossRef]
  31. Hollis, J.R.; Ireland, S.; Abbey, W.; Bhartia, R.; Beegle, L.W. Deep-ultraviolet Raman spectra of Mars-relevant evaporite minerals under 248.6 nm excitation. Icarus 2021, 357, 114067. [Google Scholar] [CrossRef]
  32. Erba, A.; Baima, J.; Bush, I.; Orlando, R.; Dovesi, R. Large-scale condensed matter DFT simulations: Performance and capabilities of the CRYSTAL code. J. Chem. Theory Comput. 2017, 13, 5019–5027. [Google Scholar] [CrossRef]
  33. Dovesi, R.; Erba, A.; Orlando, R.; Zicovich-Wilson, C.M.; Civalleri, B.; Maschio, L.; Rérat, M.; Casassa, S.; Baima, J.; Salustro, S.; et al. Quantum-mechanical condensed matter simulations with CRYSTAL. Wiley Interdiscip. Rev. Comput. Mol. Sci. 2018, 8, e1360. [Google Scholar] [CrossRef]
  34. Becke, A.D. Density-functional thermochemistry. III. The role of exact exchange. J. Chem. Phys. 1993, 98, 5648–5652. [Google Scholar] [CrossRef] [Green Version]
  35. Lee, C.; Yang, W.; Parr, R.G. Development of the Colle-Salvetti correlation-energy formula into a functional of the electron density. Phys. Rev. B 1988, 37, 785–789. [Google Scholar] [CrossRef] [PubMed] [Green Version]
  36. Valenzano, L.; Torres, F.J.; Doll, K.; Pascale, F.; Zicovich-Wilson, C.M.; Dovesi, R. Ab Initio study of the vibrational spectrum and related properties of crystalline compounds; the case of CaCO3 calcite. Z. Phys. Chem. 2006, 220, 893–912. [Google Scholar] [CrossRef]
  37. Laun, J.; Oliveira, D.V.; Bredow, T. Consistent gaussian basis sets of double- and triple-zeta valence with polarization quality of the fifth period for solid-state calculations. J. Comput. Chem. 2018, 39, 1285–1290. [Google Scholar] [CrossRef] [PubMed]
  38. Piskunov, S.; Heifets, E.; Eglitis, R.I.; Borstel, G. Bulk properties and electronic structure of SrTiO3, BaTiO3, PbTiO3 perovskites: An ab initio HF/DFT study. Comp. Mat. Sci. 2004, 29, 165–178. [Google Scholar] [CrossRef]
  39. Sophia, G.; Baranek, P.; Sarrazin, C.; Rerat, M.; Dovesi, R. First-principles study of the mechanisms of the pressure-induced dielectric anomalies in ferroelectric perovskites. Phase Trans. Multinat. J. 2013, 86, 1069–1084. [Google Scholar] [CrossRef]
  40. Monkhorst, H.J.; Pack, J.D. Special points for Brillouin-zone integrations. Phys. Rev. B 1976, 13, 5188–5192. [Google Scholar] [CrossRef]
  41. Pascale, F.; Zicovich-Wilson, C.M.; Lopez, F.; Civalleri, B.; Orlando, R.; Dovesi, R. The calculation of the vibration frequencies of crystalline compounds and its implementation in the CRYSTAL code. J. Comput. Chem. 2004, 25, 888–897. [Google Scholar] [CrossRef]
  42. Zicovich-Wilson, C.M.; Pascale, F.; Roetti, C.; Saunders, V.R.; Orlando, R.; Dovesi, R. The calculation of the vibration frequencies of alpha-quartz: The efect of Hamiltonian and basis set. J. Comput. Chem. 2004, 25, 1873–1881. [Google Scholar] [CrossRef]
  43. Baima, J.; Ferrabone, M.; Orlando, R.; Erba, A.; Dovesi, R. Thermodynamics and phonon dispersion of pyrope and grossular silicate garnets from ab initio simulations. Phys. Chem. Miner. 2016, 43, 137–149. [Google Scholar] [CrossRef] [Green Version]
  44. Birch, F. Finite strain isotherm and velocities for single-crystal and polycrystalline NaCl at high pressures and 300 °K. J. Geophys. Res. 1978, 83, 1257–1268. [Google Scholar] [CrossRef]
  45. Gao, J.; Zhu, F.; Lai, X.; Huang, R.; Qin, S.; Chen, D.; Liu, J.; Zheng, L.; Wu, X. Compressibility of a natural smithsonite ZnCO3 up to 50 GPa. High Press. Res. 2014, 34, 89–99. [Google Scholar] [CrossRef]
  46. Bromiley, F.A.; Ballaran, T.B.; Langenhorst, F.; Seifert, F. Order and miscibility in the otavite-magnesite solid solution locality: Synthetic. Am. Miner. 2007, 92, 829–836. [Google Scholar] [CrossRef]
  47. Zucchini, A.; Comodi, P.; Nazzareni, S.; Hanfland, M. The effect of cation ordering and temperature on the high-pressure behaviour of dolomite. Phys. Chem. Miner. 2014, 41, 783–793. [Google Scholar] [CrossRef]
  48. Garavelli, C.G.; Vurro, F.; Fioravanti, G.C. Minrecordite, a new mineral from Tsumeb. Mineral. Rec. 1982, 13, 131–136. [Google Scholar]
  49. Graf, D.L. Crystallographic tables for the rhombohedral carbonates. Am. Miner. 1961, 46, 1283–1316. [Google Scholar]
  50. Ye, Y.; Smyth, J.R.; Boni, P. Crystal structure and thermal expansion of aragonite-group carbonates by single-crystal X-ray diffraction. Am. Miner. 2012, 97, 707–712. [Google Scholar] [CrossRef]
  51. Zhuravlev, Y.N.; Atuchin, V.V. Comprehensive density functional theory studies of vibrational spectra of carbonates. Nanomaterials 2020, 10, 2275. [Google Scholar] [CrossRef]
  52. Shannon, R.D. Revised effective ionic radii and systematic studies of interatomic distances in halides and chalcogenides. Acta Cryst. A 1976, 32, 751–767. [Google Scholar] [CrossRef]
  53. Fiquet, G.; Reynard, B. High-pressure equation of state of magnesite: New data and a reappraisal. Am. Miner. 1999, 84, 856–860. [Google Scholar] [CrossRef]
  54. Holl, C.M.; Smyth, J.R.; Lausten, H.M.S.; Jacobsen, S.D.; Downs, R.T. Compression of witherite to 8 GPa and the crystal structure of BaCO3 II. Phys. Chem. Miner. 2000, 27, 467–473. [Google Scholar] [CrossRef]
  55. Dovesi, R.; Saunders, V.R.; Roetti, C.; Orlando, R.; Zicovich-Wilson, C.M.; Pascale, F.; Civalleri, B.; Doll, K.; Harrison, N.M.; Bush, I.J.; et al. CRYSTAL17 User’s Manual, Università di Torino, Torino. 2017. Available online: http://www.crystal.unito.it/news.php (accessed on 19 May 2021).
  56. Gao, J.; Liu, Y.; Wu, X.; Yuan, X.; Liu, Y.; Su, W. Structural modifications of single-crystal aragonite CaCO3 beginning at ~15 GPa: In situ vibrational spectroscopy and X-ray difraction evidence. Minerals 2020, 10, 924. [Google Scholar] [CrossRef]
  57. Minch, R.; Dubrovinsky, L.; Kurnosov, A.; Ehm, L.; Knorr, K.; Depmeier, W. Raman spectroscopic study of PbCO3 at high pressures and temperatures. Phys. Chem. Miner. 2010, 37, 45–56. [Google Scholar] [CrossRef]
  58. Gao, J.; Wu, X.; Qin, S.; Li, Y.C. Pressure-induced phase transformations of PbCO3 by X-ray diffraction and Raman spectroscopy. High Press. Res. 2016, 36, 1–15. [Google Scholar] [CrossRef]
Figure 1. Crystal structures of (a) MgCO3 (calcite), (b) CdMg(CO3)2 (dolomite) and (c) SrCO3 (aragonite). The unit cells are outlined. Lone atoms, except for those in the unit cells, are omitted for clarity.
Sensors 21 03644 g001
Figure 2. Infrared (top) and Raman (bottom) spectra of MgCO3 (red), CaMg(CO3)2 (blue) and SrCO3 (black). ×10 means that the intensity of the corresponding line should be increased 10 times.
Sensors 21 03644 g002
Figure 3. Calculated (the calculation is solid lines, squares, circles and triangles—the experiment) dependences of MgCO3 vibrational modes wavenumbers on the P pressure, active in the Raman spectrum (on the left, squares—the data from [20], triangles from [22], circles from [9]) and the infrared spectrum (on the right, squares—the data from [7]).
Sensors 21 03644 g003
Figure 4. Calculated dependence of lattice and intramolecular vibrational mode wavenumbers (solid lines) of CaMg(CO3)2 on the P pressure, active in the Raman spectrum (left: squares illustrate experimental data from [14], triangles—from [22], circles—from [20]) and the infrared spectrum (right: squares from [14], triangles from [8]).
Sensors 21 03644 g004
Table 1. Calculated lattice constants a (a, b for aragonites), c and RM-O distances between metal atom M and oxygen O (M1-O, M2-O for double carbonates M1M2 (CO3)2), RC-O of carbon C and oxygen O.
Carbonatea(b), Åc, ÅRM-O, ÅRC-O, Å
MgCO34.66215.1892.1231.286
ZnCO34.70915.1302.1341.297
CdCO34.98216.6162.3311.287
CdMg(CO3)24.81415.8632.345, 2.1061.286
CaMg(CO3)24.83816.2562.409, 2.1051.286
CaZn(CO3)24.85616.2962.393, 2.1361.287
SrCO35.147, 8.4426.1952.6841.288
PbCO35.245, 8.5726.3732.7451.290
BaCO35.367, 8.9336.6852.8571.291
Table 2. Equilibrium volume of unit cell per one formula unit V0/Z, volume compression modulus B0 and its pressure derivative B1, linear compression moduli along the a (b for the aragonite structure), c-Ba (Bb), Bc crystallographic axes and the metal-oxygen BM-O interatomic distances (M1-O, M2-O for double carbonates M1M2(CO3)2), and BC-O for carbon-oxygen ones.
CarbonateV0/Z, Å3B0, GPa B1Ba (Bb), GPaBc,
GPa
BM1-O (BM2-O), GPaBC-O,
GPa
MgCO347.64107.114.285392383261749
ZnCO348.41123.04.916922483841768
CdCO359.5397.843.528941593191508
CdMg(CO3)253.06100.384.86601189340 (286)1589
CaMg(CO3)254.9288.824.33522169269 (276)1508
CaZn(CO3)255.4793.394.89587189287 (325)1577
SrCO367.2963.273.45397 (328)1252681422
PbCO371.6356.214.01403 (496)1003941675
BaCO380.1354.392.74477 (434)882081740
Table 3. E0 zero vibrations energy per formula unit and its P pressure derivatives.
CarbonateE0, kJ/moldE0/dP,
kJ/(mol·GPa)
d2E0/dP2, kJ/(mol·GPa2)
MgCO351.2010.359−0.006
ZnCO349.3560.255−0.002
CdCO346.2090.243−0.003
CaMg(CO3)249.1090.308−0.004
CdMg(CO3)248.7590.305−0.005
CaZn(CO3)247.6130.314−0.007
SrCO346.3460.2400.017
BaCO345.2110.322−0.003
PbCO342.7740.386−0.008
Table 4. Wavenumbers ν0 (cm1) of the intramolecular modes active in the infrared (IRS) and Raman (RS) spectra of the carbonates with the calcite structure, their first /dP (cm−1/GPa) and second d2ν/dP2 (cm−1/GPa2)) P pressure derivatives. The second pressure derivative is given with respect to the d2P/2 (GPa2/cm−1) wavenumber and the wavenumber derivative—with respect to the dv/da (cm−1/Å) lattice constant.
ModeLattice ModesInternal Modes
SymmetryEgEgEg(ν4)A1g(ν1)Eg(ν3)
MgCO3, RS
ν0
dν/dP
d2ν/dP2
d2P/2 × 10−3
dv/da
20832373710991444
4.2145.5412.904.3785.567
−0.069−0.078−0.072−0.143−0.11
1.470.6066.344.421.06
−416−600−261−360−530
ZnCO3, RS
ν0
dν/dP
d2ν/dP2
d2P/2 × 10−3
dv/da
20830672311051457
3.1534.6111.2032.7045.426
0.006−0.0180.0420.001−0.114
−0.448−3.706−15.730.97712.7
−470−653−231−398−649
CdCO3, RS
ν0
dν/dP
d2ν/dP2
d2P/2 × 10−3
dv/da
15625971310931395
2.6484.9451.9383.7596.925
0.017−0.047−0.005−0.004−0.149
−7.3085.11110.771.8929.039
−452−736−306−603−918
SymmetryEu (T)Eu (T)A2u (T)Eu (ν4)Eu3)
MgCO3, IRS
ν0
dν/dP
d2ν/dP2
d2P/2 × 10−3
dv/da
3013443517461424
6.6289.2359.7383.1285.126
−0.104−0.144−0.116−0.049−0.087
0.5560.2820.1712.641.023
−659−919−1005−311−503
ZnCO3, IRS
ν0
dν/dP
d2ν/dP2
d2P/2 × 10−3
dv/da
2122873487351447
1.3525.7614.361.7254.95
0.036−0.040.0780.04−0.09
−6.443−0.262−0.475−2.666−1.215
−245−794−740−305−610
CdCO3, IRS
ν0
/dP
d2ν/dP2
d2P/dν2 × 10−3
dv/da
1582673037221388
1.6166.2746.3392.2955.326
0.035−0.095−0.0750.003−0.041
−4.8690.5900.422−0.0480.339
−310−887−925−375−807
Table 5. Wavenumbers ν0 (cm1) of intramolecular modes active in the infrared (IRS) and Raman (RS) spectra of carbonates with a dolomite structure, their first dν/dP (cm−1/GPa) and second d2ν/dP2 (cm−1/GPa2) derivatives, with respect to the P pressure; the second pressure derivative, with respect to the wavenumber d2P/2 (GPa2/cm−1), and the wavenumber derivative, with respect to the dv/da (cm−1/Å) lattice constant.
ModeLattice ModesInternal Modes
SymmetryEgAgEgAgEg(ν4)Ag(ν1)Eg(ν3)
CaMg(CO3)2, RS
ν0
/dP
d2ν/dP2
d2P/dν2 ×10−3
dv/da
17523529633672310971437
2.7191.4025.3976.7892.734.5966.01
−0.020.032−0.041−0.09−0.05 −0.099−0.109
−1.114−7.874−0.300.3663.4731.6070.740
−279−171−552−670−260−260−573
CdMg(CO3)2, RS
ν0
/dP
d2ν/dP2
γ
d2P/dν2 × 10−3
dv/da
18325828636572510981419
3.5162.4315.5626.0942.2583.7935.437
−0.071−0.011−0.08−0.04−0.042−0.045−0.07
1.930.941.951.680.310.350.38
2.430.91−0.0140.206.6851.2020.577
−383−293−629−726−249−437−622
CaZn(CO3)2, RS
ν0
/dP
d2ν/dP2
d2P/dν2 × 10−3
dv/da
16523328335071910951416
3.4291.7965.5667.7432.6223.9925.209
−0.088−0.041−0.072−0.204−0.069−0.059−0.007
4.6610.0160.6020.9258.811.50.043
−320−173−592−717−243−417−618
SymmetryEuAuEuAuEu(ν4)Au(ν1)Eu(ν3)
CaMg(CO3)2, IRS
ν0
/dP
d2ν/dP2γ
d2P/dν2 × 10−3
dv/da
25830433735272710981416
5.267.2989.3166.6472.9724.5385.6109
−0.078−0.168−0.1620.022−0.041−0.076−0.112
0.7330.7020.288−0.0692.0031.1430.966
−513−673−893−727−292−437−528
CdMg(CO3)2, IRS
ν0
/dP
d2ν/dP2
d2P/dν2 × 10−3
dv/da
23628533835473310981407
2.3152.8768.9818.1192.6273.9645.061
−0.017−0.064−0.181−0.091−0.022−0.06−0.046
−9.9994.620.3780.2322.3161.4010.457
−274−308−977−938−309−446−593
CaZn(CO3)2, IRS
ν0
/dP
d2ν/dP2
d2P/dν2 × 10−3
dv/da
18924229031072410941400.9
4.9783.4538.1399.4312.9484.0894.67
−0.118−0.084−0.18−0.171−0.066−0.0640.013
1.8954.1710.6220.3445.1791.543−0.128
−475−327−790−954−285−424−573
Table 6. Wavenumbers ν0 (cm−1) of the v4, v2, v1 and v3 intramolecular modes of carbonates with the aragonite structure; their first /dP (cm−1/GPa) and second d2ν/dP2 (cm−1/GPa2) P pressure derivatives; the second pressure derivative d2P/2 (GPa2/cm−1), with respect to the wavenumber, and the wavenumber derivative dv/da (cm−1/Å), with respect to the lattice constant.
Modeν4ν1ν3
SymmetryAgB1gB3gAgAgB3gB2g
SrCO3, RS
ν0
/dP
d2ν/dP2
d2P/dν2 × 10−3
dv/da
7047047081080145314531567
4.6931.5461.8443.6323.6494.1234.479
−0.4470.012−0.006−0.103−0.0080.0270.11
-0.9684.2342.909−0.959−0.236−0.886
-−124−139−234−276−328−391
BaCO3, RS
ν0
/dP
d2ν/dP2
d2P/dν2 × 10−3
dv/da
6946967001066142614301528
2.2641.922.2753.6724.7424.7396.239
0.0390.0310.04−0.043−0.349−0.067−0.24
−3.024−4.593−3.1920.7688.0810.8222.967
−217−183−218−300−244−382−429
PbCO3, RS
ν0
/dP
d2ν/dP2
d2P/dν2 × 10−3
dv/da
6806786881068138413941487
1.0061.0672.0253.2615.3082.4058.416
0.012−0.054−0.067−0.1−0.2480.198−0.37
−2.2551120165.4024.669−0.6981.654
−80.5−55.9−122−200−288−266−467
SymmetryB2uB3uB1uB1uB2uB1uB3u
SrCO3, IRS
ν0
/dP
d2ν/dP2
d2P/dν2 × 10−3
dv/da
7017087181079144114481457
1.7542.1762.4183.0634.4274.1624.306
0.000.0290.01−0.0170.0750.0670.063
3.915−1.6720.3400.094−0.584−0.889−0.717
−134−180−91−229−372−349−358
BaCO3, IRS
ν0
/dP
d2ν/dP2
d2P/dν2 × 10−3
dv/da
6956977071066142614201431
2.2982.4712.7913.6475.4415.7895.92
0.040.0310.037−0.049−0.077−0.33−0.233
3.1−2.038−1.5490.9120.6134.2942.27
−221−231−262−295−439−345−404
PbCO3, IRS
ν0
/dP
d2ν/dP2
d2P/dν2 × 10−3
dv/da
6846827021066140213901395
1.8261.1042.1963.0332.7336.1437.152
−0.0630.010.013−0.1050.208−0.237−0.294
21.0−0.641−0.8047.777−0.6042.3751.999
−109−87.0−170−180−295−355−405
Publisher’s Note: MDPI stays neutral with regard to jurisdictional claims in published maps and institutional affiliations.

