Development and Evaluation of a New Spectral Disease Index to Detect Wheat Fusarium Head Blight Using Hyperspectral Imaging

Abstract
:
1. Introduction
2. Materials and Methods
2.1. Wheat Material
2.2. Inoculum Production
2.3. Data Acquisition and Processing
2.3.1. Spectral Measurements
2.3.2. Calculation of Disease Severity
2.3.3. Characteristic Band Selection
2.4. Construction of Proposed New Spectral Disease Index for Indentifing Wheat FHB
2.5. Traditional Spectral Indices for Wheat FHB Detection
2.6. Linear Regression Model and Validation
3. Results and Analysis
3.1. Spectral Response Differences of Wheat FHB with Different Disease Severities
3.2. Construction of Proposed New Spectral Disease Index for Identifying Wheat FHB
3.2.1. Characteristic Bands for Identifying FHB at Different Growth Stages
3.2.2. Construction of New Fusarium Disease Index for Identifying Wheat FHB
3.3. Comparison of FDI and Traditional Spectral Indices
4. Discussion
4.1. Analysis of Spectral Characteristics for Identifying Wheat FHB
4.2. Comparison of Application Effects between Proposed New FDI and Traditional Spectral Indices
4.3. Analysis of Other Influential Factors
5. Conclusions
Author Contributions
Funding
Conflicts of Interest
References
- Gilbert, J.; Tekauz, A. Recent developments in research on Fusarium head blight of wheat in Canada. Can. J. Plant Pathol. 2000, 22, 1–8. [Google Scholar] [CrossRef]
- Mcmullen, M.; Jones, R.; Gallenberg, D. Scab of wheat and barley: A Reemerging disease of devastating impact. Plant Dis. 1997, 81, 1340–1348. [Google Scholar] [CrossRef] [Green Version]
- Lu, J.; Ehsani, R.; Shi, Y.; de Castro, A.I.; Wang, S. Detection of multi-tomato leaf diseases (late blight, target and bacterial spots) in different stages by using a spectral-based sensor. Sci. Rep. 2018, 8, 2793. [Google Scholar] [CrossRef] [Green Version]
- Yuan, L.; Zhang, H.; Zhang, Y.; Xing, C.; Bao, Z. Feasibility assessment of multi-spectral satellite sensors in monitoring and discriminating wheat diseases and insects. Int. J. Light Electron. Opt. 2017, 131, 598–608. [Google Scholar] [CrossRef]
- Zheng, Q.; Huang, W.J.; Cui, X.M.; Dong, Y.Y.; Shi, Y.; Ma, H.Q.; Liu, L.Y. Identification of Wheat Yellow Rust Using Optimal Three-Band Spectral Indices in Different Growth Stages. Sensors 2019, 19, 35. [Google Scholar] [CrossRef] [PubMed] [Green Version]
- Huang, W.J.; Guan, Q.S.; Luo, J.H.; Zhang, J.C.; Zhao, J.L.; Liang, D.; Huang, L.S.; Zhang, D.Y. New optimized spectral indices for identifying and monitoring winter wheat diseases. IEEE J. Sel. Top. Appl. Earth Obs. Remote Sens. 2014, 7, 2516–2524. [Google Scholar] [CrossRef]
- Bauriegel, E.; Giebel, A.; Geyer, M.; Schmidt, U.; Herppich, W.B. Early detection of fusarium infection in wheat using hyper-spectral imaging. Comput. Electron. Agric. 2011, 75, 304–312. [Google Scholar] [CrossRef]
- Zhang, N.; Pan, Y.C.; Feng, H.K.; Zhao, X.Q.; Yang, X.D.; Ding, C.L.; Yang, G.J. Development of Fusarium head blight classification index using hyperspectral microscopy images of winter wheat spikelets. Biosyst. Eng. 2019, 183, 83–99. [Google Scholar] [CrossRef]
- Weber, V.S.; Araus, J.L.; Cairns, J.E.; Sanchez, C.; Melchinger, A.E.; Orsini, E. Prediction of grain yield using reflectance spectra of canopy and leaves in maize plants grown under different water regimes. Field Crop. Res. 2012, 128, 82–90. [Google Scholar] [CrossRef]
- Bannari, A.; Khurshid, K.S.; Staenz, K.; Schwarz, J.W. A Comparison of Hyperspectral Chlorophyll Indices for Wheat Crop Chlorophyll Content Estimation Using Laboratory Reflectance Measurements. IEEE Trans. Geosci. Remote Sens. 2007, 45, 3063–3074. [Google Scholar] [CrossRef]
- Zhang, J.; Pu, R.; Huang, W.; Yuan, L.; Luo, J.; Wang, J. Using in-situ hyperspectral data for detecting and discriminating yellow rust disease from nutrient stresses. Field Crop. Res. 2012, 134, 165–174. [Google Scholar] [CrossRef]
- Fensholt, R.; Huber, S.; Proud, S.R.; Mbow, C. Detecting Canopy Water Status Using Shortwave Infrared Reflectance Data from Polar Orbiting and Geostationary Platforms. IEEE J. Sel. Top. Appl. Earth Obs. Remote Sens. 2010, 3, 271–285. [Google Scholar] [CrossRef]
- Devadas, R.; Lamb, D.W.; Simpfendorfer, S.; Backhouse, D. Evaluating ten spectral vegetation indices for identifying rust infection in individual wheat leaves. Precis. Agric. 2009, 10, 459–470. [Google Scholar] [CrossRef]
- Rumpf, T.; Mahlein, A.K.; Steiner, U.; Oerke, E.C.; Dehne, H.W.; Plümer, L. Early detection and classification of plant diseases with Support Vector Machines based on hyperspectral reflectance. Comput. Electron. Agric. 2010, 74, 91–99. [Google Scholar] [CrossRef]
- Feng, W.; Shen, W.; He, L.; Duan, J.; Guo, B.; Li, Y.; Wang, C.; Guo, T. Improved remote sensing detection of wheat powdery mildew using dual-green vegetation indices. Precis. Agric. 2016, 17, 608–627. [Google Scholar] [CrossRef]
- Breiman, L. Random forests. Mach. Learn. 2001, 45, 5–32. [Google Scholar] [CrossRef] [Green Version]
- Zhang, C.; Jiang, H.; Liu, F.; He, Y. Application of near-infrared hyperspectral imaging with variable selection methods to determine and visualize caffeine content of coffee beans. Food Bioproc. Technol. 2016, 1, 213–221. [Google Scholar] [CrossRef]
- Zhao, Y.R.; Yu, K.Q.; He, Y. Hyperspectral imaging coupled with random frog and calibration models for assessment of total soluble solids in mulberries. J. Anal. Methods Chem. 2015, 2015, 343782. [Google Scholar] [CrossRef] [Green Version]
- Fan, W.L.; Hu, P.; Liu, Z.G. Multi-attribute node importance evaluation method based on Gini-coefficient in complex power grids. IET Gener. Transm. Distrib. 2016, 10, 2027–2034. [Google Scholar]
- Mahlein, A.K.; Rumpf, T.; Welke, P.; Dehne, H.W.; Plümer, L.; Steiner, U.; Oerke, E.C. Development of spectral indices for detecting and identifying plant diseases. Remote Sens. Environ. 2013, 128, 21–30. [Google Scholar] [CrossRef]
- Filella, I.; Serrano, L.; Serra, J.; Penuelas, J. Evaluating wheat nitrogen status with canopy reflectance indices and discriminant analysis. Crop Sci. 1995, 35, 1400–1405. [Google Scholar] [CrossRef]
- Gamon, J.A.; Penuelas, J.; Field, C.B. A narrow-waveband spectral index that tracks diurnal changes in photosynthetic efficiency. Remote Sens. Environ. 1992, 41, 35–44. [Google Scholar] [CrossRef]
- Broge, N.H.; Leblanc, E. Comparing prediction power and stability of broadband and hyperspectral vegetation indices for estimation of green leaf area index and canopy chlorophyll density. Remote Sens. Environ. 2001, 76, 156–172. [Google Scholar] [CrossRef]
- Haboudane, D.; Miller, J.R.; Pattey, E.; Zarco-Tejada, P.J.; Strachan, I.B. Hyperspectral vegetation indices and novel algorithms for predicting green LAI of crop canopies: Modeling and validation in the context of precision agriculture. Remote Sens. Environ. 2004, 90, 337–352. [Google Scholar] [CrossRef]
- Daughtry, C.S.; Walthall, C.L.; Kim, M.S.; De Colstoun, E.B.; McMurtrey Iii, J.E. Estimating corn leaf chlorophyll concentration from leaf and canopy reflectance. Remote Sens. Environ. 2000, 74, 229–239. [Google Scholar] [CrossRef]
- Merton, R.; Huntington, J. Early simulation results of the ARIES-1 satellite sensor for multi-temporal vegetation research derived from AVIRIS. In Proceedings of the Eighth Annual JPL Airborne Earth Science Workshop, Pasadena, CA, USA, 9–11 February 1999; pp. 9–11. [Google Scholar]
- Merzlyak, M.N.; Gitelson, A.A.; Chivkunova, O.B.; Rakitin, V.Y. Non-destructive optical detection of pigment changes during leaf senescence and fruit ripening. Physiol. Plant. 1999, 106, 135–141. [Google Scholar] [CrossRef] [Green Version]
- Zarco-Tejada, P.J.; Berjón, A.; López-Lozano, R.; Miller, J.R.; Martín, P.; Cachorro, V.; González, M.R.; De Frutos, A. Assessing vineyard condition with hyperspectral indices: Leaf and canopy reflectance simulation in a row-structured discontinuous canopy. Remote Sens. Environ. 2005, 99, 271–287. [Google Scholar] [CrossRef]
- Peñuelas, J.; Baret, F.; Filella, I. Semi-empirical indices to assess carotenoids/chlorophyll a ratio from leaf spectral reflectance. Photosynthetica 1995, 31, 221–230. [Google Scholar]
- Peñuelas, J.; Gamon, J.A.; Fredeen, A.L.; Merino, J.; Field, C.B. Reflectance indices associated with physiological changes in nitrogen-and water-limited sunflower leaves. Remote Sens. Environ. 1994, 48, 135–146. [Google Scholar] [CrossRef]
- Schell, J.A. Monitoring Vegetation Systems in the Great Plains with ERTS. NASA Spec. Publ. 1973, 351, 309. [Google Scholar]
- Rondeaux, G.; Steven, M.; Baret, F. Optimization of soil-adjusted vegetation indices. Remote Sens. Environ. 1996, 55, 95–107. [Google Scholar] [CrossRef]
- Lichtenthaler, H.K.; Gitelson, A.; Lang, M. Non-destructive determination of chlorophyll content of leaves of a green and an aurea mutant of tobacco by reflectance measurements. J. Plant Physiol. 1996, 148, 483–493. [Google Scholar] [CrossRef]
- Lichtenthaler, H.K.; Lang, M.; Sowinska, M.; Heisel, F.; Miehe, J.A. Detection of vegetation stress via a new high resolution fluorescence imaging system. J. Plant Physiol. 1996, 148, 599–612. [Google Scholar] [CrossRef]
- Gitelson, A.A.; Merzlyak, M.N.; Chivkunova, O.B. Optical properties and nondestructive estimation of anthocyanin content in plant leaves. Photochem. Photobiol. 2001, 74, 38–45. [Google Scholar] [CrossRef]
- Zhang, D.; Xu, Y.; Huang, W.; Tian, X.; Xia, Y.; Xu, L.; Fan, S. Nondestructive measurement of soluble solids content in apple using near infrared hyperspectral imaging coupled with wavelength selection algorithm. Infrared Phys. Technol. 2019, 98, 297–304. [Google Scholar] [CrossRef]


| Full Name of Spectral Index | Spectral Index Abbreviation | Calculation Formula |
|---|---|---|
| nitrogen reflectance index [21] | NRI | |
| photochemical reflectance index [22] | PRI | |
| transformed vegetation index [23] | TVI | |
| transformed chlorophyll absorption in the reflectance index [24] | TCARI | |
| modified chlorophyll absorption in the reflectance index [25] | MCARI | |
| red-edge vegetation stress index [26] | RVSI | |
| plant senescence reflectance index [27] | PSRI | |
| green index [28] | GI | |
| structural independent pigment index [29] | SIPI | |
| normalized pigment chlorophyll ratio index [30] | NPCI | |
| normalized difference vegetation index [31] | NDVI | |
| optimized soil-adjusted vegetation index [32] | OSAVI | |
| Lichtenthaler’s indices [33] | Lic1 | |
| Lichtenthaler’s indices [34] | Lic2 | |
| anthocyanin reflectance index [35] | ARI | |
| physiological reflectance index [22] | PHRI |
| Spectral Indices | Late Flowering Stage | ||||
|---|---|---|---|---|---|
| Regression Equation | Training Set | Test Set | |||
| R2 | RMSE | R2 | RMSE | ||
| NRI | y = −2.77x + 0.68 | 0.87 | 0.08 | 0.86 | 0.09 |
| PRI | y = −5.68x + 0.02 | 0.08 | 0.22 | −7.9 | 0.21 |
| TVI | y = −0.06x + 1.36 | 0.86 | 0.09 | 0.91 | 0.07 |
| TCARI | y = −4.01x + 1.13 | 0.75 | 0.11 | 0.78 | 0.11 |
| MCARI | y = −21.73x + 1.27 | 0.38 | 0.18 | 0.41 | 0.19 |
| RVSI | y = 6.97x + 0.48 | 0.13 | 0.21 | −4.46 | 0.22 |
| PSRI | y = 4.96x + 0.01 | 0.73 | 0.12 | 0.79 | 0.12 |
| GI | y = −0.85x + 1.48 | 0.86 | 0.09 | 0.88 | 0.07 |
| SIPI | y = −3.39x + 2.40 | 0.74 | 0.12 | 0.68 | 0.12 |
| NPCI | y = 2.58x − 0.61 | 0.41 | 0.18 | −0.1 | 0.18 |
| NDVI | y = −2.34x + 1.52 | 0.82 | 0.1 | 0.86 | 0.08 |
| OSAVI | y = −2.79x + 1.55 | 0.81 | 0.1 | 0.81 | 0.1 |
| Lic1 | y = −2.40x + 1.52 | 0.82 | 0.1 | 0.86 | 0.08 |
| Lic2 | y = −0.81x + 0.63 | 0.02 | 0.23 | −34.83 | 0.24 |
| ARI | y = 0.36x − 0.12 | 0.2 | 0.21 | −2.24 | 0.21 |
| PHRI | y = −17.22x + 1.04 | 0.4 | 0.18 | −1.82 | 0.23 |
| FDI | y = 2.74x + 0.17 | 0.90 | 0.07 | 0.94 | 0.06 |
| Spectral Indices | Early Filling Stage | ||||
|---|---|---|---|---|---|
| Regression Equation | Training Set | Test Set | |||
| R2 | RMSE | R2 | RMSE | ||
| NRI | y = −3.2x + 0.55 | 0.93 | 0.07 | 0.92 | 0.07 |
| PRI | y = −9.52x − 0.30 | 0.19 | 0.23 | −2.14 | 0.23 |
| TVI | y = −0.05x + 1.02 | 0.89 | 0.08 | 0.89 | 0.08 |
| TCARI | y = −3.35x + 1.02 | 0.87 | 0.09 | 0.85 | 0.10 |
| MCARI | y = −16.72x + 1.14 | 0.76 | 0.13 | 0.67 | 0.14 |
| RVSI | y = 5.09x + 0.47 | 0.07 | 0.25 | −14.73 | 0.26 |
| PSRI | y = 3.60x − 0.15 | 0.88 | 0.09 | 0.85 | 0.10 |
| GI | y = −1.25x + 1.79 | 0.89 | 0.09 | 0.85 | 0.09 |
| SIPI | y = −3.74x + 2.44 | 0.78 | 0.12 | 0.71 | 0.12 |
| NPCI | y = 3.48x − 1.16 | 0.52 | 0.18 | 0.17 | 0.19 |
| NDVI | y = −2.45x + 1.32 | 0.87 | 0.09 | 0.85 | 0.10 |
| OSAVI | y = −2.74x + 1.32 | 0.89 | 0.09 | 0.87 | 0.09 |
| Lic1 | y = −2.45x + 1.32 | 0.87 | 0.09 | 0.85 | 0.10 |
| Lic2 | y = −2.44x + 1.28 | 0.09 | 0.25 | −6.40 | 0.24 |
| ARI | y = 0.39x − 0.18 | 0.17 | 0.23 | −4.87 | 0.25 |
| PHRI | y = −13.41x + 1.13 | 0.17 | 0.23 | −4.19 | 0.25 |
| FDI | y = 3.78x + 0.56 | 0.97 | 0.04 | 0.96 | 0.05 |
| Spectral Indices | Combined Stage | ||||
|---|---|---|---|---|---|
| Regression Equation | Training Set | Test Set | |||
| R2 | RMSE | R2 | RMSE | ||
| NRI | y = −2.69x + 0.56 | 0.82 | 0.11 | 0.78 | 0.11 |
| PRI | y = −7.56x − 0.16 | 0.46 | 0.19 | 0.03 | 0.18 |
| TVI | y = −0.05x + 1.05 | 0.73 | 0.13 | 0.64 | 0.13 |
| TCARI | y = −4.02x + 1.13 | 0.81 | 0.11 | 0.75 | 0.13 |
| MCARI | y = −20.80x + 1.29 | 0.63 | 0.16 | 0.48 | 0.18 |
| RVSI | y = 5.75x + 0.45 | 0.11 | 0.24 | −8.03 | 0.26 |
| PSRI | y = 2.57x − 0.05 | 0.72 | 0.14 | 0.63 | 0.14 |
| GI | y = −0.97x + 1.53 | 0.79 | 0.12 | 0.73 | 0.12 |
| SIPI | y = −3.71x + 2.51 | 0.34 | 0.21 | −1.03 | 0.22 |
| NPCI | y = 1.67x − 0.36 | 0.79 | 0.12 | 0.77 | 0.12 |
| NDVI | y = −2.24x + 1.31 | 0.66 | 0.15 | 0.51 | 0.15 |
| OSAVI | y = −2.54x + 1.32 | 0.66 | 0.15 | 0.56 | 0.14 |
| Lic1 | y = −2.24x + 1.32 | 0.66 | 0.15 | 0.51 | 0.15 |
| Lic2 | y = −2.45x + 1.27 | 0.73 | 0.13 | 0.70 | 0.13 |
| ARI | y = 0.56x − 0.43 | 0.69 | 0.14 | 0.49 | 0.16 |
| PHRI | y = −6.66x + 0.01 | 0.08 | 0.25 | −9.57 | 0.24 |
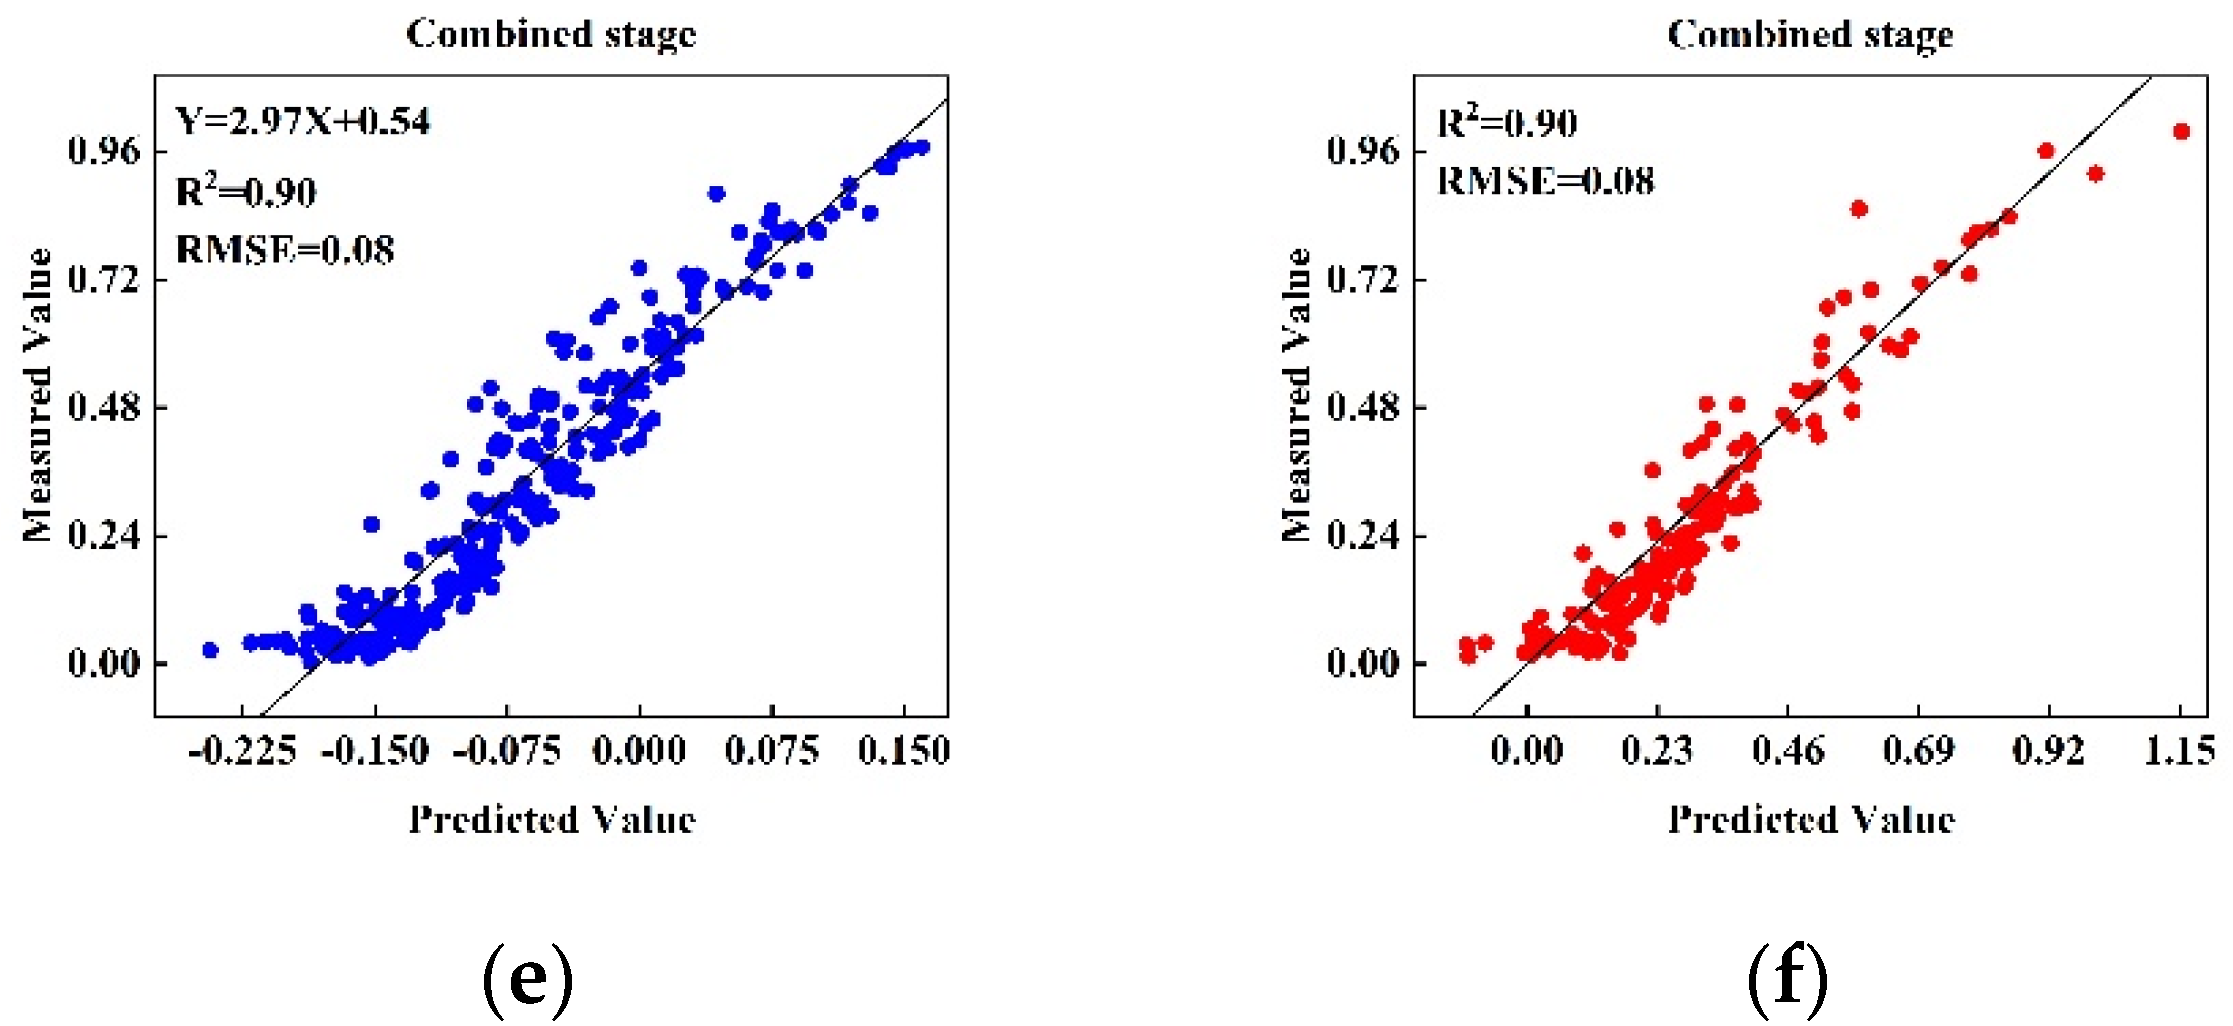
| FDI | y = 2.97x + 0.54 | 0.90 | 0.08 | 0.90 | 0.08 |
© 2020 by the authors. Licensee MDPI, Basel, Switzerland. This article is an open access article distributed under the terms and conditions of the Creative Commons Attribution (CC BY) license (http://creativecommons.org/licenses/by/4.0/).
Share and Cite
Zhang, D.; Wang, Q.; Lin, F.; Yin, X.; Gu, C.; Qiao, H. Development and Evaluation of a New Spectral Disease Index to Detect Wheat Fusarium Head Blight Using Hyperspectral Imaging. Sensors 2020, 20, 2260. https://doi.org/10.3390/s20082260
Zhang D, Wang Q, Lin F, Yin X, Gu C, Qiao H. Development and Evaluation of a New Spectral Disease Index to Detect Wheat Fusarium Head Blight Using Hyperspectral Imaging. Sensors. 2020; 20(8):2260. https://doi.org/10.3390/s20082260
Chicago/Turabian StyleZhang, Dongyan, Qian Wang, Fenfang Lin, Xun Yin, Chunyan Gu, and Hongbo Qiao. 2020. "Development and Evaluation of a New Spectral Disease Index to Detect Wheat Fusarium Head Blight Using Hyperspectral Imaging" Sensors 20, no. 8: 2260. https://doi.org/10.3390/s20082260