Motion Assessment for Accelerometric and Heart Rate Cycling Data Analysis


Abstract
:
1. Introduction
2. Methods
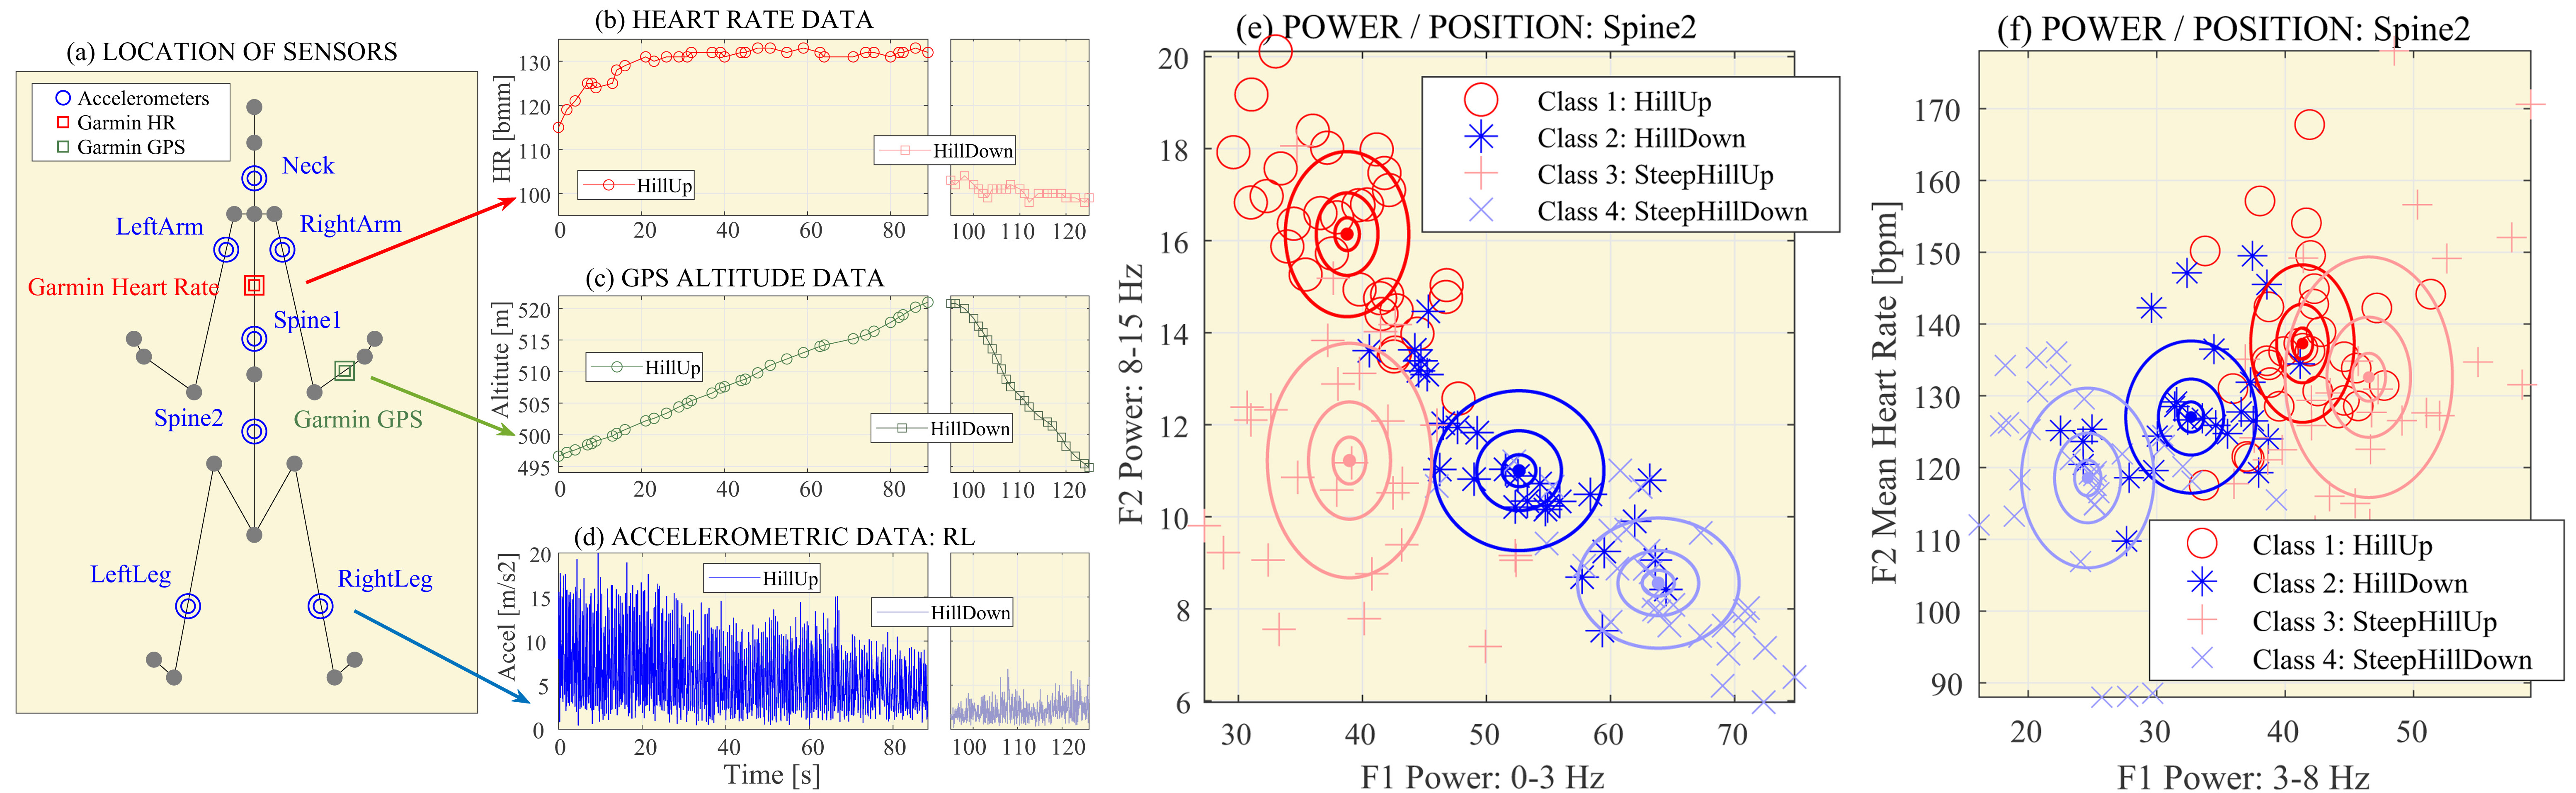
2.1. Data Acquisition
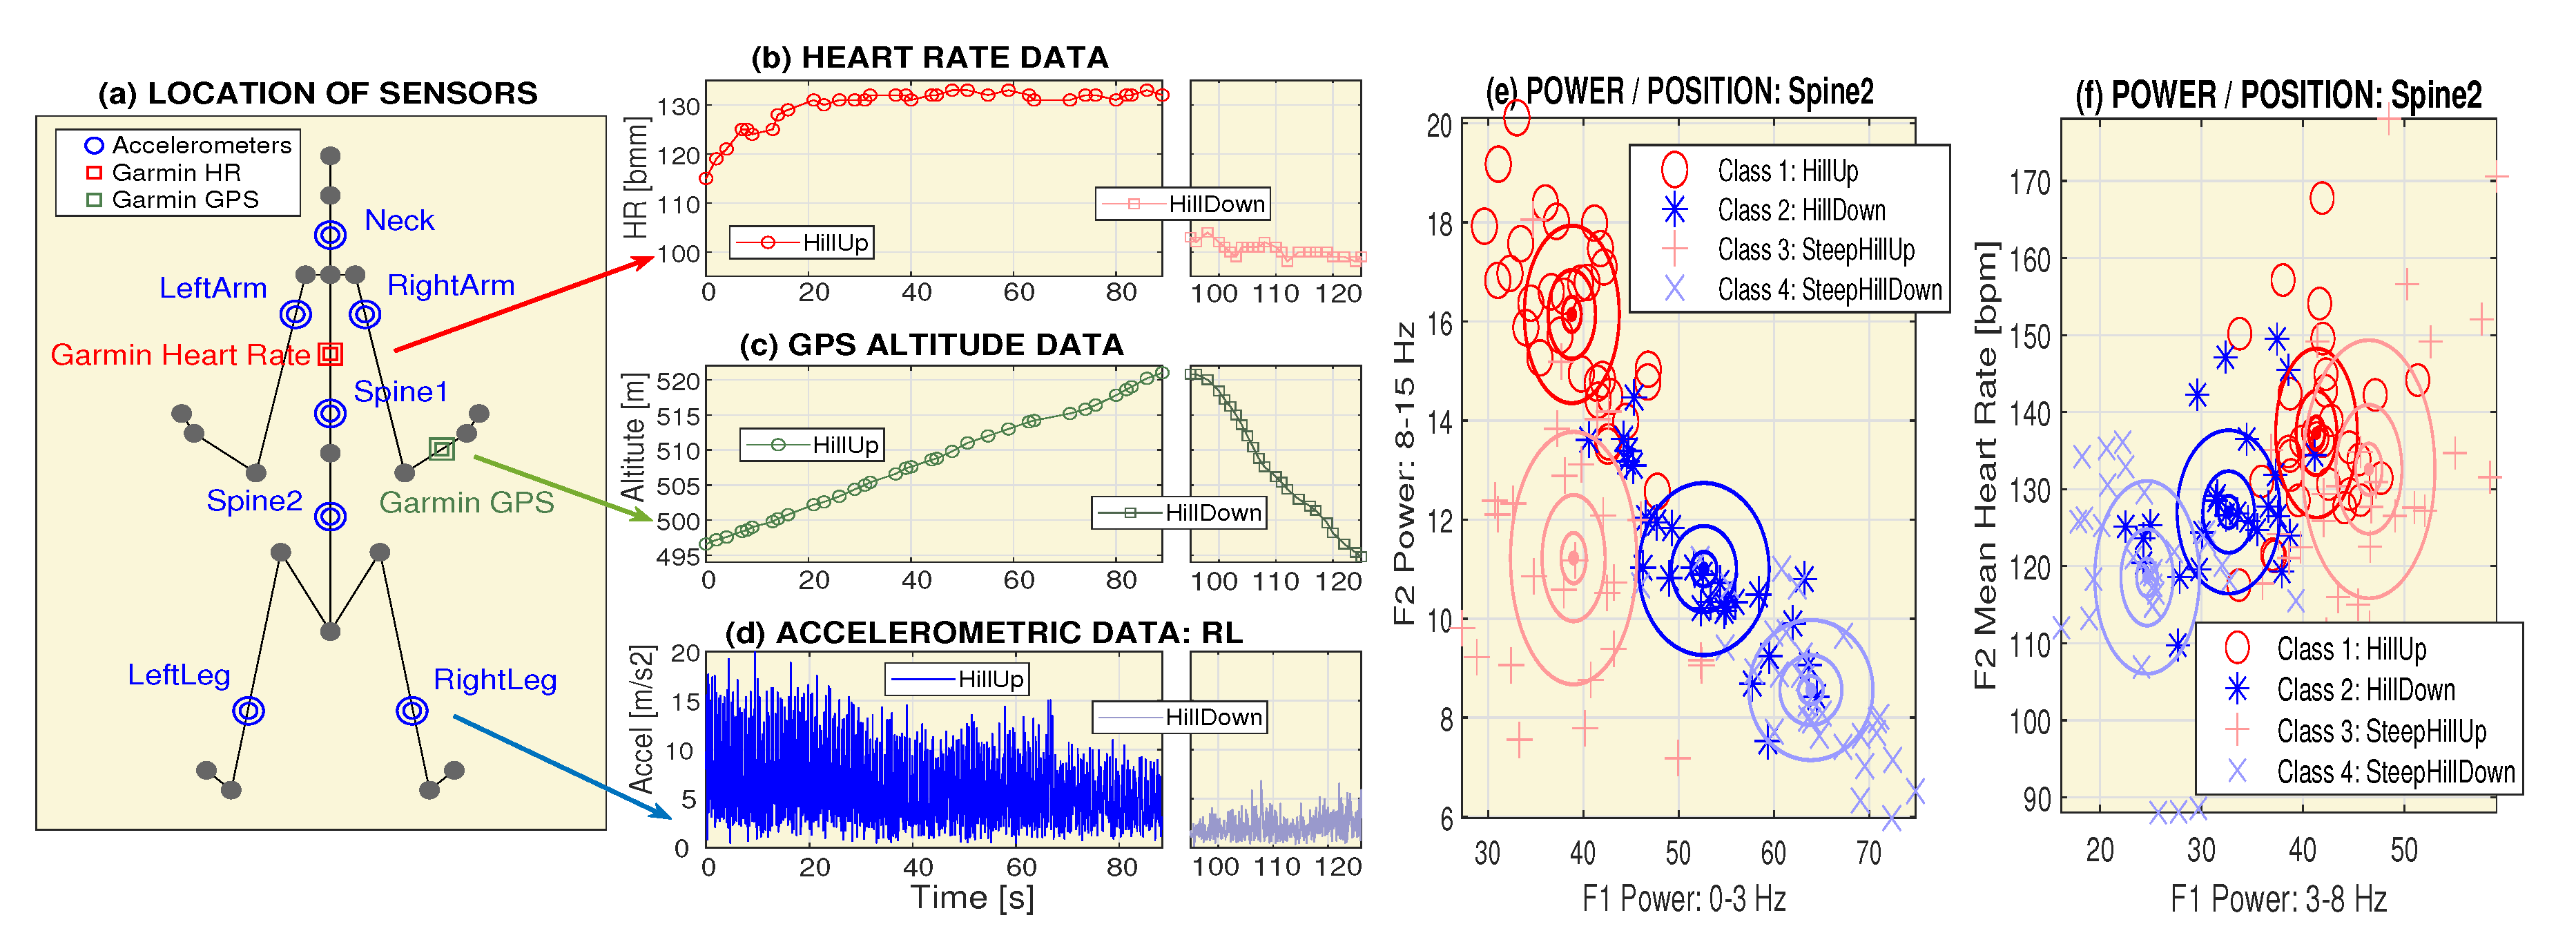
2.2. Signal Processing
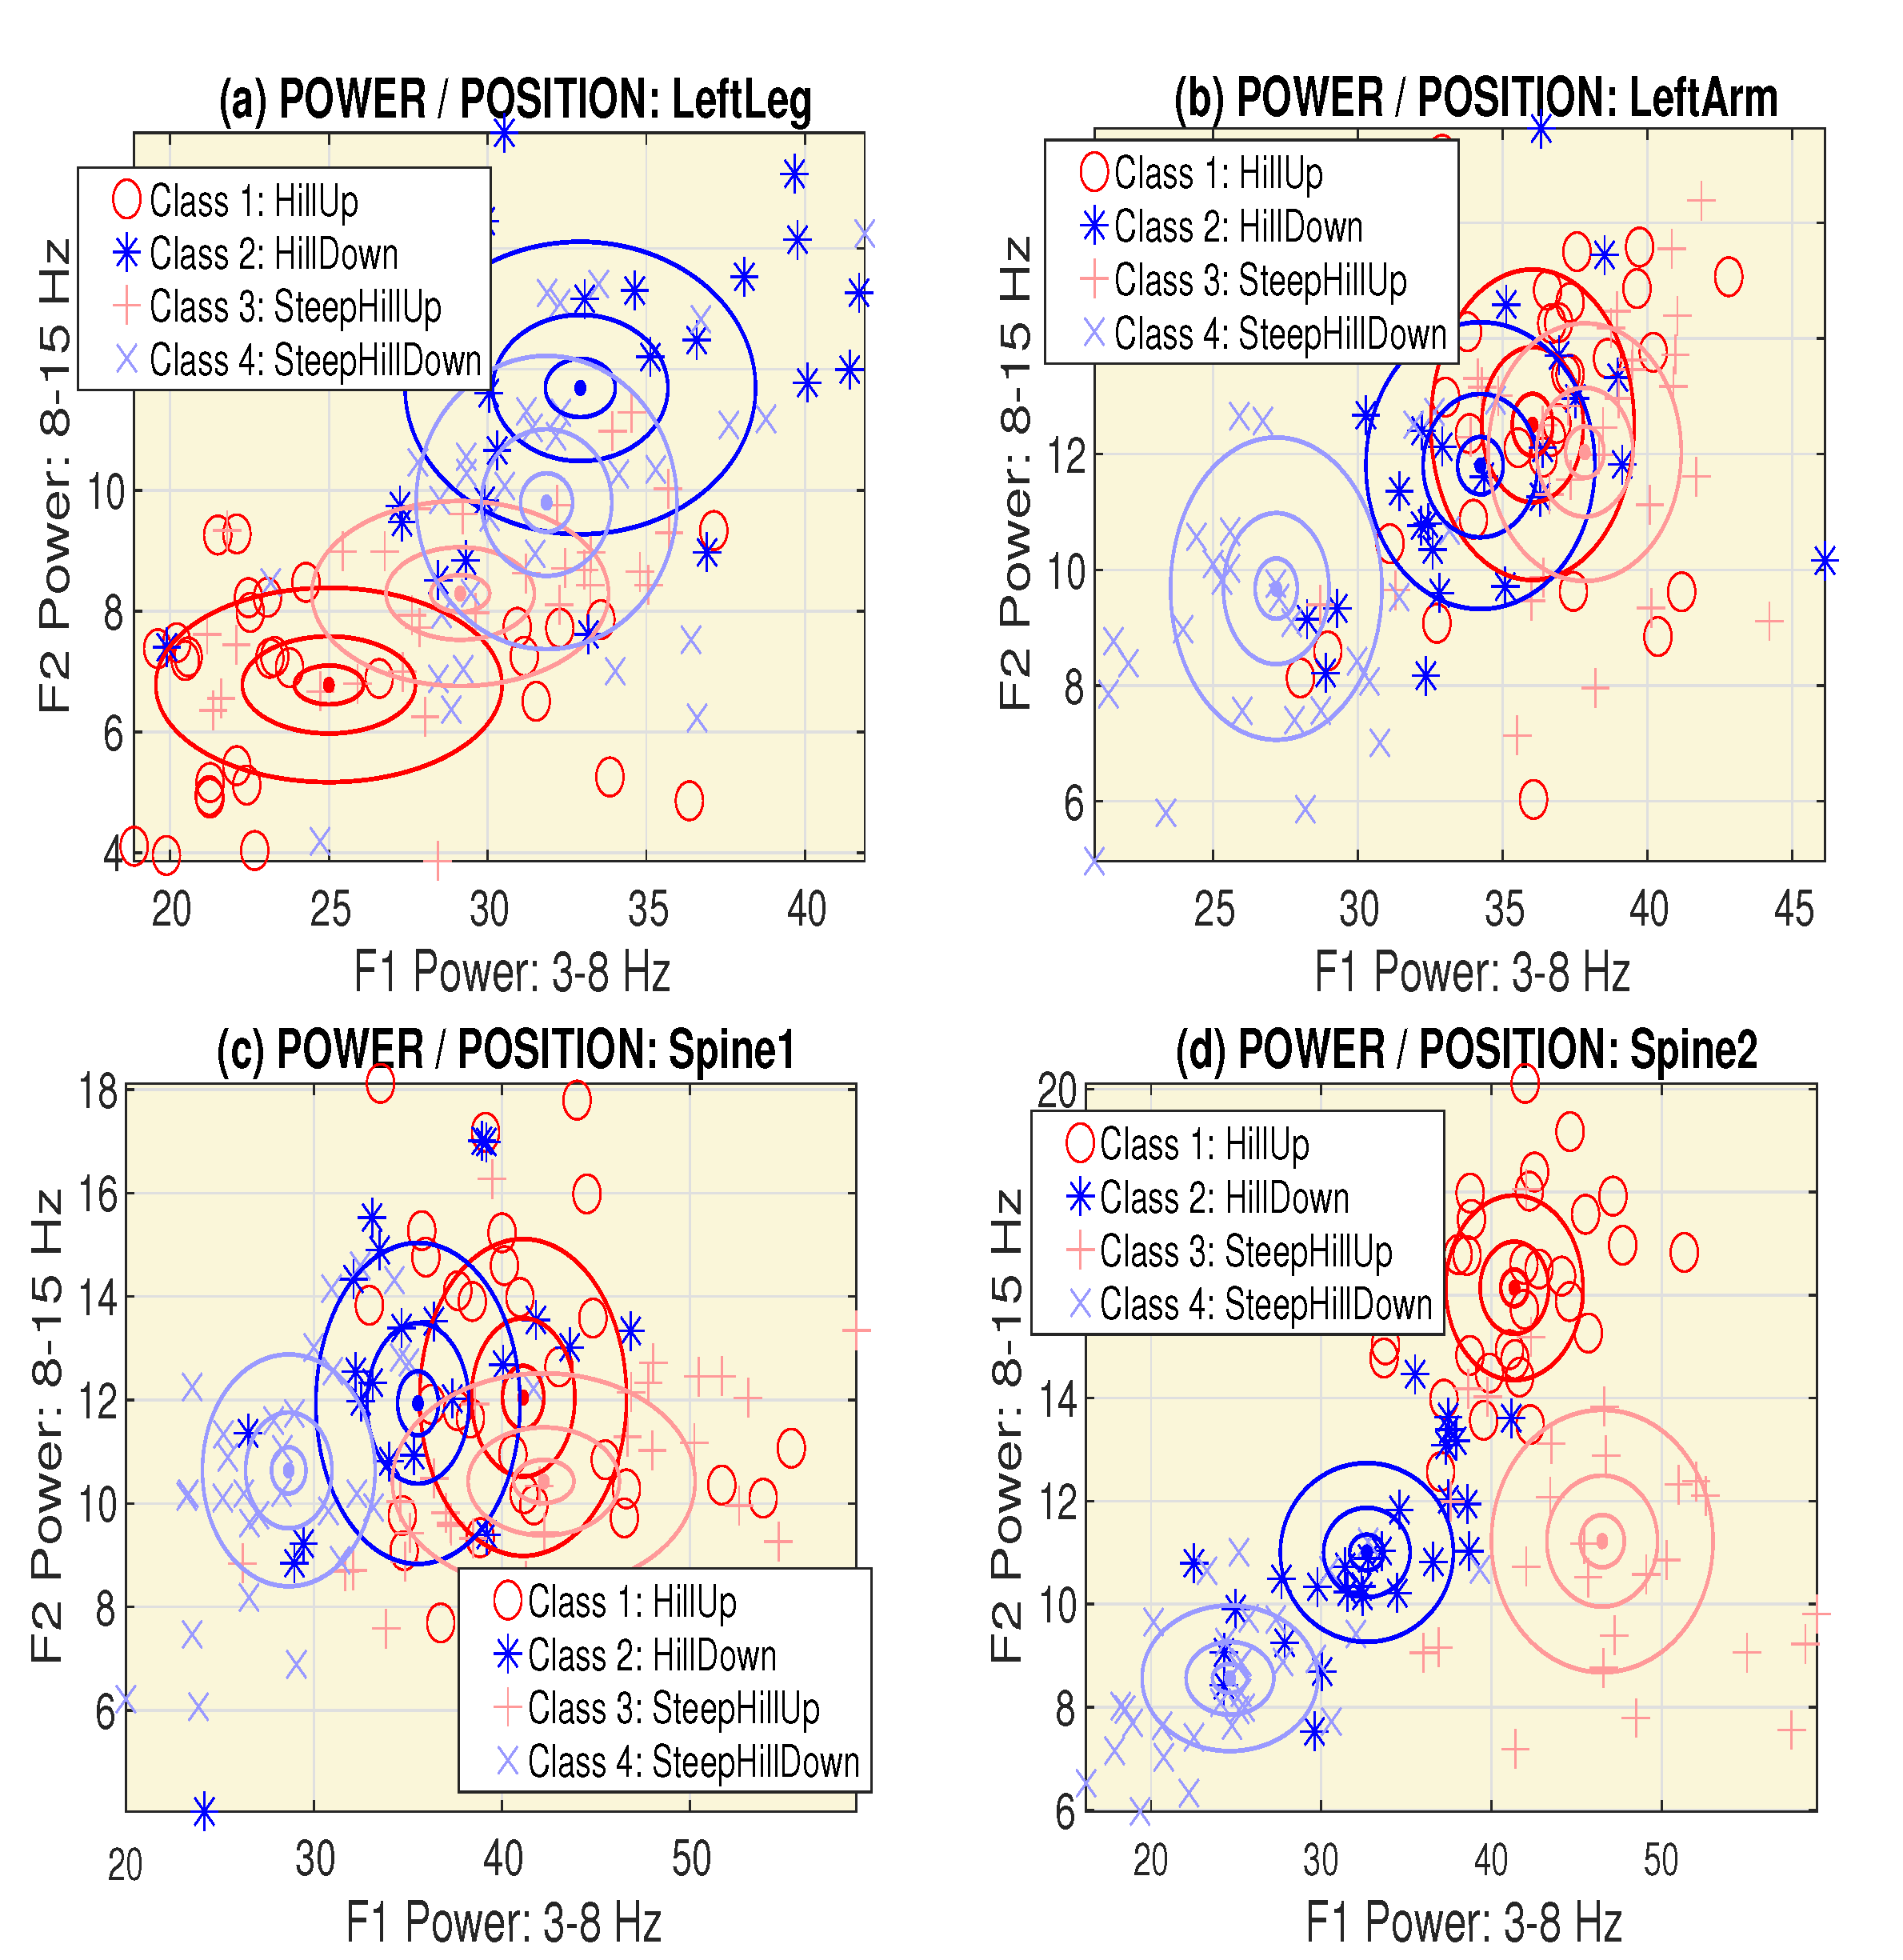
2.3. Pattern Recognition
- Sensitivity (the true positive rate, the recall) and specificity (the true negative rate):
- Accuracy:
- Precision (the positive predictive value) and -score (the harmonic mean of the precision and sensitivity):
3. Results
4. Conclusions
Author Contributions
Acknowledgments
Conflicts of Interest
References
- Wannenburg, J.; Malekian, R. Physical Activity Recognition From Smartphone Accelerometer Data for User Context Awareness Sensing. IEEE Trans. Syst. Man Cybern. Syst. 2017, 47, 3142–3149. [Google Scholar] [CrossRef]
- Slim, S.; Atia, A.; Elfattah, M.; Mostafa, M. Survey on Human Activity Recognition based on Acceleration Data. Intl. J. Adv. Comput. Sci. Appl. 2019, 10, 84–98. [Google Scholar] [CrossRef]
- Della Mea, V.; Quattrin, O.; Parpinel, M. A feasibility study on smartphone accelerometer-based recognition of household activities and influence of smartphone position. Inform. Health Soc. Care 2017, 42, 321–334. [Google Scholar] [CrossRef] [PubMed]
- Procházka, A.; Vyšata, O.; Charvátová, H.; Vališ, M. Motion Symmetry Evaluation Using Accelerometers and Energy Distribution. Symmetry 2019, 11, 871. [Google Scholar] [CrossRef] [Green Version]
- Li, R.; Kling, S.; Salata, M.; Cupp, S.; Sheehan, J.; Voos, J. Wearable Performance Devices in Sports Medicine. Sports Health 2016, 8, 74–78. [Google Scholar] [CrossRef] [PubMed] [Green Version]
- Rosenberger, M.; Haskell, W.; Albinali, F.; Mota, S.; Nawyn, J.; Intille, S. Estimating activity and sedentary behavior from an accelerometer on the hip or wrist. Med. Sci. Sports Exerc. 2013, 45, 964–975. [Google Scholar] [CrossRef] [PubMed] [Green Version]
- Monkaresi, H.; Calvo, R.A.; Yan, H. A Machine Learning Approach to Improve Contactless Heart Rate Monitoring Using a Webcam. IEEE J. Biomed. Health Informat. 2014, 18, 1153–1160. [Google Scholar] [CrossRef]
- Garde, A.; Karlen, W.; Ansermino, J.M.; Dumont, G.A. Estimating Respiratory and Heart Rates from the Correntropy Spectral Density of the Photoplethysmogram. PLoS ONE 2014, 9, e86427. [Google Scholar] [CrossRef] [Green Version]
- Procházka, A.; Charvátová, H.; Vyšata, O.; Kopal, J.; Chambers, J. Breathing Analysis Using Thermal and Depth Imaging Camera Video Records. Sensors 2017, 17, 1408. [Google Scholar] [CrossRef]
- Zang, K.; Shen, J.; Huang, H.; Wan, M.; Shi, J. Assessing and Mapping of Road Surface Roughness based on GPS and Accelerometer Sensors on Bicycle-Mounted Smartphones. Sensors 2018, 18, 914. [Google Scholar] [CrossRef] [Green Version]
- Ridgel, A.; Abdar, H.; Alberts, J.; Discenzo, F.; Loparo, K. Variability in cadence during forced cycling predicts motor improvement in individuals with Parkinson’s disease. IEEE Trans. Neural Syst. Rehabil. Eng. 2013, 21, 481–489. [Google Scholar] [CrossRef] [PubMed] [Green Version]
- Procházka, A.; Vaseghi, S.; Yadollahi, M.; Ťupa, O.; Mareš, J.; Vyšata, O. Remote Physiological and GPS Data Processing in Evaluation of Physical Activities. Med. Biol. Eng. Comput. 2014, 52, 301–308. [Google Scholar] [CrossRef] [PubMed]
- Charvátová, H.; Procházka, A.; Vaseghi, S.; Vyšata, O.; Vališ, M. GPS-based Analysis of Physical Activities Using Positioning and Heart Rate Cycling Data. Signal Image Video Process. 2017, 11, 251–258. [Google Scholar] [CrossRef]
- Procházka, A.; Vaseghi, S.; Charvátová, H.; Ťupa, O.; Vyšata, O. Cycling Segments Multimodal Analysis and Classification Using Neural Networks. Appl. Sci. 2017, 7, 581. [Google Scholar] [CrossRef]
- Zhang, J.; Macfarlane, D.; Sobko, T. Feasibility of a Chest-worn accelerometer for physical activity measurement. J. Sci. Med. Sport 2016, 19, 1015–1019. [Google Scholar] [CrossRef] [Green Version]
- Espinilla, M.; Medina, J.; Salguero, A.; Irvine, N.; Donnelly, M.; Cleland, I.; Nugent, C. Human Activity Recognition from the Acceleration Data of a Wearable Device. Which Features Are More Relevant by Activities? Proceedings 2018, 2, 1242. [Google Scholar] [CrossRef] [Green Version]
- Alkali, A.; Saatchi, R.; Elphick, H.; Burke, D. Thermal image processing for real-time non-contact respiration rate monitoring. IET Circ. Devices Syst. 2017, 11, 142–148. [Google Scholar] [CrossRef]
- Ambrosanio, M.; Franceschini, S.; Grassini, G.; Baselice, F. A Multi-Channel Ultrasound System for Non-Contact Heart Rate Monitoring. IEEE Sens. J. 2020, 20, 2064–2074. [Google Scholar] [CrossRef]
- Ruminski, J. Analysis of the parameters of respiration patterns extracted from thermal image sequences. Biocybern. Biomed. Eng. 2016, 36, 731–741. [Google Scholar] [CrossRef]
- Colyer, S.; Evans, M.; Cosker, D.; Salo, A. A Review of the Evolution of Vision-Based Motion Analysis and the Integration of Advanced Computer Vision Methods Towards Developing a Markerless System. Sport. Med. 2018, 4, 24.1–24.15. [Google Scholar] [CrossRef] [Green Version]
- Silsupadol, P.; Teja, K.; Lugade, V. Reliability and validity of a smartphone-based assessment of gait parameters across walking speed and smartphone locations: Body, bag, belt, hand, and pocket. Gait Posture 2017, 58, 516–522. [Google Scholar] [CrossRef] [PubMed]
- Procházka, A.; Vyšata, O.; Vališ, M.; Ťupa, O.; Schatz, M.; Mařík, V. Bayesian classification and analysis of gait disorders using image and depth sensors of Microsoft Kinect. Digit. Signal Prog. 2015, 47, 169–177. [Google Scholar] [CrossRef]
- Loprinzi, P.; Smith, B. Comparison between wrist-worn and waist-worn accelerometry. J. Phys. Act. Health 2017, 14, 539–545. [Google Scholar] [CrossRef] [PubMed]
- Mackintosh, K.; Montoye, A.; Pfeiffer, K.; McNarry, M. Investigating optimal accelerometer placement for energy expenditure prediction in children using a machine learning approach. Physiol. Meas. 2016, 37, 1728–1740. [Google Scholar] [CrossRef] [Green Version]
- Cooke, A.; Daskalopoulou, S.; Dasgupta, K. The impact of accelerometer wear location on the relationship between step counts and arterial stiffness in adults treated for hypertension and diabetes. J. Sci. Med. Sport 2018, 21, 398–403. [Google Scholar] [CrossRef]
- Rucco, R.; Sorriso, A.; Liparoti, M.; Ferraioli, G.; Sorrentino, P.; Ambrosanio, M.; Baselice, F. Type and location of wearable sensors for monitoring falls during static and dynamic tasks in healthy elderly: A review. Sensors 2018, 18, 1613. [Google Scholar] [CrossRef] [Green Version]
- Cvetkovic, B.; Szeklicki, R.; Janko, V.; Lutomski, P.; Luštrek, M. Real-time activity monitoring with a wristband and a smartphone. Inf. Fusion 2018, 43, 77–93. [Google Scholar] [CrossRef]
- Mannini, A.; Rosenberger, M.; Haskell, W.; Sabatini, A.; Intille, S. Activity recognition in youth using single accelerometer placed at wrist or ankle. Med. Sci. Sports Exerc. 2017, 49, 801–812. [Google Scholar] [CrossRef] [Green Version]
- Cleland, I.; Kikhia, B.; Nugent, C.; Boytsov, A.; Hallberg, J.; Synnes, K.; McClean, S.; Finlay, D. Optimal placement of accelerometers for the detection of everyday activities. Sensors 2013, 13, 9183–9200. [Google Scholar] [CrossRef] [Green Version]
- Mannini, A.; Intille, S.; Rosenberger, M.; Sabatini, A.; Haskell, W. Activity recognition using a single accelerometer placed at the wrist or ankle. Med. Sci. Sports Exerc. 2013, 45, 2193–2203. [Google Scholar] [CrossRef] [Green Version]
- Howie, E.; McVeigh, J.; Straker, L. Comparison of compliance and intervention outcomes between hip- and wrist-Worn accelerometers during a randomized crossover trial of an active video games intervention in children. J. Phys. Act. Health 2016, 13, 964–969. [Google Scholar] [CrossRef] [PubMed]
- Bertolotti, G.; Cristiani, A.; Colagiorgio, P.; Romano, F.; Bassani, E.; Caramia, N.; Ramat, S. A Wearable and Modular Inertial Unit for Measuring Limb Movements and Balance Control Abilities. IEEE Sens. J. 2016, 16, 790–797. [Google Scholar] [CrossRef]
- Lucas, A.; Hermiz, J.; Labuzetta, J.; Arabadzhi, Y.; Karanjia, N.; Gilja, V. Use of Accelerometry for Long Term Monitoring of Stroke Patients. IEEE J. Transl. Eng. Health Med. 2019, 7, 1–10. [Google Scholar] [CrossRef] [PubMed]
- Crouter, S.; Flynn, J.; Bassett, D. Estimating physical activity in youth using a wrist accelerometer. Med. Sci. Sports Exerc. 2015, 47, 944–951. [Google Scholar] [CrossRef] [PubMed] [Green Version]
- Crouter, S.; Oody, J.; Bassett, D. Estimating physical activity in youth using an ankle accelerometer. J. Sports Sci. 2018, 36, 2265–2271. [Google Scholar] [CrossRef] [PubMed]
- Montoye, A.; Pivarnik, J.; Mudd, L.; Biswas, S.; Pfeiffer, K. Comparison of Activity Type Classification Accuracy from Accelerometers Worn on the Hip, Wrists, and Thigh in Young, Apparently Healthy Adults. Meas. Phys. Educ. Exerc. Sci. 2016, 20, 173–183. [Google Scholar] [CrossRef]
- Dutta, A.; Ma, O.; Toledo, M.; Pregonero, A.; Ainsworth, B.; Buman, M.; Bliss, D. Identifying free-living physical activities using lab-based models with wearable accelerometers. Sensors 2018, 18, 3893. [Google Scholar] [CrossRef] [Green Version]
- Ganea, R.; Paraschiv-Lonescu, A.; Aminian, K. Detection and classification of postural transitions in real-world conditions. IEEE Trans. Neural Syst. Rehabil. Eng. 2012, 20, 688–696. [Google Scholar] [CrossRef]
- Procházka, A.; Schätz, M.; Centonze, F.; Kuchyňka, J.; Vyšata, O.; Vališ, M. Extraction of Breathing Features Using MS Kinect for Sleep Stage Detection. Signal Image Video Process. 2016, 10, 1278–1286. [Google Scholar] [CrossRef]
- Procházka, A.; Kuchyňka, J.; Vyšata, O.; Schatz, M.; Yadollahi, M.; Sanei, S.; Vališ, M. Sleep Scoring Using Polysomnography Data Features. Signal Image Video Process. 2018, 12, 1043–1051. [Google Scholar] [CrossRef]
- Allahbakhshi, H.; Conrow, L.; Naimi, B.; Weibe, R. Using Accelerometer and GPS Data for Real-Life Physical Activity Type Detection. Sensors 2020, 20, 588. [Google Scholar] [CrossRef] [PubMed] [Green Version]
- Guiry, J.; van de Ven, P.; Nelson, J.; Warmerdam, L.; Ripe, H. Activity recognition with smartphone support. Med. Eng. Phys. 2014, 36, 670–675. [Google Scholar] [CrossRef] [PubMed]
- Bayat, A.; Pomplun, M.; Tran, D. A Study on Human Activity Recognition Using Accelerometer Data from Smartphones. Procedia Comput. Sci. 2014, 34, 450–457. [Google Scholar] [CrossRef] [Green Version]
- Shoaib, M.; Scholten, H.; Havinga, P. Towards physical activity recognition using smartphone sensors. In Proceedings of the 2013 IEEE 10th International Conference on Ubiquitous Intelligence and Computing and 2013 IEEE 10th International Conference on Autonomic and Trusted Computing, Vietri sul Mere, Italy, 18–21 December 2013; pp. 80–87. [Google Scholar]
- Gajda, R.; Biernacka, E.K.; Drygas, W. Are heart rate monitors valuable tools for diagnosing arrhythmias in endurance athletes? Scand. J. Med. 2018, 28, 496–516. [Google Scholar] [CrossRef] [PubMed]
- Collins, T.; Woolley, S.; Oniani, S.; Pires, I.; Garcia, N.; Ledger, S.; Pandyan, A. Version reporting and assessment approaches for new and updated activity and heart rate monitors. Sensors 2019, 19, 1705. [Google Scholar] [CrossRef] [Green Version]
- Yoshua, B.; Aaron, C.; Pascal, V. Representation Learning: A Review and New Perspectives. IEEE Trans. Pattern Anal. Mach. Intell. 2013, 35, 1798–1828. [Google Scholar]
- Goodfellow, I.; Bengio, Y.; Courville, A. Deep Learning; MIT Press: Cambridge, MA, USA, 2016. [Google Scholar]
- Antoniades, A.; Spyrou, L.; Martin-Lopez, D.; Valentin, A.; Alarcon, G.; Sanei, S.; Took, C. Detection of Interictal Discharges with Convolutional Neural Networks Using Discrete Ordered Multichannel Intracranial EEG. IEEE Trans. Neural Syst. Rehabil. Eng. 2017, 25, 2285–2294. [Google Scholar] [CrossRef]
- Mishra, C.; Gupta, D.L. Deep Machine Learning and Neural Networks: An Overview. IJHIT 2016, 9, 401–414. [Google Scholar] [CrossRef]
- He, K.; Zhang, X.; Ren, S.; Sun, J. Deep Residual Learning for Image Recognition. In Proceedings of the 2016 IEEE Conference on Computer Vision and Pattern Recognition, Las Vegas, NV, USA, 27–30 June 2016; pp. 770–778. [Google Scholar]
- Ar, I.; Akgul, Y. A Computerized Recognition System for the Home-Based Physiotherapy Exercises Using an RGBD Camera. IEEE Trans. Neural Syst. Rehabil. Eng. 2014, 22, 1160–1171. [Google Scholar] [CrossRef]
- Chauvin, R.; Hamel, M.; Briere, S.; Ferland, F.; Grondin, F.; Letourneau, D.; Tousignant, M.; Michaud, F. Contact-Free Respiration Rate Monitoring Using a Pan-Tilt Thermal Camera for Stationary Bike Telerehabilitation Sessions. IEEE Syst. J. 2016, 10, 1046–1055. [Google Scholar] [CrossRef]
- Procházka, A.; Charvátová, H.; Vaseghi, S.; Vyšata, O. Machine Learning in Rehabilitation Assesment for Thermal and Heart Rate Data Processing. IEEE Trans. Neural Syst. Rehabil. Eng. 2018, 26, 1209–12141. [Google Scholar] [CrossRef] [PubMed]
- Ou, G.; Murphey, Y. Multi-class pattern classification using neural networks. Pattern Recognit. 2007, 40, 4–8. [Google Scholar] [CrossRef]
- Shakhnarovich, M.; Darrell, T.; Indyk, P. Nearest-neighbor Methods in Learning and Vision: Theory and Practice; MIT Press: Cambridge, MA, USA, 2005. [Google Scholar]
- Theodoridis, S.; Koutroumbas, K. Pattern Recognition; Elsevier Science & Technology: Amsterdam, The Netherlands, 2008. [Google Scholar]
- Prashar, P. Neural Networks in Machine Learning. Int. J. Comput. Appl. Technol. 2014, 105, 1–3. [Google Scholar]
- Procházka, A.; Vyšata, O.; Ťupa, O.; Mareš, J.; Vališ, M. Discrimination of Axonal Neuropathy Using Sensitivity and Specificity Statistical Measures. SPRINGER: Neural Comput. Appl. 2014, 25, 1349–1358. [Google Scholar] [CrossRef]
- Fushiki, T. Estimation of prediction error by using K-fold cross-validation. Stat. Comput. 2011, 21, 137–146. [Google Scholar] [CrossRef]


| Position Index | Position Name | Number of Segments | |
|---|---|---|---|
| pos | P(pos) | Used: Q(pos) | Rejected |
| 1 | LeftLeg | 180 | 6 |
| 2 | RightLeg | 210 | 9 |
| 3 | Spine1 | 177 | 9 |
| 4 | Spine2 | 174 | 6 |
| 5 | LeftArm | 177 | 3 |
| 6 | RightArm | 198 | 0 |
| 7 | Neck | 177 | 6 |
| TOTAL NUMBER: | 1293 | 39 | |
| Class | S[%] | STD |
|---|---|---|
| -HillUp | 10.3 | 3.3 |
| -HillDown | −9.4 | 3.9 |
| -SteepHillUp | 19.8 | 3.4 |
| -SteepHillDown | −18.7 | 3.4 |
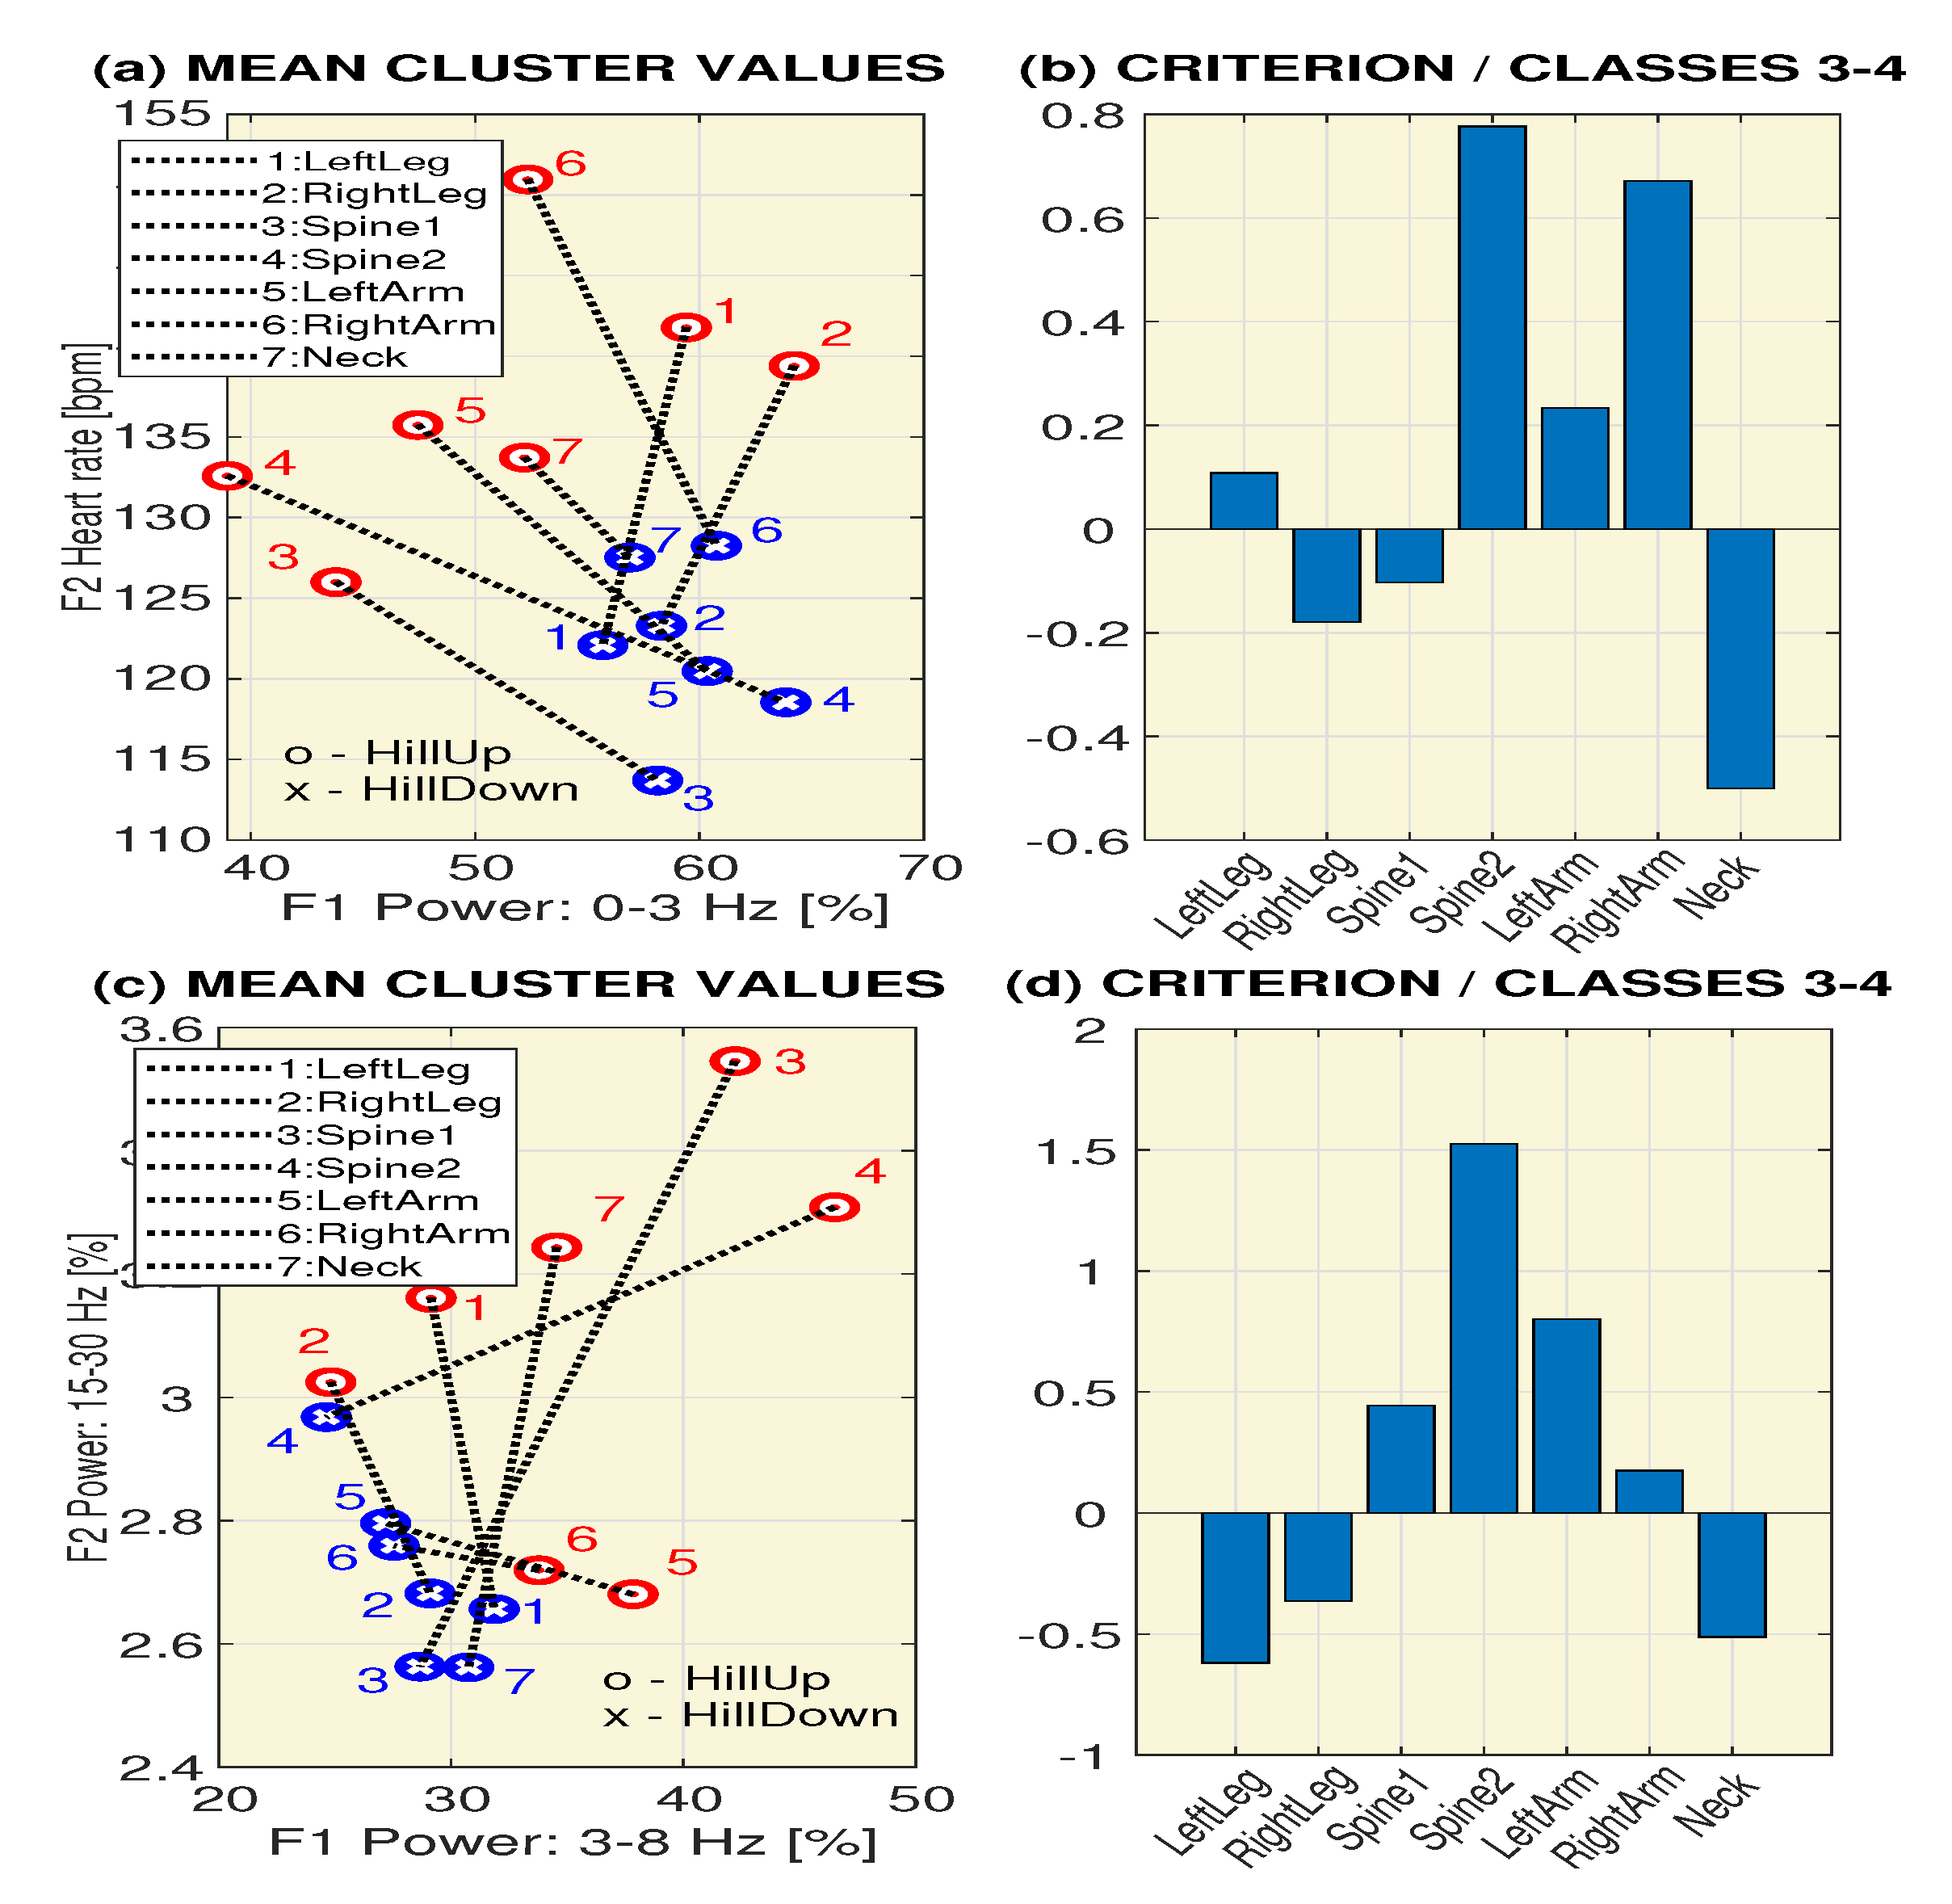
| Position | Feature | c(1) | c(2) | c(3) | c(4) | ||||
|---|---|---|---|---|---|---|---|---|---|
| Mean | STD | Mean | STD | Mean | STD | Mean | STD | ||
| LeftLeg | [%] | 66 | 7 | 52 | 7 | 59 | 6 | 56 | 7 |
| [%] | 25 | 5 | 33 | 6 | 29 | 5 | 32 | 4 | |
| [%] | 7 | 2 | 12 | 2 | 8 | 2 | 10 | 2 | |
| [%] | 2 | 1 | 3 | 1 | 3 | 1 | 3 | 2 | |
| 137 | 22 | 129 | 19 | 142 | 26 | 122 | 17 | ||
| RightLeg | [%] | 71 | 5 | 51 | 7 | 64 | 6 | 58 | 6 |
| [%] | 21 | 4 | 34 | 4 | 25 | 4 | 29 | 4 | |
| [%] | 6 | 1 | 12 | 3 | 8 | 2 | 10 | 2 | |
| [%] | 2 | 1 | 3 | 2 | 3 | 1 | 3 | 1 | |
| 142 | 20 | 125 | 23 | 139 | 26 | 123 | 24 | ||
| Spine1 | [%] | 44 | 7 | 50 | 8 | 44 | 10 | 58 | 7 |
| [%] | 41 | 6 | 36 | 5 | 42 | 8 | 29 | 5 | |
| [%] | 12 | 3 | 12 | 3 | 10 | 2 | 11 | 2 | |
| [%] | 3 | 2 | 3 | 2 | 4 | 1 | 3 | 2 | |
| 146 | 16 | 130 | 18 | 126 | 25 | 114 | 18 | ||
| Spine2 | [%] | 39 | 5 | 53 | 7 | 39 | 7 | 64 | 7 |
| [%] | 41 | 4 | 33 | 5 | 47 | 7 | 25 | 5 | |
| [%] | 16 | 2 | 11 | 2 | 11 | 3 | 9 | 1 | |
| [%] | 4 | 1 | 4 | 1 | 3 | 1 | 3 | 0 | |
| 137 | 11 | 127 | 11 | 133 | 17 | 119 | 13 | ||
| LeftArm | [%] | 48 | 6 | 50 | 6 | 47 | 5 | 60 | 6 |
| [%] | 36 | 4 | 34 | 4 | 38 | 3 | 27 | 4 | |
| [%] | 13 | 3 | 12 | 2 | 12 | 2 | 10 | 3 | |
| [%] | 3 | 2 | 4 | 2 | 3 | 2 | 3 | 1 | |
| 144 | 13 | 140 | 12 | 136 | 18 | 120 | 16 | ||
| RightArm | [%] | 47 | 6 | 50 | 7 | 52 | 5 | 61 | 5 |
| [%] | 38 | 4 | 36 | 5 | 34 | 3 | 28 | 3 | |
| [%] | 12 | 2 | 11 | 2 | 11 | 2 | 9 | 2 | |
| [%] | 3 | 1 | 3 | 2 | 3 | 2 | 3 | 1 | |
| 153 | 11 | 138 | 11 | 151 | 20 | 128 | 14 | ||
| Neck | [%] | 49 | 7 | 53 | 8 | 52 | 7 | 57 | 5 |
| [%] | 36 | 4 | 34 | 5 | 35 | 6 | 31 | 4 | |
| [%] | 12 | 3 | 11 | 4 | 10 | 2 | 10 | 2 | |
| [%] | 4 | 1 | 3 | 2 | 3 | 1 | 3 | 1 | |
| 145 | 13 | 142 | 12 | 134 | 18 | 128 | 14 | ||
| Position | Accuracy AC [%] | Cross-validation Error | ||||||
|---|---|---|---|---|---|---|---|---|
| SVM | Bayes | 5NN | NN | SVM | Bayes | 5NN | NN | |
| LeftLeg | 81.6 | 75.4 | 85.1 | 89.5 | 0.22 | 0.25 | 0.20 | 0.10 |
| RightLeg | 84.7 | 82.6 | 86.8 | 91.7 | 0.15 | 0.17 | 0.19 | 0.09 |
| Spine1 | 86.3 | 77.8 | 84.6 | 86.3 | 0.18 | 0.23 | 0.21 | 0.05 |
| Spine2 | 92.1 | 89.5 | 93.7 | 96.5 | 0.09 | 0.11 | 0.07 | 0.04 |
| LeftArm | 82.1 | 78.6 | 82.9 | 82.1 | 0.24 | 0.21 | 0.23 | 0.18 |
| RightArm | 75.6 | 65.9 | 79,3 | 76.3 | 0.37 | 0.36 | 0.39 | 0.19 |
| Neck | 61.7 | 63.3 | 70.8 | 63.3 | 0.63 | 0.37 | 0.49 | 0.39 |
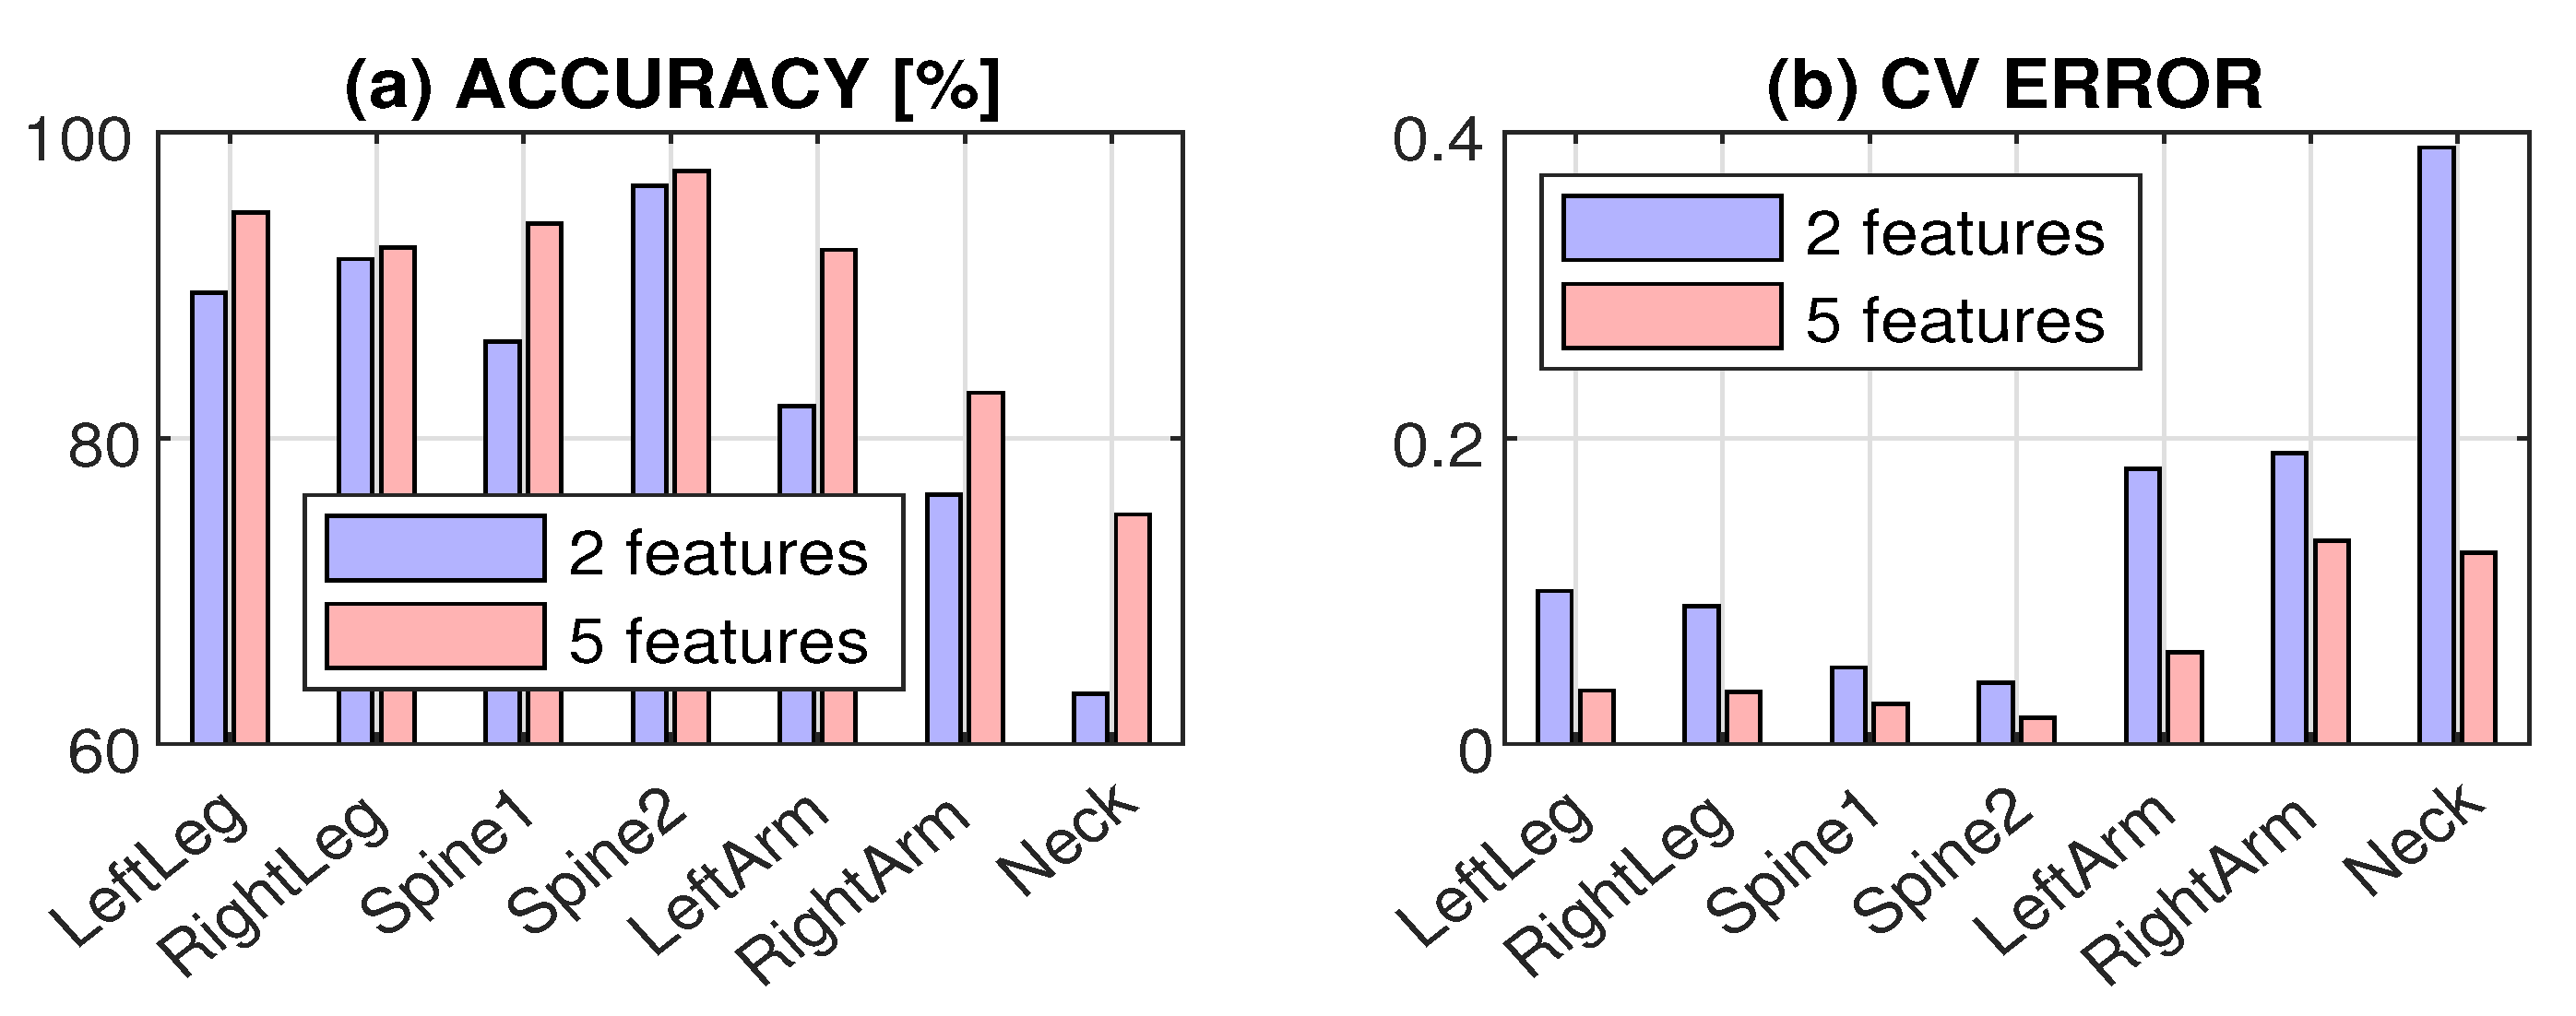
| Position | AC [%] | TNR[%] | TPR [%] | F1s [%] | CV |
|---|---|---|---|---|---|
| LeftLeg | 93.3 | 92.1 | 94.7 | 93.1 | 0.083 |
| RightLeg | 95.0 | 97.3 | 91.2 | 94.5 | 0.042 |
| Spine1 | 96.7 | 96.8 | 96.5 | 96.5 | 0.017 |
| Spine2 | 98.3 | 98.4 | 98.2 | 98.2 | 0.042 |
| LeftArm | 93.3 | 95.2 | 91.2 | 92.9 | 0.067 |
| RightArm | 94.8 | 93.9 | 95.7 | 94.9 | 0.030 |
| Neck | 95.8 | 95.2 | 96.6 | 95.7 | 0.033 |
© 2020 by the authors. Licensee MDPI, Basel, Switzerland. This article is an open access article distributed under the terms and conditions of the Creative Commons Attribution (CC BY) license (http://creativecommons.org/licenses/by/4.0/).
Share and Cite
Charvátová, H.; Procházka, A.; Vyšata, O. Motion Assessment for Accelerometric and Heart Rate Cycling Data Analysis. Sensors 2020, 20, 1523. https://doi.org/10.3390/s20051523
Charvátová H, Procházka A, Vyšata O. Motion Assessment for Accelerometric and Heart Rate Cycling Data Analysis. Sensors. 2020; 20(5):1523. https://doi.org/10.3390/s20051523
Chicago/Turabian StyleCharvátová, Hana, Aleš Procházka, and Oldřich Vyšata. 2020. "Motion Assessment for Accelerometric and Heart Rate Cycling Data Analysis" Sensors 20, no. 5: 1523. https://doi.org/10.3390/s20051523