1. Introduction
Structural damage identification, aiming at detecting and assessing the structural damage at or near its onset during operation, plays a significant role in maintaining the safety and reliability of civil and mechanical structures [
1,
2,
3]. One of the major challenges in this field is that damage is a local phenomenon that naturally appears and propagates in a small region, which presents a great difficulty in detection [
4,
5,
6]. Therefore, an effective damage identification approach should be local in nature [
7,
8,
9]. Differently from the traditional vibration-based damage identification methods that use global damage features, a novel damage localization approach is proposed in this paper based on the estimated mode shapes to examine the damage-induced local dynamic disturbances. However, two major issues, that is, noise-robust mode shape estimation and effective damage localization index, hamper its practical engineering applications, which will be discussed and tackled in this investigation.
When compared with natural frequencies, mode shape-based damage identification methods are more sensitive to local damage while being less sensitive to environmental variability [
10,
11]. Nevertheless, the evaluation of mode shapes is vulnerable to measurement uncertainties, as the data acquisition at discrete spatial points can be readily contaminated by the measurement noise [
12,
13]. As for mode shape-based damage identification, it is desirable to obtain mode shapes via operational modal analysis (OMA), as excitation forces are normally unavailable or impossible to be acquired under operational conditions [
14,
15,
16]. A comprehensive review of different OMA methods was summarized and presented by Rainieri and Fabbrocino [
17]. Stochastic subspace identification (SSI) and frequency domain decomposition (FDD) are two popular OMA approaches that are widely used [
18]. Recently, the second-order blind source identification (SOBI) has attracted much more attention, which evaluates the modal parameters based on the concepts of sources and mixing matrix [
19]. In addition, Yuen and Au [
20] proposed a Bayesian operational modal analysis, which could output the uncertainty quantification of estimated modal parameters. Nevertheless, a major shortcoming of those OMA methods is that the random (white noise) excitation assumption is adopted, which is not physically true in practical engineering. To overcome this limitation, identification of modal parameters based on transmissibility measurements has been widely investigated, which works without any assumption regarding to the nature of excitation forces [
21,
22]. Araújo and Laier [
23] adopted an excitation force in the form of colored noise with a predominant frequency of 12 Hz to demonstrate the effectiveness of the transmissibility-based OMA.
For operational modal analysis, mode shapes are typically estimated by decomposing a matrix or some linear combinations of matrices, such as power spectral density (PSD) and covariance matrices. However, those matrices do not exactly possess identical eigen-structure because of limited measurement data and various uncertainties. To circumvent this, a kind of common eigen-structure is proposed in this paper. In this method, several power spectral density transmissibility (PSDT) matrices are simultaneously diagonalized via a joint singular value decomposition (SVD) approach for robust mode shape estimation, which is the first contribution of this paper.
Apart from the robust mode shape estimation problem, another critical issue is how to quantify the damage-induced local dynamic disturbances based on the mode shapes of damaged states for damage localization. Originally, the evaluation of a locally perturbed dynamic equilibrium, also known as the pseudo-excitation (PE) method, was developed to tackle the local force identification problem [
24,
25]. As for damage identification, the damage index construction for an impaired structural component can be considered as equivalent to the computation of PE forces on its pristine counterpart [
26,
27,
28]. However, the damage localization index constructed in PE method is based on the local dynamic equilibrium, thereby inheriting several shortcomings. Firstly, some material or structural properties in the equation of local motion, such as stiffness and cross-sectional area, may be inaccurately described or even unknown a priori [
29]. Secondly, a local dynamic equilibrium with the assumption of no damping effects is typically adopted, which is limited to non-resonant frequencies [
30].
Motivated by addressing the aforementioned issues of the PE method, the current work proposes a comprehensive method, which is the second contribution of this paper. In this method, a local dynamic equilibrium model considering viscous damping is defined and statistically evaluated to establish the damage localization index without requiring the knowledge of material/structural parameters, thereby extending the PE method to be applied under both resonant and non-resonant conditions. Consequently, the identified mode shapes by the transmissibility-based OMA can be used in the PE method for damage identification. Here, the estimated mode shape data can be treated as equivalent to the normalized displacement data. Moreover, it is impossible to localize all the damage positions by using a single mode shape, as the sensitivity of mode shapes to damage depends on the damage locations. Therefore, a data fusion approach inspired by Bayesian fusion is proposed and investigated to effectively combine the damage information of different modes for robust damage localization, which is the third contribution of this paper.
The structure of this paper is as follows. In
Section 2, a joint SVD approach is proposed to simultaneously decompose several PSDT matrices for robust mode shape estimation. Moreover, an enhanced PE method is developed in
Section 3 to construct an effective damage localization index, which considers the damping effects and does not require the knowledge of the material/structural properties. In addition, to integrate the PE-based damage location information in different modes, a data fusion strategy that was inspired by Bayesian fusion is proposed in
Section 4, which overcomes the conflicting damage location information. Numerical and experimental studies are presented to verify the proposed damage localization method in
Section 5 and
Section 6, respectively. Finally, some key conclusions are summarized in
Section 7.
3. Damage Localization Based on the Improved PE Method
In this section, an improved PE method is proposed, which identifies the damage locations without the information of the unknown material/structural properties. Without loss of generality, the transverse vibration of a beam component is taken as an example and the equation of motion is given according to the Euler–Bernoulli beam theory as
where
and
are the transverse displacement and transverse distributed load at location
, respectively;
,
,
,
and
represent the Young’s modulus, the second moment of the cross-sectional area, damping coefficient, mass density and cross-sectional area, respectively.
Specifically, in a harmonic regime, the steady-state vibration
can be written as
. Assuming that the beam has a uniform cross-section and constant material properties within the inspection area, Equation (14) can be expressed under harmonic regime as
In Equation (15), without the external excitation, the right-hand side becomes zero for a pristine beam. Nevertheless, with the occurrence of damage in this beam component, the left-hand side of Equation (15) does not equal zero anymore when
, which can be adopted as a damage index (DI).
where
,
and
represent the damage-caused changes in the structural properties corresponding to its stiffness, damping and mass, respectively;
becomes
for a beam with
denoting the double Laplacian operator. Due to the local dynamic equilibrium of the damaged beam component, Equation (16) can be rearranged as
From Equations (16) and (17), it can be seen that the transverse vibration of a damaged beam component is equivalent to its corresponding pristine counterpart subjected to a pseudo-excitation force [
25,
30]. Consequently, the damage-induced local pseudo-excitation force can be harnessed for damage detection, localization and quantification.
However, the values of
,
or
in Equation (16) are normally unavailable or inaccurately described in practice. Instead of evaluating the individual material or geometric parameters, an integrated parameter is proposed by converting Equation (16) into
where
is a constant value at a given
. Provided that damage zones only occupy a small area of the inspected structure, the majority of the structure still satisfies
within the inspection region when
. Therefore, coefficient
can be readily determined based on the least-squares criterion at each interested
. In this case, the proposed DI in Equation (18) is capable of localizing damage without the knowledge of material/structural properties.
4. Robust Damage Localizations Based on a Novel Data Fusion Approach
Naturally, for any given , the sensitivity of to damage depends on damage locations. Hence, an integrated damage index that incorporates damage-induced characteristics at different modes should be more robust and effective. However, the damage location information contained in different modes is often in conflict with each other. For instance, one mode provides damage location evidence at position , while another mode may suggest somewhere else. Therefore, a novel data fusion approach is proposed in this paper to circumvent the conflicting damage location information for robust damage localization. Before introducing the proposed data fusion method, a review of the Bayesian fusion is presented first.
At a given
, the damage probability of each measured point is defined as
The basic probabilities at different angular frequencies can be combined based on the Bayesian fusion. Consider that there are two damage information sources at
and
. According to the Bayesian formula, the combination of two damage information sources is
where the prior probability values are assumed as
[
34]. Furthermore, when each damage location information can be treated as independent, Equation (20) is expressed as
Similarly, the Bayesian fusion of damage information at
angular frequencies is
From Equation (22), if damage information is not present at a source
, the Bayesian fusion will not be able to provide effective damage localization, as individual damage information will be disappear in the multiplication operator. Thus, to circumvent this drawback of Bayesian fusion, a variant form of Bayesian fusion is proposed in this paper for robust damage localization, which is defined as
5. Numerical Study
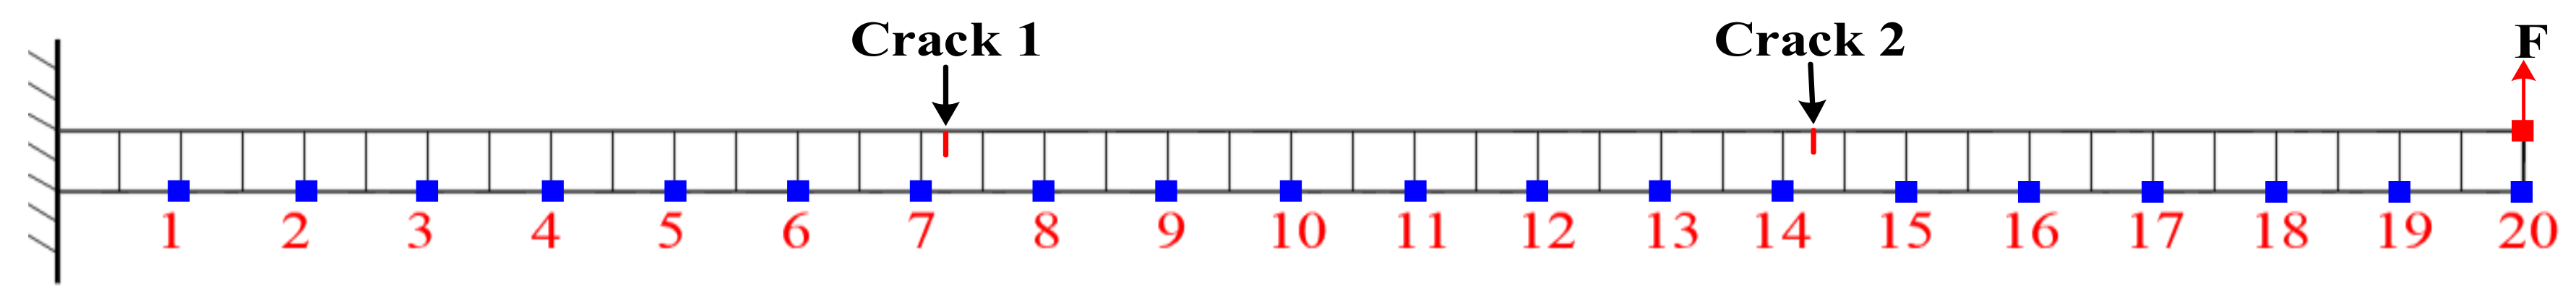
A finite element model of a cantilever beam with two open cracks was coded based on the Euler–Bernoulli beam theory to validate the effectiveness of the proposed mode shape estimation method and the constructed damage localization index. Rayleigh damping,
(
and
, which sets a 2% damping ratio for the first and third modes), was utilized to include the damping effects. The beam was discretized into 40 elements, as shown in
Figure 1, which is fine enough to provide a convergence solution. Other material and geometrical parameters of this cantilever beam are given in
Table 1.
Moreover, the details about the two cracks are presented in
Table 2 and the modelling of cracks is based on the fracture mechanics [
35]. The stiffness matrix of intact elements is treated as unchanged while the stiffness matrix for a cracked element is defined as
in which the transformation matrix
and flexibility matrix
of a cracked element are expressed as
where
denotes the element length,
is the beam width,
is the beam depth and
is the depth of crack.
is an approximate expression of the mode-I stress intensity factor as
In addition, the random excitation force
possesses a normal distribution with the mean value and standard deviation being 0 and 50 N, respectively. Velocity time series are acquired at the labelled 20 points shown in
Figure 1.
Firstly, while aiming to study the noise robustness of different mode shape estimation approaches, Gaussian white noise was introduced to contaminate the acquired velocity responses in the form of
where
d implies a random value of normal distribution with a zero mean and variance being 1,
is the noise level range of [0, 1] and
denotes the standard deviation of vibration responses at the
-th measurement point. To better represent the noise level
, it is quantified using signal-to-noise-ratio (SNR).
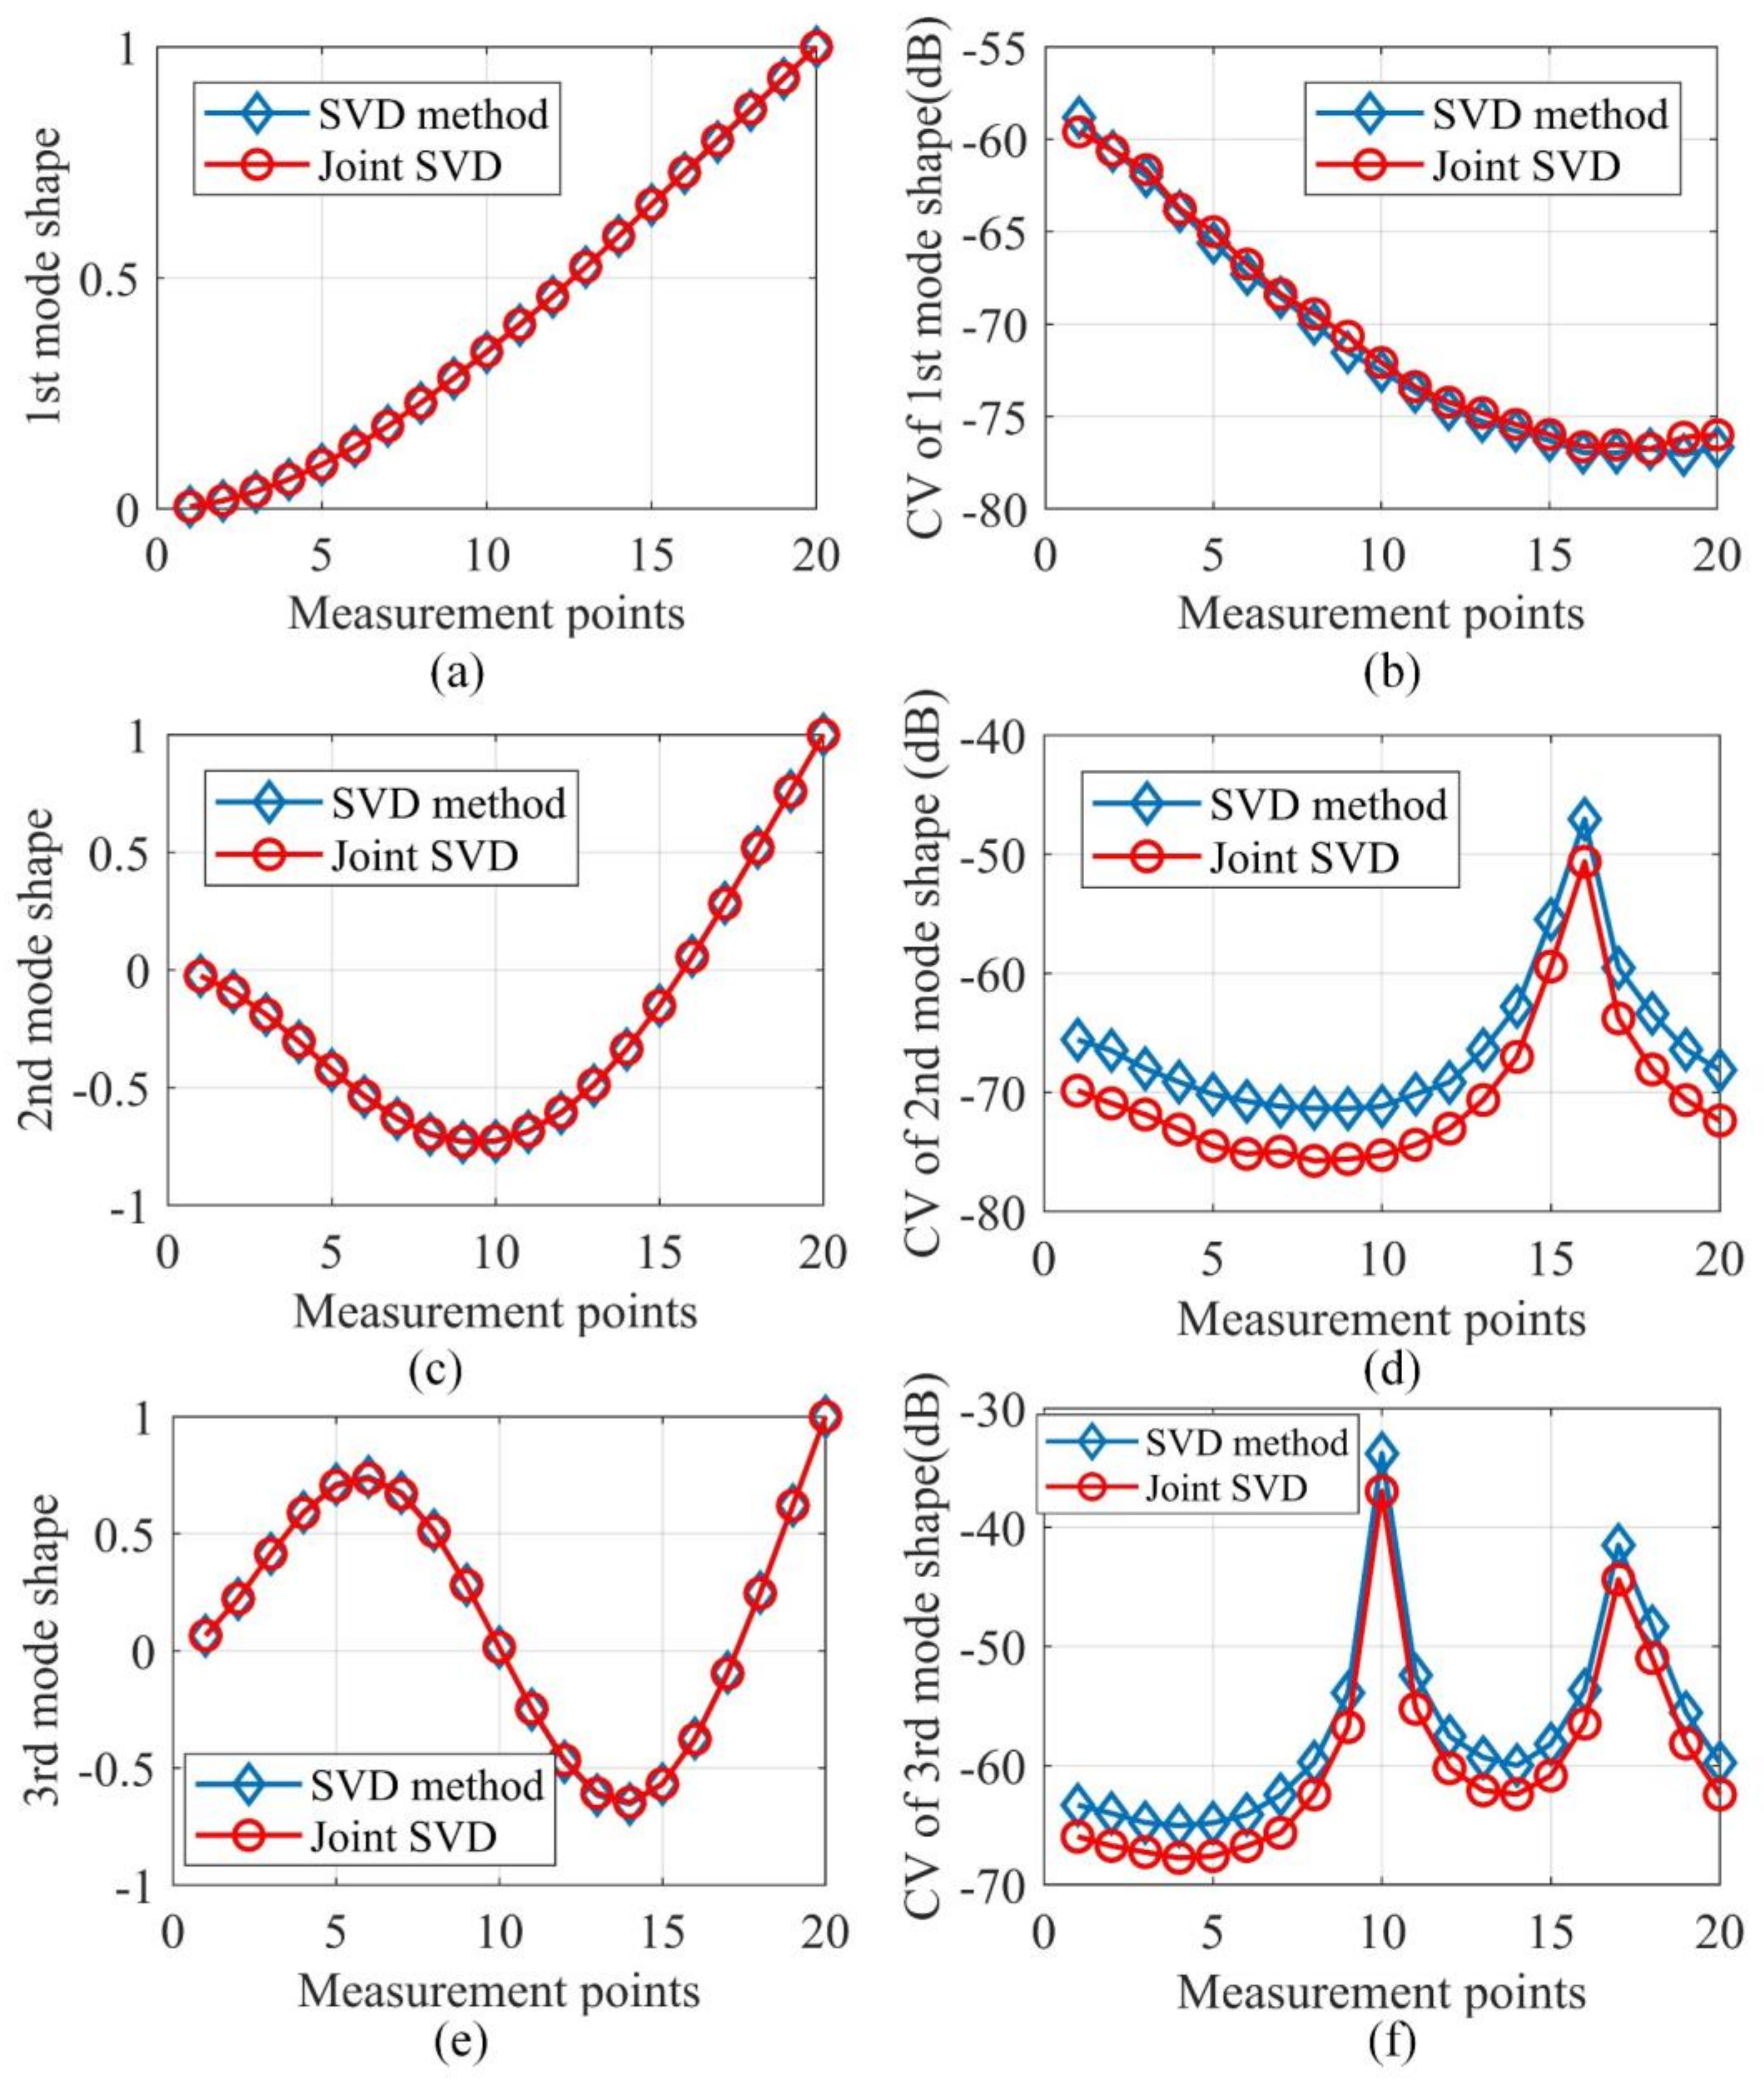
The output responses were polluted by the same noise level SNR = 40 dB 1000 times. With each noise realization, the mode shapes were evaluated by SVD of PSDT and joint SVD of PSDT methods, respectively. For both SVD of PSDT and joint SVD of PSDT methods, the system natural frequencies were determined by the proposed natural frequency indicator in Equation (10), and examples of the identified natural frequencies of this numerical case are illustrated in
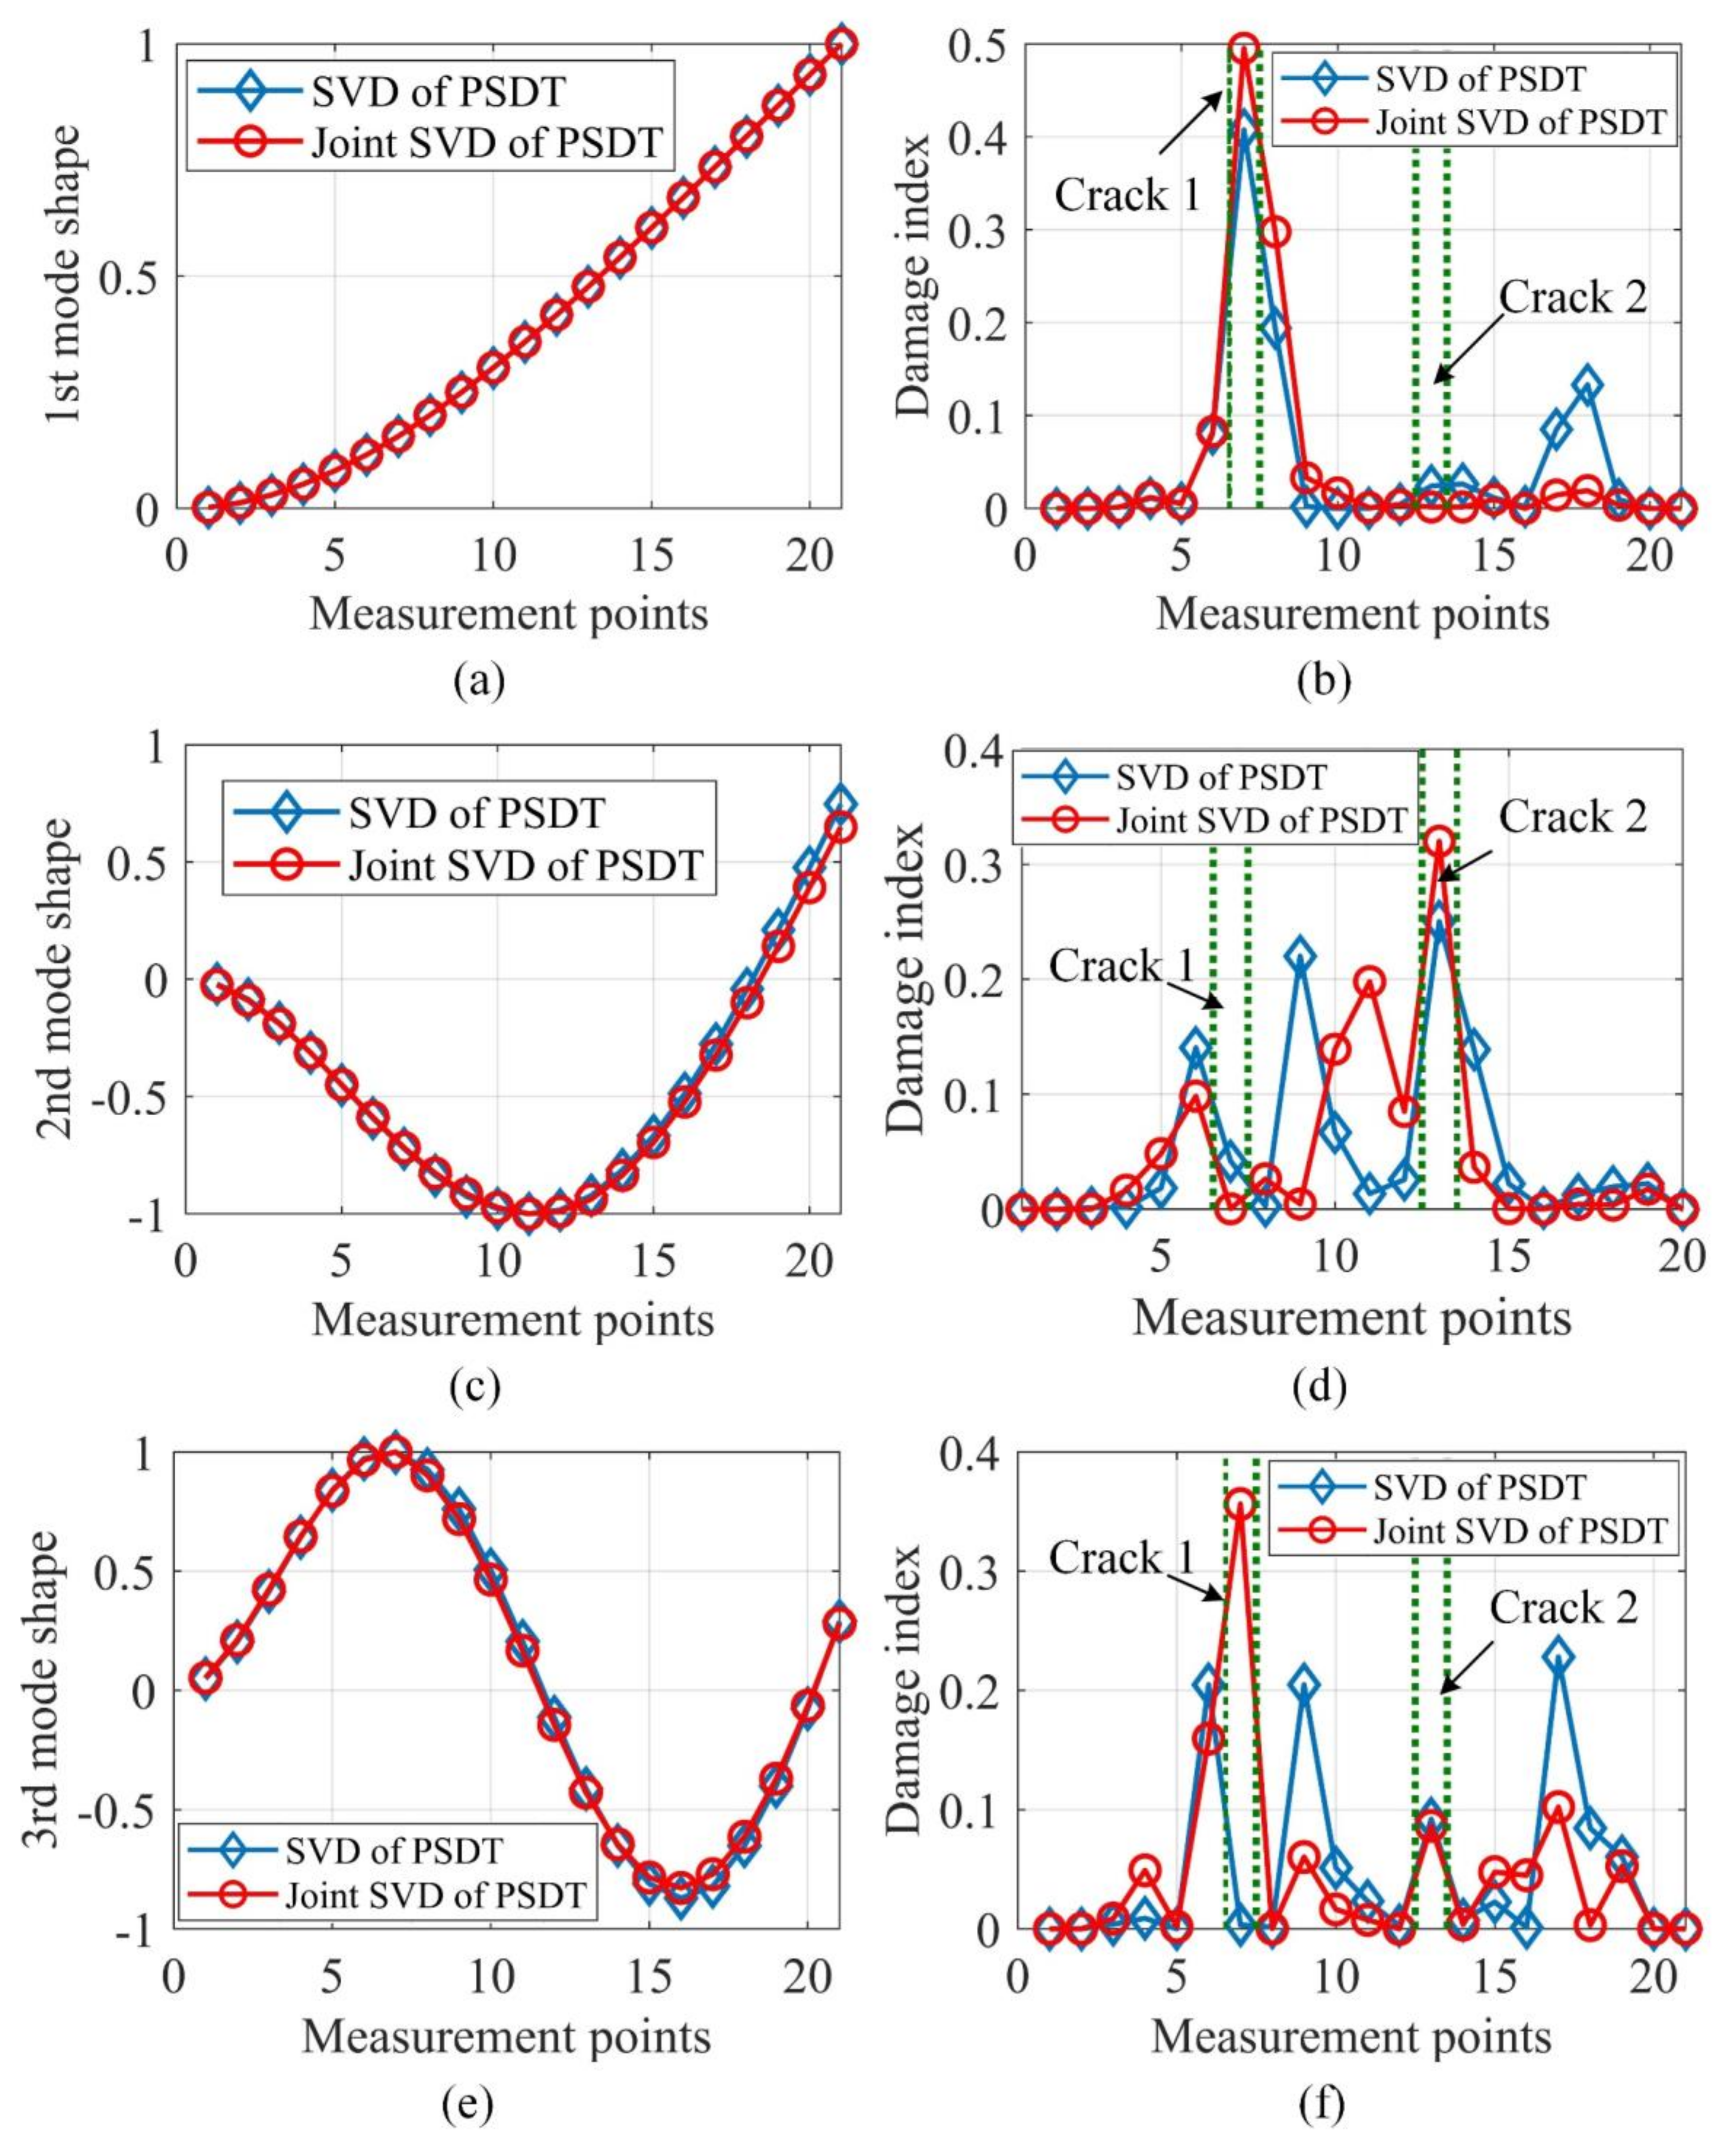
Figure 2. The first three natural frequencies can be clearly detected, which demonstrates the effectiveness of the proposed system’s natural frequency indicator. With the obtained natural frequencies, their corresponding mode shapes were estimated by applying SVD of PSDT and joint SVD of PSDT methods, respectively. The first three mode shapes and their coefficients of variation (CVs) over 1000 noise realizations are shown in
Figure 3. It is worth noting that the peaks in the CV plots in
Figure 3d,f are located around the node points of corresponding mode shapes. The reason is that the mode shape values around node points are almost zero, which led to a very low signal-to-noise-ratio and large CV values.
From
Figure 3a,c,e, it can be seen that the estimated mode shapes by both methods are highly similar to each other. However,
Figure 3d,f manifest that the CVs of the joint SVD method are smaller than those of the SVD method for the second and third modes, which shows that the mode shapes estimated by joint SVD of PSDT method are more noise-robust than those by SVD of PSDT method. Here, the CV of the first mode as given in
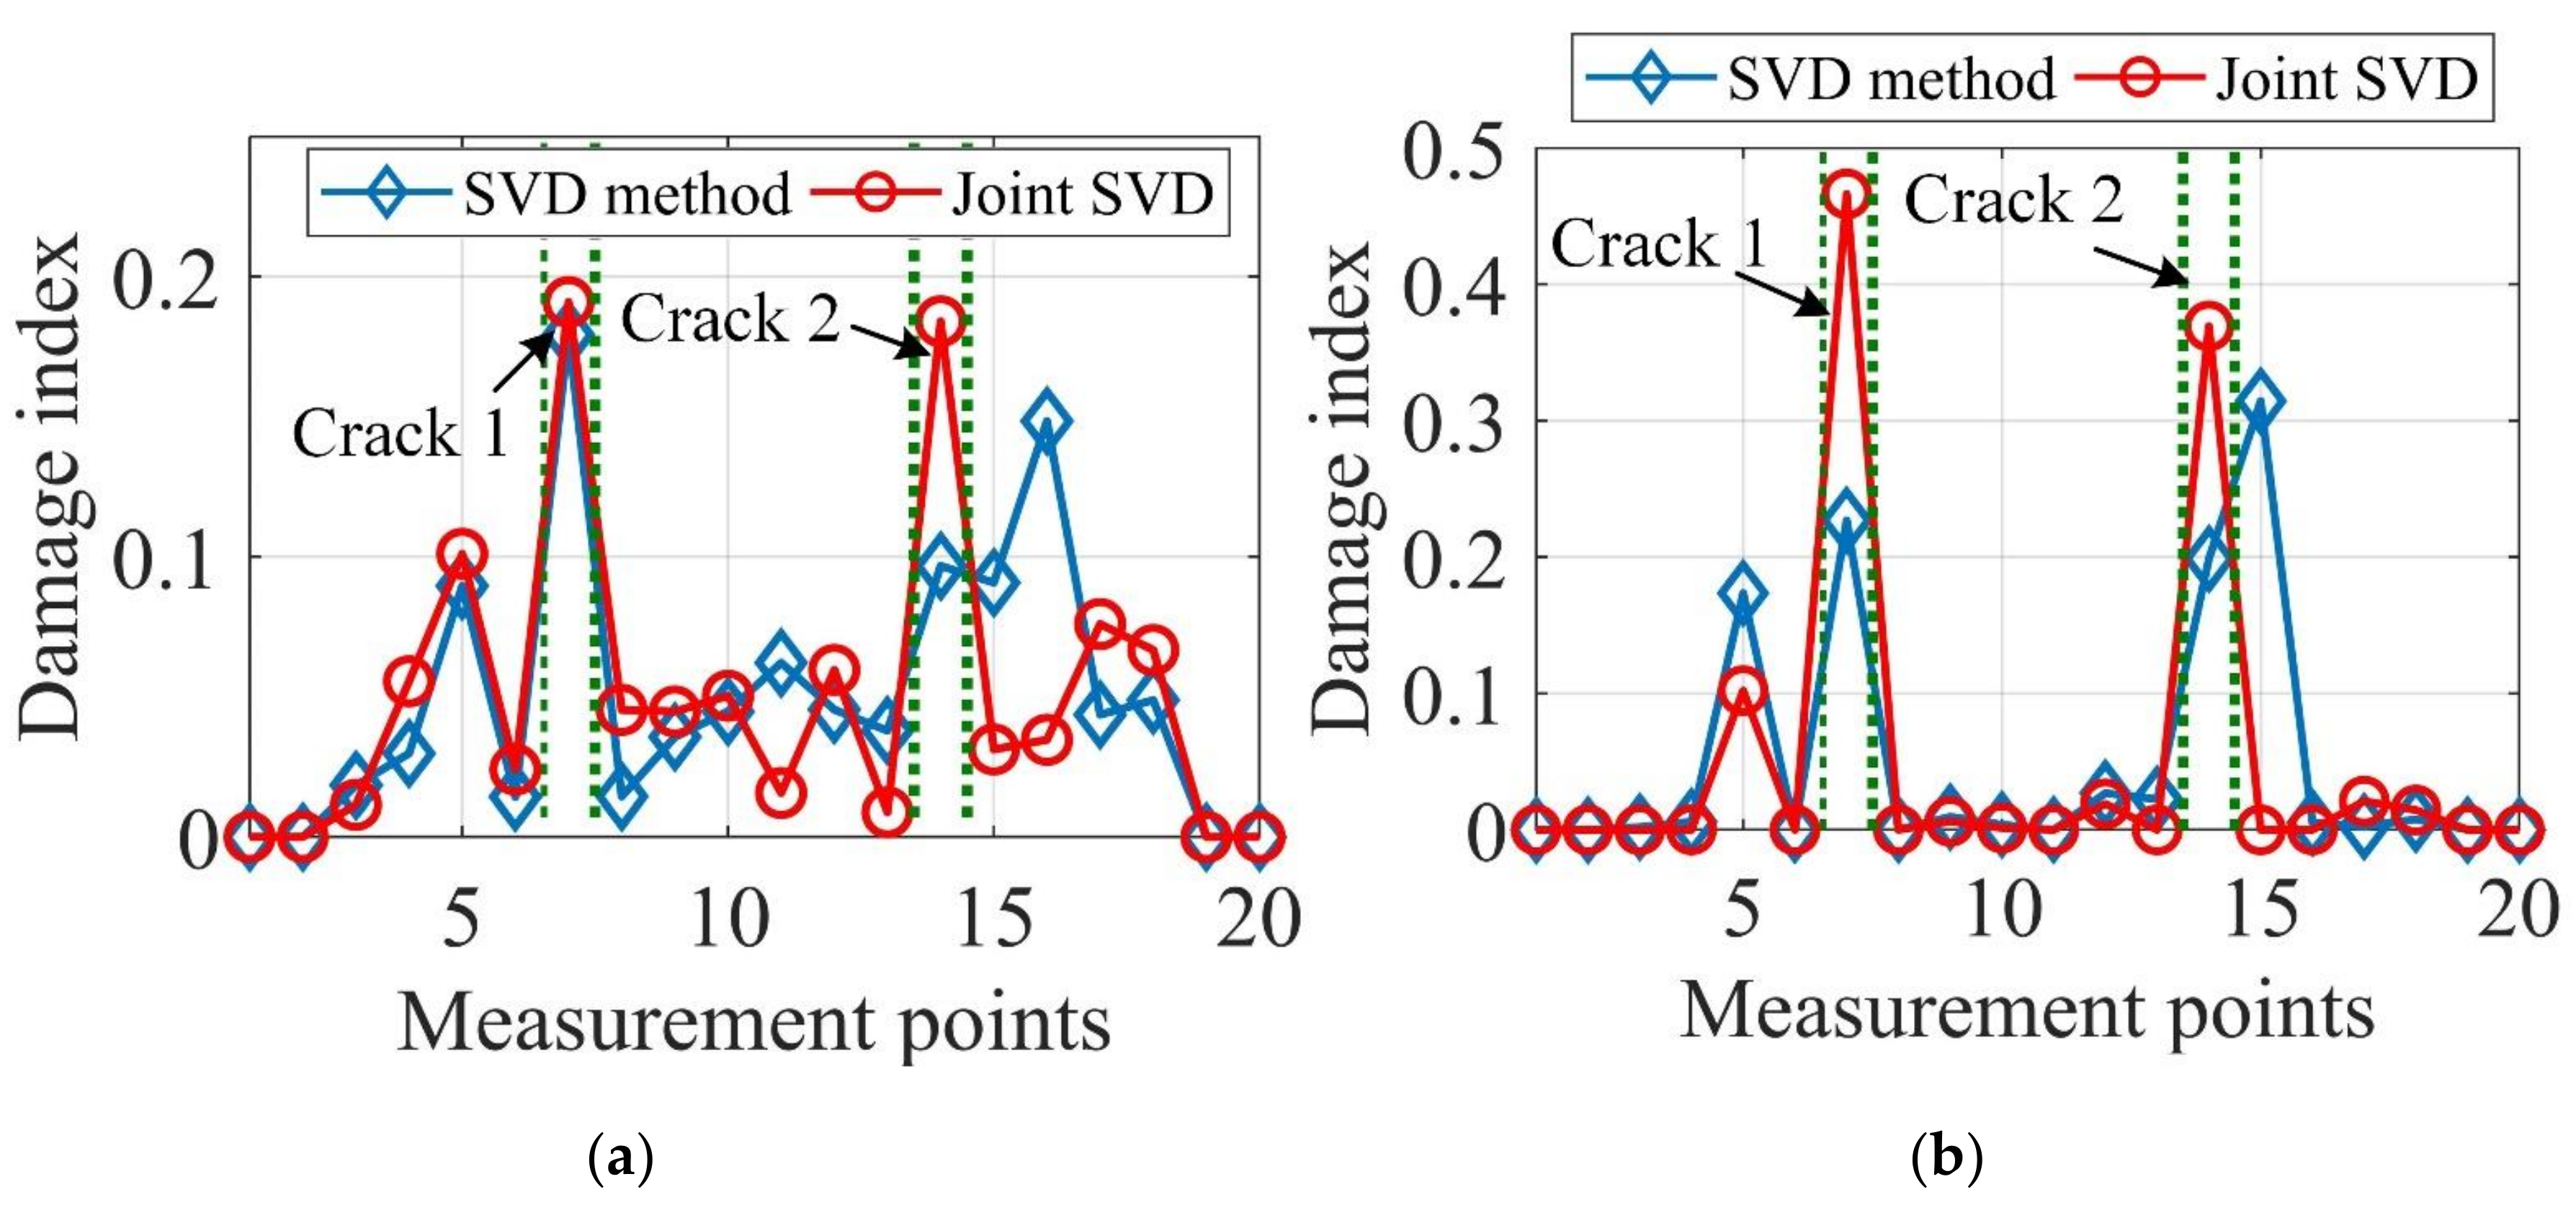
Figure 3b indicates no obvious difference for these two mode shape estimation methods. The possible reason is that the first mode, which is the dominant mode shape of the random vibration in this study, is more robust to the influences of measurement noise than the mode shapes associated with higher natural frequencies. Furthermore, the proposed damage localization index based on identified mode shapes by joint SVD of PSDT should be more accurate and effective. For the validation of this conclusion, a numerical case containing two cracks of 5% depth reduction was studied and the damage localization results under noise level SNR = 40 dB are depicted in
Figure 4.
In
Figure 4, the damage localization results of the joint SVD of PSDT method outperform the SVD of PSDT method in terms of accuracy and noise robustness. In addition, by comparing
Figure 4b with
Figure 4a, it can be concluded that the proposed data fusion approach provides more accurate damage localization results than the traditional Bayesian fusion approach. Later on, the defects of the Bayesian fusion are further illustrated by using the experimental studies in
Section 6.
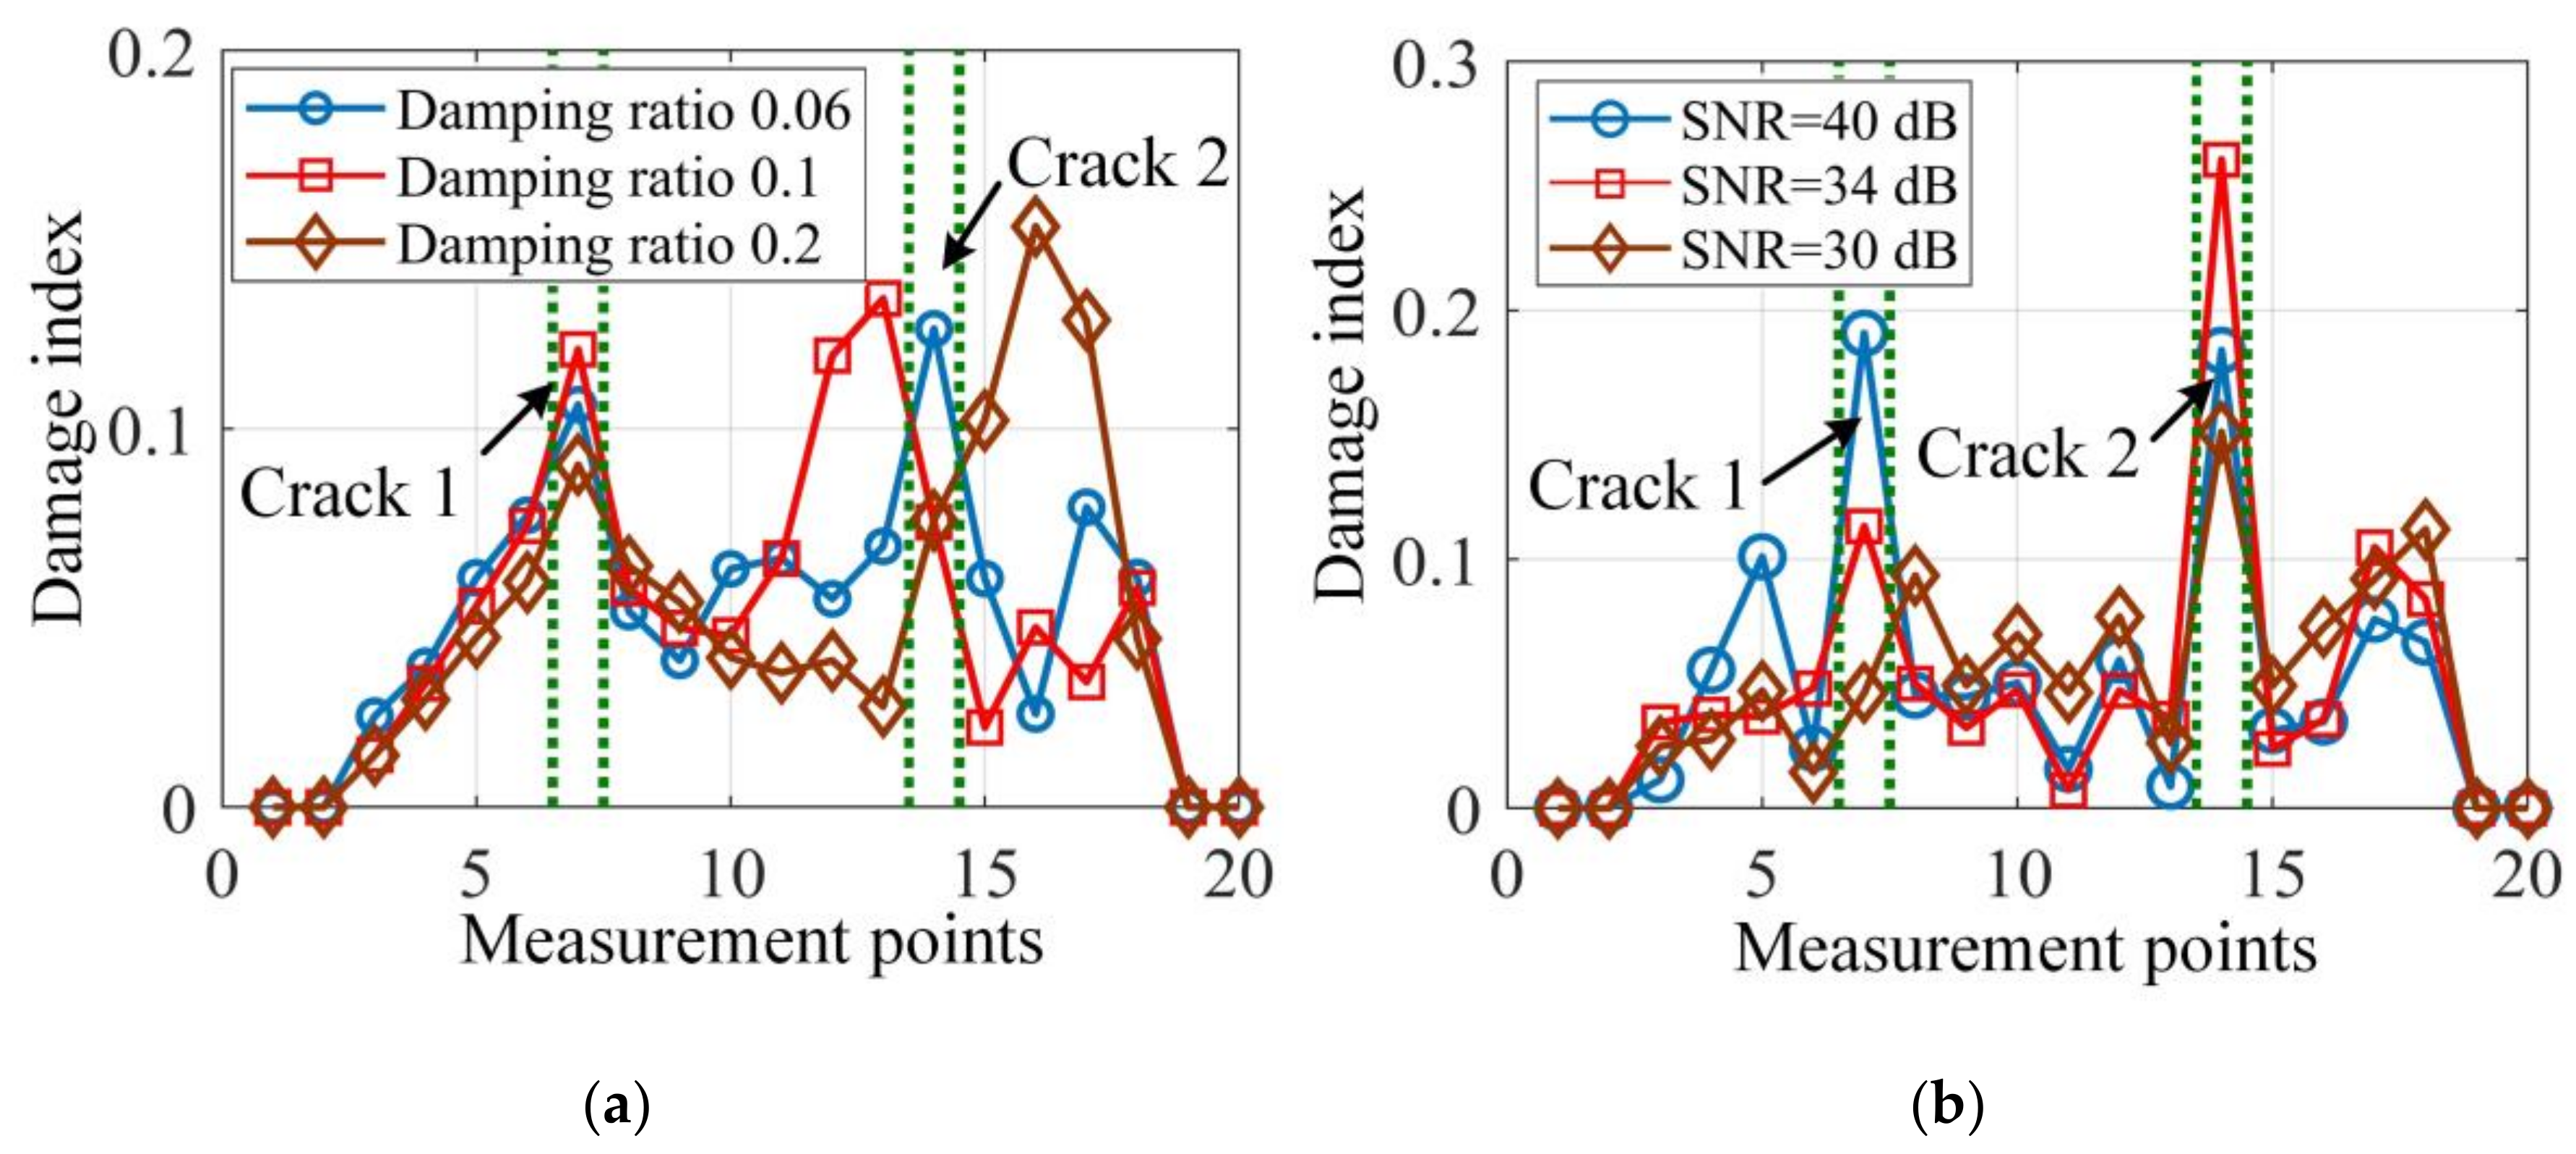
In addition, to test the sensitivity and robustness of the proposed damage localization method to different damping ratios, noise levels, severity of damage and damage positions, different damage scenarios were simulated and damage localization results are illustrated in
Figure 5 and
Figure 6.
In
Figure 5a, the damage localization accuracy decreases for large damping ratios, but the damage index peaks still appear around the damage positions and provide useful damage localization information. The reason is that a higher damping ratio will degrade the estimation accuracy of resonant frequencies, and thus the corresponding mode shapes, as the resonant frequency peaks shown in
Figure 2 will become flatter and harder to be identified in the proposed OMA method. For high noise levels, such as given in
Figure 5b, the lower SNR undermines the damage localization results, as the two damage locations cannot correctly detected when SNR decreases to 30 dB. In addition, the two damage index peaks in
Figure 5b have different heights, which indicates different damage sensitivities.
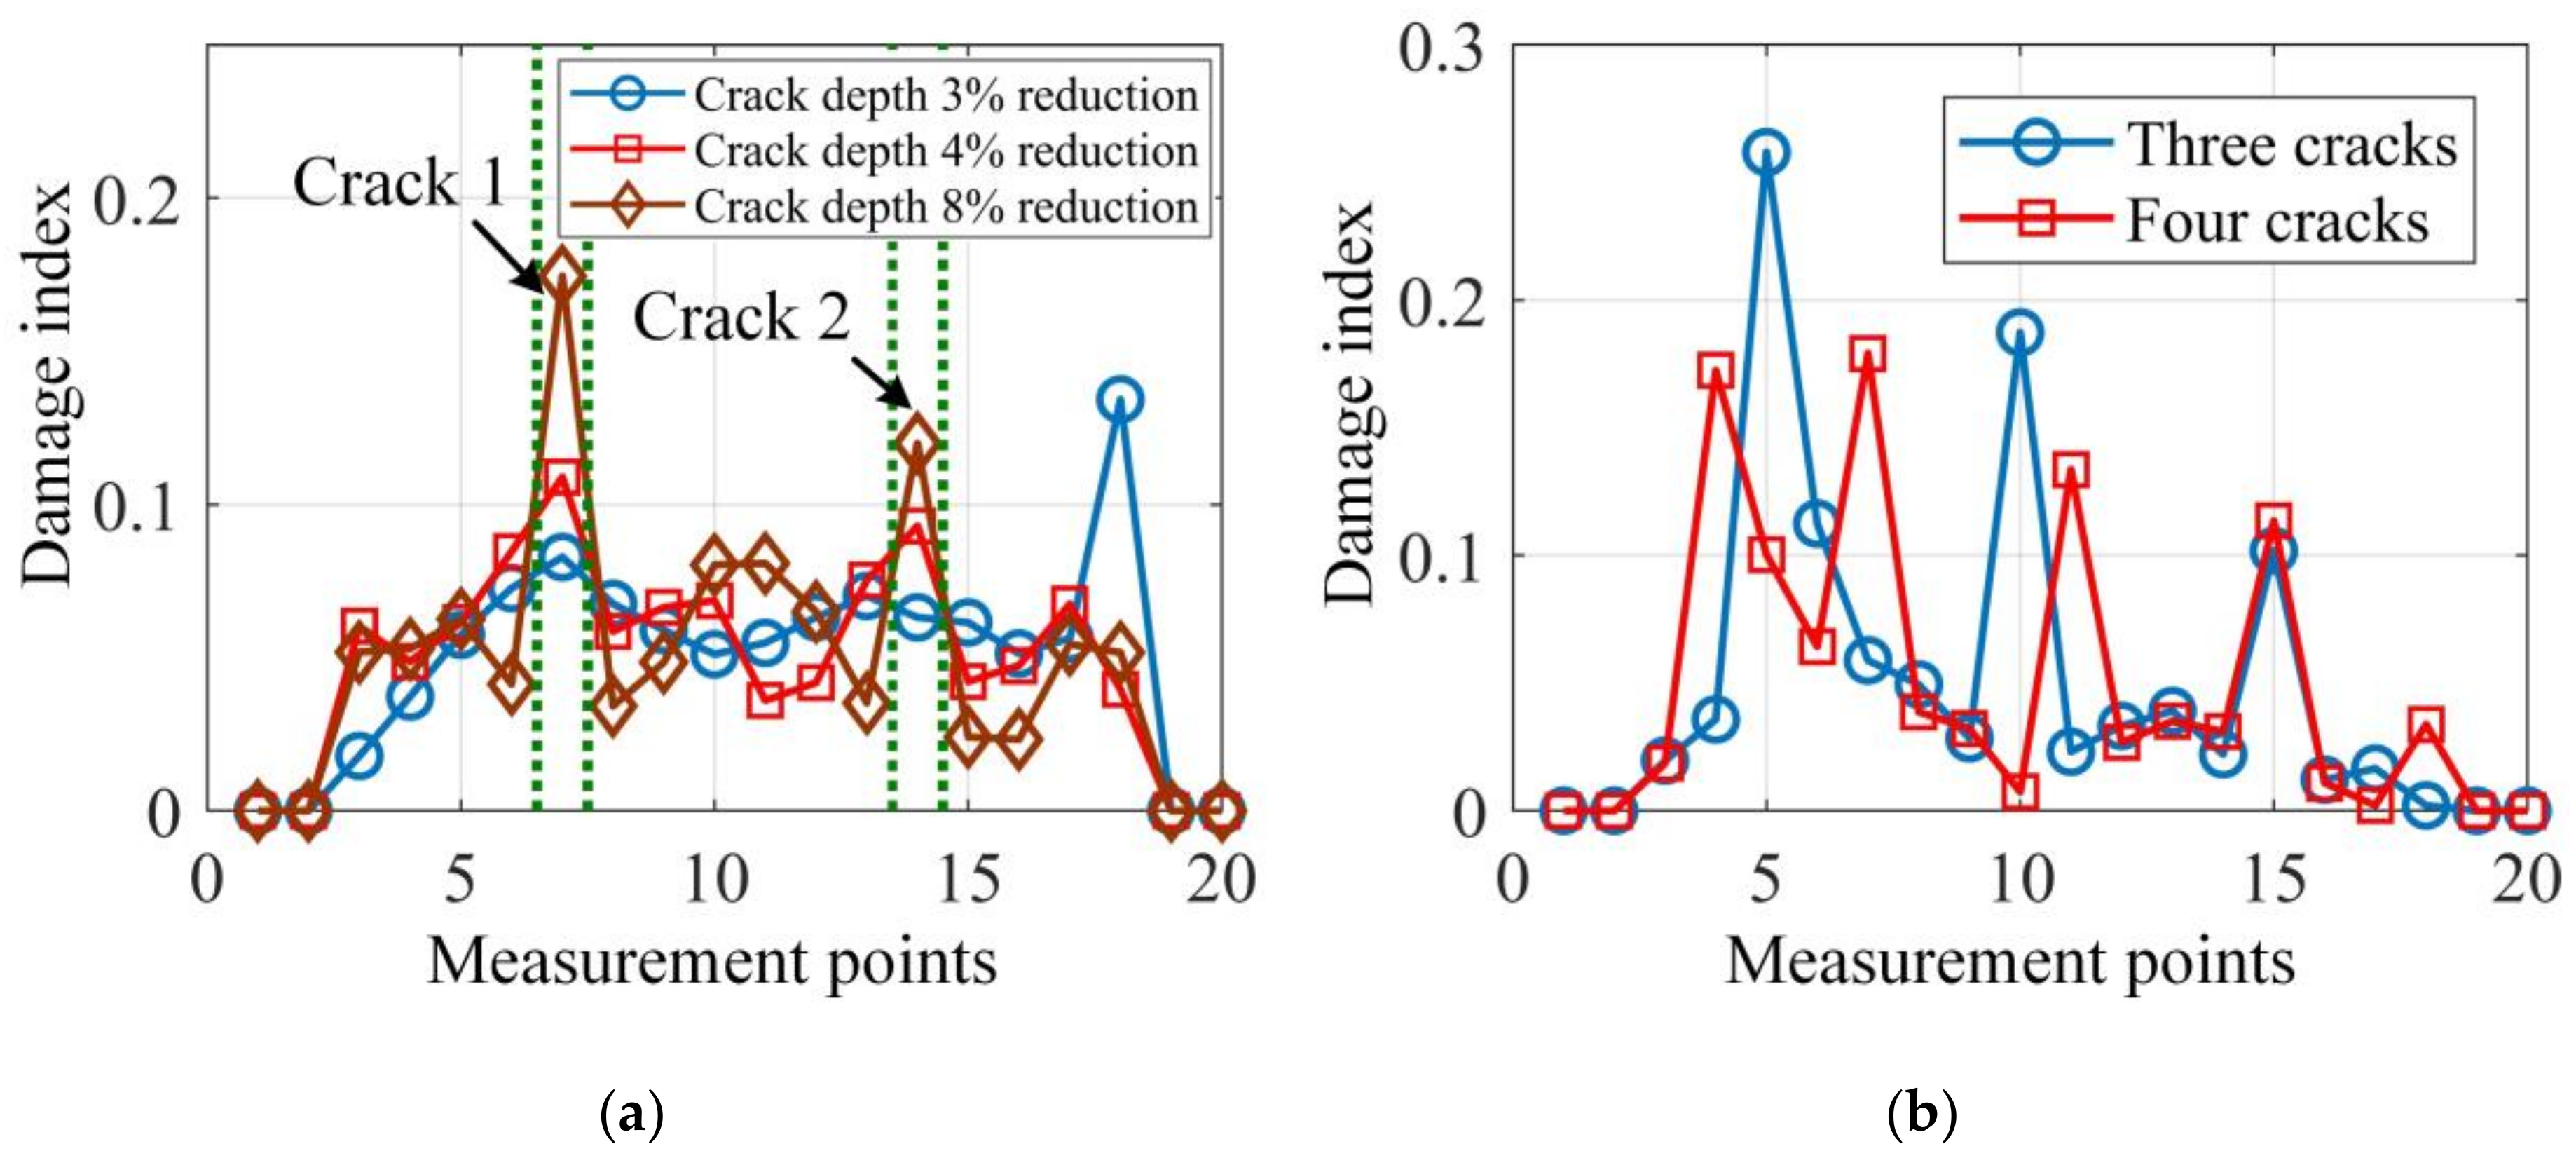
It can be seen from
Figure 6a that the proposed damage localization method fails when the depth reduction of the two cracks gets as low as 3%. However, being able to identify depth reduction just above 3% should be considered to be highly accurate. Naturally, the larger the damage depth reduction, the sharper the damage index at the damage locations. In addition, the proposed method examines the local dynamic equilibrium point-by-point by using the mode shape data and it is suitable for multi-crack localization, as demonstrated in
Figure 6b. In
Figure 6b, the two damage cases with three and four cracks are clearly localized by the damage index peaks.
6. Experimental Studies
The purposes of this part were twofold. First, the mode shapes calculated by joint SVD of PSDT were experimentally proven to be more accurate and effective in damage localization than those by SVD of PSDT method. Secondly, the proposed data fusion approach was validated to be more robust and effective for damage localization than the Bayesian fusion.
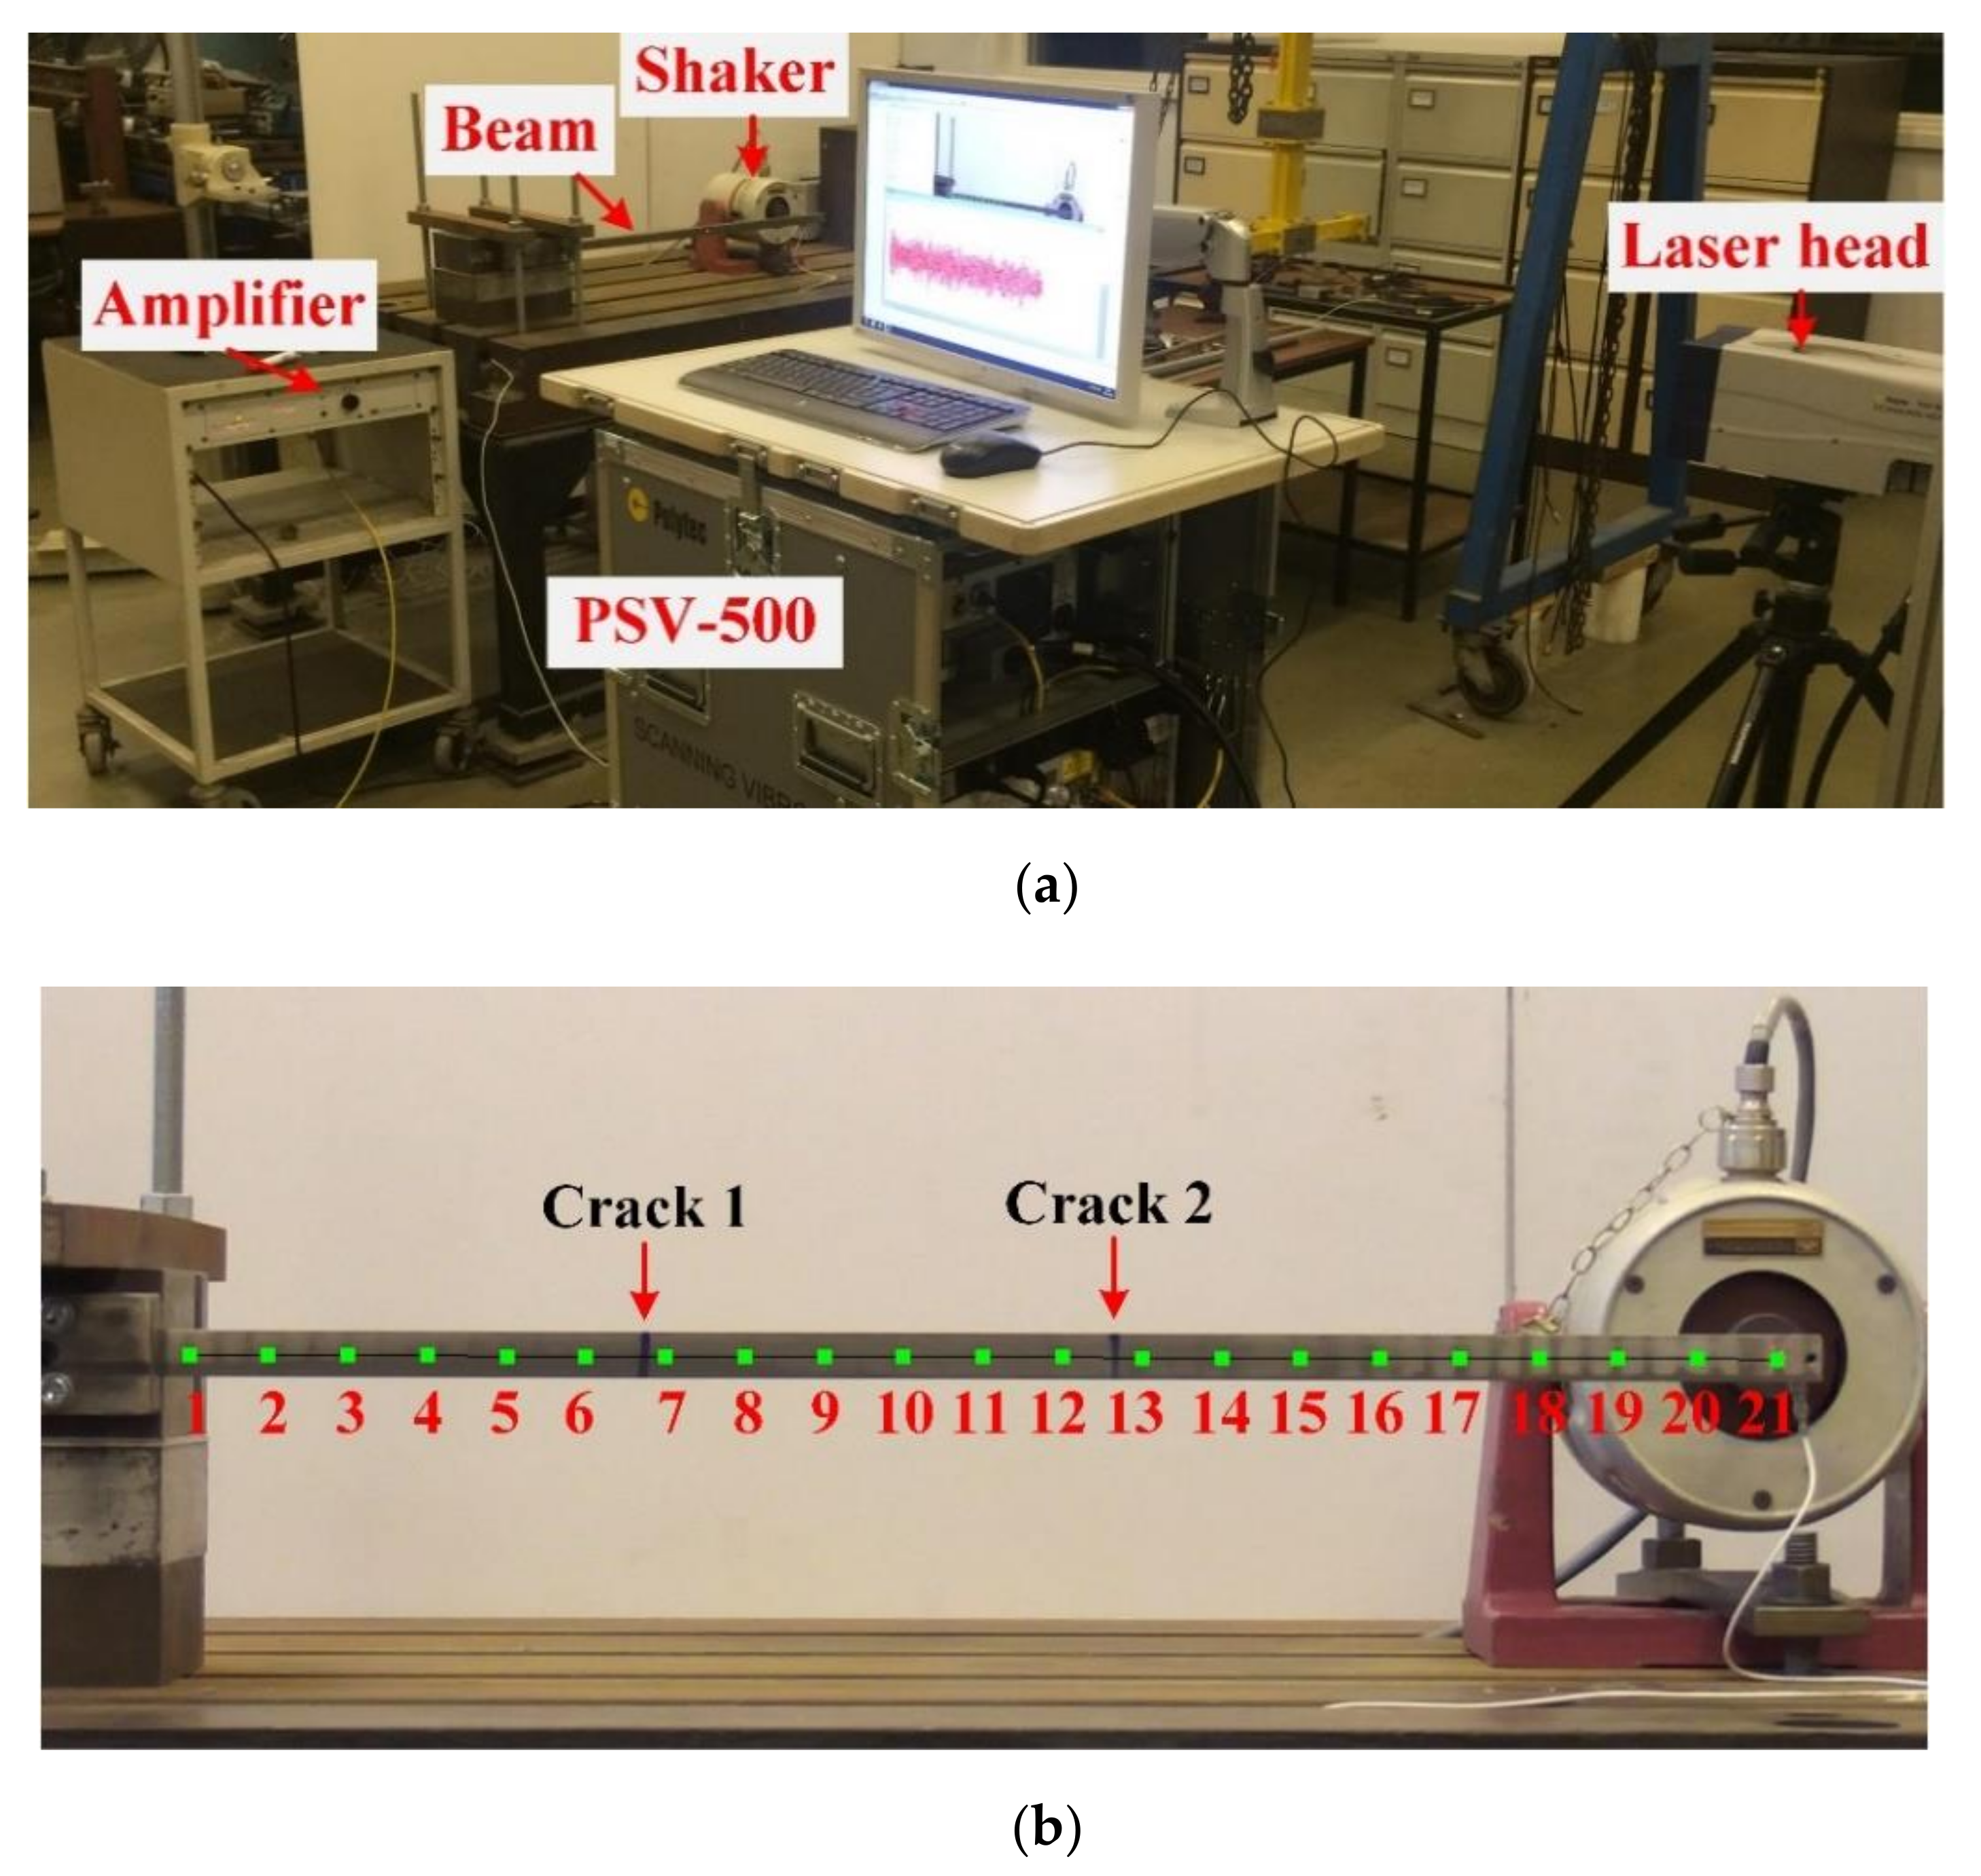
Two cantilever beams of
with two cracks of different damage severities were used. A PSV-500 Scanning Laser Vibrometer was used for the velocity response acquisition at the prescribed 21 measurement points shown in
Figure 7b. A pseudo-random excitation with frequency range of 0–800 Hz was adopted to excite the cantilever beam at the free end via a shaker (LDS V406). The excitation has a normal distribution with mean value and standard deviation being 0 and 13.2 N, respectively. Furthermore, damage was machined as narrow slots, and its details are tabulated in
Table 3. In addition, the cracks are on the opposite sides of the measurement surface and marked as the blue lines in the front view in
Figure 7b. For each measurement point, as shown in
Figure 7b, a total data acquisition time of 12.5 s was used with a sampling frequency of 2000 Hz. The PSV-500 system successively moved to the next measurement point while repeating the excitation. For information, the time domain signals of the excitation force and velocities at measurement points 1, 10 and 21 are shown in
Figure 8.
Firstly, the proposed system natural frequency indicator defined in Equation (10) is presented for experimental case 1 in
Figure 9, and the first three natural frequencies can be clearly determined, which experimentally validates the effectiveness of the proposed system natural frequency indicator. After this, the corresponding mode shape and damage localization results at each natural frequency were computed by joint SVD of PSDT and SVD of PSDT methods respectively, which are illustrated in
Figure 10.
Figure 10b,d,f illustrates that the mode shape at a frequency is sensitive to damage, depending on locations. Therefore, a single mode shape is not robust for multi-damage localizations. Furthermore,
Figure 10b,d,f validates that the mode shapes estimated based on joint SVD of PSDT matrices present more accurate damage localization results than those by SVD of PSDT matrix. To achieve a robust damage index, the Bayesian fusion and the proposed data fusion in Equation (23) are harnessed to construct the integrated damage localization index, whose results are graphed in
Figure 11.
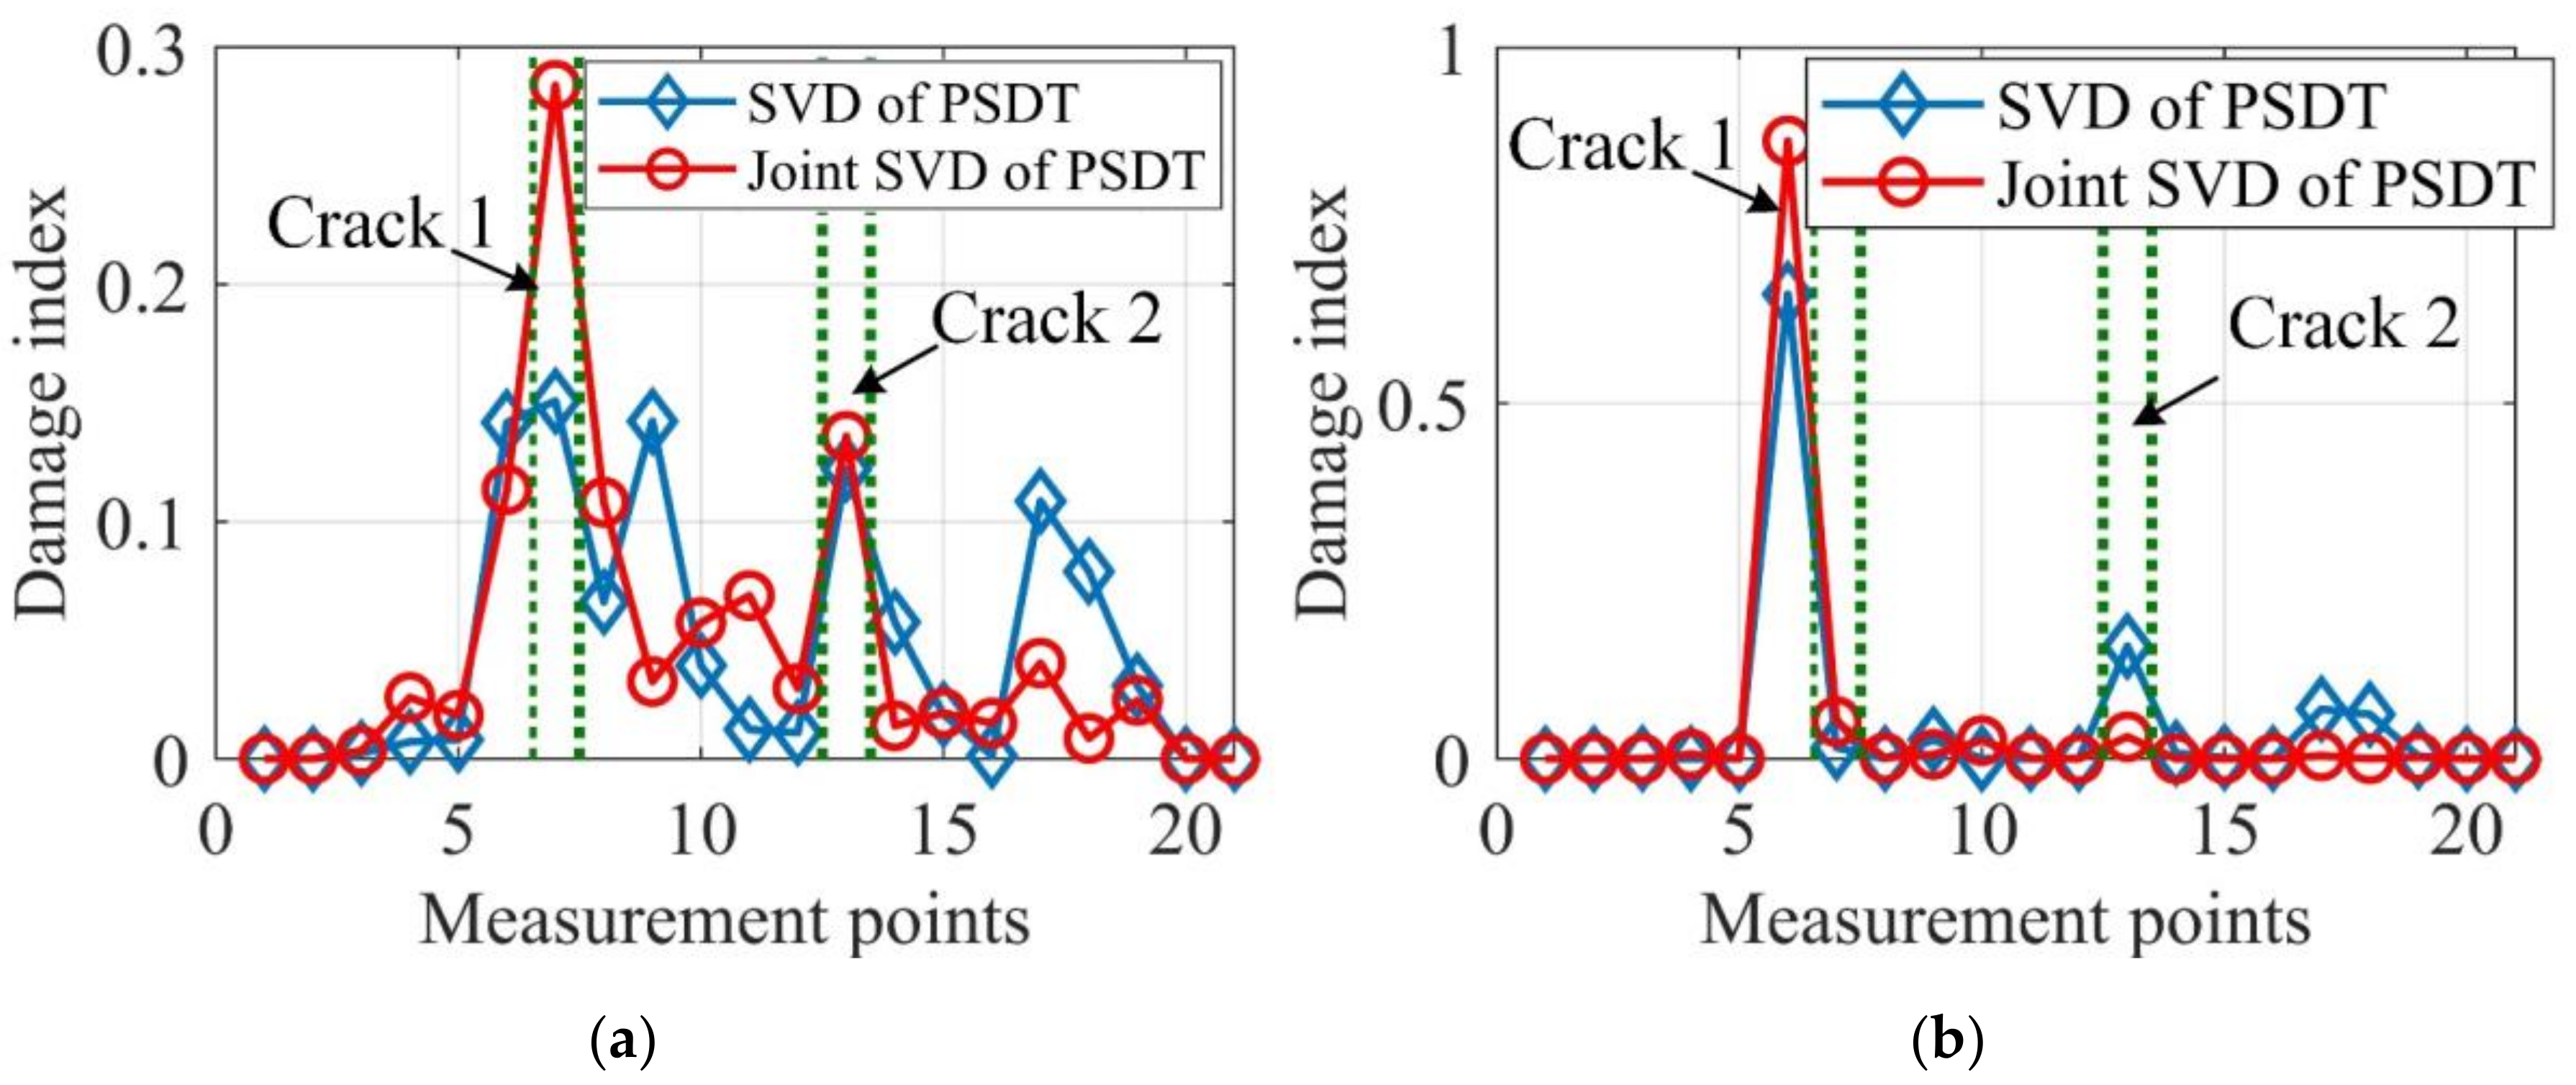
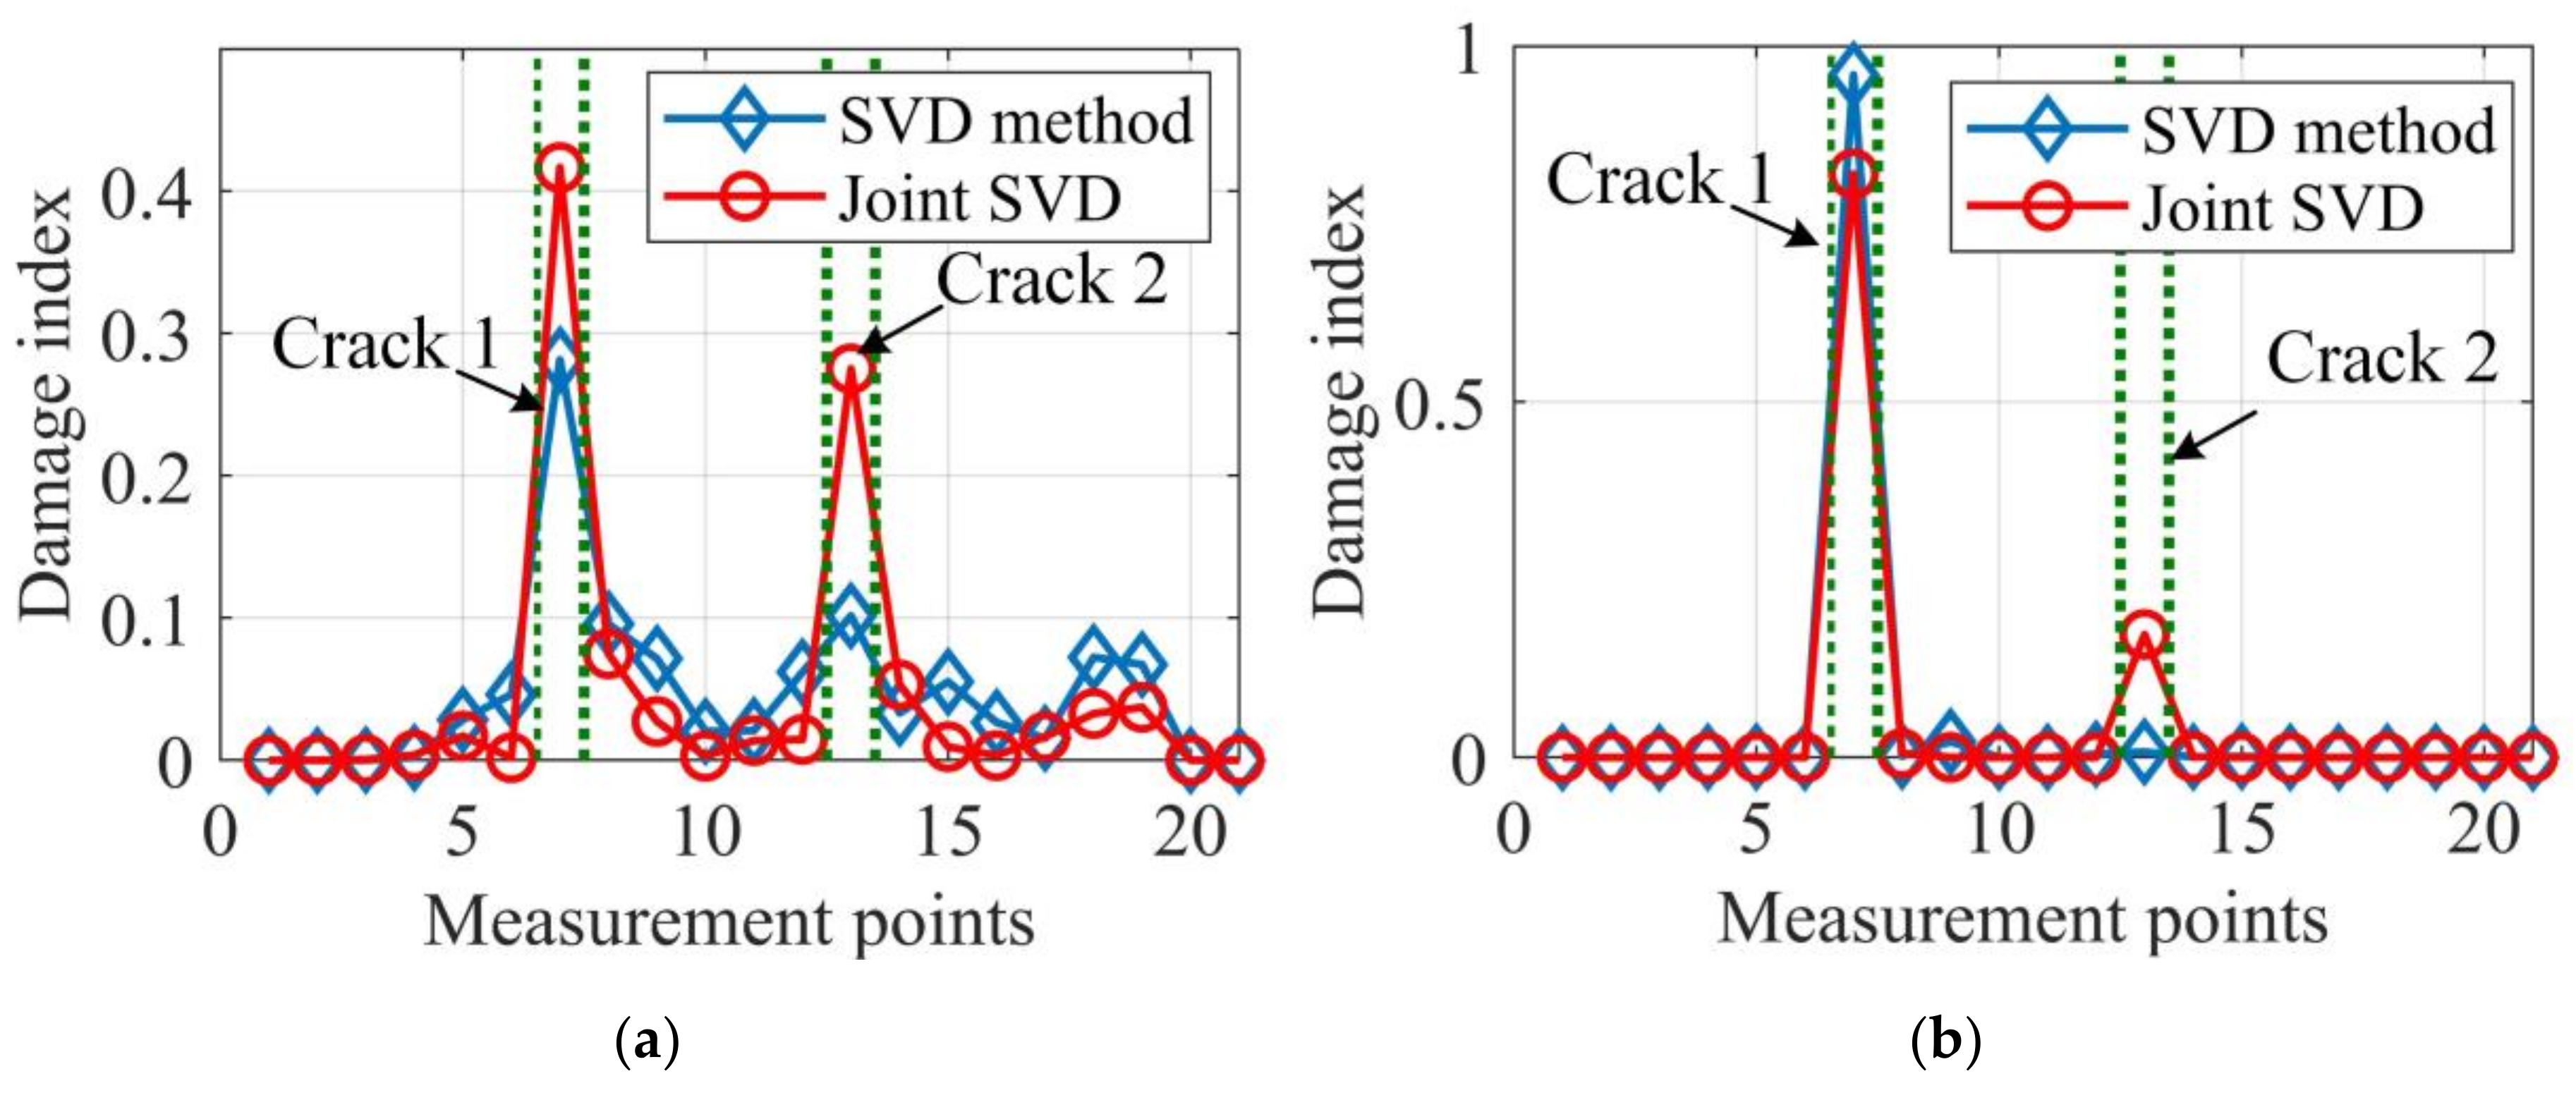
It can be seen from
Figure 11 that damage localization results based on the joint SVD method are more accurate and provide fewer misleading alarms than those by the SVD method. Moreover, by comparing
Figure 11b with
Figure 11a, it can be concluded that damage localization based on the proposed data fusion approach outperforms the traditional Bayesian fusion method, as the damage localization of Bayesian fusion cannot correctly detect crack 1 and provides more misleading alarms. To further verify the proposed data fusion approach for robust damage localization, experimental case 2 with two cracks of 30% depth reduction was also tested and the damage localization results are presented in
Figure 12.
A comparison of
Figure 12a with
Figure 12b shows that both the proposed data fusion approach and Bayesian fusion methods produce accurate damage localization results for the joint SVD method, but the Bayesian fusion cannot provide useful information for crack 2 for the SVD method. Besides, by considering the damage localization results in
Figure 11, it can be concluded that the proposed data fusion approach always achieves accurate damage localization results and is more reliable, especially for less severe damage cases. Furthermore, the damage localization results based on the joint SVD method are always more accurate than those by SVD method. Therefore, the proposed mode shape estimation method and data fusion approach, when combined, significantly improve the damage localization accuracy that cannot be obtained based on the existing methods, and also have the potential to be applied in practical applications under ambient excitation.


