Development of Sign Language Motion Recognition System for Hearing-Impaired People Using Electromyography Signal

Abstract
:1. Introduction
2. Mechanism and Algorithm
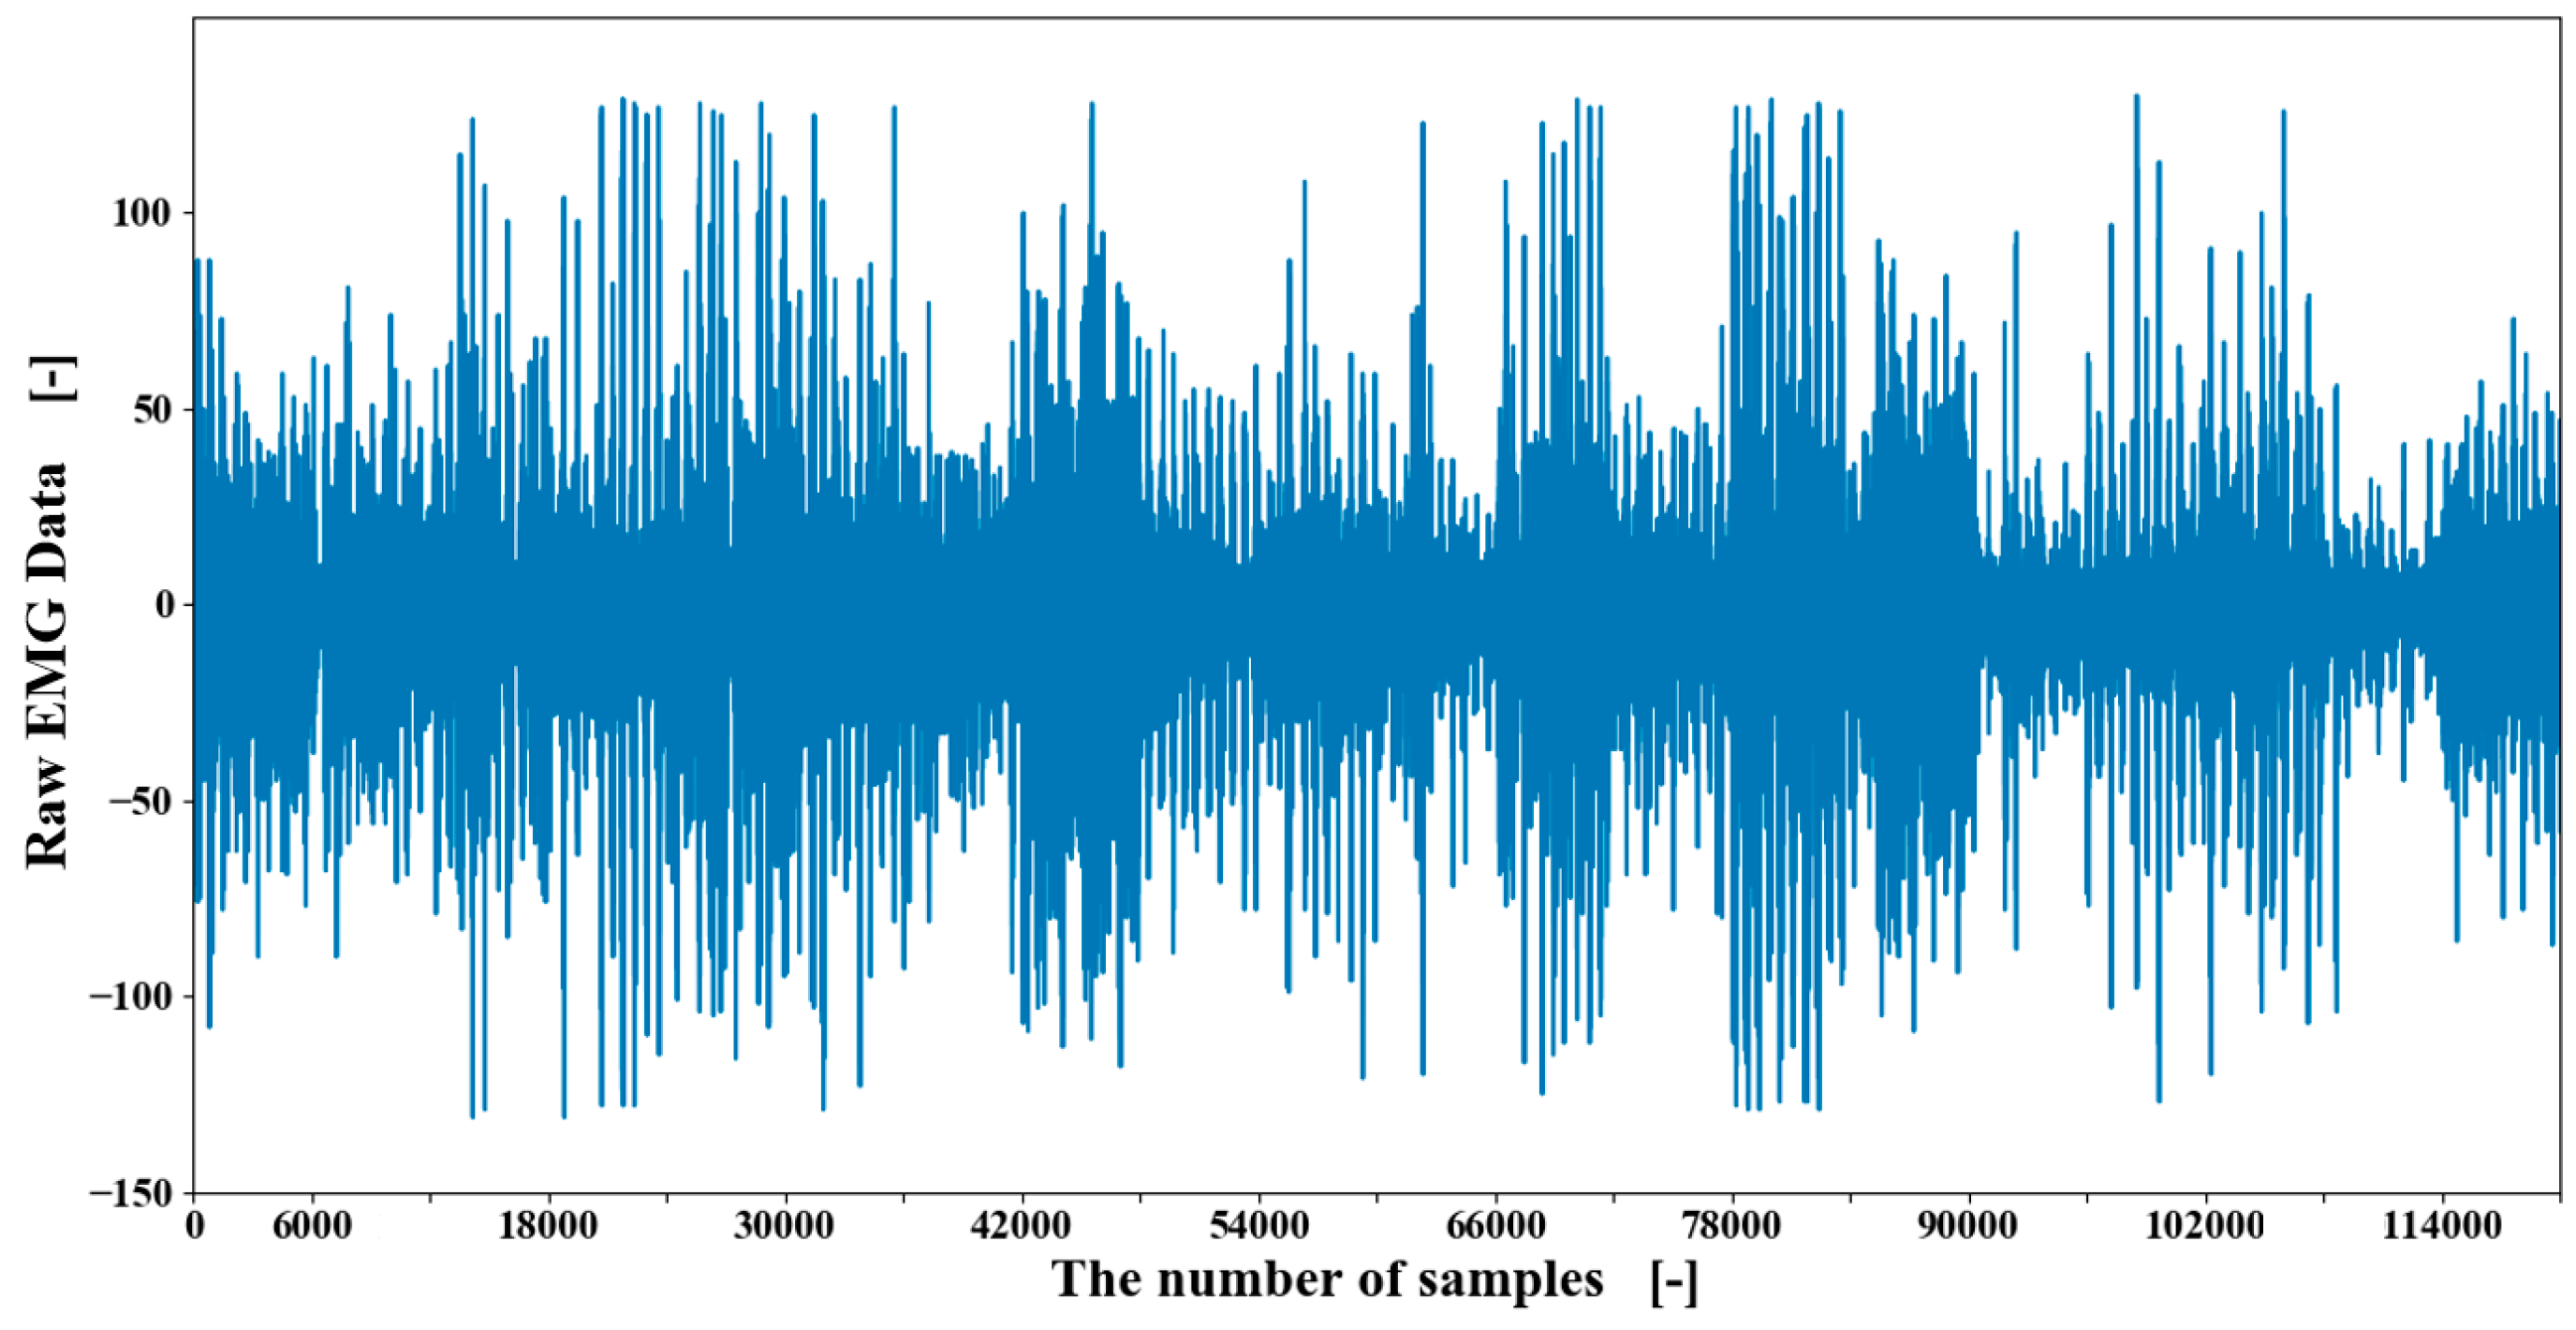
2.1. EMG Data Collection
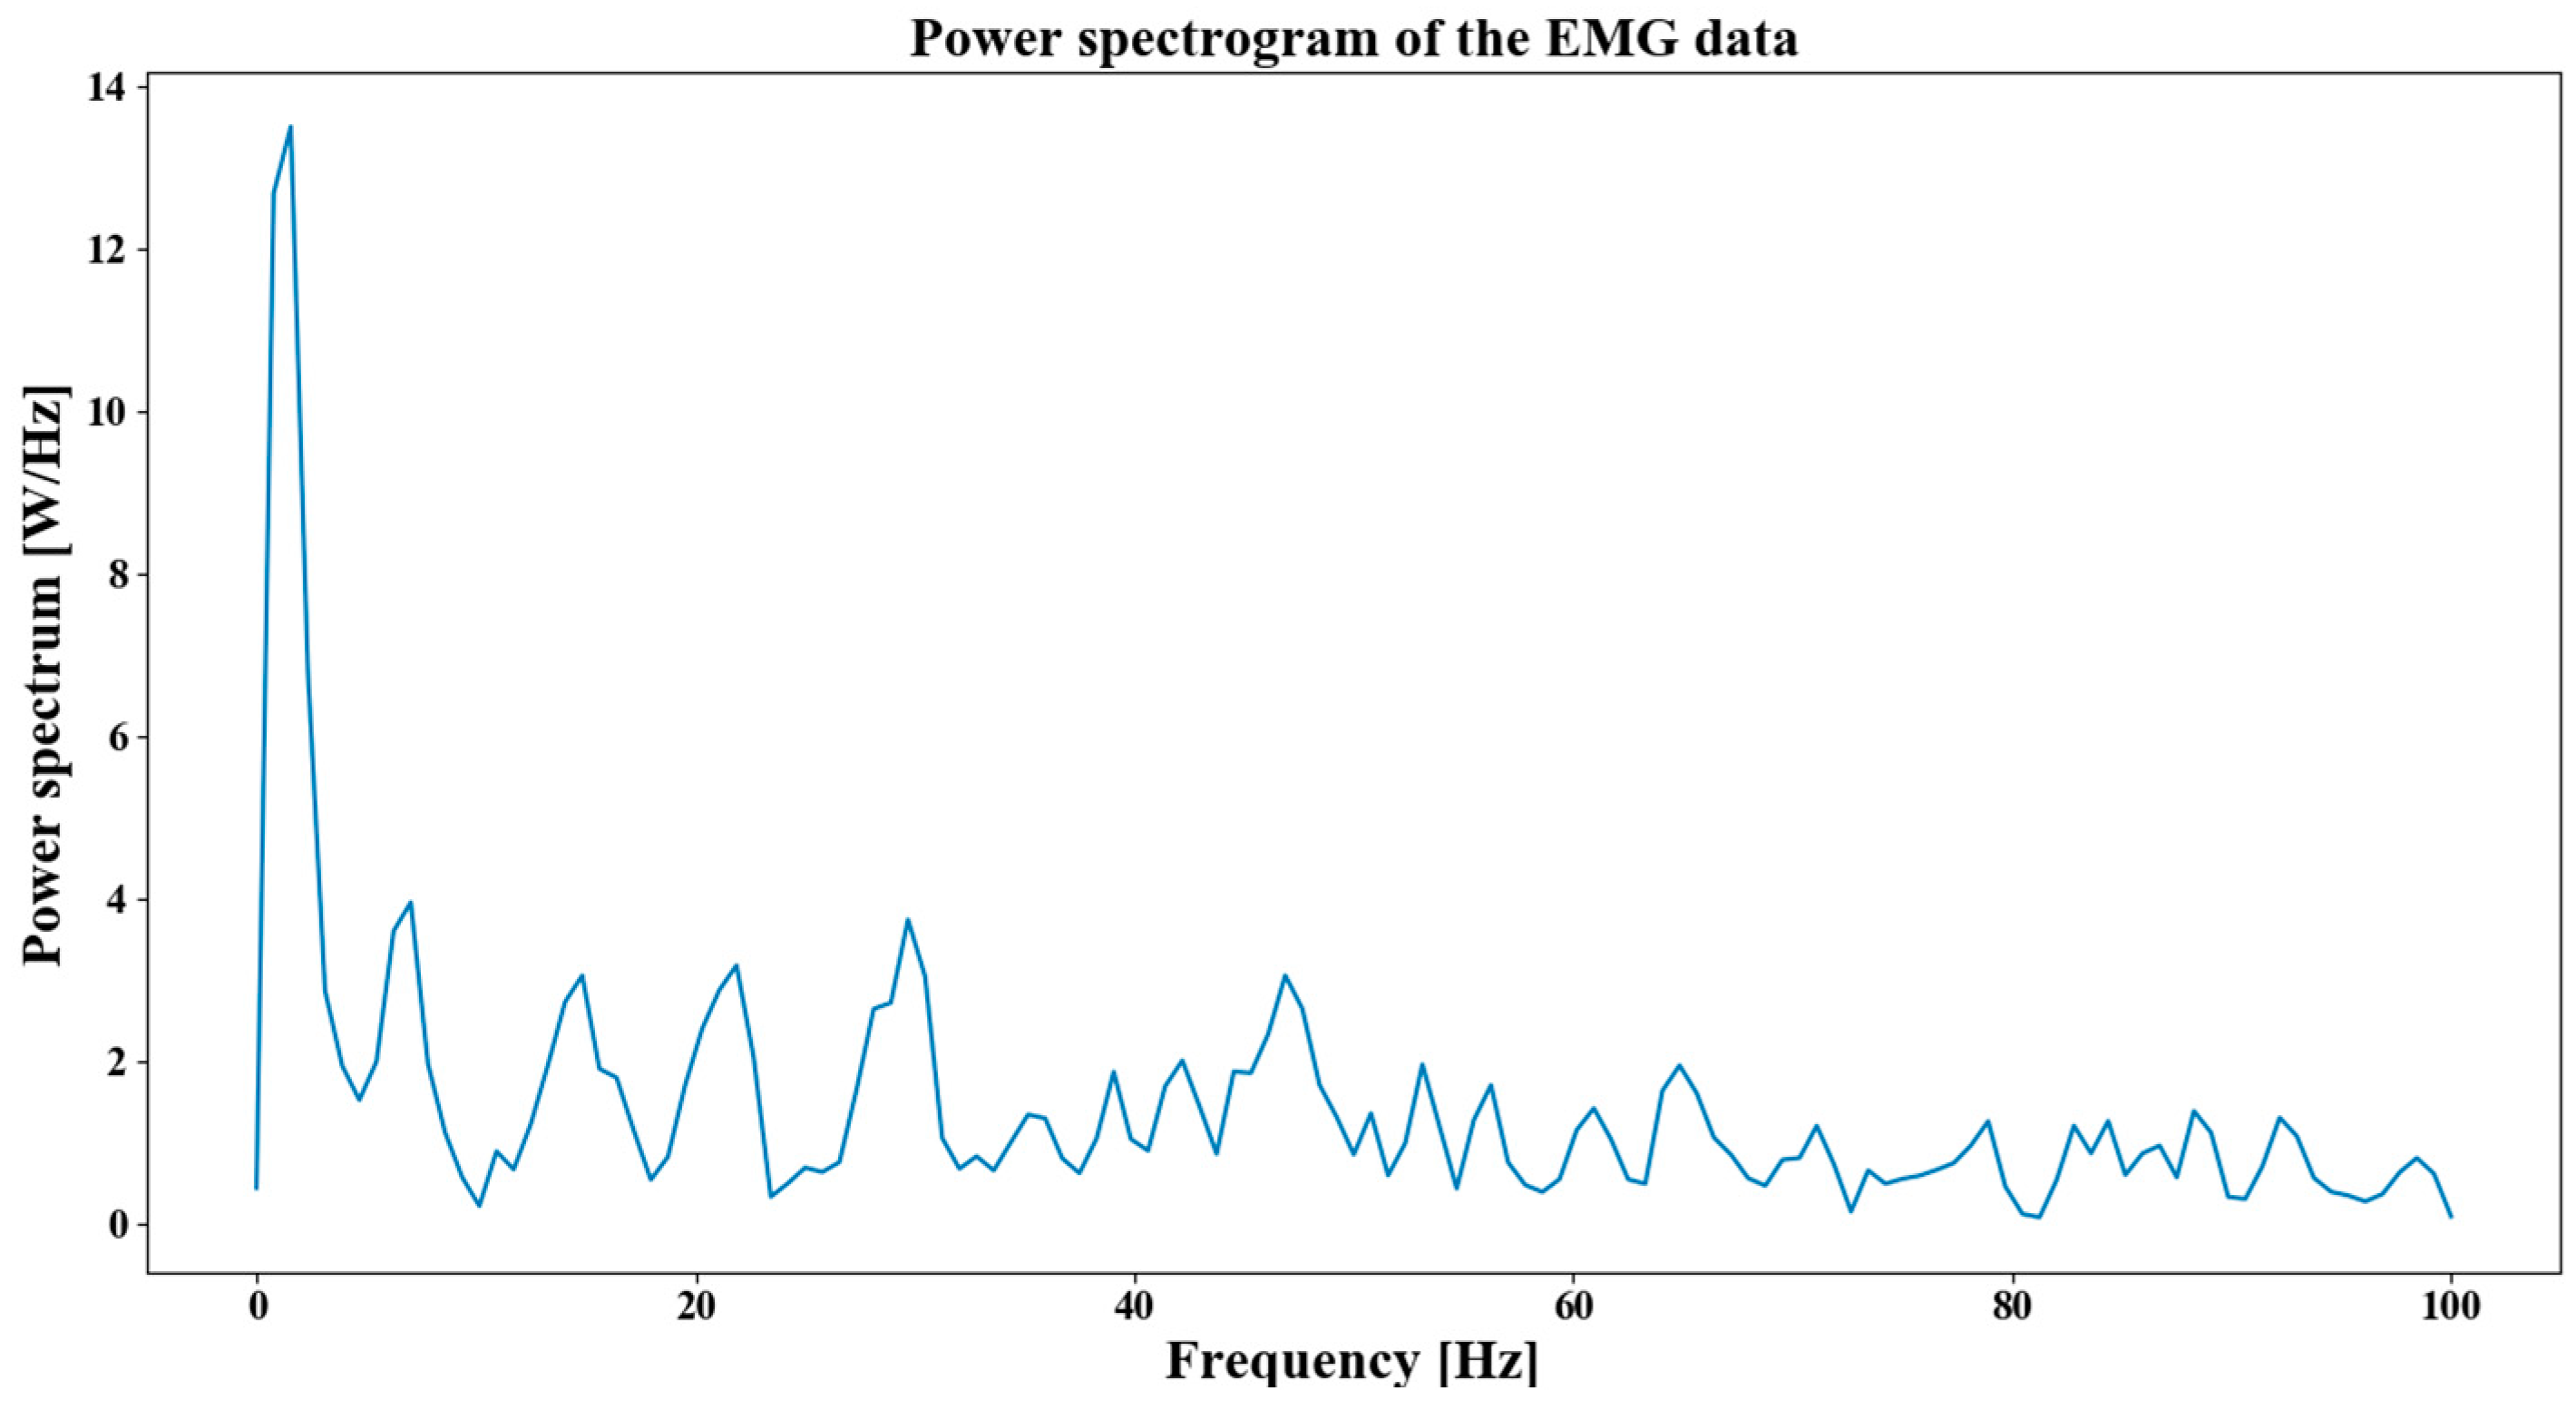
2.2. EMG Data Processing
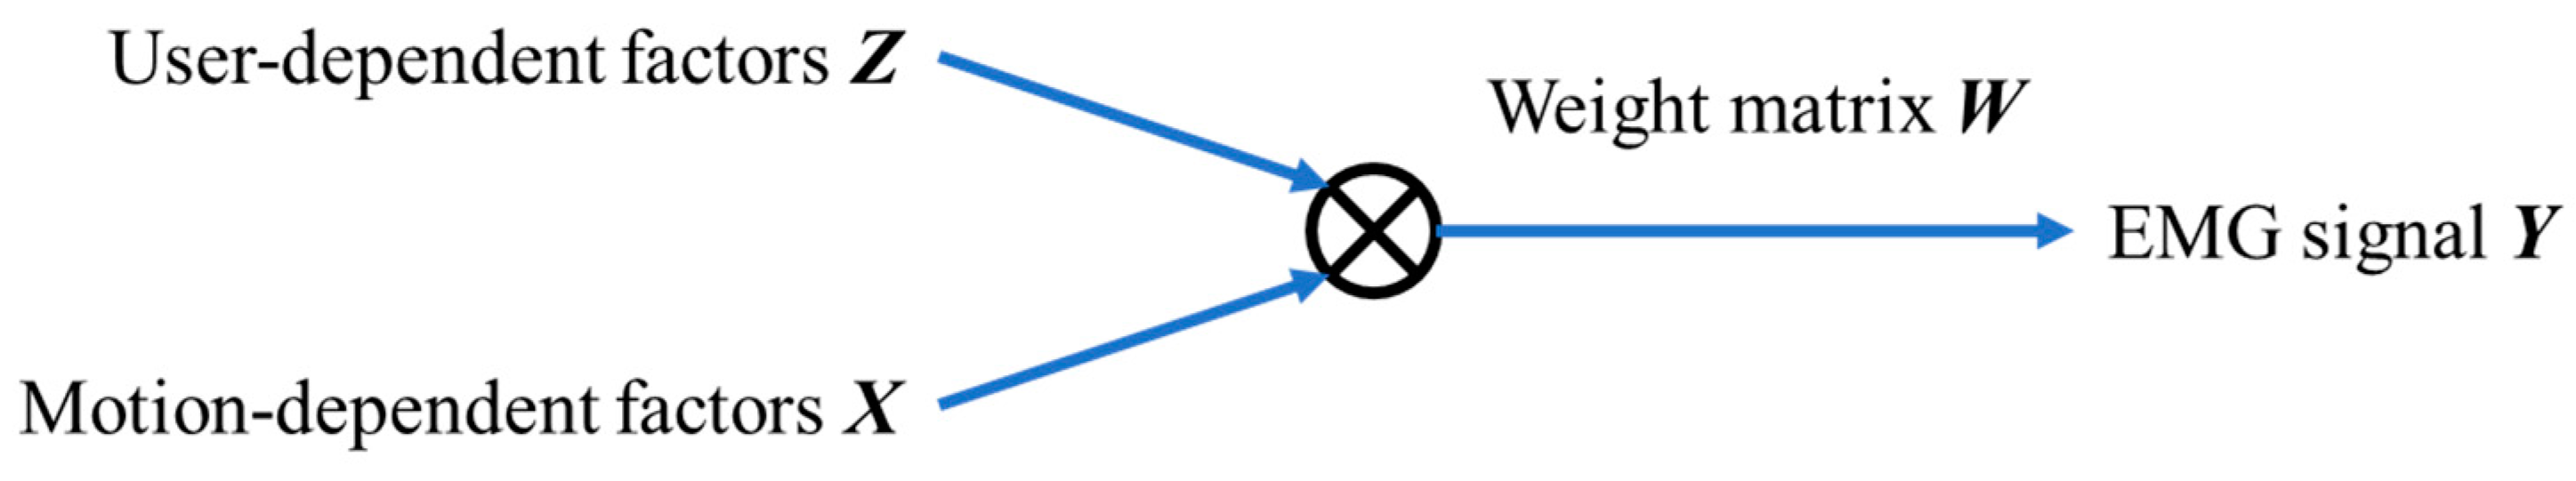
2.3. Bilinear Model Algorithm
2.4. Hand Motion Classify
3. Experiment
4. Results
4.1. Single-Person Experiment
4.2. Multi-Person Experiment
4.2.1. Classification without the Bilinear Model
4.2.2. Classification with the Bilinear Model
5. Discussion
6. Conclusions
Author Contributions
Funding
Conflicts of Interest
References
- World Health Organization Website. Available online: https://www.who.int/news-room/fact-sheets/detail/deafness-and-hearing-loss (accessed on 9 August 2020).
- Senghas, R.J.; Monaghan, L. SIGNS OF THEIR TIMES: Deaf Communities and the Culture of Language. Annu. Rev. Anthropol. 2002, 31, 69–97. [Google Scholar] [CrossRef] [Green Version]
- Galea, L.C.; Smeaton, A.F. Recognising Irish Sign Language Using Electromyography. In Proceedings of the 2019 International Conference on Content-Based Multimedia Indexing, Dublin, Ireland, 4–6 September 2019; pp. 1–4. [Google Scholar]
- Lucas, C. The Sociolinguistics of Sign Languages; Cambridge University Press: Cambridge, UK, 2001; ISBN 9780521794749. [Google Scholar]
- Efthimiou, E.; Fotinea, S.-E. An environment for deaf accessibility to education content. In Proceedings of the International Conference on ICT & Accessibility (GSRT, M3. 3, id 35), Hammamet, Tunisia, 12–14 April 2007; pp. 12–14. [Google Scholar]
- Steinberg, A.; Sullivan, V.; Loew, R. Cultural and linguistic barriers to mental health service access: The deaf consumer’s perspective. Am. J. Psychiatry 1998, 155, 982–984. [Google Scholar] [CrossRef]
- Meurant, L.; Sinte, A.; Herreweghe, M.V.; Vermeerbergen, M. Sign language research, uses and practices: A Belgian perspective. In Sign Language Research, Uses and Practices; Meurant, L., Sinte, A., van Herreweghe, M., Vermeerbergen, M., Eds.; Mouton De Gruyter: Berlin, Germany, 2013; Volume 1, pp. 1–14. [Google Scholar]
- Chuan, C.-H.; Regina, E.; Guardino, C. American Sign Language Recognition Using Leap Motion Sensor. In Proceedings of the 2014 13th International Conference on Machine Learning and Applications, Detroit, MI, USA, 3–6 December 2014; pp. 541–544. [Google Scholar]
- Smith, R.G.; Nolan, B. Emotional facial expressions in synthesised sign language avatars: A manual evaluation. Univers. Access Inf. Soc. 2016, 15, 567–576. [Google Scholar] [CrossRef] [Green Version]
- Hayek, H.E.; Nacouzi, J.; Mosbeh, P.O.B.Z. Sign to Letter Translator System using a Hand Glove. In Proceedings of the Third International Conference on e-Technologies and Networks for Development, Beirut, Lebanon, 29 April–1 May 2014; pp. 146–150. [Google Scholar]
- Savur, C.; Sahin, F. Real-Time American Sign Language Recognition System Using Surface EMG Signal. In Proceedings of the 2015 IEEE 14th International Conference on Machine Learning and Applications, Miami, FL, USA, 9–11 December 2015; pp. 497–502. [Google Scholar]
- Farulla, G.A.; Russo, L.O.; Pintor, C.; Pianu, D.; Micotti, G.; Salgarella, A.R.; Camboni, D.; Controzzi, M.; Cipriani, C.; Oddo, C.M.; et al. Real-Time Single Camera Hand Gesture Recognition System for Remote Deaf-Blind Communication. In Proceedings of the International Conference on Augmented and Virtual Reality, Lecce, Italy, 17–20 September 2014; Lecture Notes in Computer Science (including subseries Lecture Notes in Artificial Intelligence and Lecture Notes in Bioinformatics). Springer: Cham, Switzerland, 2014; pp. 35–52, ISBN 978-3-319-13968-5. [Google Scholar]
- Cyber Gloves Website. Available online: http://www.cyberglovesystems.com/ (accessed on 9 August 2020).
- Lu, G.; Shark, L.-K.; Hall, G.; Zeshan, U. Immersive manipulation of virtual objects through glove-based hand gesture interaction. Virtual Real. 2012, 16, 243–252. [Google Scholar] [CrossRef]
- Raghavan, A.; Joseph, S. EMG analysis and control of artificial arm. Int. J. Cybern. Inform. 2016, 5, 317–327. [Google Scholar] [CrossRef]
- Saridis, G.N.; Gootee, T.P. EMG Pattern Analysis and Classification for a Prosthetic Arm. IEEE Trans. Biomed. Eng. 1982, BME-29, 403–412. [Google Scholar] [CrossRef]
- Shi, J.; Dai, Z. Research on Gesture Recognition Method Based on EMG Signal and Design of Rehabilitation Training System. In Proceedings of the IEEE 3rd Advanced Information Technology, Electronic and Automation Control Conference, Chongqing, China, 12–14 October 2018; pp. 835–838. [Google Scholar]
- Sathiyanarayanan, M.; Rajan, S. Myo armband for physiotherapy healthcare: A case study using gesture recognition application. In Proceedings of the 2016 8th International Conference on Communication Systems and Networks (COMSNETS), Bangalore, India, 5–10 January 2016; pp. 1–6. [Google Scholar]
- Sathiyanarayanan, M.; Mulling, T. Map navigation using hand gesture recognition: A case study using myo connector on apple maps. Procedia Comput. Sci. 2015, 58, 50–57. [Google Scholar] [CrossRef] [Green Version]
- Lu, Z.; Chen, X.; Li, Q.; Zhang, X.; Zhou, P. A hand gesture recognition framework and wearable gesture-based interaction prototype for mobile devices. IEEE Trans. Hum. Mach. Syst. 2014, 44, 293–299. [Google Scholar] [CrossRef]
- Muhammad, Z.U.R.; Asim, W.; Syed, O.G.; Mads, J.; Imran, K.N.; Mohsin, J.; Dario, F.; Ernest, N.K. Multiday EMG-Based Classification of Hand Motions with Deep Learning Techniques. Sensors 2018, 18, 2497. [Google Scholar]
- Savur, C.; Sahin, F. American Sign Language Recognition system by using surface EMG signal. In Proceedings of the 2016 IEEE International Conference on Systems, Man, and Cybernetics (SMC), Budapest, Hungary, 9–12 October 2016; pp. 2872–2877. [Google Scholar]
- Pigou, L.; Dieleman, S.; Kindermans, P.; Schrauwen, B. Sign Language Recognition Using Convolutional Neural Networks; Springer: Cham, Switzerland, 2015; pp. 572–578. Available online: https://biblio.ugent.be/publication/5796137 (accessed on 28 August 2020).
- Shin, S.; Baek, Y.; Lee, J.; Eun, Y.; Son, S.H. Korean sign language recognition using EMG and IMU sensors based on group-dependent NN models. In Proceedings of the 2017 IEEE Symposium Series on Computational Intelligence (SSCI), Honolulu, HI, USA, 27 November–1 December 2017; pp. 1–7. [Google Scholar]
- Hu, X.; Nenov, V. Multivariate AR modeling of electromyography for the classification of upper arm movements. Clin. Neurophysiol. 2004, 115, 1276–1287. [Google Scholar] [CrossRef]
- Zivanovic, M. Time-Varying Multicomponent Signal Modeling for Analysis of Surface EMG Data. IEEE Signal Process. Lett. 2014, 21, 692–696. [Google Scholar] [CrossRef]
- Wang, P.; Wang, Y.; Ru, F.; Wang, P. Develop a home-used EMG sensor system to identify pathological gait with less data via frequency analysis. Rev. Sci. Instrum. 2019, 90, 043113. [Google Scholar] [CrossRef]
- Karlsson, S.; Gerdle, B. Mean frequency and signal amplitude of the surface emg of the quadriceps muscles increase with increasing torquea study using the continuous wavelet transform. J. Electromyogr. Kinesiol. 2001, 11, 131–140. [Google Scholar] [CrossRef]
- Ismail, A.R.; Asfour, S.S. Continuous wavelet transform application to EMG signals during human gait, Conference Record of Thirty-Second Asilomar Conference on Signals. Syst. Comput. 1998, 1, 325–329. [Google Scholar]
- Alkan, A.; Günay, M. Identification of EMG signals using discriminant analysis and SVM classifier. Expert Syst. Appl. 2012, 39, 44–47. [Google Scholar] [CrossRef]
- Arvind, T.; Elizabeth, T.; Enrico, C.; Bastien, B.; Thierry, P.; Eleni, V. An Ensemble Analysis of Electromyographic Activity during Whole Body Pointing with the Use of Support Vector Machines (SVM Analysis of EMG Activity from Complex Movement). PLoS ONE 2011, 6, e20732. [Google Scholar]
- Alberto, D.B.; Emanuele, G.; Giorgio, C.; Angelo, D.; Rinaldo, S.; Eugenio, G.; Loredana, Z. NLR, MLP, SVM, and LDA: A comparative analysis on EMG data from people with trans-radial amputation. J. Neuroeng. Rehabil. 2017, 14, 82. [Google Scholar]
- Andrés, J.; Marco, B.; Elisa, M. Real-Time Hand Gesture Recognition Using Surface Electromyography and Machine Learning: A Systematic Literature Review. Sensors 2020, 20, 2467. [Google Scholar]
- Hu, Y.; Wong, Y.; Wei, W.; Du, Y.; Kankanhalli, M.S.; Geng, W. A novel attention-based hybrid CNN-RNN architecture for sEMG-based gesture recognition. PLoS ONE 2018, 13, e0206049. [Google Scholar] [CrossRef] [Green Version]
- Ameri, A.; Akhaee, M.A.; Scheme, E.; Englehart, K. Regression convolutional neural network for improved simultaneous EMG control. J. Neural Eng. 2019, 16, 036015. [Google Scholar] [CrossRef]
- Mane, S.M.; Kambli, R.A.; Kazi, F.S.; Singh, N.M. Hand motion recognition from single channel surface EMG using wavelet & artificial neural network. Procedia Comput. Sci. 2015, 49, 58–65. [Google Scholar]
- Tavakoli, M.; Benussi, C.; Lourenco, J.L. Single channel surface EMG control of advanced prosthetic hands:A simple, low cost and efficient approach. Expert Syst. Appl. 2017, 79, 322–332. [Google Scholar] [CrossRef]
- Clancy, E.; Morin, E.; Merletti, R. Sampling, noise-reduction and amplitude estimation issues in surface electromyography. J. Electromyogr. Kinesiol. 2002, 113, 1–16. [Google Scholar] [CrossRef]
- Li, G.; Li, Y.; Zhang, Z.; Geng, Y.; Zhou, R. Selection of sampling rate for EMG pattern recognition based prosthesis control. In Proceedings of the 2010 Annual International Conference of the IEEE Engineering in Medicine and Biology, Buenos Aires, Argentina, 31 August–4 September 2010; Volume 2010, pp. 5058–5061. [Google Scholar]
- Winter, D.A. Biomechanics and Motor Control of Human Movement; John Wiley & Sons: Hoboken, NJ, USA, 2009. [Google Scholar]
- Kerber, F.; Puhl, M.; Krüger, A. User-Independent Real-Time Hand Gesture Recognition Based on Surface Electromyography. In Proceedings of the 19th International Conference on Human-Computer Interaction with Mobile Devices and Services, Vienna, Austria, 4–7 September 2017; p. 36. [Google Scholar]
- Chung, E.A.; Benalcázar, M.E. Real-Time Hand Gesture Recognition Model Using Deep Learning Techniques and EMG Signals. In Proceedings of the 27th European Signal Processing Conference (EUSIPCO), Coruña, Spain, 2–6 September 2019; pp. 1–5. [Google Scholar]
- Raurale, S.; McAllister, J.; del Rincon, J.M. EMG wrist-hand motion recognition system for real-time Embedded platform. In Proceedings of the 2019 IEEE International Conference on Acoustics, Speech and Signal Processing (ICASSP), Brighton, UK, 12–17 May 2019; pp. 1523–1527. [Google Scholar]
- Das, A.K.; Laxmi, V.; Kumar, S. Hand Gesture Recognition and Classification Technique in Real-Time. In Proceedings of the 2019 International Conference on Vision Towards Emerging Trends in Communication and Networking (ViTECoN), Tamil Nadu, India, 30–31 March 2019; pp. 1–5. [Google Scholar]
- Luo, X.Y.; Wu, X.Y.; Chen, L.; Hu, N.; Zhang, Y.; Zhao, Y.; Hu, L.T.; Yang, D.D.; Hou, W.S. Forearm Muscle Synergy Reducing Dimension of the Feature Matrix in Hand Gesture Recognition. In Proceedings of the 3rd International Conference on Advanced Robotics and Mechatronics (ICARM), Singapore, 18–20 July 2018; pp. 691–696. [Google Scholar]
- Zanghieri, M.; Benatti, S.; Burrello, A.; Kartsch, V.; Conti, F.; Benini, L. Robust Real-Time Embedded EMG Recognition Framework Using Temporal Convolutional Networks on a Multicore IoT Processor. IEEE Trans. Biomed. Circuits Syst. 2019, 14, 244–256. [Google Scholar] [CrossRef]
- Divya, B.; Delpha, J.; Badrinath, S. Public speaking words (Indian sign language) recognition using EMG. In Proceedings of the 2017 International Conference on Smart Technologies for Smart Nation (SmartTechCon), Bangalore, India, 17–19 August 2017; pp. 798–800. [Google Scholar]
- Sheng, X.; Lv, B.; Guo, W.; Zhu, X. Common spatial-spectral analysis of EMG signals for multiday and multiuser myoelectric interface. Biomed. Signal Process. Control 2019, 53, 101572. [Google Scholar] [CrossRef]
- Yang, C.; Xi, X.; Chen, S.; Miran, S.M.; Hua, X.; Luo, Z. SEMG-based multifeatures and predictive model for knee-joint-angle estimation. AIP Adv. 2019, 9, 095042. [Google Scholar] [CrossRef]
- Zhang, L.; Shi, Y.; Wang, W.; Chu, Y.; Yuan, X. Real-time and user-independent feature classification of forearm using EMG signals. J. Soc. Inf. Disp. 2019, 27, 101–107. [Google Scholar] [CrossRef]
- Khushaba, R.N. Correlation Analysis of Electromyogram Signals for Multiuser Myoelectric Interfaces. IEEE Trans. Neural Syst. Rehabil. Eng. 2014, 22, 745–755. [Google Scholar] [CrossRef] [Green Version]
- Tenenbaum, J.B.; Freeman, W.T. Separating style and content with bilinear models. Neural Comput. 2000, 12, 1247–1283. [Google Scholar] [CrossRef]
- Matsubara, T.; Morimoto, J. Bilinear Modeling of EMG Signals to Extract User-Independent Features for Multiuser Myoelectric Interface. IEEE Trans. Biomed. Eng. 2013, 60, 2205–2213. [Google Scholar] [CrossRef]
- Wang, T.; Hou, W. Analysis of the sEMG bilinear model for the control of hand prosthesis. Chin. J. Sci. Instrum. 2014, 35, 1907. [Google Scholar]
- Frigo, C.; Crenna, P. Multichannel SEMG in clinical gait analysis: A review and state-of-art. Clin. Biomech. 2009, 24, 236–245. [Google Scholar] [CrossRef] [PubMed]
- Liu, J.; Zhong, L.; Wickramasuriya, J. A real-time EMG pattern recognition system based on linear-nonlinear feature projection for a multifunction myoelectric hand. IEEE Trans. Biomed. Eng. 2006, 53, 657–675. [Google Scholar]
- Huang, N.; Lu, G.; Xu, D. A Permutation Importance-Based Feature Selection Method for Short-Term Electricity Load Forecasting Using Random Forest. Energies 2016, 9, 767. [Google Scholar] [CrossRef] [Green Version]
- Arjunan, S.P.; Kumar, D.K.; Naik, G.R. Fractal feature of sEMG from Flexor digitorum superficialis muscle correlated with levels of contraction during low-level finger flexions. In Proceedings of the 2010 Annual International Conference of the IEEE Engineering in Medicine and Biology, Buenos Aires, Argentina, 31 August–4 September 2010; pp. 4614–4617. [Google Scholar]
- Collí, A.; Guillermo, J. Implementation of User-Independent Hand Gesture Recognition Classification Models Using IMU and EMG-Based Sensor Fusion Techniques. Master’s Thesis, Western University, London, ON, Canada, 2019. [Google Scholar]
- Li, X.; Wu, X. Constructing long short-term memory based deep recurrent neural networks for large vocabulary speech recognition. In Proceedings of the 2015 IEEE International Conference on Acoustics, Speech and Signal Processing, Brisbane, Australia, 19–24 April 2015; pp. 4520–4524. [Google Scholar]
- Zhang, Z.; He, C.; Kuo, Y. A Novel Surface Electromyographic Signal-Based Hand Gesture Prediction Using a Recurrent Neural Network. Sensors 2020, 20, 3994. [Google Scholar] [CrossRef]
- Nasri, N.; Orts-Escolano, S.; Gomez-Donoso, F.; Cazorla, M. Inferring Static Hand Poses from a Low-Cost Non-Intrusive sEMG Sensor. Sensors 2019, 19, 371. [Google Scholar] [CrossRef] [Green Version]
- Ali, S. Gated Recurrent Neural Networks for EMG-based Hand Gesture Classification. A Comparative Study. In Proceedings of the 2018 40th Annual International Conference of the IEEE Engineering in Medicine and Biology Society (EMBC), Honolulu, HI, USA, 18–21 July 2018; pp. 1094–1097. [Google Scholar]
- He, Y.; Fukuda, O.; Bu, N.; Okumura, H.; Yamaguchi, N. Surface EMG Pattern Recognition Using Long Short-Term Memory Combined with Multilayer Perceptron. In Proceedings of the 2018 40th Annual International Conference of the IEEE Engineering in Medicine and Biology Society (EMBC), Honolulu, HI, USA, 18–21 July 2018; pp. 5636–5639. [Google Scholar]


| Motion No. | Motion Name | Motion No. | Motion Name |
|---|---|---|---|
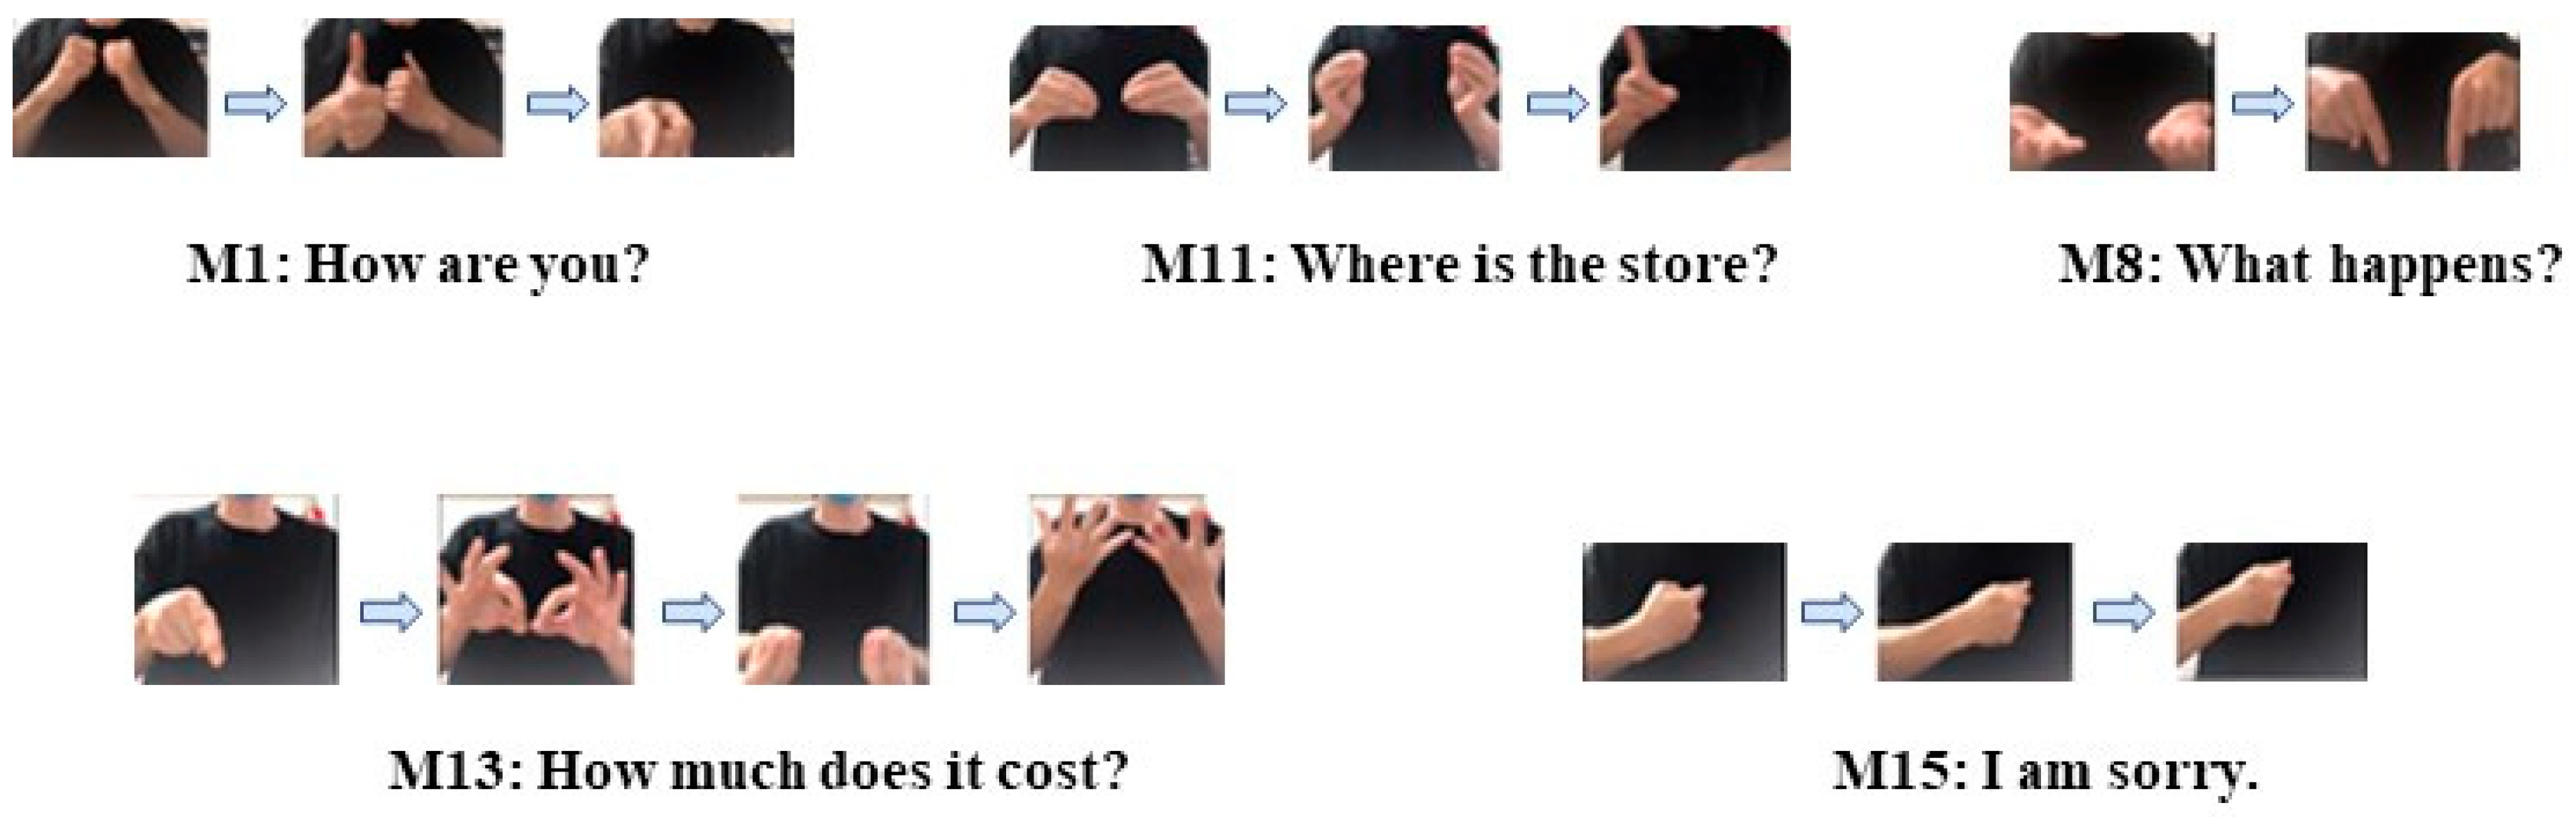
| M1 | How are you? | M11 | Where is the store? |
| M2 | Nice to meet you. | M12 | How can I get food? |
| M3 | See you later. | M13 | How much does it cost? |
| M4 | That’s what I mean. | M14 | Yes, thank you. |
| M5 | I don’t understand. | M15 | I am sorry. |
| M6 | What is your name? | M16 | Where is the hospital? |
| M7 | Where are you from? | M17 | I don’t feel good. |
| M8 | What happens? | M18 | Please help me. |
| M9 | What is wrong? | M19 | Please write it. |
| M10 | Please call 911. | M20 | I love you. |
| Predicted Label | |||||||||||||||||||||
|---|---|---|---|---|---|---|---|---|---|---|---|---|---|---|---|---|---|---|---|---|---|
| Actual Label | M1 | M2 | M3 | M4 | M5 | M6 | M7 | M8 | M9 | M10 | M11 | M12 | M13 | M14 | M15 | M16 | M17 | M18 | M19 | M20 | |
| M1 | 47 | 0 | 2 | 0 | 0 | 0 | 0 | 0 | 0 | 0 | 0 | 0 | 0 | 0 | 1 | 0 | 0 | 0 | 0 | 0 | |
| M2 | 0 | 49 | 0 | 0 | 0 | 0 | 0 | 1 | 0 | 0 | 0 | 0 | 0 | 0 | 0 | 0 | 0 | 0 | 0 | 0 | |
| M3 | 1 | 0 | 47 | 0 | 0 | 0 | 1 | 0 | 0 | 0 | 0 | 0 | 0 | 0 | 1 | 0 | 0 | 0 | 0 | 0 | |
| M4 | 0 | 0 | 0 | 48 | 0 | 0 | 0 | 2 | 0 | 0 | 0 | 0 | 0 | 0 | 0 | 0 | 0 | 0 | 0 | 0 | |
| M5 | 0 | 0 | 1 | 0 | 49 | 0 | 0 | 0 | 0 | 0 | 0 | 0 | 0 | 0 | 0 | 0 | 0 | 0 | 0 | 0 | |
| M6 | 0 | 0 | 0 | 0 | 0 | 49 | 0 | 0 | 0 | 1 | 0 | 0 | 0 | 0 | 0 | 0 | 0 | 0 | 0 | 0 | |
| M7 | 0 | 0 | 0 | 0 | 0 | 0 | 49 | 0 | 0 | 0 | 1 | 0 | 0 | 0 | 0 | 0 | 0 | 0 | 0 | 0 | |
| M8 | 0 | 0 | 0 | 1 | 0 | 0 | 0 | 47 | 0 | 0 | 0 | 0 | 1 | 0 | 0 | 1 | 0 | 0 | 0 | 0 | |
| M9 | 0 | 0 | 0 | 0 | 0 | 0 | 0 | 0 | 50 | 0 | 0 | 0 | 0 | 0 | 0 | 0 | 0 | 0 | 0 | 0 | |
| M10 | 0 | 0 | 0 | 0 | 0 | 0 | 0 | 0 | 0 | 50 | 0 | 0 | 0 | 0 | 0 | 0 | 0 | 0 | 0 | 0 | |
| M11 | 0 | 0 | 0 | 0 | 0 | 0 | 1 | 0 | 0 | 0 | 49 | 0 | 0 | 0 | 0 | 0 | 0 | 0 | 0 | 0 | |
| M12 | 0 | 0 | 0 | 0 | 0 | 0 | 0 | 0 | 0 | 0 | 0 | 49 | 0 | 0 | 0 | 0 | 0 | 0 | 1 | 0 | |
| M13 | 0 | 0 | 0 | 0 | 0 | 1 | 0 | 0 | 0 | 0 | 0 | 0 | 49 | 0 | 0 | 0 | 0 | 0 | 0 | 0 | |
| M14 | 0 | 0 | 0 | 0 | 0 | 0 | 0 | 0 | 0 | 0 | 0 | 2 | 0 | 48 | 0 | 0 | 0 | 0 | 0 | 0 | |
| M15 | 0 | 0 | 0 | 0 | 1 | 0 | 0 | 0 | 0 | 0 | 0 | 0 | 0 | 0 | 49 | 0 | 0 | 0 | 0 | 0 | |
| M16 | 0 | 0 | 0 | 0 | 0 | 0 | 0 | 0 | 0 | 0 | 0 | 0 | 0 | 0 | 0 | 50 | 0 | 0 | 0 | 0 | |
| M17 | 0 | 0 | 0 | 0 | 0 | 0 | 0 | 0 | 0 | 0 | 0 | 1 | 0 | 0 | 0 | 0 | 49 | 0 | 0 | 0 | |
| M18 | 0 | 0 | 0 | 0 | 0 | 0 | 0 | 0 | 0 | 0 | 0 | 0 | 0 | 0 | 0 | 0 | 0 | 50 | 0 | 0 | |
| M19 | 0 | 0 | 0 | 0 | 0 | 0 | 0 | 0 | 0 | 0 | 0 | 0 | 0 | 0 | 0 | 0 | 0 | 0 | 50 | 0 | |
| M20 | 0 | 0 | 0 | 0 | 0 | 0 | 0 | 0 | 0 | 1 | 0 | 0 | 0 | 0 | 1 | 0 | 0 | 0 | 0 | 48 | |
| Time-Domain Features | Frequency-Domain Features | |||||||||
|---|---|---|---|---|---|---|---|---|---|---|
| MAV | STD | RMS | LOG | AAC | MNF | MDF | MNP | PSR | PKF | |
| Accuracy | 98.54% | 97.38% | 77.34% | 87.68% | 89.74% | 97.94% | 88.48% | 86.52% | 81.72% | 96.30% |
| Importance | 1.32% | 2.48% | 22.52% | 12.18% | 10.12% | 2.92% | 11.42% | 14.34% | 19.14% | 3.56% |
| Predicted Label | |||||||||||||||||||||
|---|---|---|---|---|---|---|---|---|---|---|---|---|---|---|---|---|---|---|---|---|---|
| Actual Label | M1 | M2 | M3 | M4 | M5 | M6 | M7 | M8 | M9 | M10 | M11 | M12 | M13 | M14 | M15 | M16 | M17 | M18 | M19 | M20 | |
| M1 | 101 | 2 | 5 | 1 | 3 | 7 | 7 | 4 | 10 | 3 | 5 | 4 | 8 | 1 | 11 | 6 | 7 | 6 | 4 | 5 | |
| M2 | 6 | 107 | 3 | 3 | 6 | 7 | 2 | 4 | 6 | 6 | 3 | 5 | 3 | 6 | 6 | 4 | 4 | 8 | 5 | 6 | |
| M3 | 6 | 11 | 117 | 3 | 7 | 4 | 4 | 5 | 3 | 8 | 4 | 3 | 2 | 4 | 1 | 4 | 4 | 3 | 4 | 3 | |
| M4 | 6 | 4 | 7 | 109 | 4 | 4 | 1 | 7 | 3 | 4 | 3 | 5 | 5 | 2 | 4 | 1 | 9 | 7 | 5 | 10 | |
| M5 | 7 | 5 | 3 | 2 | 116 | 2 | 5 | 8 | 4 | 4 | 1 | 2 | 4 | 3 | 3 | 1 | 5 | 8 | 9 | 8 | |
| M6 | 4 | 2 | 9 | 1 | 4 | 126 | 8 | 2 | 3 | 3 | 5 | 3 | 5 | 3 | 4 | 3 | 2 | 6 | 3 | 4 | |
| M7 | 6 | 5 | 2 | 4 | 5 | 7 | 113 | 7 | 6 | 1 | 5 | 4 | 4 | 1 | 6 | 5 | 7 | 5 | 4 | 3 | |
| M8 | 5 | 1 | 7 | 4 | 3 | 8 | 1 | 120 | 4 | 1 | 3 | 3 | 2 | 6 | 1 | 6 | 5 | 15 | 2 | 3 | |
| M9 | 4 | 5 | 4 | 3 | 3 | 0 | 9 | 2 | 112 | 4 | 3 | 4 | 2 | 2 | 3 | 6 | 8 | 8 | 12 | 6 | |
| M10 | 5 | 5 | 7 | 8 | 7 | 4 | 7 | 4 | 4 | 104 | 4 | 4 | 3 | 3 | 3 | 10 | 2 | 8 | 4 | 4 | |
| M11 | 5 | 5 | 2 | 5 | 7 | 6 | 11 | 3 | 4 | 7 | 103 | 1 | 2 | 5 | 2 | 3 | 5 | 8 | 7 | 9 | |
| M12 | 6 | 4 | 5 | 4 | 4 | 8 | 3 | 4 | 3 | 6 | 4 | 107 | 3 | 5 | 7 | 5 | 5 | 6 | 6 | 5 | |
| M13 | 3 | 3 | 5 | 4 | 5 | 5 | 7 | 7 | 9 | 5 | 3 | 4 | 98 | 4 | 1 | 9 | 6 | 6 | 7 | 9 | |
| M14 | 5 | 4 | 5 | 6 | 3 | 2 | 8 | 6 | 2 | 3 | 4 | 3 | 3 | 122 | 1 | 2 | 3 | 6 | 6 | 6 | |
| M15 | 5 | 2 | 5 | 3 | 7 | 2 | 11 | 2 | 6 | 5 | 3 | 1 | 5 | 6 | 115 | 5 | 3 | 7 | 3 | 4 | |
| M16 | 4 | 3 | 8 | 4 | 8 | 3 | 4 | 1 | 4 | 2 | 5 | 3 | 4 | 9 | 5 | 116 | 1 | 2 | 7 | 7 | |
| M17 | 5 | 6 | 4 | 10 | 3 | 5 | 6 | 3 | 4 | 5 | 4 | 2 | 6 | 2 | 3 | 8 | 108 | 9 | 6 | 1 | |
| M18 | 4 | 4 | 3 | 4 | 3 | 5 | 4 | 10 | 2 | 3 | 4 | 3 | 6 | 4 | 8 | 3 | 6 | 117 | 3 | 4 | |
| M19 | 4 | 2 | 4 | 5 | 4 | 5 | 8 | 4 | 10 | 2 | 2 | 4 | 7 | 6 | 3 | 2 | 4 | 4 | 115 | 5 | |
| M20 | 9 | 4 | 3 | 5 | 8 | 1 | 7 | 2 | 7 | 7 | 2 | 4 | 8 | 3 | 5 | 2 | 6 | 7 | 6 | 104 | |
| Motion Name | Accuracy | Motion Name | Accuracy |
|---|---|---|---|
| M1: How are you? | 50.5% | M11: Where is the store? | 51.5% |
| M2: Nice to meet you. | 53.5% | M12: How can I get food? | 53.5% |
| M3: See you later. | 58.5% | M13: How much does it cost? | 49.0% |
| M4: That’s what I mean. | 54.5% | M14: Yes, thank you. | 61.0% |
| M5: I don’t understand. | 58.0% | M15: I am sorry. | 57.5% |
| M6: What is your name? | 63.0% | M16: Where is the hospital? | 58.0% |
| M7: Where are you from? | 56.5% | M17: I don’t feel good. | 54.4% |
| M8: What happens? | 60.0% | M18: Please help me. | 58.5% |
| M9: What is wrong? | 56.0% | M19: Please write it. | 57.5% |
| M10: Please call 911. | 52.0% | M20: I love you. | 52.0% |
| Name | Accuracy | Name | Accuracy |
|---|---|---|---|
| Participant 1 | 60.5% | Participant 11 | 49.5% |
| Participant 2 | 50.5% | Participant 12 | 62.0% |
| Participant 3 | 71.5% | Participant 13 | 48.0% |
| Participant 4 | 61.0% | Participant 14 | 61.0% |
| Participant 5 | 49.0% | Participant 15 | 61.5% |
| Participant 6 | 64.0% | Participant 16 | 59.5% |
| Participant 7 | 54.0% | Participant 17 | 50.0% |
| Participant 8 | 49.5% | Participant 18 | 54.5% |
| Participant 9 | 57.5% | Participant 19 | 51.5% |
| Participant 10 | 46.5% | Participant 20 | 48.0% |
| Predicted Label | |||||||||||||||||||||
|---|---|---|---|---|---|---|---|---|---|---|---|---|---|---|---|---|---|---|---|---|---|
| Actual Label | M1 | M2 | M3 | M4 | M5 | M6 | M7 | M8 | M9 | M10 | M11 | M12 | M13 | M14 | M15 | M16 | M17 | M18 | M19 | M20 | |
| M1 | 196 | 0 | 0 | 1 | 0 | 0 | 2 | 0 | 0 | 0 | 0 | 0 | 0 | 0 | 0 | 0 | 0 | 1 | 0 | 0 | |
| M2 | 0 | 197 | 0 | 0 | 0 | 1 | 1 | 0 | 0 | 0 | 0 | 0 | 0 | 0 | 0 | 0 | 1 | 0 | 0 | 0 | |
| M3 | 0 | 1 | 198 | 0 | 1 | 0 | 0 | 0 | 0 | 0 | 0 | 0 | 0 | 0 | 0 | 0 | 0 | 0 | 0 | 0 | |
| M4 | 0 | 0 | 1 | 194 | 1 | 0 | 0 | 1 | 0 | 0 | 0 | 1 | 0 | 0 | 0 | 0 | 2 | 0 | 0 | 0 | |
| M5 | 0 | 0 | 0 | 0 | 194 | 0 | 0 | 0 | 0 | 0 | 0 | 2 | 0 | 0 | 0 | 0 | 0 | 2 | 0 | 2 | |
| M6 | 0 | 1 | 0 | 0 | 0 | 197 | 0 | 0 | 0 | 1 | 0 | 0 | 0 | 0 | 0 | 1 | 0 | 0 | 0 | 0 | |
| M7 | 0 | 0 | 0 | 0 | 0 | 1 | 195 | 0 | 0 | 1 | 0 | 1 | 0 | 0 | 0 | 1 | 0 | 0 | 0 | 1 | |
| M8 | 0 | 0 | 0 | 0 | 0 | 1 | 0 | 199 | 0 | 0 | 0 | 0 | 0 | 0 | 0 | 0 | 0 | 0 | 0 | 0 | |
| M9 | 0 | 0 | 0 | 0 | 0 | 0 | 0 | 0 | 199 | 0 | 0 | 0 | 0 | 0 | 0 | 0 | 1 | 0 | 0 | 0 | |
| M10 | 0 | 1 | 1 | 0 | 1 | 3 | 1 | 0 | 1 | 188 | 0 | 0 | 1 | 1 | 0 | 0 | 0 | 0 | 2 | 0 | |
| M11 | 0 | 0 | 0 | 0 | 0 | 0 | 0 | 0 | 0 | 0 | 196 | 0 | 0 | 1 | 0 | 1 | 0 | 0 | 1 | 1 | |
| M12 | 0 | 2 | 0 | 0 | 0 | 0 | 0 | 1 | 0 | 0 | 0 | 196 | 0 | 0 | 0 | 0 | 0 | 1 | 0 | 0 | |
| M13 | 0 | 0 | 1 | 0 | 0 | 0 | 0 | 0 | 1 | 0 | 0 | 0 | 198 | 0 | 0 | 0 | 0 | 0 | 0 | 0 | |
| M14 | 0 | 0 | 0 | 0 | 0 | 0 | 0 | 0 | 1 | 0 | 0 | 0 | 1 | 198 | 0 | 0 | 0 | 0 | 0 | 0 | |
| M15 | 0 | 0 | 1 | 0 | 1 | 0 | 0 | 0 | 0 | 0 | 0 | 0 | 1 | 0 | 193 | 0 | 0 | 2 | 0 | 2 | |
| M16 | 0 | 1 | 0 | 0 | 0 | 0 | 0 | 0 | 0 | 0 | 0 | 0 | 0 | 0 | 0 | 198 | 0 | 0 | 0 | 1 | |
| M17 | 0 | 1 | 0 | 1 | 0 | 1 | 0 | 0 | 0 | 0 | 0 | 0 | 0 | 0 | 0 | 0 | 194 | 1 | 1 | 1 | |
| M18 | 0 | 0 | 1 | 0 | 1 | 1 | 0 | 0 | 0 | 0 | 0 | 0 | 0 | 0 | 2 | 0 | 1 | 194 | 0 | 0 | |
| M19 | 0 | 0 | 0 | 0 | 0 | 1 | 0 | 0 | 1 | 0 | 0 | 0 | 1 | 0 | 0 | 0 | 0 | 1 | 196 | 0 | |
| M20 | 0 | 0 | 0 | 0 | 1 | 1 | 0 | 0 | 0 | 0 | 0 | 1 | 0 | 1 | 4 | 1 | 0 | 0 | 1 | 190 | |
| Motion Name | Accuracy | Motion Name | Accuracy |
|---|---|---|---|
| M1: How are you? | 98.0% | M11: Where is the store? | 98.0% |
| M2: Nice to meet you. | 98.5% | M12: How can I get food? | 98.0% |
| M3: See you later. | 99.0% | M13: How much does it cost? | 99.0% |
| M4: That’s what I mean. | 97.0% | M14: Yes, thank you. | 99.0% |
| M5: I don’t understand. | 97.0% | M15: I am sorry. | 96.5% |
| M6: What is your name? | 98.5% | M16: Where is the hospital? | 99.0% |
| M7: Where are you from? | 97.5% | M17: I don’t feel good. | 97.0% |
| M8: What happens? | 99.5% | M18: Please help me. | 97.0% |
| M9: What is wrong? | 99.5% | M19: Please write it. | 98.0% |
| M10: Please call 911. | 94.0% | M20: I love you. | 95.0% |
| Name | Accuracy | Name | Accuracy |
|---|---|---|---|
| Participant 1 | 98.5% | Participant 11 | 95.0% |
| Participant 2 | 98.0% | Participant 12 | 100.0% |
| Participant 3 | 99.0% | Participant 13 | 95.0% |
| Participant 4 | 100.0% | Participant 14 | 98.0% |
| Participant 5 | 96.5% | Participant 15 | 98.5% |
| Participant 6 | 98.5% | Participant 16 | 94.5% |
| Participant 7 | 99.0% | Participant 17 | 95.5% |
| Participant 8 | 97.5% | Participant 18 | 98.0% |
| Participant 9 | 98.5% | Participant 19 | 99.0% |
| Participant 10 | 98.0% | Participant 20 | 98.0% |
| Study | RTP (ms) | Gestures | Duration (s) | Participants | Repetition | Classifier | Accuracy (%) |
|---|---|---|---|---|---|---|---|
| Savur [22] | NI | 27 | 2 | 10 | 20 | SVM | 60.9 |
| Hu [34] | NI | 52 | 5 | 27 | 10 | LCNN | 87.0 |
| Kerber [41] | 500 | 5 | NI | 14 | NI | SVM | 95.0 |
| Chung [42] | 3 | 5 | 5 | 120 | 50 | ANN | 85.1 |
| Raurale [43] | 4.5/8.8 | 9 | 5 | 10 | 20 | RBF | 99.0 |
| Zhang [61] | 200 | 21 | 2 | 13 | 30 | GRU | 89.6 |
| Nasri [62] | 940 | 6 | 10 | 35 | 195 | GRU | 99.8 |
| Ali [63] | NI | 18 | 5 | 40 | 6 | LSTM | 89.5 |
| He [64] | 400 | 52 | 5 | 27 | 10 | LSTM | 75.5 |
| Ours | 50 | 20 | 3 | 20 | 10 | BL + LSTM | 97.7 |
Publisher’s Note: MDPI stays neutral with regard to jurisdictional claims in published maps and institutional affiliations. |
© 2020 by the authors. Licensee MDPI, Basel, Switzerland. This article is an open access article distributed under the terms and conditions of the Creative Commons Attribution (CC BY) license (http://creativecommons.org/licenses/by/4.0/).
Share and Cite
Tateno, S.; Liu, H.; Ou, J. Development of Sign Language Motion Recognition System for Hearing-Impaired People Using Electromyography Signal. Sensors 2020, 20, 5807. https://doi.org/10.3390/s20205807
Tateno S, Liu H, Ou J. Development of Sign Language Motion Recognition System for Hearing-Impaired People Using Electromyography Signal. Sensors. 2020; 20(20):5807. https://doi.org/10.3390/s20205807
Chicago/Turabian StyleTateno, Shigeyuki, Hongbin Liu, and Junhong Ou. 2020. "Development of Sign Language Motion Recognition System for Hearing-Impaired People Using Electromyography Signal" Sensors 20, no. 20: 5807. https://doi.org/10.3390/s20205807