Vital Sign Monitoring in Car Seats Based on Electrocardiography, Ballistocardiography and Seismocardiography: A Review

 ,
,  , , , , and
Abstract
:1. Introduction
Background Study on Vital Sign Monitoring Systems
2. Overview of Already Existing Methods
2.1. Car Seat Systems
2.1.1. cECG Electrodes
2.1.2. BCG and SCG Sensors
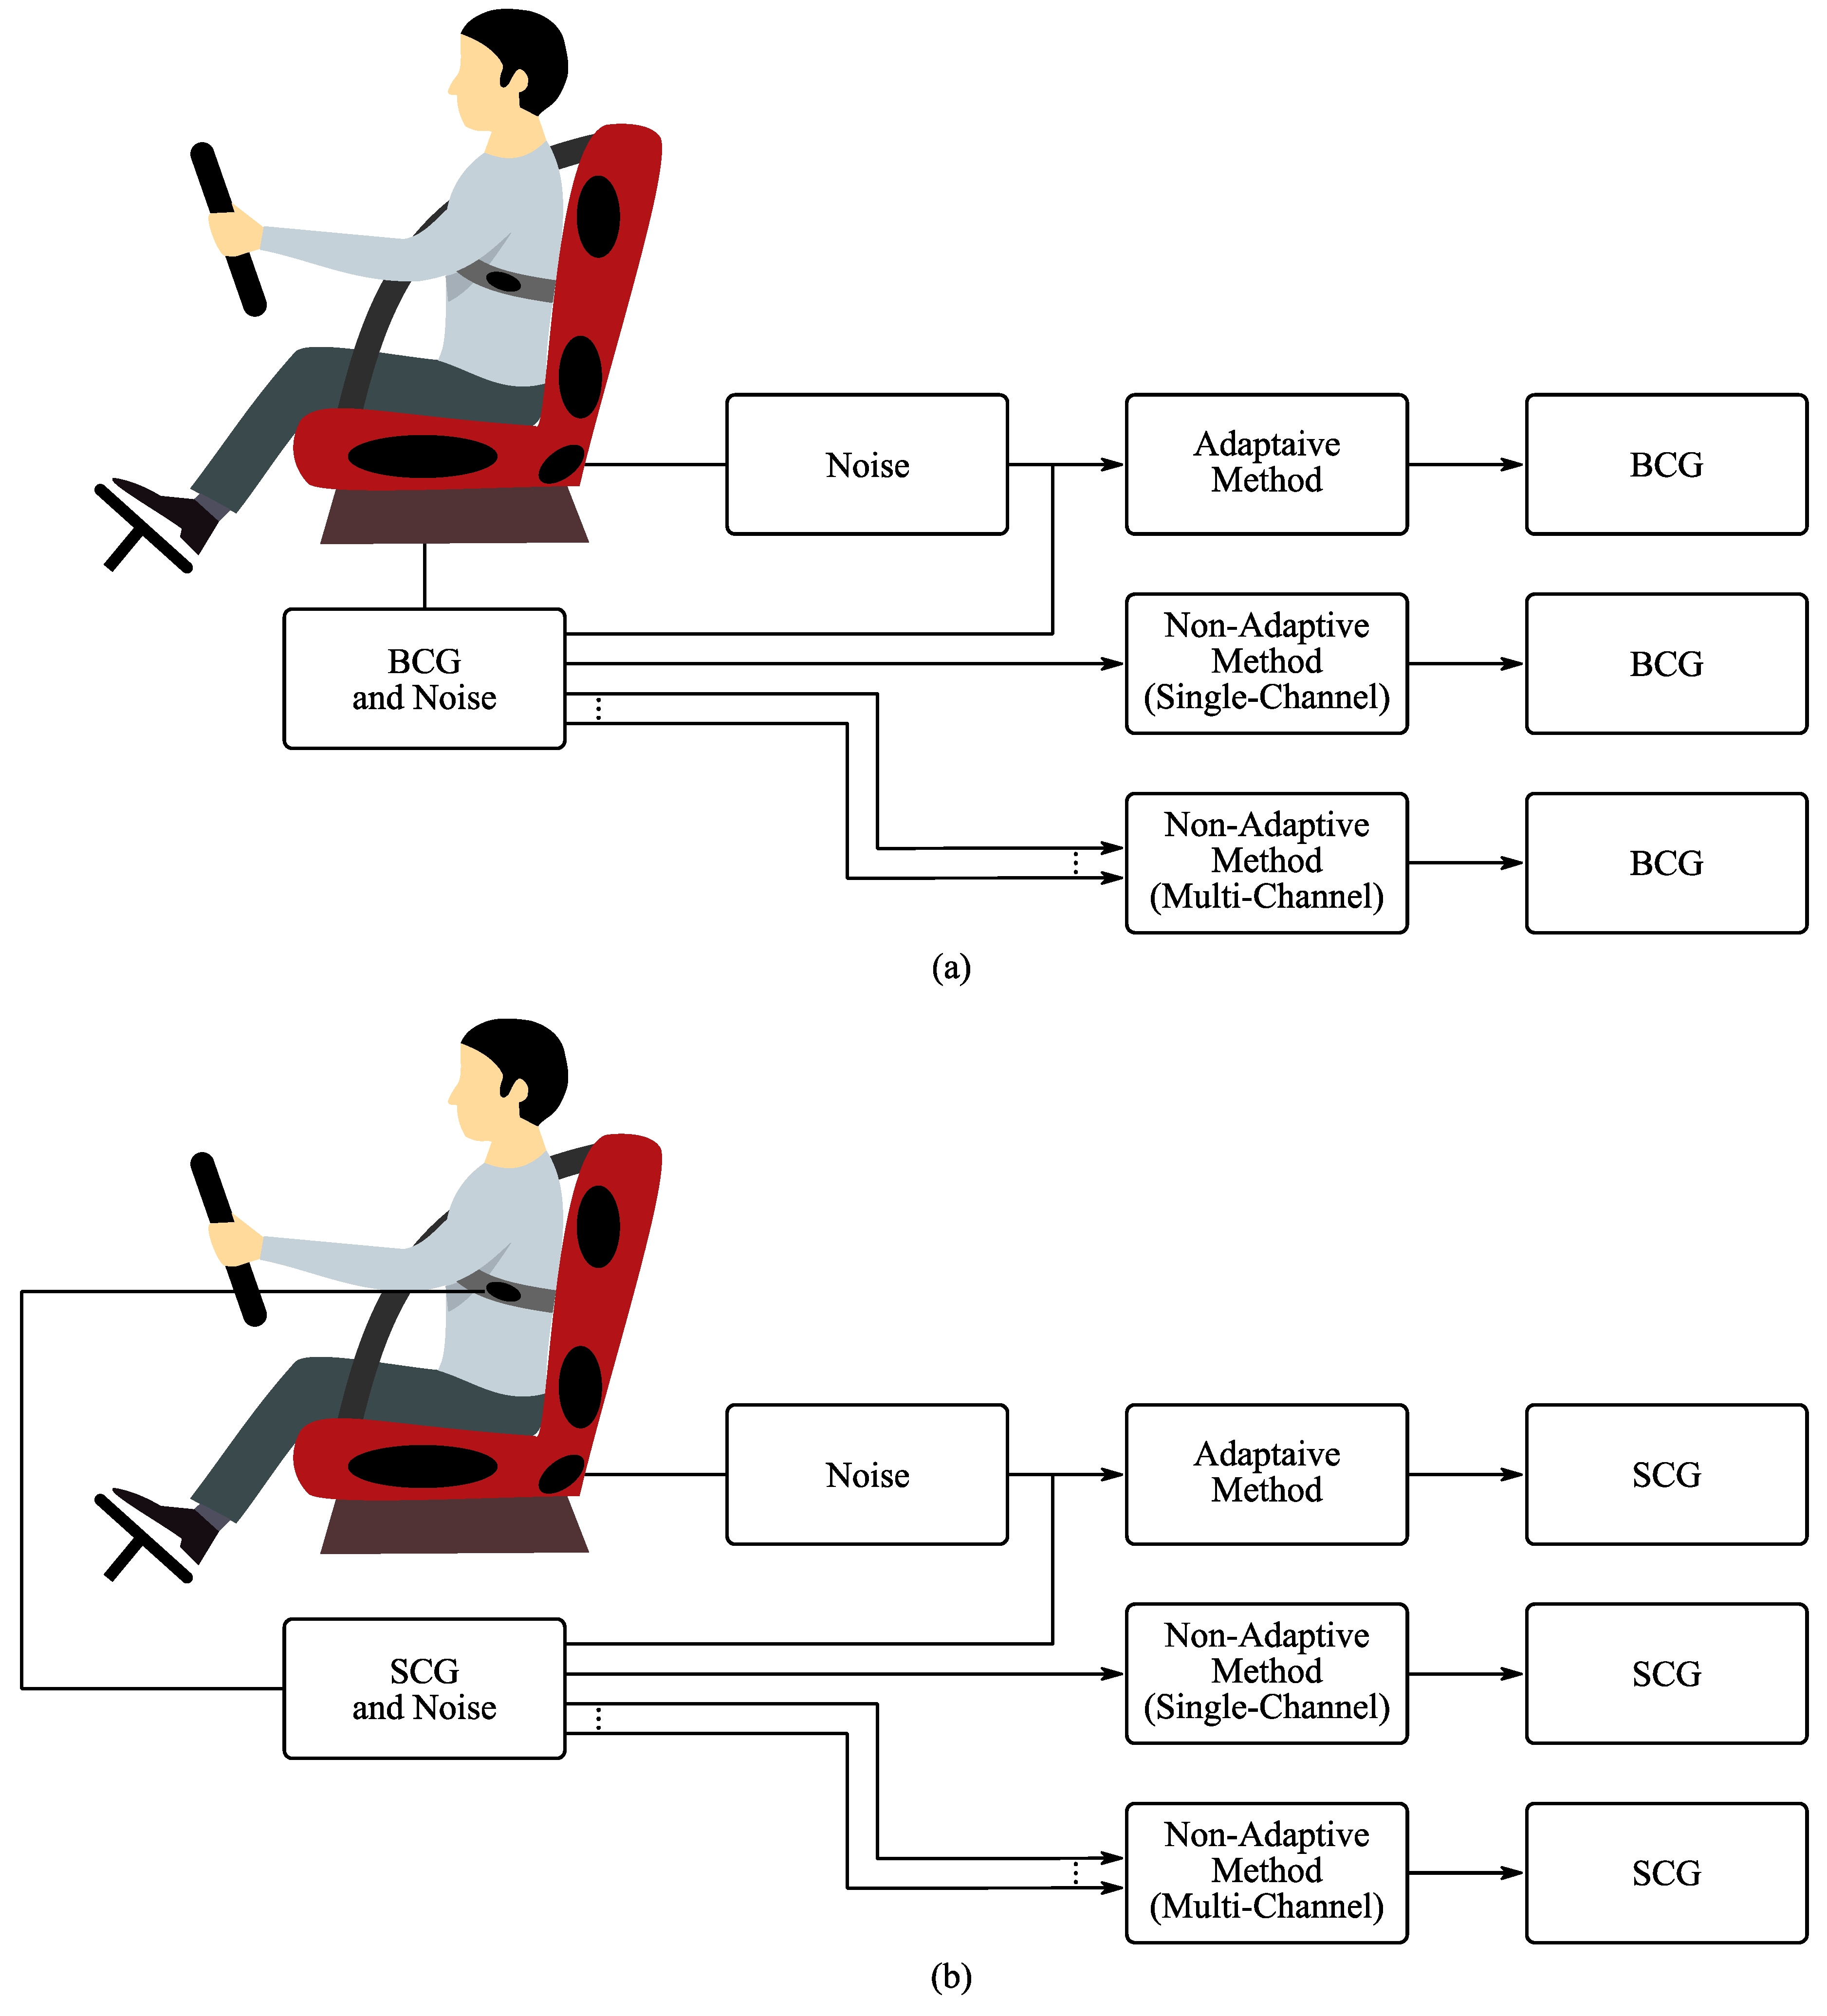
- To compensate artifacts—by using advanced adaptive filtering techniques with a single sensor used to monitor the noise itself;
- To separate unique sources—by using algorithms based on statistical dependencies between each individual signal (such as independent component analysis);
- To increase the coverage rate—by using a set of sensors to measure the same vital sign, thus increasing the likelihood that this vital sign can be obtained reliably.
2.1.3. Optical Sensors
2.2. Steering Wheel Systems
2.3. Helmet Systems
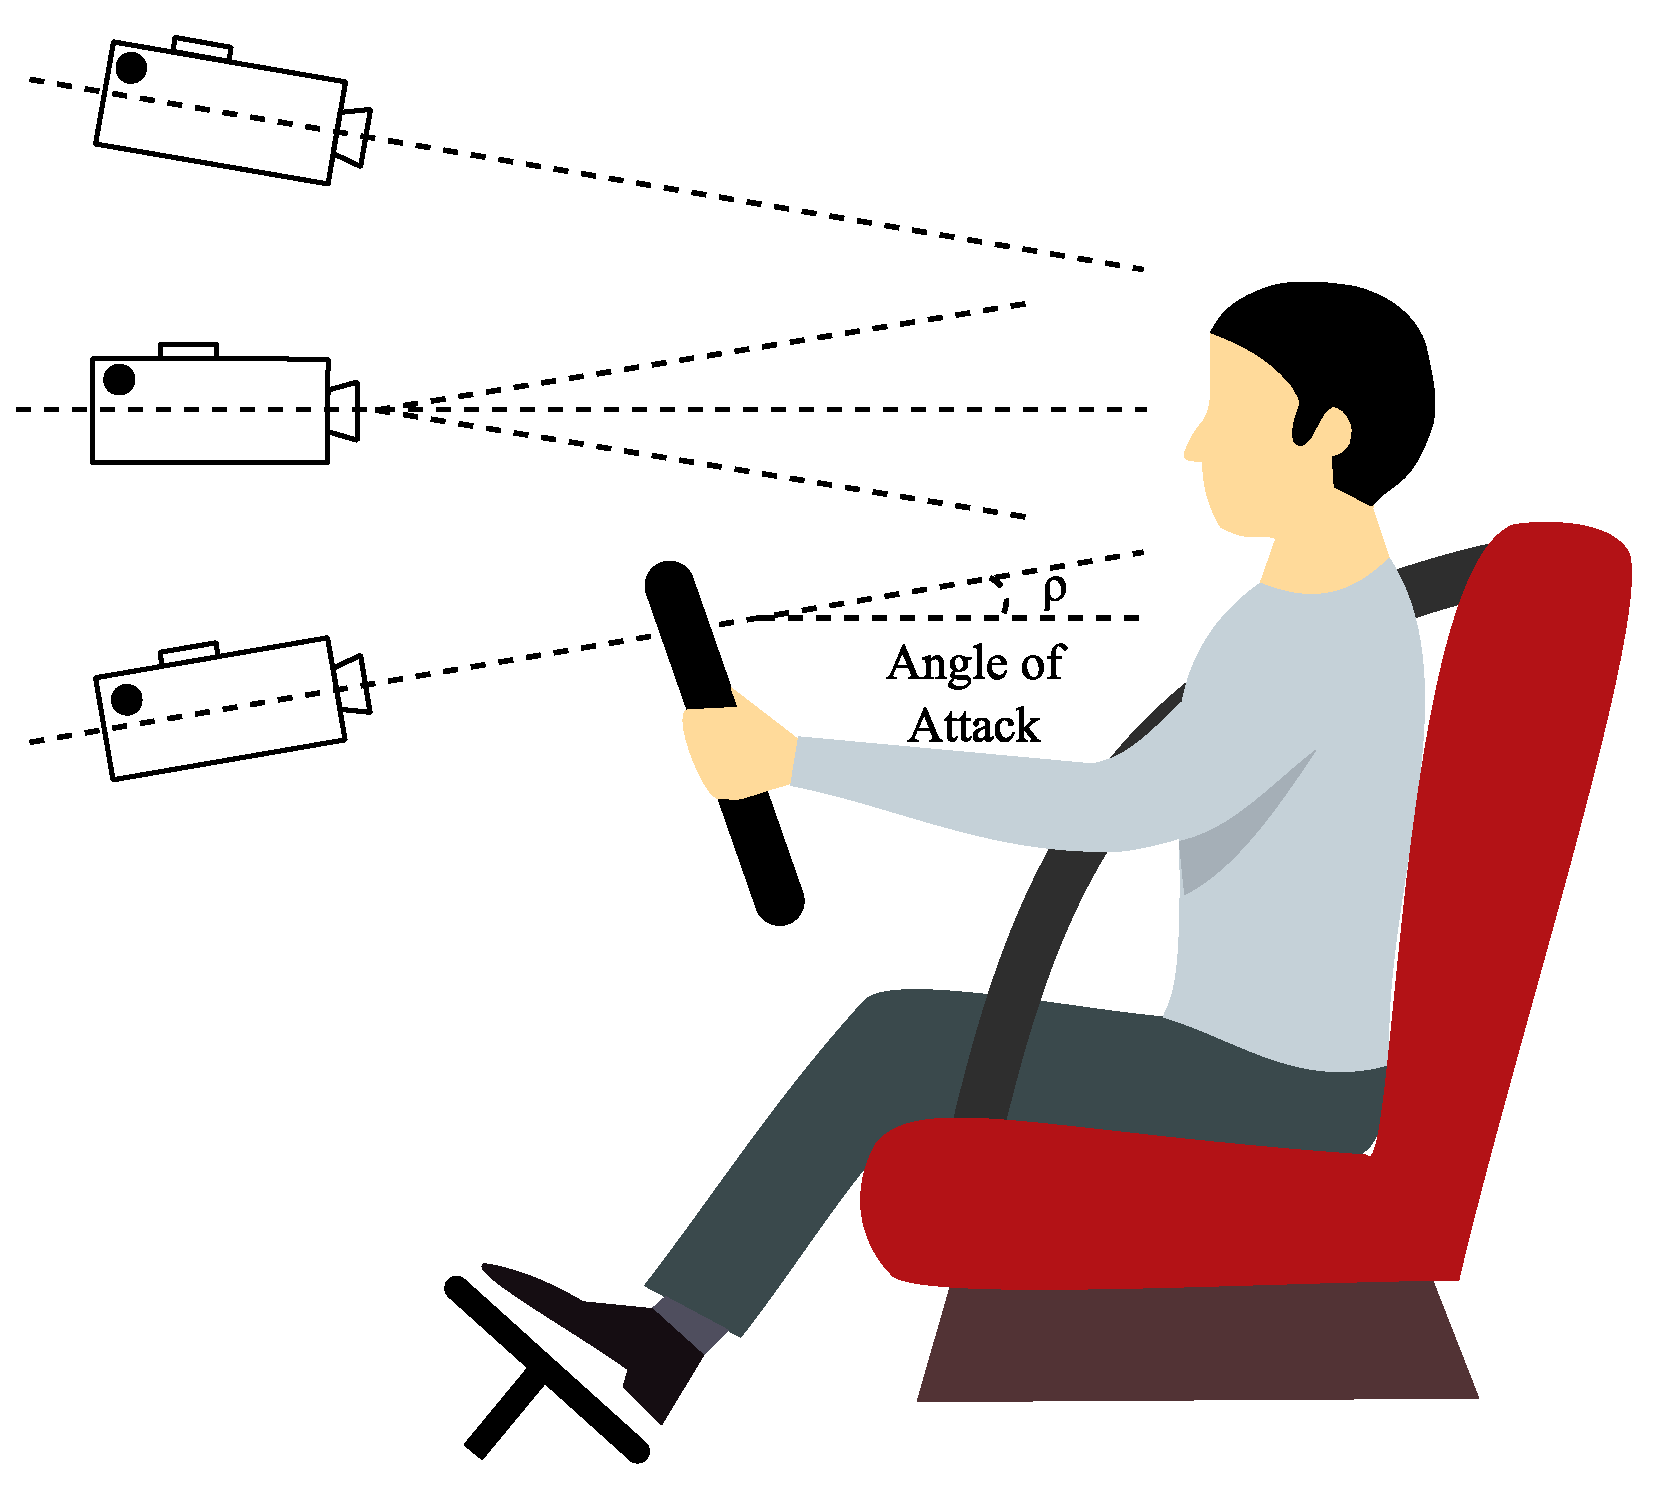
2.4. Camera Systems
2.5. Radar Systems
2.6. Other Sensors
3. Interference and Signal Pre-Processing
3.1. Noise and Interference
3.2. Advanced Signal Processing Methods
4. Examples of Patents
5. Discussion
6. Conclusions
Author Contributions
Funding
Conflicts of Interest
References
- Leonhardt, S.; Leicht, L.; Teichmann, D. Unobtrusive vital sign monitoring in automotive environments—A review. Sensors 2018, 18, 3080. [Google Scholar] [CrossRef] [PubMed] [Green Version]
- Zhou, X.; Wingert, T.; Sauer, M.; Kundu, S. Development of a camera-based driver state monitoring system for cost-effective embedded solution. SAE Int. 2020, 1, 1–8. [Google Scholar]
- Jesudoss, A.; Muthuram, B.; Lourdson Emmanuel, A. Safe driving using iot sensor. Int. J. Pure Appl. Math. 2018, 118, 3745–3751. [Google Scholar]
- Boyraz, P.; Acar, M.; Kerr, D. Multi-sensor driver monitoring and assistance system using state-of-the-art signal modelling. In Proceedings of the 20th International Technical Conference on the Enhanced Safety of Vehicles (ESV) National Highway Traffic Safety Administration, Detroit, MI, USA, 5–8 June 2017. [Google Scholar]
- Henni, K.; Mezghani, N.; Gouin-Vallerand, C.; Ruer, P.; Ouakrim, Y.; Vallières, É. Feature selection for driving fatigue characterization and detection using visual- and signal-based sensors. Appl. Inform. 2018, 5, 7. [Google Scholar] [CrossRef] [Green Version]
- Bi, C.; Huang, J.; Xing, G.; Jiang, L.; Liu, X.; Chen, M. Safe Watch: A wearable hand motion tracking system for improving driving safety. ACM Trans. Cyber Phys. Syst. 2020, 4, 1–21. [Google Scholar] [CrossRef]
- Hubbard, J.; Kantarjiev, C.U.S. Driver Alertness Warning System and Method. Patent Application No. 16/177,338, 2 May 2019. [Google Scholar]
- Wang, Y.; Ma, J.; Wei, L. Investigating the effect of long trip on driving performance, eye blinks, and awareness of sleepiness among commercial drivers: A naturalistic driving test study. Sci. Iran. 2018, 26, 95–102. [Google Scholar]
- Ashraf, I.; Hur, S.; Shafiq, M.; Park, Y.; Guo, Y. Catastrophic factors involved in road accidents: Underlying causes and descriptive analysis. PLoS ONE 2019, 14, e0223473. [Google Scholar] [CrossRef] [PubMed] [Green Version]
- Lupinska-Dubicka, A.; Tabedzki, M.; Adamski, M.; Rybnik, M.; Omieljanowicz, M.; Omieljanowicz, A.; Szymkowski, M.; Gruszewski, M.; Klimowicz, A.; Rubin, G.; et al. The concept of in-vehicle system for human presence and their vital signs detection. In Proceedings of the 5th International Doctoral Symposium on Applied Computation and Security Systems: ACSS2018, Kolkata, India, 9–11 February 2018. [Google Scholar]
- Walter, M.; Eilebrecht, B.; Wartzek, T.; Leonhardt, S. The smart car seat: Personalized monitoring of vital signs in automotive applications. Pers. Ubiquitous Comput. 2011, 15, 707–715. [Google Scholar] [CrossRef]
- Teyeb, I.; Jemai, O.; Zaied, M.; Amar, C. Towards a smart car seat design for drowsiness detection based on pressure distribution of the driver’s body. In Proceedings of the the Eleventh International Conference on Software Engineering Advances (ICSEA 2016), Rome, Italy, 21–25 August 2016. [Google Scholar]
- Park, J.; Subramaniyam, M.; Kim, S.; Lee, J.; Jo, C.; Seo, Y. Development of the elderly healthcare monitoring system with iot. In Advances in Human Factors and Ergonomics in Healthcare; Springer: Berlin/Heidelberg, Germany, 2017; pp. 309–315. [Google Scholar]
- Alasry, B.; Vang, D.U.S. System for Monitoring Driver Alertness and Adapting Vehicle Settings Thereto. Patent No. 9,925, 27 March 2018. [Google Scholar]
- Nanu, F.; Peterscu, S.; Oprea, F.; Haller, E.U.S. Human Monitoring System Incorporating Calibration Methodology. Patent Application No. 16/150,225, 11 August 2020. [Google Scholar]
- Hanna, K.U.S. Combining Driver Alertness with Advanced Driver Assistance Systems (ADAS). Patent Application No. 16/192,529, 11 April 2019. [Google Scholar]
- Sakurai, K.; Tamura, H. A study on the gaze range calculation method during an actual car driving using eyeball angle and head angle information. Sensors 2019, 19, 4774. [Google Scholar] [CrossRef] [Green Version]
- Tiffen, R.; Gauja, A.; O’Connor, B.; Gittins, R.; Smith, D. People and Life Expectancy. In How America Compares; How the World Compares; Springer: Singapore, 2020; pp. 1–7. ISBN 978-981-13-9581-9. [Google Scholar]
- Nakajima, Y. Controversies in the temperature management of critically ill patients. J. Anesth. 2016, 30, 873–883. [Google Scholar] [CrossRef]
- Sun, G.; Matsui, T.; Watai, Y.; Kim, S.; Kirimoto, T.; Suzuki, S.; Hakozaki, Y. Vital-SCOPE: Design and evaluation of a smart vital sign monitor for simultaneous measurement of pulse rate, respiratory rate, and body temperature for patient monitoring. J. Sens. 2018, 2018, 4371872. [Google Scholar] [CrossRef] [Green Version]
- Alhassan, B.; Tela, N. Modeling vital signs components and it consequence in human health. J. Phys. Sci. Innov. 2019, 11, 1–14. [Google Scholar]
- Wartzek, T.; Czaplik, M.; Antink, C.; Eilebrecht, B.; Walocha, R.; Leonhardt, S. UnoViS: The MedIT public unobtrusive vital signs database. Health Inf. Sci. Syst. 2015, 3, 2. [Google Scholar] [CrossRef] [PubMed] [Green Version]
- Bruser, C.; Antink, C.; Wartzek, T.; Walter, M.; Leonhardt, S. Ambient and unobtrusive cardiorespiratory monitoring techniques. IEEE Rev. Biomed. Eng. 2015, 8, 30–43. [Google Scholar] [CrossRef] [PubMed]
- Ekerete, I.; Nugent, C.; Giggins, O.; McLaughlin, J. Unobtrusive Sensing solution for post-stroke rehabilitation. In Smart Assisted Living; Chen, F., García-Betances, R., Chen, L., Cabrera-Umpiérrez, M., Nugent, C., Eds.; Computer Communications and Networks; Springer: Berlin/Heidelberg, Germany, 2020; pp. 43–62. ISBN 978-3-030-25589-3. [Google Scholar]
- Leicht, L.; Skobel, E.; Mathissen, M.; Leonhardt, S.; Weyer, S.; Wartzek, T.; Reith, S.; Mohler, W.; Teichmann, D. Capacitive ECG recording and beat-to-beat interval estimation after major cardiac event. In Proceedings of the 2015 37th Annual International Conference of the IEEE Engineering in Medicine and Biology Society (EMBC), Milan, Italy, 25–29 August 2015; pp. 7614–7617. [Google Scholar]
- Chamadiya, B.; Heuer, S.; Hofmann, U.; Wagner, M. Towards a capacitively coupled electrocardiography system for car seat integration. In 4th European Conference of the International Federation for Medical and Biological Engineering; Vander Sloten, J., Verdonck, P., Nyssen, M., Haueisen, J., Eds.; IFMBE Proceedings; Springer: Berlin Heidelberg, 2009; pp. 1217–1221. ISBN 978-3-540-89207-6. [Google Scholar]
- Barakat, R.; Deserno, T.; Deserno, T.; Chen, P. Automatic alerting of accidents and emergencies: The international standard accident number and vital sign data embedded in future PACS. In Proceedings of the Medical Imaging 2020: Imaging Informatics for Healthcare, Research, and Applications, San Diego, CA, USA, 16–17 February 2020; p. 49. [Google Scholar]
- Heath, B.; Malkin, W.U.S. Contextual driver behavior monitoring. Patent No. 10,543, 26 December 2017. [Google Scholar]
- Huang, J.; Luo, X.; Peng, X. A novel classification method for a driver’s cognitive stress level by transferring interbeat intervals of the ecg signal to pictures. Sensors 2020, 20, 1340. [Google Scholar] [CrossRef] [PubMed] [Green Version]
- Hamza Cherif, F.; Hamza Cherif, L.; Benabdellah, M.; Nassar, G. Monitoring driver health status in real time. Rev. Sci. Instrum. 2020, 91, 035110. [Google Scholar] [CrossRef] [PubMed]
- Raju, J.; Rakesh, P.; Neelima, N. Driver drowsiness monitoring system. In Intelligent Manufacturing and Energy Sustainability; Reddy, A., Marla, D., Simic, M., Favorskaya, M., Satapathy, S., Eds.; Smart Innovation, Systems and Technologies; Springer: Singapore, 2020; pp. 675–683. ISBN 978-981-15-1615-3. [Google Scholar]
- Miah, A.; Ahmad, M.; Mim, K. Drowsiness detection using eye-blink pattern and mean eye landmarks’ distance. In International Joint Conference on Computational Intelligence; Uddin, M., Bansal, J., Eds.; Algorithms for Intelligent Systems; Springer: Singapore, 2020; pp. 111–121. ISBN 978-981-13-7563-7. [Google Scholar]
- Ashfakur Rahman Arju, M.; Khan, N.; Hoque, K.; Jisan, A.; Tareque, S.; Hasan, M. A framework for detecting driver drowsiness based on eye blinking rate and hand gripping pressure. In International Joint Conference on Computational Intelligence; Uddin, M., Bansal, J., Eds.; Algorithms for Intelligent Systems; Springer: Singapore, 2020; pp. 289–304. ISBN 978-981-13-7563-7. [Google Scholar]
- Anitha, J.; Mani, G.; Venkata Rao, K. Driver Drowsiness Detection Using Viola Jones Algorithm. In Smart Intelligent Computing and Applications; Satapathy, S., Bhateja, V., Mohanty, J., Udgata, S., Eds.; Smart Innovation, Systems and Technologies; Springer: Singapore, 2020; pp. 583–592. ISBN 978-981-13-9281-8. [Google Scholar]
- Shin, J.; Hwang, S.; Chang, M.; Park, K. Heart rate variability analysis using a ballistocardiogram during Valsalva manoeuvre and post exercise. Physiol. Meas. 2011, 32, 1239–1264. [Google Scholar] [CrossRef]
- Koivistoinen, T.; Junnila, S.; Varri, A.; Koobi, T. A new method for measuring the ballistocardiogram using EMFi sensors in a normal chair. In Proceedings of the 26th Annual International Conference of the IEEE Engineering in Medicine and Biology Society, San Francisco, CA, USA, 1–5 September 2004; pp. 2026–2029. [Google Scholar]
- Giovangrandi, L.; Inan, O.; Wiard, R.; Etemadi, M.; Kovacs, G. A method worth revisiting. In Proceedings of the 2011 Annual International Conference of the IEEE Engineering in Medicine and Biology Society, Boston, MA, USA, 30 August–3 September 2011; pp. 4279–4282. [Google Scholar]
- Heinrich, A.; Aarts, R.U.S. Automatic Car Setting Adjustments by Identifying Driver with Health Watch Wearable or In-Car Sensors. Patent Application No. 15/893,085, 30 June 2020. [Google Scholar]
- Abu-Faraj, Z.; Al Chamaa, W.; Al Hadchiti, A.; Sraj, Y.; Tannous, J. Design and development of a heart-attack detection steering wheel. In Proceedings of the 2018 11th International Congress on Image and Signal Processing, BioMedical Engineering and Informatics (CISP-BMEI), Beijing, China, 13–15 October 2018; pp. 1–6. [Google Scholar]
- Essers, S.; Lisseman, J.; Ruck, H. Steering wheel for active driver state detection. Auto Tech Rev. 2016, 5, 36–41. [Google Scholar] [CrossRef]
- Sudhakar, J.; Srinivasan, S. To detect drowsy & eye state analysis of driver’s behaviour for the intelligent transport system. Indian J. Public Health Res. Dev. 2018, 9, 902–905. [Google Scholar]
- Schöneburg, R.; Fehring, M.; Richert, J.; Glashagel, M.; Ruf, J.; Walz, M.; Bogenrieder, R. Effectiveness potential of PRE-SAFE® impulse using the scenario of a major accident at an intersection as an example. In Proceedings of the 25th International Technical Conference on the Enhanced Safety of Vehicles (ESV), Detroit, MI, USA, 5–8 June 2017. [Google Scholar]
- Schmidt, E. Effects of Thermal Stimulation during Passive Driver Fatigue. In Gestaltung hybrider Mensch-Maschine-Systeme/Designing Hybrid Societies; Springer Fachmedien Wiesbaden: Wiesbaden, Germany, 2020; ISBN 978-3-658-28157-1. [Google Scholar]
- Li, C.; Cummings, J.; Lam, J.; Graves, E.; Wu, W. Radar remote monitoring of vital signs. IEEE Microw. Mag. 2009, 10, 47–56. [Google Scholar] [CrossRef]
- De Haan, G.; Verkruysse, W. Editorial for special issue: Contactless vital signs monitoring. Appl. Sci. 2020, 10, 166. [Google Scholar] [CrossRef] [Green Version]
- Yong, G.L.; Ko, K.K.; Suk, P. ECG measurement on a chair without conductive contact. IEEE Trans. Biomed. Eng. 2006, 53, 956–959. [Google Scholar] [CrossRef] [PubMed]
- Lim, Y.; Kim, K.; Park, K. ECG recording on a bed during sleep without direct skin-contact. IEEE Trans. Biomed. Eng. 2007, 54, 718–725. [Google Scholar] [CrossRef] [PubMed]
- Wu, K.; Zhang, Y. Contactless and continuous monitoring of heart electric activities through clothes on a sleeping bed. In Proceedings of the 2008 International Conference on Technology and Applications in Biomedicine, Tucson, AZ, USA, 13–17 January 2008; pp. 282–285. [Google Scholar]
- Schneider, J.; Koellner, C.; Heuer, S. An approach to automotive ECG measurement validation using a car-integrated test framework. In Proceedings of the 2012 IEEE Intelligent Vehicles Symposium, Alcala de Henares, Spain, 3–7 June 2012; pp. 950–955. [Google Scholar]
- Leicht, L.; Eilebrecht, B.; Weyer, S.; Wartzek, T.; Leonhardt, S. Active humidification for capacitive-resistive ECG-systems. Biomed. Technol. 2014, 59, 818–821. [Google Scholar]
- Leicht, L.; Skobel, E.; Knackstedt, C.; Mathissen, M.; Sitter, A.; Wartzek, T.; Mohler, W.; Reith, S.; Leonhardt, S.; Teichmann, D. Capacitive ECG monitoring in cardiac patients during simulated driving. IEEE Trans. Biomed. Eng. 2019, 66, 749–758. [Google Scholar] [CrossRef]
- Jung, S.-J.; Shin, H.-S.; Chung, W.-Y. Driver fatigue and drowsiness monitoring system with embedded electrocardiogram sensor on steering wheel. IET Intell. Transport Syst. 2014, 8, 43–50. [Google Scholar] [CrossRef]
- Weder, M.; Hegemann, D.; Amberg, M.; Hess, M.; Boesel, L.; Abächerli, R.; Meyer, V.; Rossi, R. Embroidered electrode with silver/titanium coating for long-term ECG monitoring. Sensors 2015, 15, 1750–1759. [Google Scholar] [CrossRef] [Green Version]
- Leicht, L.; Eilebrecht, B.; Weyer, S.; Leonhardt, S.; Teichmann, D. Closed-loop control of humidification for artifact reduction in capacitive ECG measurements. IEEE Trans. Biomed. Circuits Syst. 2017, 11, 300–313. [Google Scholar] [CrossRef]
- Van Hoof, C.; Torfs, T. How Your Car Can Check Your Daily Health. Available online: https://www.mwee.com/design-center/how-your-car-can-check-your-daily-health-0/page/0/3 (accessed on 30 September 2020).
- Inan, O. Recent advances in cardiovascular monitoring using ballistocardiography. In Proceedings of the 2012 Annual International Conference of the IEEE Engineering in Medicine and Biology Society, San Diego, CA, USA, 28 August–1 September 2012; pp. 5038–5041. [Google Scholar]
- Cimr, D.; Studnička, F. Automatic detection of breathing disorder from ballistocardiography signals. Knowl. Based Syst. 2020, 188, 104973. [Google Scholar] [CrossRef]
- Scarborough, W.; Talbot, S.; Braunstein, J.; Rappaport, M.; Dock, W.; Scarborough, W.; Hamilton, W.; Smith, J.; Nickerson, J.; Talbot, S.; et al. Proposals for ballistocardiographic nomenclature and conventions: Revised and extended. Circulation 1956, 14, 435–450. [Google Scholar] [CrossRef] [Green Version]
- Tao, N.; Shao, D.U.S. Systems and Methods for Non-contact Monitoring of Ballistocardiogram, Photoplethysmogram, Blood Pressure and Abnormal Heart Rhythm. Patent Application No. 16/083,052, 3 March 2019. [Google Scholar]
- Sadek, I.; Biswas, J.; Abdulrazak, B. Ballistocardiogram signal processing: A review. Health Inf. Sci. Syst. 2019, 7, 10. [Google Scholar] [CrossRef] [PubMed]
- Nagura, M.; Mitsukura, Y.; Kishimoto, T.; Mimura, M. A practical BCG measuring system with bed sensors and algorithm for heartbeat detection. In Proceedings of the 2018 IEEE 15th International Workshop on Advanced Motion Control (AMC), Tokyo, Japan, 9–11 March 2018; pp. 317–321. [Google Scholar]
- Nagura, M.; Mitsukura, Y.; Kishimoto, T.; Mimura, M. An estimation of heart rate variability from ballistocardiogram measured with bed leg sensors. In Proceedings of the 2018 IEEE International Conference on Industrial Technology (ICIT), Lyon, France, 20–22 February 2018; pp. 2005–2009. [Google Scholar]
- Gordon, J. Certain molar movements of the human body produced by the circulation of the blood. Anat. Physiol. 1877, 11, 533–536. [Google Scholar]
- Starr, I.; Rawson, A.; Schroeder, H.; Joseph, N. Studies on the estimation of cardiac ouptut in man, and of abnormalities in cardiac function, from the heart’s recoil and the blood’s impacts the ballistocardiogram. Am. J. Physiol. Leg. Content 1939, 127, 1–28. [Google Scholar] [CrossRef]
- Inan, O.; Etemadi, M.; Wiard, R.; Giovangrandi, L.; Kovacs, G. Robust ballistocardiogram acquisition for home monitoring. Physiol. Meas. 2009, 30, 169–185. [Google Scholar] [CrossRef] [PubMed]
- Choudhary, T.; Bhuyan, M.; Bora, K.; Sharma, L. Design of Breathing-states Detector for m-Health Platform using Seismocardiographic Signal. arXiv 2020, arXiv:2002.10510. [Google Scholar]
- Mora, N.; Cocconcelli, F.; Matrella, G.; Ciampolini, P. Detection and analysis of heartbeats in seismocardiogram signals. Sensors 2020, 20, 1670. [Google Scholar] [CrossRef] [Green Version]
- Mack, D.; Mack, D.; Patrie, J.; Suratt, P.; Felder, R.; Alwan, M. Development and preliminary validation of heart rate and breathing rate detection using a passive, ballistocardiography-based sleep monitoring system. IEEE Trans. Inf. Technol. Biomed. 2009, 13, 111–120. [Google Scholar] [CrossRef]
- Jansen, B.; Larson, B.; Shankar, K. Monitoring of the ballistocardiogram with the static charge sensitive bed. IEEE Trans. Biomed. Eng. 1991, 38, 748–751. [Google Scholar] [CrossRef]
- Bruser, C.; Stadlthanner, K.; de Waele, S.; Leonhardt, S. Adaptive beat-to-beat heart rate estimation in ballistocardiograms. IEEE Trans. Inf. Technol. Biomed. 2011, 15, 778–786. [Google Scholar] [CrossRef] [Green Version]
- Leonhardt, S.; Aleksandrowicz, A. Non-contact ECG monitoring for automotive application. In Proceedings of the 2008 5th International Summer School and Symposium on Medical Devices and Biosensors, Hong Kong, China, 1–3 June 2008; pp. 183–185. [Google Scholar]
- Hyun Jae, B.; Gih, S.C.; Ko, K.K.; Kwang, S.P. A smart health monitoring chair for nonintrusive measurement of biological signals. IEEE Trans. Inf. Technol. Biomed. 2012, 16, 150–158. [Google Scholar] [CrossRef]
- Harken Heart and Respiration in-Car Embedded Non Intrusive Sensors. 2016. Available online: https://cordis.europa.eu/project/id/286265/reporting (accessed on 30 September 2020).
- Wusk, G.; Gabler, H. Non-invasive detection of respiration and heart rate with a vehicle seat sensor. Sensors 2018, 18, 1463. [Google Scholar] [CrossRef] [PubMed] [Green Version]
- Scheunemann, J.; Unni, A.; Ihme, K.; Jipp, M.; Rieger, J. Demonstrating brain-level interactions between visuospatial attentional demands and working memory load while driving using functional near-infrared spectroscopy. Front. Hum. Neurosci. 2019, 12, 542. [Google Scholar] [CrossRef] [PubMed]
- Kawala-Sterniuk, A.; Podpora, M.; Pelc, M.; Blaszczyszyn, M.; Gorzelanczyk, E.; Martinek, R.; Ozana, S. Comparison of smoothing filters in analysis of eeg data for the medical diagnostics purposes. Sensors 2020, 20, 807. [Google Scholar] [CrossRef] [PubMed] [Green Version]
- Qin, T.; Cao, S.; Pan, J.; Shen, S. A general optimization-based framework for global pose estimation with multiple Sensors. arXiv 2019, arXiv:1901.03642. [Google Scholar]
- Antink, C.; Gao, H.; Brüser, C.; Leonhardt, S. Beat-to-beat heart rate estimation fusing multimodal video and sensor data. Biomed. Opt. Express 2015, 6, 2895–2905. [Google Scholar] [CrossRef] [PubMed] [Green Version]
- Shandhi, M.; Semiz, B.; Hersek, S.; Goller, N.; Ayazi, F.; Inan, O. Performance analysis of gyroscope and accelerometer sensors for seismocardiography-based wearable pre-ejection period estimation. IEEE J. Biomed. Health Inform. 2019, 23, 2365–2374. [Google Scholar] [CrossRef] [PubMed]
- Castiglioni, P.; Faini, A.; Parati, G.; Di Rienzo, M. Wearable seismocardiography. In Proceedings of the 2007 29th Annual International Conference of the IEEE Engineering in Medicine and Biology Society, Lyon, France, 22–26 August 2007; pp. 3954–3957. [Google Scholar]
- Di Rienzo, M.; Meriggi, P.; Rizzo, F.; Vaini, E.; Faini, A.; Merati, G.; Parati, G.; Castiglioni, P. A wearable system for the seismocardiogram assessment in daily life conditions. In Proceedings of the 2011 Annual International Conference of the IEEE Engineering in Medicine and Biology Society, Boston, MA, USA, 30 August–3 September 2011; pp. 4263–4266. [Google Scholar]
- Migeotte, P.; Tank, J.; Pattyn, N.; Funtova, I.; Baevsky, R.; Neyt, X.; Prisk, G. Three dimensional ballistocardiography: Methodology and results from microgravity and dry immersion. In Proceedings of the 2011 Annual International Conference of the IEEE Engineering in Medicine and Biology Society, Boston, MA, USA, 30 August–3 September 2011; pp. 4271–4274. [Google Scholar]
- Gih Sung, C.; Jeong, S.L.; Su Hwan, H.; Young, K.L.; Do-Un, J.; Kwang, S.P. Wakefulness estimation only using ballistocardiogram: Nonintrusive method for sleep monitoring. In Proceedings of the 2010 Annual International Conference of the IEEE Engineering in Medicine and Biology, Buenos Aires, Argentina, 31 August–4 September 2010; pp. 2459–2462. [Google Scholar]
- Paalasmaa, J. A respiratory latent variable model for mechanically measured heartbeats. Physiol. Meas. 2010, 31, 1331–1344. [Google Scholar] [CrossRef]
- He, D.; Winokur, E.; Sodini, C. A continuous, wearable, and wireless heart monitor using head ballistocardiogram (BCG) and head electrocardiogram (ECG). In Proceedings of the 2011 Annual International Conference of the IEEE Engineering in Medicine and Biology Society, Boston, MA, USA, 30 August–3 September 2011; pp. 4729–4732. [Google Scholar]
- Mandelbaum, H.; Mandelbaum, R. Studies utilizing the portable electromagnetic ballistocardiograph. Circulation 1953, 7, 910–915. [Google Scholar] [CrossRef] [Green Version]
- Gurkan, D.; Starodubov, D. Xiaojing yuan monitoring of the heartbeat sounds using an optical fiber bragg grating sensor. In Proceedings of the IEEE Sensors, Irvine, CA, USA, 30 October–3 November 2005; pp. 306–309. [Google Scholar]
- Romaniuk, R.; Linczuk, M.; Fajkus, M.; Nedoma, J.; Martinek, R.; Walendziuk, W. Comparison of the FBG sensor encapsulated into PDMS and FBG sensor glued on the plexiglass pad for respiratory and heart rate monitoring. In Proceedings of the Photonics Applications in Astronomy, Communications, Industry, and High-Energy Physics Experiments, Wilga, Poland, 28 May–6 June 2017. [Google Scholar]
- Lo Presti, D.; Massaroni, C.; D’Abbraccio, J.; Massari, L.; Caponero, M.; Longo, U.; Formica, D.; Oddo, C.; Schena, E. Wearable system based on flexible FBG for respiratory and cardiac monitoring. IEEE Sens. J. 2019, 19, 7391–7398. [Google Scholar] [CrossRef]
- Presti, D.; Massaroni, C.; Formica, D.; Saccomandi, P.; Giurazza, F.; Caponero, M.; Schena, E. Smart textile based on 12 fiber bragg gratings array for vital signs monitoring. IEEE Sens. J. 2017, 17, 6037–6043. [Google Scholar] [CrossRef]
- Sadek, I.; Biswas, J.; Fook, V.; Mokhtari, M. Automatic heart rate detection from FBG sensors using sensor fusion and enhanced empirical mode decomposition. In Proceedings of the 2015 IEEE International Symposium on Signal Processing and Information Technology (ISSPIT), Abu Dhabi, UAE, 7–10 December 2015; pp. 349–353. [Google Scholar]
- Xu, Y.; Luo, M.; Li, T.; Song, G. ECG signal de-noising and baseline wander correction based on ceemdan and wavelet threshold. Sensors 2017, 17, 2754. [Google Scholar] [CrossRef] [PubMed] [Green Version]
- Futatsuyama, K.; Mitsumoto, N.; Kawachi, T.; Nakagawa, T. Noise Robust optical sensor for driver’s vital signs. SAE Tech. Pap. 2011. [Google Scholar] [CrossRef]
- Jeong, I.; Lee, D.; Park, S.; Ko, J.; Yoon, H. Automobile driver’s stress index provision system that utilizes electrocardiogram. In Proceedings of the 2007 IEEE Intelligent Vehicles Symposium, Istanbul, Turkey, 13–15 June 2007; pp. 652–656. [Google Scholar]
- Lee, H.; Choi, J.; Kim, J.; Kim, Y.; Baek, H.; Ryu, M.; Sohn, R.; Park, K. Nonintrusive biosignal measurement system in a vehicle. In Proceedings of the 2007 29th Annual International Conference of the IEEE Engineering in Medicine and Biology Society, Lyon, France, 22–26 August 2007; pp. 2303–2306. [Google Scholar]
- Heung-Sub, S.; Sang-Joong, J.; Jong-Jin, K. Wan-Young Chung Real time car driver’s condition monitoring system. In Proceedings of the 2010 IEEE Sensors, Kona, HI, USA, 1–4 November 2010; pp. 951–954. [Google Scholar]
- Choi, Y.J.; Lee, J.Y.; Kong, S.H. Driver ECG Measuring System With a Conductive Fabric-Based Dry Electrode. IEEE Access 2018, 6, 415–427. [Google Scholar] [CrossRef]
- Heuer, S.; Chamadiya, B.; Gharbi, A.; Kunze, C.; Wagner, M. Unobtrusive in-vehicle biosignal instrumentation for advanced driver assistance and active safety. In Proceedings of the 2010 IEEE EMBS Conference on Biomedical Engineering and Sciences (IECBES), Kuala Lumpur, Malaysia, 30 November–2 December 2010; pp. 252–256. [Google Scholar]
- Gomez-Clapers, J.; Casanella, R. A Fast and easy-to-use ECG acquisition and heart rate monitoring system using a wireless steering wheel. IEEE Sens. J. 2012, 12, 610–616. [Google Scholar] [CrossRef]
- Silva, H.; Lourenço, A.; Fred, A. In-vehicle driver recognition based on hand ECG signals. In Proceedings of the 2012 ACM International Conference on Intelligent User Interfaces—IUI’12, Lisbon, Portugal, 14–17 February 2012; ACM Press: New York, NY, USA, 2012. [Google Scholar]
- Osaka, M. Customized heart check system by using integrated information of electrocardiogram and plethysmogram outside the driver’s awareness from an automobile steering wheel. In Advances in Electrocardiograms—Methods and Analysis; Millis, R., Ed.; INTECH Open Access: London, UK, 2012; ISBN 978-953-307-923-3. [Google Scholar]
- Matsuda, T.; Makikawa, M. ECG monitoring of a car driver using capacitively-coupled electrodes. In Proceedings of the 2008 30th Annual International Conference of the IEEE Engineering in Medicine and Biology Society, Vancouver, BC, Canada, 20–25 August 2008; pp. 1315–1318. [Google Scholar]
- Baek, H.; Lee, H.; Kim, J.; Choi, J.; Kim, K.; Park, K. Nonintrusive biological signal monitoring in a car to evaluate a driver’s stress and health state. Telemed. eHealth 2009, 15, 182–189. [Google Scholar] [CrossRef]
- Xu, X.; Ta, L. A novel driver-friendly ecg monitoring system based on capacitive-coupled electrode. Inf. Technol. J. 2013, 12, 4730–4734. [Google Scholar] [CrossRef] [Green Version]
- Acerra, E.; Pazzini, M.; Ghasemi, N.; Vignali, V.; Lantieri, C.; Simone, A.; Di Flumeri, G.; Aricò, P.; Borghini, G.; Sciaraffa, N.; et al. EEG-based mental workload and perception-reaction time of the drivers while using adaptive cruise control. In Human Mental Workload: Models and Applications; Longo, L., Leva, M., Eds.; Communications in Computer and Information Science; Springer: Berlin/Heidelberg, Germany, 2019; pp. 226–239. ISBN 978-3-030-32422-3. [Google Scholar]
- Kawala-Janik, A.; Bauer, W.; Al-Bakri, A.; Haddix, C.; Yuvaraj, R.; Cichon, K.; Podraza, W. Implementation of low-pass fractional filtering for the purpose of analysis of electroencephalographic signals. In Non-Integer Order Calculus and its Applications; Ostalczyk, P., Sankowski, D., Nowakowski, J., Eds.; Lecture Notes in Electrical Engineering; Springer: Berlin/Heidelberg, Germany, 2019; pp. 63–73. ISBN 978-3-319-78457-1. [Google Scholar]
- Kawala-Janik, A.; Pelc, M.; Podpora, M. Method for EEG Signals pattern recognition in embedded systems. Elektron. Elektrotechnika 2015, 21, 3–9. [Google Scholar] [CrossRef] [Green Version]
- Karthaus, M.; Wascher, E.; Getzmann, S.; Yao, D. Proactive vs. reactive car driving: EEG evidence for different driving strategies of older drivers. PLoS ONE 2018, 13, e0191500. [Google Scholar] [CrossRef] [Green Version]
- Hajinoroozi, M.; Mao, Z.; Jung, T.; Lin, C.; Huang, Y. EEG-based prediction of driver’s cognitive performance by deep convolutional neural network. Signal. Process. Image Commun. 2016, 47, 549–555. [Google Scholar] [CrossRef]
- Osama, M.; Aslam, M. Emotive EPOC+ fed electrical muscle stimulation system; an inexpensive brain-computer interface for rehabilitation of neuro-muscular disorders. J. Pak. Med Assoc. 2020, 3, 525–530. [Google Scholar] [CrossRef]
- Kim, J.; Lee, J.; Han, C.; Park, K. An instant donning multi-channel eeg headset (with comb-shaped dry electrodes) and bci applications. Sensors 2019, 19, 1537. [Google Scholar] [CrossRef] [PubMed] [Green Version]
- Sawangjai, P.; Hompoonsup, S.; Leelaarporn, P.; Kongwudhikunakorn, S.; Wilaiprasitporn, T. Consumer Grade EEG measuring sensors as research tools: A review. IEEE Sens. J. 2020, 20, 3996–4024. [Google Scholar] [CrossRef]
- Chuang, K.; Lin, Y. Cost-efficient, portable, and custom multi-subject electroencephalogram recording system. IEEE Access 2019, 7, 56760–56769. [Google Scholar] [CrossRef]
- Awangga, R.; Pane, S.; Simamora, D.; Asyhari, M. MILA: Low-cost BCI framework for acquiring EEG data with IoT. Telkomnika 2020, 18, 846–852. [Google Scholar] [CrossRef]
- Raja, P.; Akash, D.; Kumar, S.; Harsha, D.; Arunachalaperumal, C. Feature extraction and classification of EEG signal based anomaly detection and home automation for physically challenged/impaired people using neurosky mindwave headset. AIP Conf. Proc. 2020, 2207, 040006. [Google Scholar]
- Hammadi, K.; Ismaeel, M.; Faisal, T. Intelligent car safety system. In Proceedings of the 2016 IEEE Industrial Electronics and Applications Conference (IEACon), Kota Kinabalu, Malaysia, 20–22 November 2016; pp. 319–322. [Google Scholar]
- Nissimagoudar, P.; Nandi, A. Precision enhancement of driver assistant system using eeg based driver consciousness analysis & classification. In Computational Network Application Tools for Performance Management; Pant, M., Sharma, T., Basterrech, S., Banerjee, C., Eds.; Asset Analytics; Springer: Singapore, 2020; pp. 247–257. ISBN 978-981-32-9584-1. [Google Scholar]
- Lin, Y.; Chen, T.; Chen, W. Cost-efficient and custom electrode-holder assembly infrastructure for EEG recordings. Sensors 2019, 19, 4273. [Google Scholar] [CrossRef] [Green Version]
- Stach, T.; Browarska, N.; Kawala-Janik, A. Initial Study on Using Emotiv EPOC+ Neuroheadset as a Control Device for Picture Script-Based Communicators. IFAC Pap. 2018, 51, 180–184. [Google Scholar] [CrossRef]
- Chin-Teng, L.; Ruei-Cheng, W.; Sheng-Fu, L.; Wen-Hung, C.; Yu-Jie, C.; Tzyy-Ping, J. EEG-based drowsiness estimation for safety driving using independent component analysis. IEEE Trans. Circuits Syst. I Regul. Pap. 2005, 52, 2726–2738. [Google Scholar] [CrossRef] [Green Version]
- Liu, M.; Chen, H. Pre-research for long-term driving monitoring system based on physiological signals. In Proceedings of the 2016 6th International Conference on Advanced Design and Manufacturing Engineering (ICADME 2016), Zhuhai, China, 23–24 July 2016; Atlantis Press: Paris, France, 2016. [Google Scholar]
- Bauer, P.; Hiba, A.; Zarandy, A. Comparison of mono camera-based static obstacle position estimation methods for automotive application. In Proceedings of the 2019 27th Mediterranean Conference on Control and Automation (MED), Akko, Israel, 1–4 July 2019; pp. 386–391. [Google Scholar]
- Joy, J.; Gerla, M. Internet of vehicles and autonomous connected car—Privacy and security issues. In Proceedings of the 2017 26th International Conference on Computer Communication and Networks (ICCCN), Vancouver, BC, Canada, 31 July–3 August 2017; pp. 1–9. [Google Scholar]
- Nowara, E.; Marks, T.; Mansour, H.; Veeraraghavan, A. SparsePPG: Towards driver monitoring using camera-based vital signs estimation in near-infrared. In Proceedings of the 2018 IEEE/CVF Conference on Computer Vision and Pattern Recognition Workshops (CVPRW), Salt Lake City, UT, USA, 18–22 June 2018; pp. 1353–135309. [Google Scholar]
- Schires, E.; Georgiou, P.; Lande, T. Vital sign monitoring through the back using an uwb impulse radar with body coupled antennas. IEEE Trans. Biomed. Circuits Syst. 2018, 12, 292–302. [Google Scholar] [CrossRef]
- Munoz-Ferreras, J.; Peng, Z.; Gomez-Garcia, R.; Li, C. Random body movement mitigation for FMCW-radar-based vital-sign monitoring. In Proceedings of the 2016 IEEE Topical Conference on Biomedical Wireless Technologies, Networks, and Sensing Systems (BioWireleSS), Austin, TX, USA, 24–27 January 2016; pp. 22–24. [Google Scholar]
- Lohman, B.; Boric-Lubecke, O.; Lubecke, V.; Ong, P.; Sondhi, M. A digital signal processor for Doppler radar sensing of vital signs. IEEE Eng. Med. Biol. Mag. 2002, 21, 161–164. [Google Scholar] [CrossRef] [Green Version]
- Leem, S.; Khan, F.; Cho, S. Vital Sign monitoring and mobile phone usage detection using ir-uwb radar for intended use in car crash prevention. Sensors 2017, 17, 1240. [Google Scholar] [CrossRef] [PubMed] [Green Version]
- Zito, D.; Pepe, D.; Mincica, M.; Zito, F.; Tognetti, A.; Lanata, A.; De Rossi, D. SoC CMOS UWB Pulse Radar Sensor for Contactless Respiratory Rate Monitoring. IEEE Trans. Biomed. Circuits Syst. 2011, 5, 503–510. [Google Scholar] [CrossRef] [PubMed]
- Tsuchida, Y.; Shimoji, H.; Todaka, T.; Enokizono, M.; Yamane, H.; Enoki, Y.; Fujita, E. Development of a magnetic seat sensor for monitoring condition of a car driver. In Proceedings of the INTERMAG Asia Digests of the IEEE International Magnetics Conference, Nagoya, Japan, 4–8 April 2005; pp. 439–440. [Google Scholar]
- Lim, Y.; Gardi, A.; Pongsakornsathien, N.; Sabatini, R.; Ezer, N.; Kistan, T. Experimental characterisation of eye-tracking sensors for adaptive human-machine systems. Measurement 2019, 140, 151–160. [Google Scholar] [CrossRef]
- Ahmed, H.; Salma, A. A survey on human eye-gaze tracking (EGT) system “a comparative study”. Iraqi J. Inf. Technol. 2019, 9, 3. [Google Scholar]
- Zhao, Q.; Zhang, L.; Cichocki, A. EEG-based asynchronous BCI control of a car in 3D virtual reality environments. Chin. Sci. Bull. 2009, 54, 78–87. [Google Scholar] [CrossRef]
- Tan, F.; Liu, Z.; Chen, S.; Yu, C. Vital signs monitoring using twin core fiber-based sensor. In Proceedings of the 2019 24th OptoElectronics and Communications Conference (OECC) and 2019 International Conference on Photonics in Switching and Computing (PSC), Fukuoka, Japan, 7–11 July 2019; pp. 1–3. [Google Scholar]
- Xu, W.; Shen, Y.; Yu, C.; Dong, B.; Zhao, W.; Wang, Y. Long modal interference in multimode fiber and its application in vital signs monitoring. Opt. Commun. 2020, 474, 1–7. [Google Scholar] [CrossRef]
- Niederhauser, J. An engineer’s approach: How can 10–100 µT, 10–100 Hz magnetic field influence human cardiovascular regulation? Int. J. Bioelectromagn. 2018, 20, 90–95. [Google Scholar]
- Lazaro, A.; Girbau, D.; Villarino, R. Techniques for Clutter Suppression in the Presence of Body Movements during the Detection of Respiratory Activity through UWB Radars. Sensors 2014, 14, 2595–2618. [Google Scholar] [CrossRef]
- Engelberg, J.; Hill, L.; Rybar, J.; Styer, T. Distracted driving behaviors related to cell phone use among middle-aged adults. J. Transp. Health 2015, 2, 434–440. [Google Scholar] [CrossRef]
- Khan, F.; Cho, S. A detailed algorithm for vital sign monitoring of a stationary/non-stationary human through ir-uwb radar. Sensors 2017, 17, 290. [Google Scholar] [CrossRef] [Green Version]
- Chen, M.; Castro, I.; Lin, Q.; Torfs, T.; Tavernier, F.; Van Hoof, C.; Van Helleputte, N. A 400GΩ Input-Impedance, 220MVinfpp/inf Linear-Input-Range, 2.8Vinfpp/inf CM-Interference-Tolerant Active Electrode for Non-Contact Capacitively Coupled ECG Acquisition. In Proceedings of the 2018 IEEE Symposium on VLSI Circuits, Hilton Hawaiian Village, HI, USA, 18–22 June 2018; pp. 129–130. [Google Scholar]
- Fang, B.; Lane, N.; Zhang, M.; Boran, A.; Kawsar, F. BodyScan. In Proceedings of the 14th Annual International Conference on Mobile Systems, Applications, and Services—MobiSys ’16, Singapore, 25–30 June 2016; ACM Press: New York, NY, USA, 2016; pp. 97–110. [Google Scholar]
- Briko, A.; Chvanova, J.; Kobelev, A.; Shchukin, S. Evaluation of the electrode system pressure force influence on neuro muscular activity signals. Int. J. Bioelectromagn. 2018, 20, 28–31. [Google Scholar]
- Alizadeh, M.; Shaker, G.; Safavi-Naeini, S. Experimental study on the phase analysis of FMCW radar for vital signs detection. In Proceedings of the 2019 13th European Conference on Antennas and Propagation (EuCAP), Krakow, Poland, 31 March–5 April 2019. [Google Scholar]
- Lupinska-Dubicka, A.; Tabędzki, M.; Adamski, M.; Rybnik, M.; Szymkowski, M.; Omieljanowicz, M.; Gruszewski, M.; Klimowicz, A.; Rubin, G.; Zienkiewicz, L. Vehicle Passengers Detection for Onboard eCall-Compliant Devices. In Advances in Soft and Hard Computing; Pejaś, J., El Fray, I., Hyla, T., Kacprzyk, J., Eds.; Advances in Intelligent Systems and Computing; Springer: Berlin/Heidelberg, Germany, 2019; pp. 408–419. ISBN 978-3-030-03313-2. [Google Scholar]
- Hoog Antink, C.; Schulz, F.; Leonhardt, S.; Walter, M. Motion artifact quantification and sensor fusion for unobtrusive health monitoring. Sensors 2018, 18, 38. [Google Scholar] [CrossRef] [PubMed] [Green Version]
- Manjula, B.M.; Prasantha, H.S.; Goutham, M.A. Delayed LMS Algorithm for Ballistocardiogram Biomedical Signal. Int. J. Eng. Adv. Technol. 2020, 9, 77–81. [Google Scholar]
- Manjula, B.; Sharma, C. Ballistocardiography signal filtering using adaptive least mean square algorithm. In Proceedings of the 2016 IEEE International Conference on Recent Trends in Electronics, Information & Communication Technology (RTEICT), Bangalore, India, 20–21 May 2016; pp. 127–131. [Google Scholar]
- Inan, O.; Etemadi, M.; Widrow, B.; Kovacs, G. Adaptive cancellation of floor vibrations in standing ballistocardiogram measurements using a seismic sensor as a noise reference. IEEE Trans. Biomed. Eng. 2010, 57, 722–727. [Google Scholar] [CrossRef] [PubMed]
- Inan, O.; Etemadi, M.; Wiard, R.; Giovangrandi, L.; Kovacs, G. Evaluating the foot electromyogram signal as a noise reference for a bathroom scale ballistocardiogram recorder. In Proceedings of the 2008 21st IEEE International Symposium on Computer-Based Medical Systems, Jyvaskyla, Finland, 17–19 June 2008; pp. 70–74. [Google Scholar]
- Yang, C.; Tavassolian, N. Motion noise cancellation in seismocardiographic monitoring of moving subjects. In Proceedings of the 2015 IEEE Biomedical Circuits and Systems Conference (BioCAS), Atlanta, GA, USA, 22–24 October 2015; pp. 1–4. [Google Scholar]
- Etemadi, M.; Inan, O. Wearable ballistocardiogram and seismocardiogram systems for health and performance. J. Appl. Physiol. 2018, 124, 452–461. [Google Scholar] [CrossRef] [PubMed]
- Postolache, O.; Girao, P.; Mendes, J.; Pinheiro, E.; Postolache, G. Physiological Parameters Measurement Based on Wheelchair Embedded Sensors and Advanced Signal Processing. IEEE Trans. Instrum. Meas. 2010, 59, 2564–2574. [Google Scholar] [CrossRef]
- Manjula, B.M.; Sharma, C. BCG Artifact Removal Using Improved Independent Component Analysis Approach. Indones. J. Electr. Eng. Comput. Sci. 2017, 5, 130–138. [Google Scholar]
- Javed, E.; Faye, I.; Malik, A.; Abdullah, J. Reference-free reduction of ballistocardiogram artifact from EEG data using EMD-PCA. In Proceedings of the 2014 5th International Conference on Intelligent and Advanced Systems (ICIAS), Kuala Lumpur, Malaysia, 3–5 June 2014; pp. 1–6. [Google Scholar]
- Javed, E.; Faye, I.; Malik, A.; Abdullah, J. Removal of BCG artefact from concurrent fMRI-EEG recordings based on EMD and PCA. J. Neurosci. Methods 2017, 291, 150–165. [Google Scholar] [CrossRef]
- Elrod, S.; Dabney, R.U.S. Health Monitoring System for Car Seat. Patent Application No. 10/392, 26 October 2004. [Google Scholar]
- Bellamy, K.U.S. Health monitoring car seat assembly. Patent Application No. 15/878, 25 July 2019. [Google Scholar]
- Tausch, G.; Lüthke, T. Device for analyzing state e.g. health of driver, has processing module to analyze time-and-frequency-domain HRV parameters in digital signal to display stress state and activity of nervous system of driver on traffic light system. Patent No. DE102012002037B4, 5 March 2015. [Google Scholar]
- Xu, Q.; Wang, B.; Zhang, F.; Regani, D.; Wang, F.; Liu, K. Wireless AI in Smart Car: How Smart a Car Can Be? IEEE Access 2020, 8, 55091–55112. [Google Scholar] [CrossRef]
- Mahajan, A.; Bhat, K. A smart car: Synergetic combination of low cost multiple sensors for safety and accident prevention. J. Diabetes Sci. Technol. 2019, 6, 1–3. [Google Scholar]
- Jacobsen, M.; Dembek, T.; Kobbe, G.; Gaidzik, P.; Heinemann, L. Noninvasive continuous monitoring of vital signs with wearables: Fit for medical use? J. Diabetes Sci. Technol. 2020. [Google Scholar] [CrossRef] [PubMed]


| Non-Attached Sensor | Attached Sensor |
|---|---|
| eye movement monitoring sensors | helmet |
| head movement monitoring sensors | electrocardiographic (ECG) electrodes |
| mouth movement monitoring sensors | galvanic skin response sensing monitor (Electrodermal Activity) |
| vigilance monitoring system based on the driver’s behavior | respiration belt |
| accelerometer capacitive electrodes | pulse sensors |
| infrared sensors | |
| ultrasonic sensors | |
| Harken sensor | |
| optical sensors |
| Location/Type of Sensor | Principle |
|---|---|
| car seats |
|
| steering wheel |
|
| front camera |
|
| back camera |
|
| helmet |
|
| Place of Scanning | Electrode Type |
|---|---|
| driving-wheel | dry and conductive fabric electrode |
| conductive driving-wheel | capacitive electrode |
| armchair and bed | capacitive electrode |
| office chair | grounding and reference electrode |
| car seat | capacitive electrode |
| breast belt | conductive electrode |
| car seats via bluetooth | circular capacitive electrode |
| Modern BCG System | Measuring Axis | Key Benefits/Successes | Challenges/Constraints |
|---|---|---|---|
| Accelerometer in center of weight [82] | 3-axis | - Characterized 3D BCG vector - Measured 3D BCG in microgravity | - the need for weight reduction—either in space or with dry immersion |
| Bed and chair [70,83,84] | Longitudinal or out of the plane | - Minimal movement artifacts (usually) - Easy to integrate into home and everyday life | - Changes in sleep position may affect signal quality and morphology - It is difficult to pair BCG with other physiological measurements (e.g., ECG) |
| Monitor vital signs on the ears [85] | Primarily longitudinal | - ECG can be measured simultaneously - Miniature, potentially cheap system | - Head position may affect signal integrity - Repeatability to be assessed |
| Weight [35,36] | Longitudinal | - Correlation with CO/contractility changes - obtaining multiple physiological signals in addition to BCG | - Postural differences between measurements may affect signal integrity - Motion artifacts must be automatically detected and mitigated |
| Vest MagIC [37,86] | Primarily longitudinal | - Correlation with CO changes - Obtain multiple physiological signals in addition to BCG | - Signal variation based on sensor position - Motion artifacts must be automatically detected and mitigated |
| ECG/cECG | BCG/SCG | Ultra-Wideband Radar | Fiber Bragg Grating | |
|---|---|---|---|---|
| Powerline | High | Low | Low | Low |
| Motion | Medium | Medium | High | Medium |
| Background noise | Low | Low | Low | Low |
| Vibrations | Medium | High | Medium | High |
| Method | Overall Performance | SNR Improvement | Computational Cost | Real-Time | Implementation Complexity | |
|---|---|---|---|---|---|---|
| Adaptive Methods | ANFIS | High | Medium | High | No | Complex |
| LMS | Medium | Medium | Medium | Yes | Simple | |
| RLS | Medium | Medium | Medium | No | Simple | |
| Non-Adaptive Methods (Single-Channel) | FFT | Medium | Medium | Low | Yes | Medium |
| DWT | Medium | Medium | Low | Yes | Medium | |
| EMD | High | Medium | High | No | Medium | |
| Non-Adaptive Methods (Multi-Channel) | ICA | Medium | Medium | Medium | No | Medium |
| PCA | Low | Medium | Low | Yes | Simple | |
| Hybrid Methods | High | High | Medium/High | Yes/No | Medium/Complex | |
| Method | Parameters | Description | Optimal Values |
|---|---|---|---|
| ANFIS | Epochs Mf Shape | Number of epochs Number of membership functions Type of the membership function | [10, 20] 6 Gaussian/bell-shaped |
| DWT | Decomposition level Maternal wavelet | [3, 7] Daubechies/Symlet | |
| EMD | Number of intrinsic mode functions Size of the standard deviation (stopping criterion) | 15 [0.2, 0.3] | |
| LMS | Filter length/Filer order () Step size (convergence constant) | [1, 100] [0.00001, 0.1] | |
| RLS | Filter length/Filer order () Forgetting factor | [1, 100] [0.9, 1] | |
| ICA, PCA | Input Output Iterations | Number of input channels Number of outputs components Norm of the iterative step | Minimally 3 Minimally 3 1000 |
© 2020 by the authors. Licensee MDPI, Basel, Switzerland. This article is an open access article distributed under the terms and conditions of the Creative Commons Attribution (CC BY) license (http://creativecommons.org/licenses/by/4.0/).
Share and Cite
Sidikova, M.; Martinek, R.; Kawala-Sterniuk, A.; Ladrova, M.; Jaros, R.; Danys, L.; Simonik, P. Vital Sign Monitoring in Car Seats Based on Electrocardiography, Ballistocardiography and Seismocardiography: A Review. Sensors 2020, 20, 5699. https://doi.org/10.3390/s20195699
Sidikova M, Martinek R, Kawala-Sterniuk A, Ladrova M, Jaros R, Danys L, Simonik P. Vital Sign Monitoring in Car Seats Based on Electrocardiography, Ballistocardiography and Seismocardiography: A Review. Sensors. 2020; 20(19):5699. https://doi.org/10.3390/s20195699
Chicago/Turabian StyleSidikova, Michaela, Radek Martinek, Aleksandra Kawala-Sterniuk, Martina Ladrova, Rene Jaros, Lukas Danys, and Petr Simonik. 2020. "Vital Sign Monitoring in Car Seats Based on Electrocardiography, Ballistocardiography and Seismocardiography: A Review" Sensors 20, no. 19: 5699. https://doi.org/10.3390/s20195699