Development of a Smart Ball to Evaluate Locomotor Performance: Application in Adolescents with Intellectual Disabilities

 ,
, 
Abstract
:1. Introduction
2. Related Works
3. Materials and Methods
3.1. Participants
3.2. Measurement Devices
- A.
- Nonwearable Smart Ball
- B.
- Wearable: Xsens Tracker
3.3. Testing Flow
- (1)
- Picking up the ball: The ball was placed in front of the participant. After the beep sound, the participant was asked to pick up the ball as quickly as possible. The test repeated three times. The ball was placed at a different height each time (Figure 3a).
- (2)
- Throwing and catching the ball: The participant first held the ball to the chest. After the beep sound, the participant was asked to throw up the ball vertically over a certain height (e.g., 2.5 m) and catch the ball stably with two hands (Figure 3b).
- (3)
- Dribbling the ball along a straight line: The participant was asked to dribble the ball with the feet along a straight line in a lane that was 12 m in length and 2 m in width (1 m to each side of the straight line) without any obstacles (Figure 3c).
- (4)
- Dribbling the ball with feet along a zigzag line: The participant was asked to dribble the ball with the feet along in the same lane (length 12 m, width 2 m) with five obstacles staggered in a zigzag order (Figure 3d).
3.4. Parameters and Signal Processing
- A.
- Average Reaction Time
- B.
- Throwing-and-Catching Rate
- C.
- Total dribbling time
- D.
- Total Dribbling Distance
- E.
- Limb Swinging Angle
- F.
- Limb Swinging Frequency
- G.
- Trunk Tilt Angle
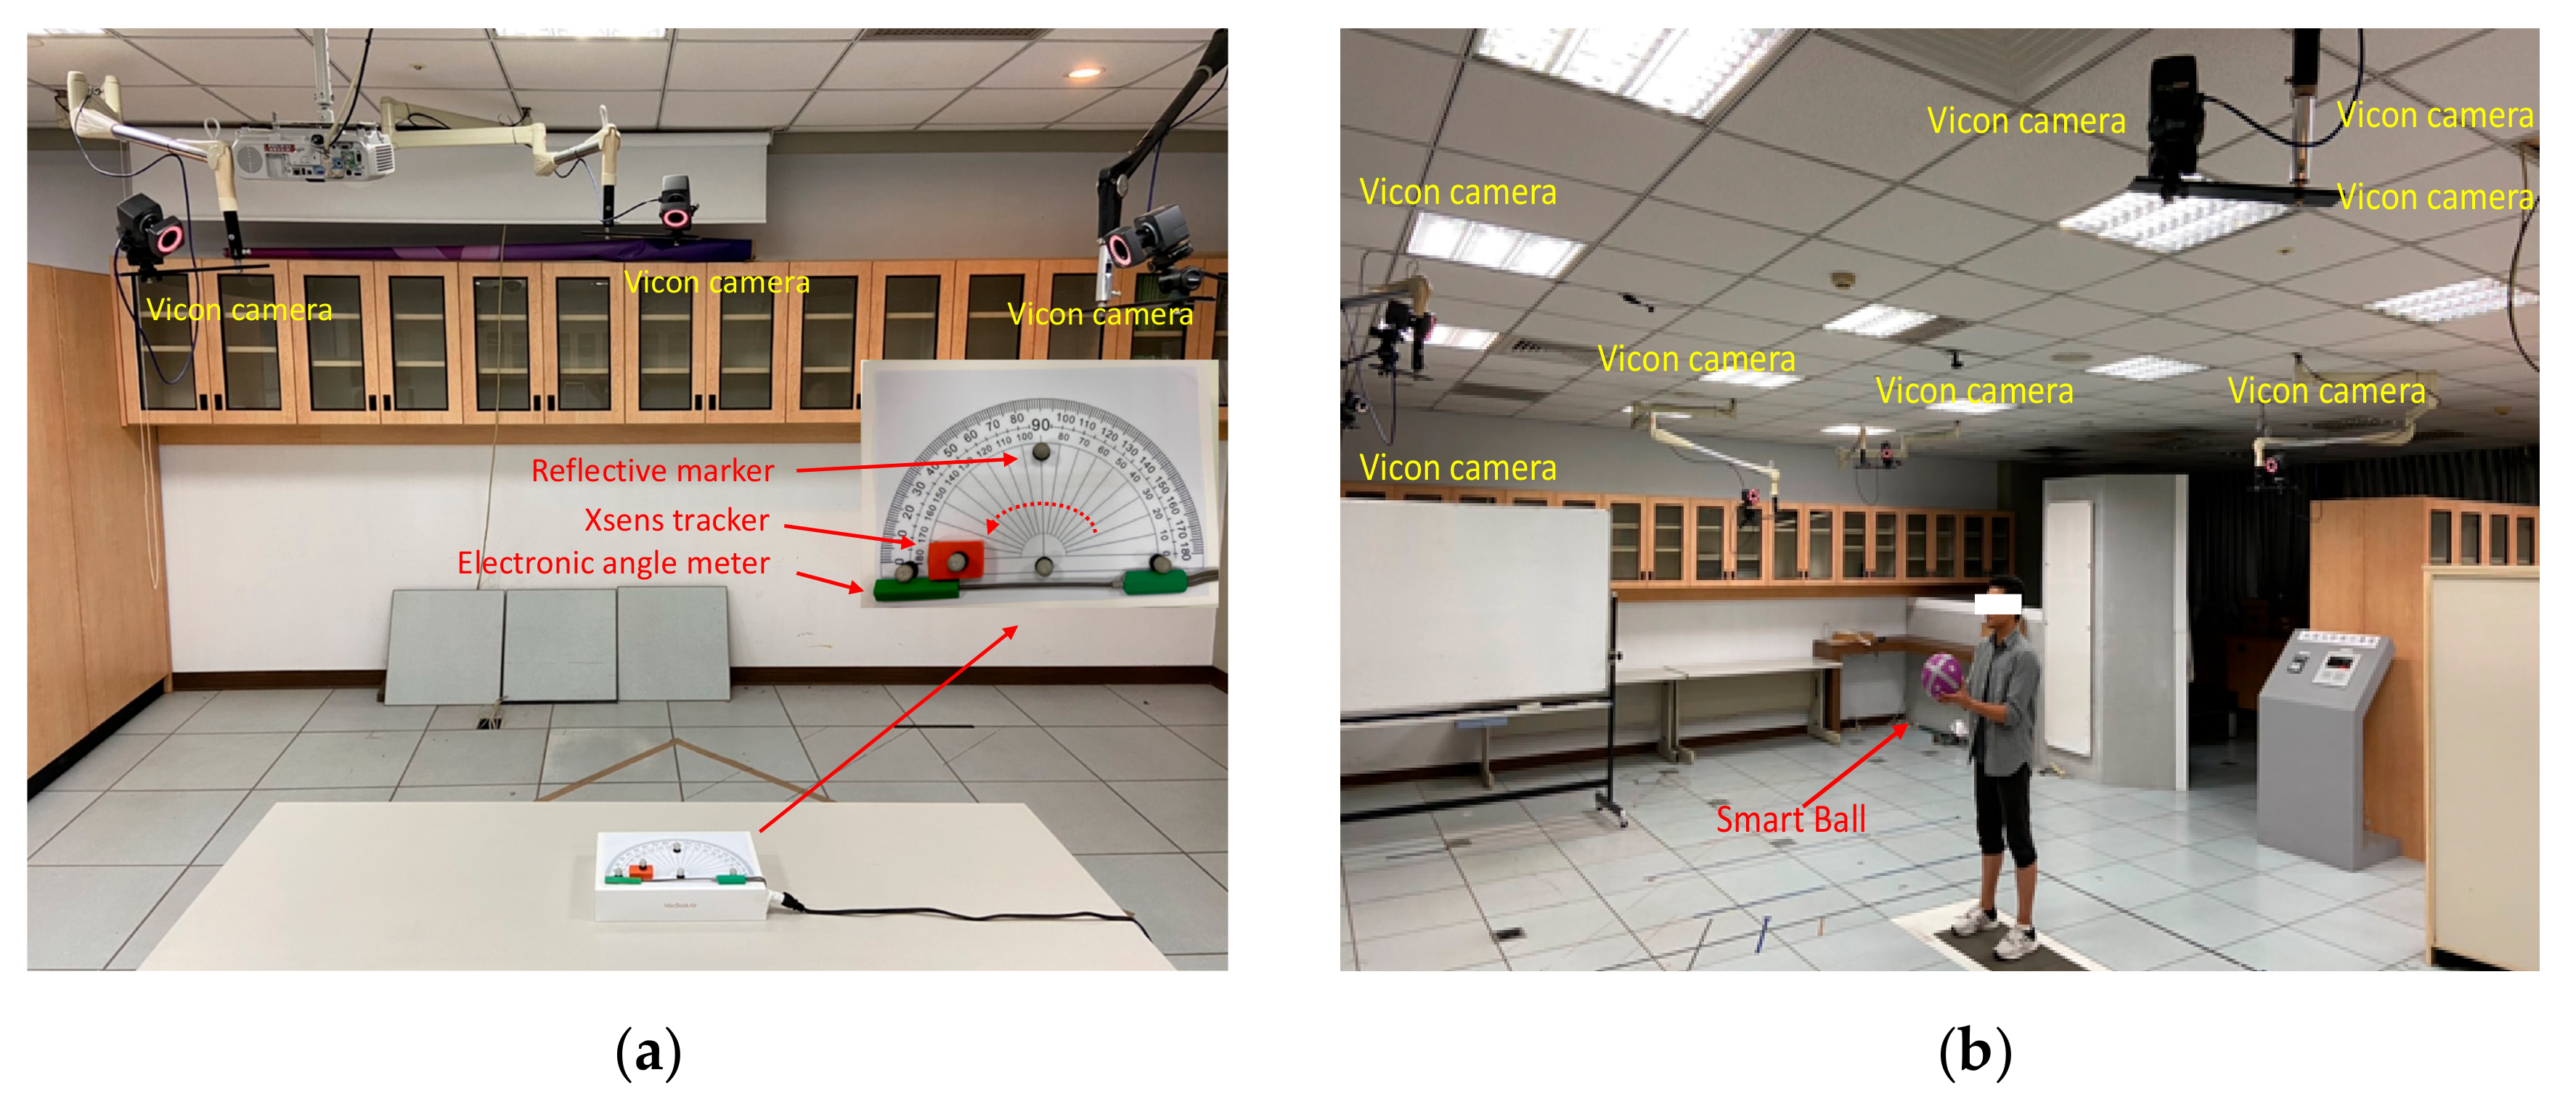
3.5. Validation
4. Results
4.1. Validation Results
- A.
- Xsens Tracker Validation
- B.
- Smart Ball Validation
4.2. Ball-Related Skill Performance
- A.
- Average Reaction Time
- B.
- Successful Throwing-and-Catching Rate
- C.
- Total Dribbling Distance
- D.
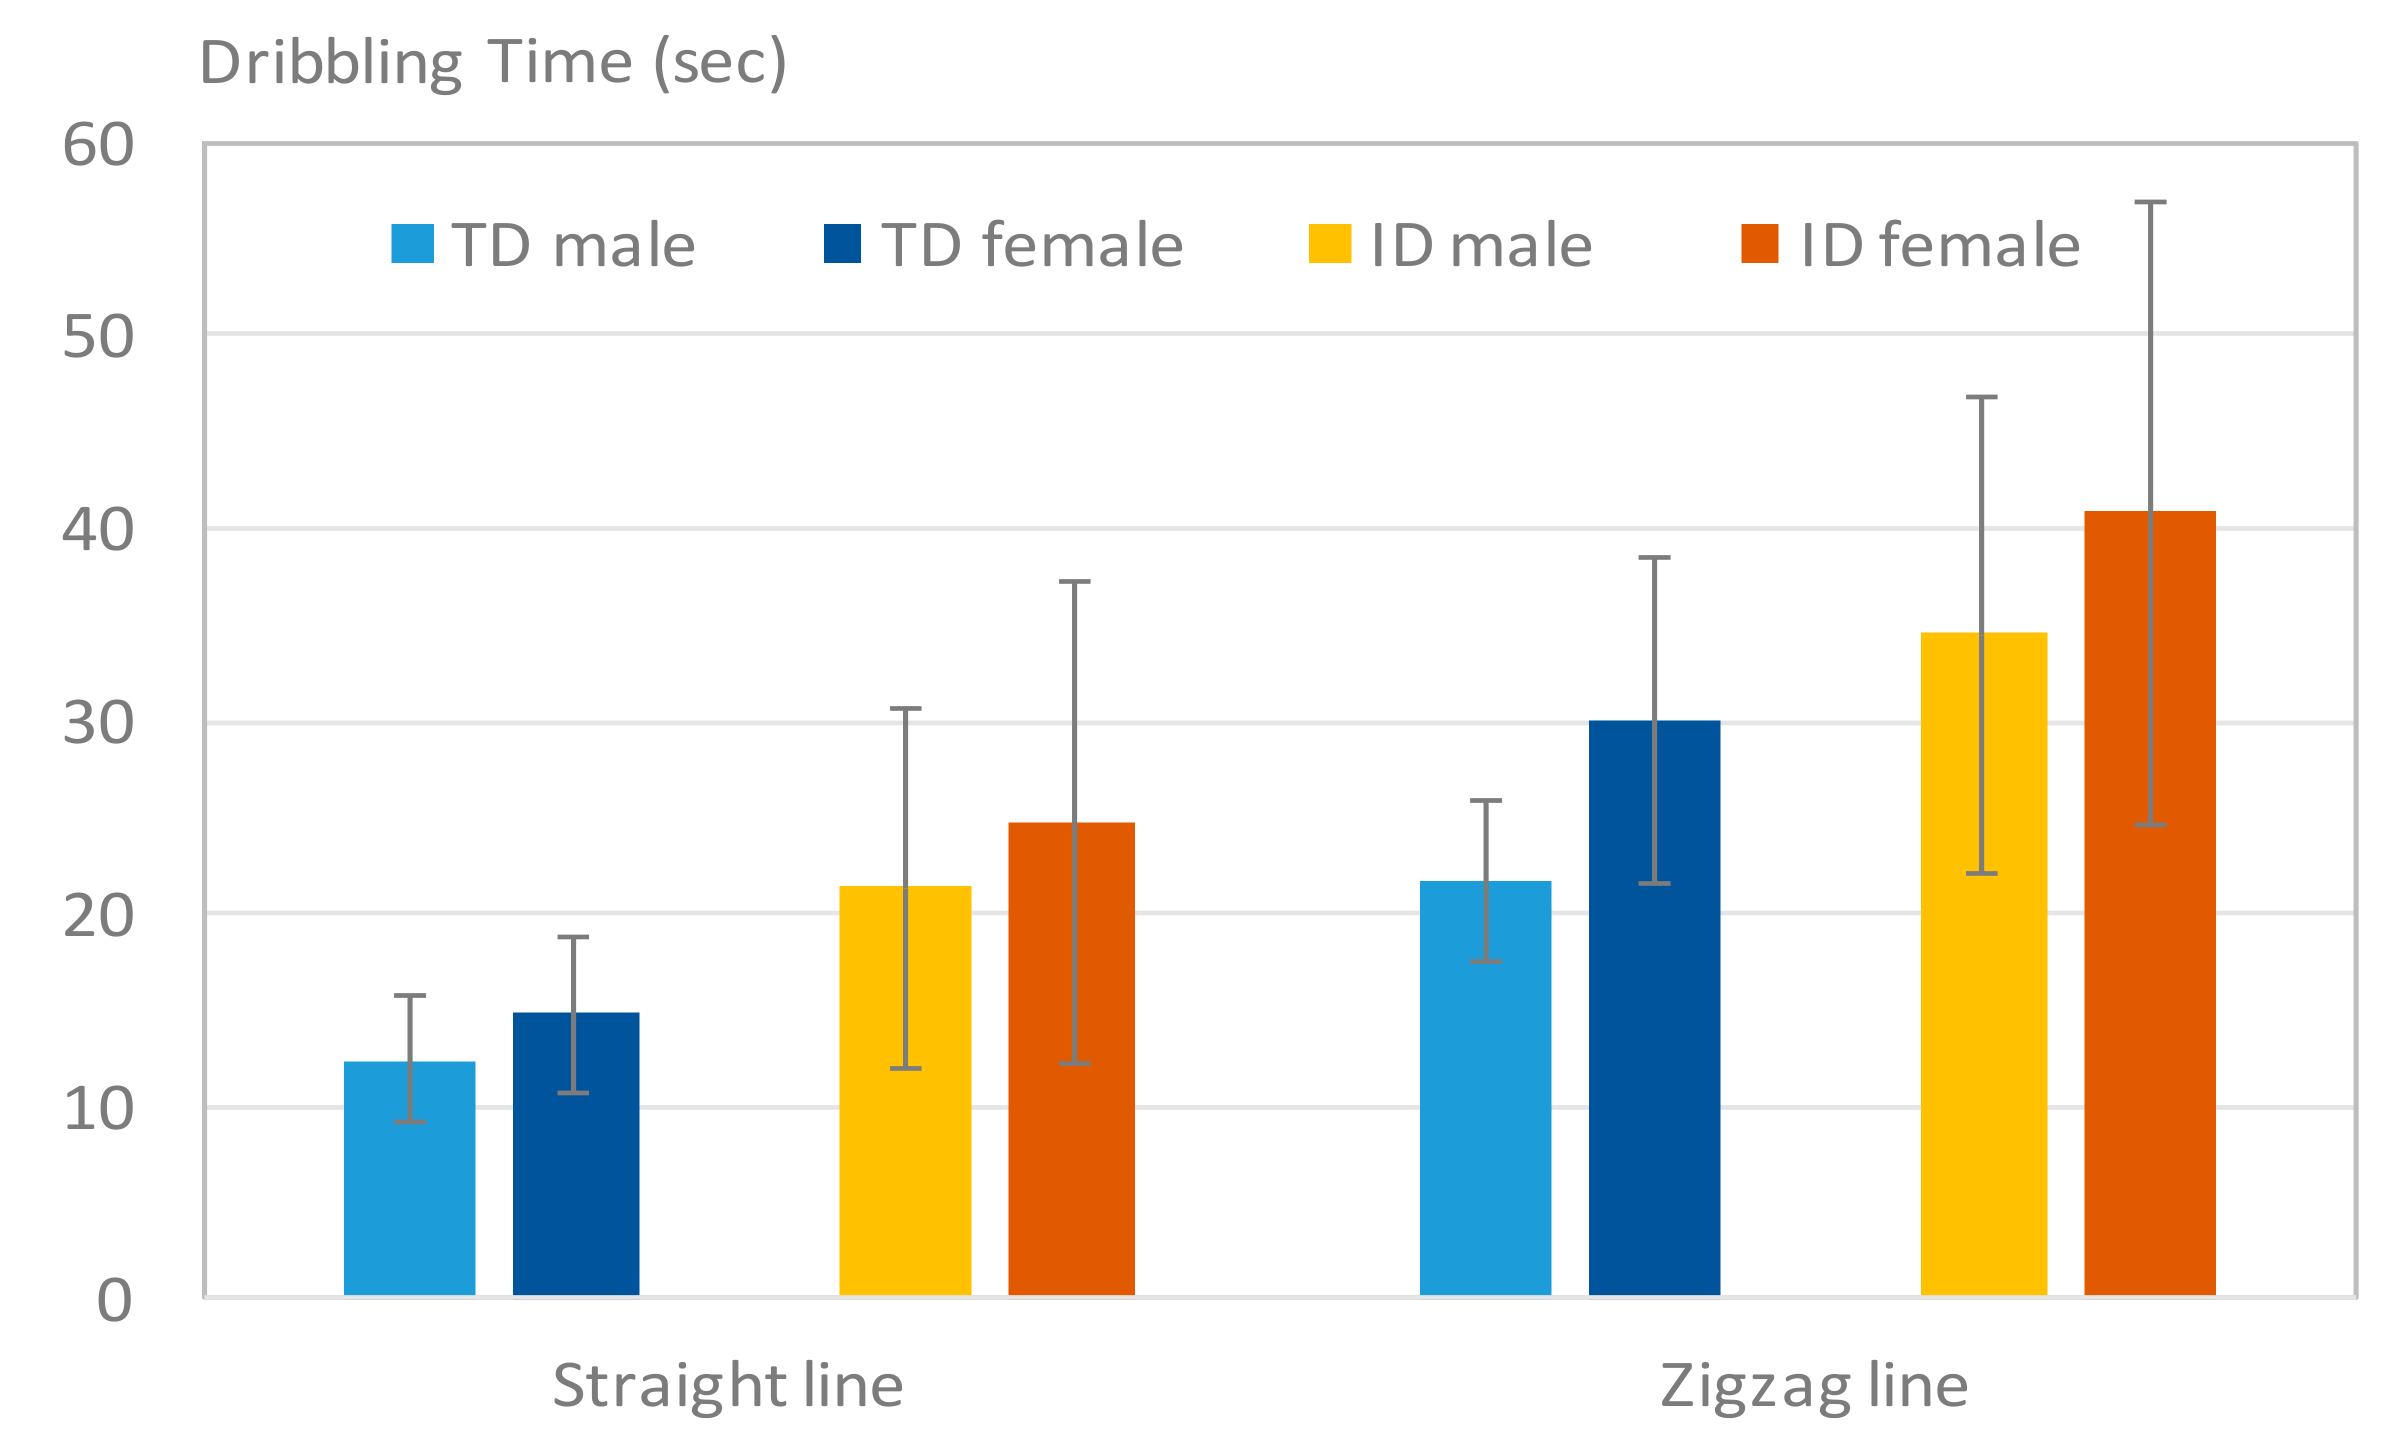
- Total Dribbling Time
4.3. Limbs and Trunk Performance
- A.
- Limb Swinging Frequency
- B.
- Limb Swinging Angle
- C.
- Trunk Tilt Angle
5. Discussion
6. Conclusions
Author Contributions
Funding
Conflicts of Interest
Abbreviations
| AAIDD | American Association of Intellectual and Developmental Disabilities |
| ID | Intellectual disability |
| TD | Typical developing |
| PDMS-2 | Peabody Developmental Motor Scales, Second Edition |
| PGMQS | Preschooler Gross Motor Quality Scale |
| PU | Polyurethane |
References
- Maulik, P.K.; Mascarenhas, M.N.; Mathers, C.D.; Dua, T.; Saxena, S. Prevalence of intellectual disability: A meta-analysis of population-based studies. Res. Dev. Disabil. 2011, 32, 419–436. [Google Scholar] [CrossRef]
- Carey, W.B.; Crocker, A.C.; Elias, E.R.; Feldman, H.M.; Coleman, W.L. Developmental-Behavioral Pediatrics E-Book; Elsevier Health Sciences: Amsterdam, The Netherlands, 2009. [Google Scholar]
- De Bildt, A.; Serra, M.; Luteijn, E.; Kraijer, D.; Sytema, S.; Minderaa, R. Social Skills in Children with Intellectual Disabilities with and without Autism. J. Intellect. Disabil. 2005, 49, 317–328. [Google Scholar] [CrossRef]
- Lee, K.J.; Lee, M.M.; Shin, D.C.; Shin, S.H.; Song, C.H. The effects of a balance exercise program for enhancement of gait function on temporal and spatial gait parameters in young people with intellectual disabilities. J. Phys. Ther. Sci. 2014, 26, 513–516. [Google Scholar] [CrossRef] [PubMed] [Green Version]
- Almuhtaseb, S.; Oppewal, A.; Hilgenkamp, T.I. Gait characteristics in individuals with intellectual disabilities: A literature review. Res. Dev. Disabil. 2014, 35, 2858–2883. [Google Scholar] [CrossRef] [PubMed]
- Sparrow, W.A.; Shinkfield, A.J.; Summers, J.J. Gait characteristics in individuals with mental retardation: Unobstructed level-walking, negotiating obstacles, and stair climbing. Hum. Mov. Sci. 1998, 17, 167–187. [Google Scholar] [CrossRef]
- Iosa, M.; Morelli, D.; Nisi, E.; Sorbara, C.; Negrini, S.; Gentili, P.; Paolucci, S.; Fusco, A. Assessment of upper body accelerations in young adults with intellectual disabilities while walking, running, and dual-task running. Hum. Mov. Sci. 2014, 34, 187–195. [Google Scholar] [CrossRef]
- Lin, H.C.; Wuang, Y.P. Strength and agility training in adolescents with Down syndrome: A randomized controlled trial. Res. Dev. Disabil. 2012, 33, 2236–2244. [Google Scholar] [CrossRef]
- Kavanagh, J.; Menz, H.B. Accelerometry: A technique for quantifying movement patterns during walking. Gait Posture 2008, 28, 1–15. [Google Scholar] [CrossRef]
- Shieh, W.Y.; Ju, Y.Y.; Yu, Y.C.; Lin, C.K.; Lin, Y.T.; Cheng, H.-Y. Stair-Walking Performance in Adolescents with Intellectual Disabilities. Sensors 2016, 16, 1066. [Google Scholar] [CrossRef] [Green Version]
- Carmeli, E.; Bar-Chad, S.; Lotan, M.; Merrick, J.; Coleman, R. Five clinical tests to assess balance following ball exercises and treadmill training in adult persons with intellectual disability. J. Gerontol. 2003, 58, M767–M772. [Google Scholar] [CrossRef]
- Cantó, E.; Soto, J.; García, P.; Guillamón, A.; Miñarro, P.; Villalba, F. The relationship between segmental coordination, agility and physical activity in adolescents. Motriz Revista Educação Física 2015, 21, 200–206. [Google Scholar] [CrossRef] [Green Version]
- Hayakawa, K.; Kobayashi, K. Physical and Motor Skill Training for Children with Intellectual Disabilities. Percept. Mot. Ski. 2011, 112, 573–580. [Google Scholar] [CrossRef]
- Pearson Assessments. 2020. Available online: https://www.pearsonassessments.com (accessed on 22 September 2020).
- Sun, S.-H.; Zhu, Y.-C.; Shih, C.-L.; Lin, C.-H.; Wu, S.-K. Development and initial validation of the Preschooler Gross Motor Quality Scale. Res. Dev. Disabil. 2010, 31, 1187–1196. [Google Scholar] [CrossRef] [PubMed]
- Cleland, I.; Kikhia, B.; Nugent, C.; Boytsov, S.; Hallberg, J.; Synnes, K.; McClean, S.; Finlay, D. Optimal placement of accelerometers for the detection of everyday Activities. Sensors 2013, 13, 9183–9200. [Google Scholar] [CrossRef] [PubMed] [Green Version]
- Böhm, H.; Döderlein, L. Gait asymmetries in children with cerebral palsy: Do they deteriorate with running. Gait Posture 2012, 35, 322–327. [Google Scholar] [CrossRef]
- Llorach, G.; Evans, A.; Agenjo, J.; Blat, J. Position estimation with a low-cost Inertial Measurement Unit. In Proceedings of the 9th Iberian Conference on IEEE Information Systems and Technologies, Barcelona, Spain, 18–21 June 2014; pp. 1–4. [Google Scholar]
- Rampp, A.; Barth, J.; Schuelein, S.; Gassmann, K.-G.; Klucken, J.; Eskofier, B.M. Inertial sensor based stride parameter calculation from gait sequences in geriatric patients. IEEE Trans. Biomed. Eng. 2014, 62, 1089–1097. [Google Scholar] [CrossRef]
- Guerra-Filho, G. Optical Motion Capture: Theory and Implementation. RITA 2005, 12, 61–90. [Google Scholar]
- Haynes, C.A.; Lockhart, T.E. Evaluation of gait and slip parameters for adults with intellectual disability. Biomechanics 2012, 45, 2337–2341. [Google Scholar] [CrossRef] [PubMed] [Green Version]
- Carmeli, E.; Imam, B.; Merrick, J. The relationship of pre-sarcopenia (low muscle mass) and sarcopenia (loss of muscle strength) with functional decline in individuals with intellectual disability (ID). Arch. Gerontol. Geriatr. 2013, 55, 181–185. [Google Scholar] [CrossRef]
- Ijmker, T.; Lamoth, C.J.C. Gait and cognition: The relationship between gait stability and variability with executive function in persons with and without dementia. Gait Posture 2012, 35, 126–130. [Google Scholar] [CrossRef]
- Hinckson, E.A.; Curtis, A. Measuring physical activity in children and youth living with intellectual disabilities: A systematic review. Res. Dev. Disabil. 2013, 34, 72–86. [Google Scholar] [CrossRef]
- Porta, J.P.; Acosta, D.J.; Lehker, A.N.; Miller, S.T.; Tomaka, J.; King, G.A. Validating the Adidas miCoach for estimating pace, distance, and energy expenditure during outdoor over-ground exercise accelerometer. Int. J. Exerc. Sci. Conf. Proc. 2012, 2, 23. [Google Scholar]
- Kresta, J. Selected quality indicators measuring locomotor activity apparatus Adidas miCoach Pacer. J. Outdoor Act. 2013, 7, 26–32. [Google Scholar]
- InvenSense Inc. Available online: https://invensense.tdk.com/wp-content/uploads/2015/02/MPU-6000-Datasheet1.pdf (accessed on 22 September 2020).
- Vicon. Available online: https://www.vicon.com (accessed on 22 September 2020).
- Metni, N.; Pflimlin, J.-M.; Hamel, T.; Souères, P. Attitude and gyro bias estimation for a VTOL UAV. Control. Eng. Pract. 2006, 14, 1511–1520. [Google Scholar] [CrossRef]
- Sabatini, A.M. Estimating three-dimensional orientation of human body parts by inertial/magnetic sensing. Sensors 2011, 11, 1489–1525. [Google Scholar] [CrossRef] [PubMed] [Green Version]


| Requirement | Optical Motion Capture System | Wearable Sensors | Proposed Smart Ball |
|---|---|---|---|
| Motion tracking | Applicable | Applicable | Partially applicable |
| Locomotor performance | Partially applicable | Partially applicable | Applicable |
| Cognitive ability | Inapplicable | Inapplicable | Applicable |
| Complexity | High | Medium to low | Low |
| Cost | $10,000–$20,000 | $1000–$10,000 | $1000–$2000 |
| Group | Total | Age (Mean ± “SD”) | Gender | Number | Age (Mean ± “SD”) |
|---|---|---|---|---|---|
| ID | 25 | 18.36 ± 2.46 | Male | 15 | 18.00 ± 2.56 |
| Female | 10 | 18.90 ± 2.33 | |||
| TD | 25 | 18.36 ± 0.49 | Male | 11 | 18.55 ± 0.52 |
| Female | 14 | 18.21 ± 0.43 |
| Sensors | Parameter | Type |
|---|---|---|
| gyroscope | Voltage (VDD) | 1.8 V, 5 V |
| Full-Scale Range | ±250 °/s, ±500 °/s, ±1000 °/s, ±2000 °/s | |
| ADC Word Length | 16 bits | |
| Nonlinearity | Best fit straight line, 25 °C | |
| Frequencies (x, y, z) | 33 KHz, 30 KHz, 27 KHz | |
| Start-up time | 30 ms | |
| accelerometer | Voltage (VDD) | 1.8 V, 5 V |
| Full-Scale Range | ±2 g, ±4 g, ±8 g, ±16 g | |
| ADC Word Length | 16 bits | |
| Nonlinearity | Best fit straight line; 25 °C | |
| Initial Calibration Tolerance (x, y, z) | ±50 mg, ±80 mg, ±35 mg | |
| Start-up time | 30 ms |
| Sensor | Tracker (°) | Vicon (°) | Error (%) | Tracker (°) | Vicon (°) | Error (%) |
|---|---|---|---|---|---|---|
| arm | 93.41 | 90 | 3.8 | 185.65 | 180 | 3.1 |
| thigh | 92.98 | 90 | 3.3 | 185.34 | 180 | 2.9 |
| calf | 92.72 | 90 | 3.0 | 185.46 | 180 | 3.0 |
| back_trunk | 93.71 | 90 | 4.1 | 186.12 | 180 | 3.4 |
| Mean | 93.21 | 90 | 3.6 | 185.64 | 180 | 3.1 |
| Parameter | Smart Ball | Vicon | Error Rate |
|---|---|---|---|
| Reaction time | 3.57 (s) | 3.45 (s) | 3.1 (%) |
| Throwing height | 1.16 (m) | 1.14 (m) | 2.9 (%) |
| Throwing-and-catching rate (success/total) | 29/60 | 30/60 | 1.6 (%) |
| Dribbling distance (5 m) | 5.13 (m) | – | 2.60 (%) |
| Dribbling distance (10 m) | 10.37 (m) | – | 3.70 (%) |
| Dribbling distance (15 m) | 15.17 (m) | – | 1.12 (%) |
| Test | TD Mean ± SD (s) | ID Mean ± SD (s) | p-Value |
|---|---|---|---|
| Picking-up-the-ball | 1.11 ± 0.26 | 1.31 ± 0.36 | 0.032 * |
| Dribbling (Straight-line) | 1.44 ± 0.42 | 1.16 ± 0.69 | 0.079 |
| Dribbling (Zigzag) | 1.11 ± 0.22 | 0.92 ± 0.66 | 0.185 |
| Test | TD Mean ± SD (s) | ID Mean ± SD (s) | p-Value |
|---|---|---|---|
| Throwing-and-catching | 84.0 ± 3.74 | 46.8 ± 3.59 | 0.001 * |
| TD Mean ± SD (s) | ID Mean ± SD (s) | p-Value | |
|---|---|---|---|
| Dribbling (Straight-line) | 12.59 ± 0.73 | 14.70 ± 3.24 | 0.001 * |
| Dribbling (Zigzag-line) | 16.62 ± 0.85 | 19.76 ± 4.71 | 0.002 * |
| Test | TD Mean ± SD (s) | ID (sec) Mean ± SD (s) | p-Value |
|---|---|---|---|
| Dribbling (Straight-line) | 13.74 ± 3.88 | 22.72 ± 10.60 | 0.000 * |
| Dribbling (Zigzag-line) | 26.35 ± 7.96 | 37.01 ± 14.05 | 0.002 * |
| Arm | Thigh | Calf | |||||||
|---|---|---|---|---|---|---|---|---|---|
| Test | TD M ± SD | ID M ± SD | p | TD M ± SD | ID M ± SD | p | TD M ± SD | ID M ± SD | p |
| Straight Dribbling | 101.25 ± 16.95 | 90.20 ± 25.40 | 0.077 | 122.76 ± 22.49 | 103.94 ± 23.69 | 0.006 * | 119.37 ± 22.19 | 105.10 ± 21.14 | 0.024 * |
| Zigzag Dribbling | 86.23 ± 20.14 | 86.26 ± 17.16 | 0.898 | 104.56 ± 18.28 | 95.63 ± 18.68 | 0.094 | 104.90 ± 22.46 | 99.36 ± 16.63 | 0.229 |
| Arm Swinging Angle | Thigh Swinging Angle | Calf Swinging Angle | |||||||
|---|---|---|---|---|---|---|---|---|---|
| Test | TD M ± SD | ID M ± SD | p | TD M ± SD | ID M ± SD | p | TD M ± SD | ID M ± SD | p |
| Straight Dribbling | 56.02 (±20.74) | 39.05 (±14.13) | 0.001 * | 49.03 (±7.82) | 45.27 (±7.73) | 0.094 | 87.14 (±15.06) | 75.35 (±16.87) | 0.012 * |
| Zigzag Dribbling | 41.97 (±11.87) | 35.68 (±8.55) | 0.037 * | 47.39 (±8.73) | 40.89 (±9.47) | 0.009 * | 71.07 (±13.38) | 61.88 (±10.12) | 0.009 * |
| Test | TD (sec) (Mean ± SD) | ID (sec) (Mean ± SD) | p-Value |
|---|---|---|---|
| Dribbling (Straight-line) | 26.77 ± 5.27 | 32.38 ± 8.81 | 0.009 * |
| Dribbling (Zigzag-line) | 44.05 ± 7.66 | 41.69 ± 8.95 | 0.322 |
© 2020 by the authors. Licensee MDPI, Basel, Switzerland. This article is an open access article distributed under the terms and conditions of the Creative Commons Attribution (CC BY) license (http://creativecommons.org/licenses/by/4.0/).
Share and Cite
Shieh, W.-Y.; Ju, Y.-Y.; Yu, Y.-C.; Pandelaki, S.; Cheng, H.-Y.K. Development of a Smart Ball to Evaluate Locomotor Performance: Application in Adolescents with Intellectual Disabilities. Sensors 2020, 20, 5444. https://doi.org/10.3390/s20185444
Shieh W-Y, Ju Y-Y, Yu Y-C, Pandelaki S, Cheng H-YK. Development of a Smart Ball to Evaluate Locomotor Performance: Application in Adolescents with Intellectual Disabilities. Sensors. 2020; 20(18):5444. https://doi.org/10.3390/s20185444
Chicago/Turabian StyleShieh, Wann-Yun, Yan-Ying Ju, Yu-Chun Yu, Steven Pandelaki, and Hsin-Yi Kathy Cheng. 2020. "Development of a Smart Ball to Evaluate Locomotor Performance: Application in Adolescents with Intellectual Disabilities" Sensors 20, no. 18: 5444. https://doi.org/10.3390/s20185444