Vibration-Based In-Situ Detection and Quantification of Delamination in Composite Plates

 , , ,
, , ,
Abstract
:1. Introduction
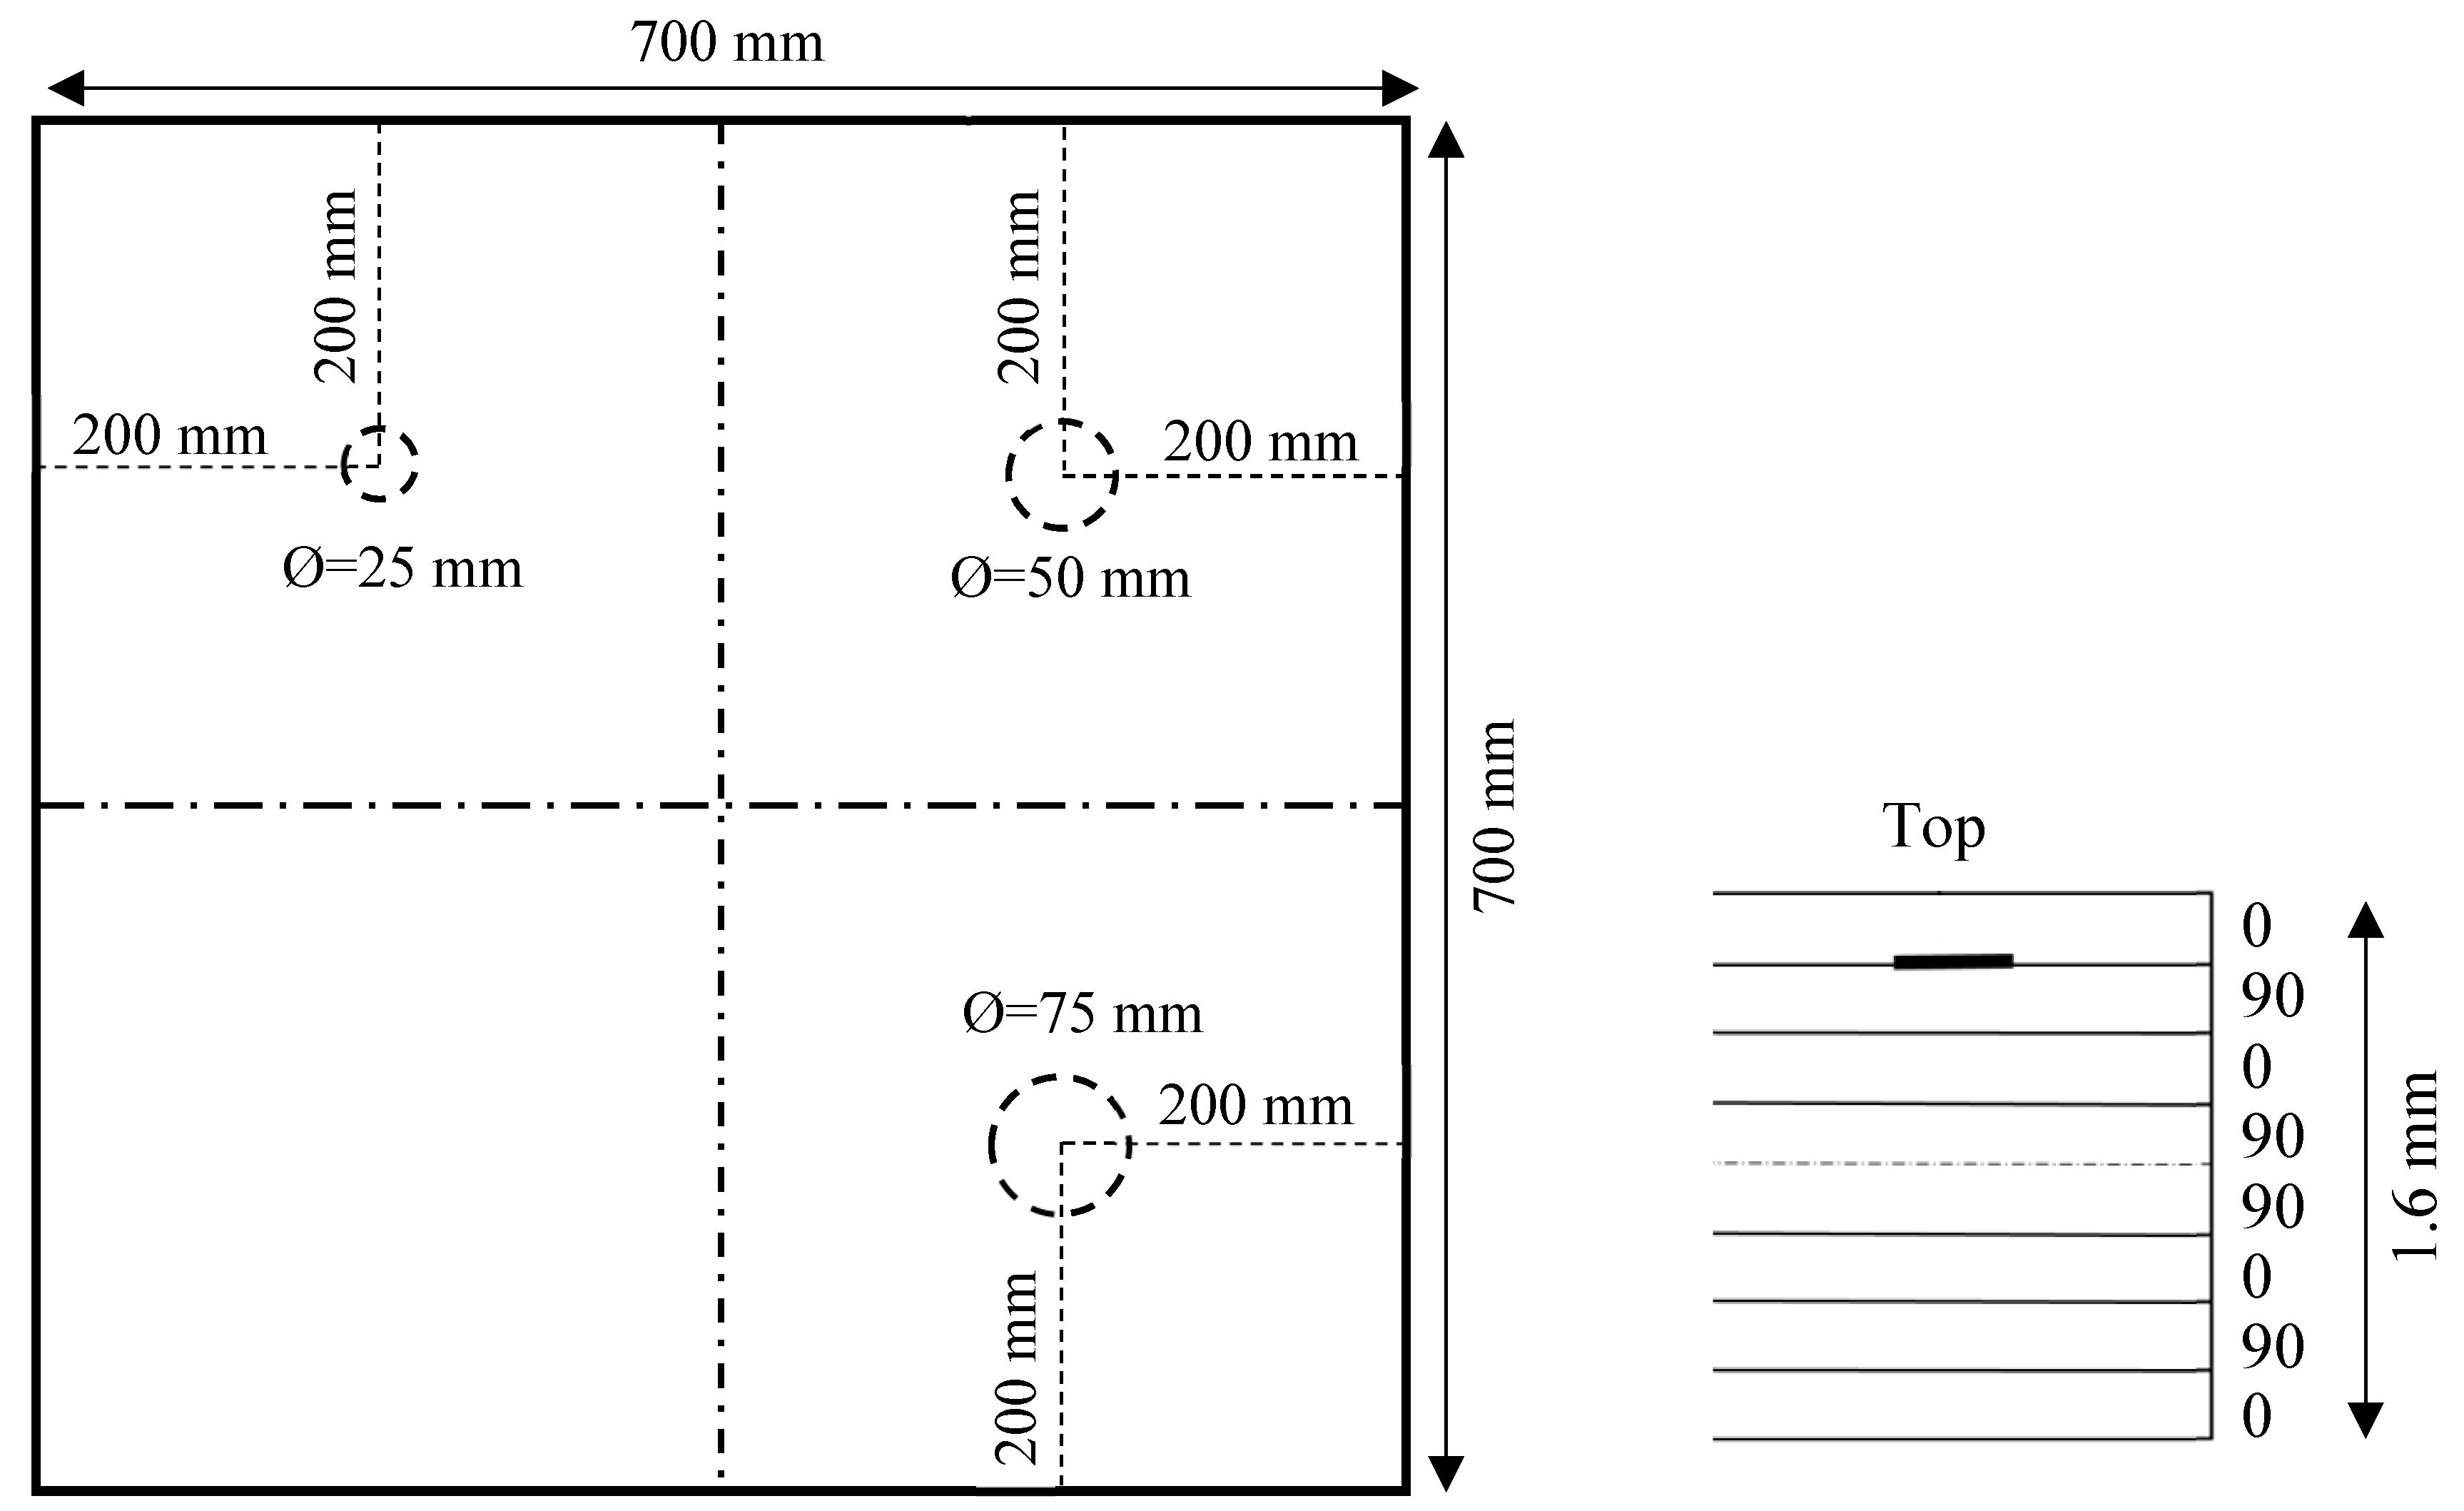
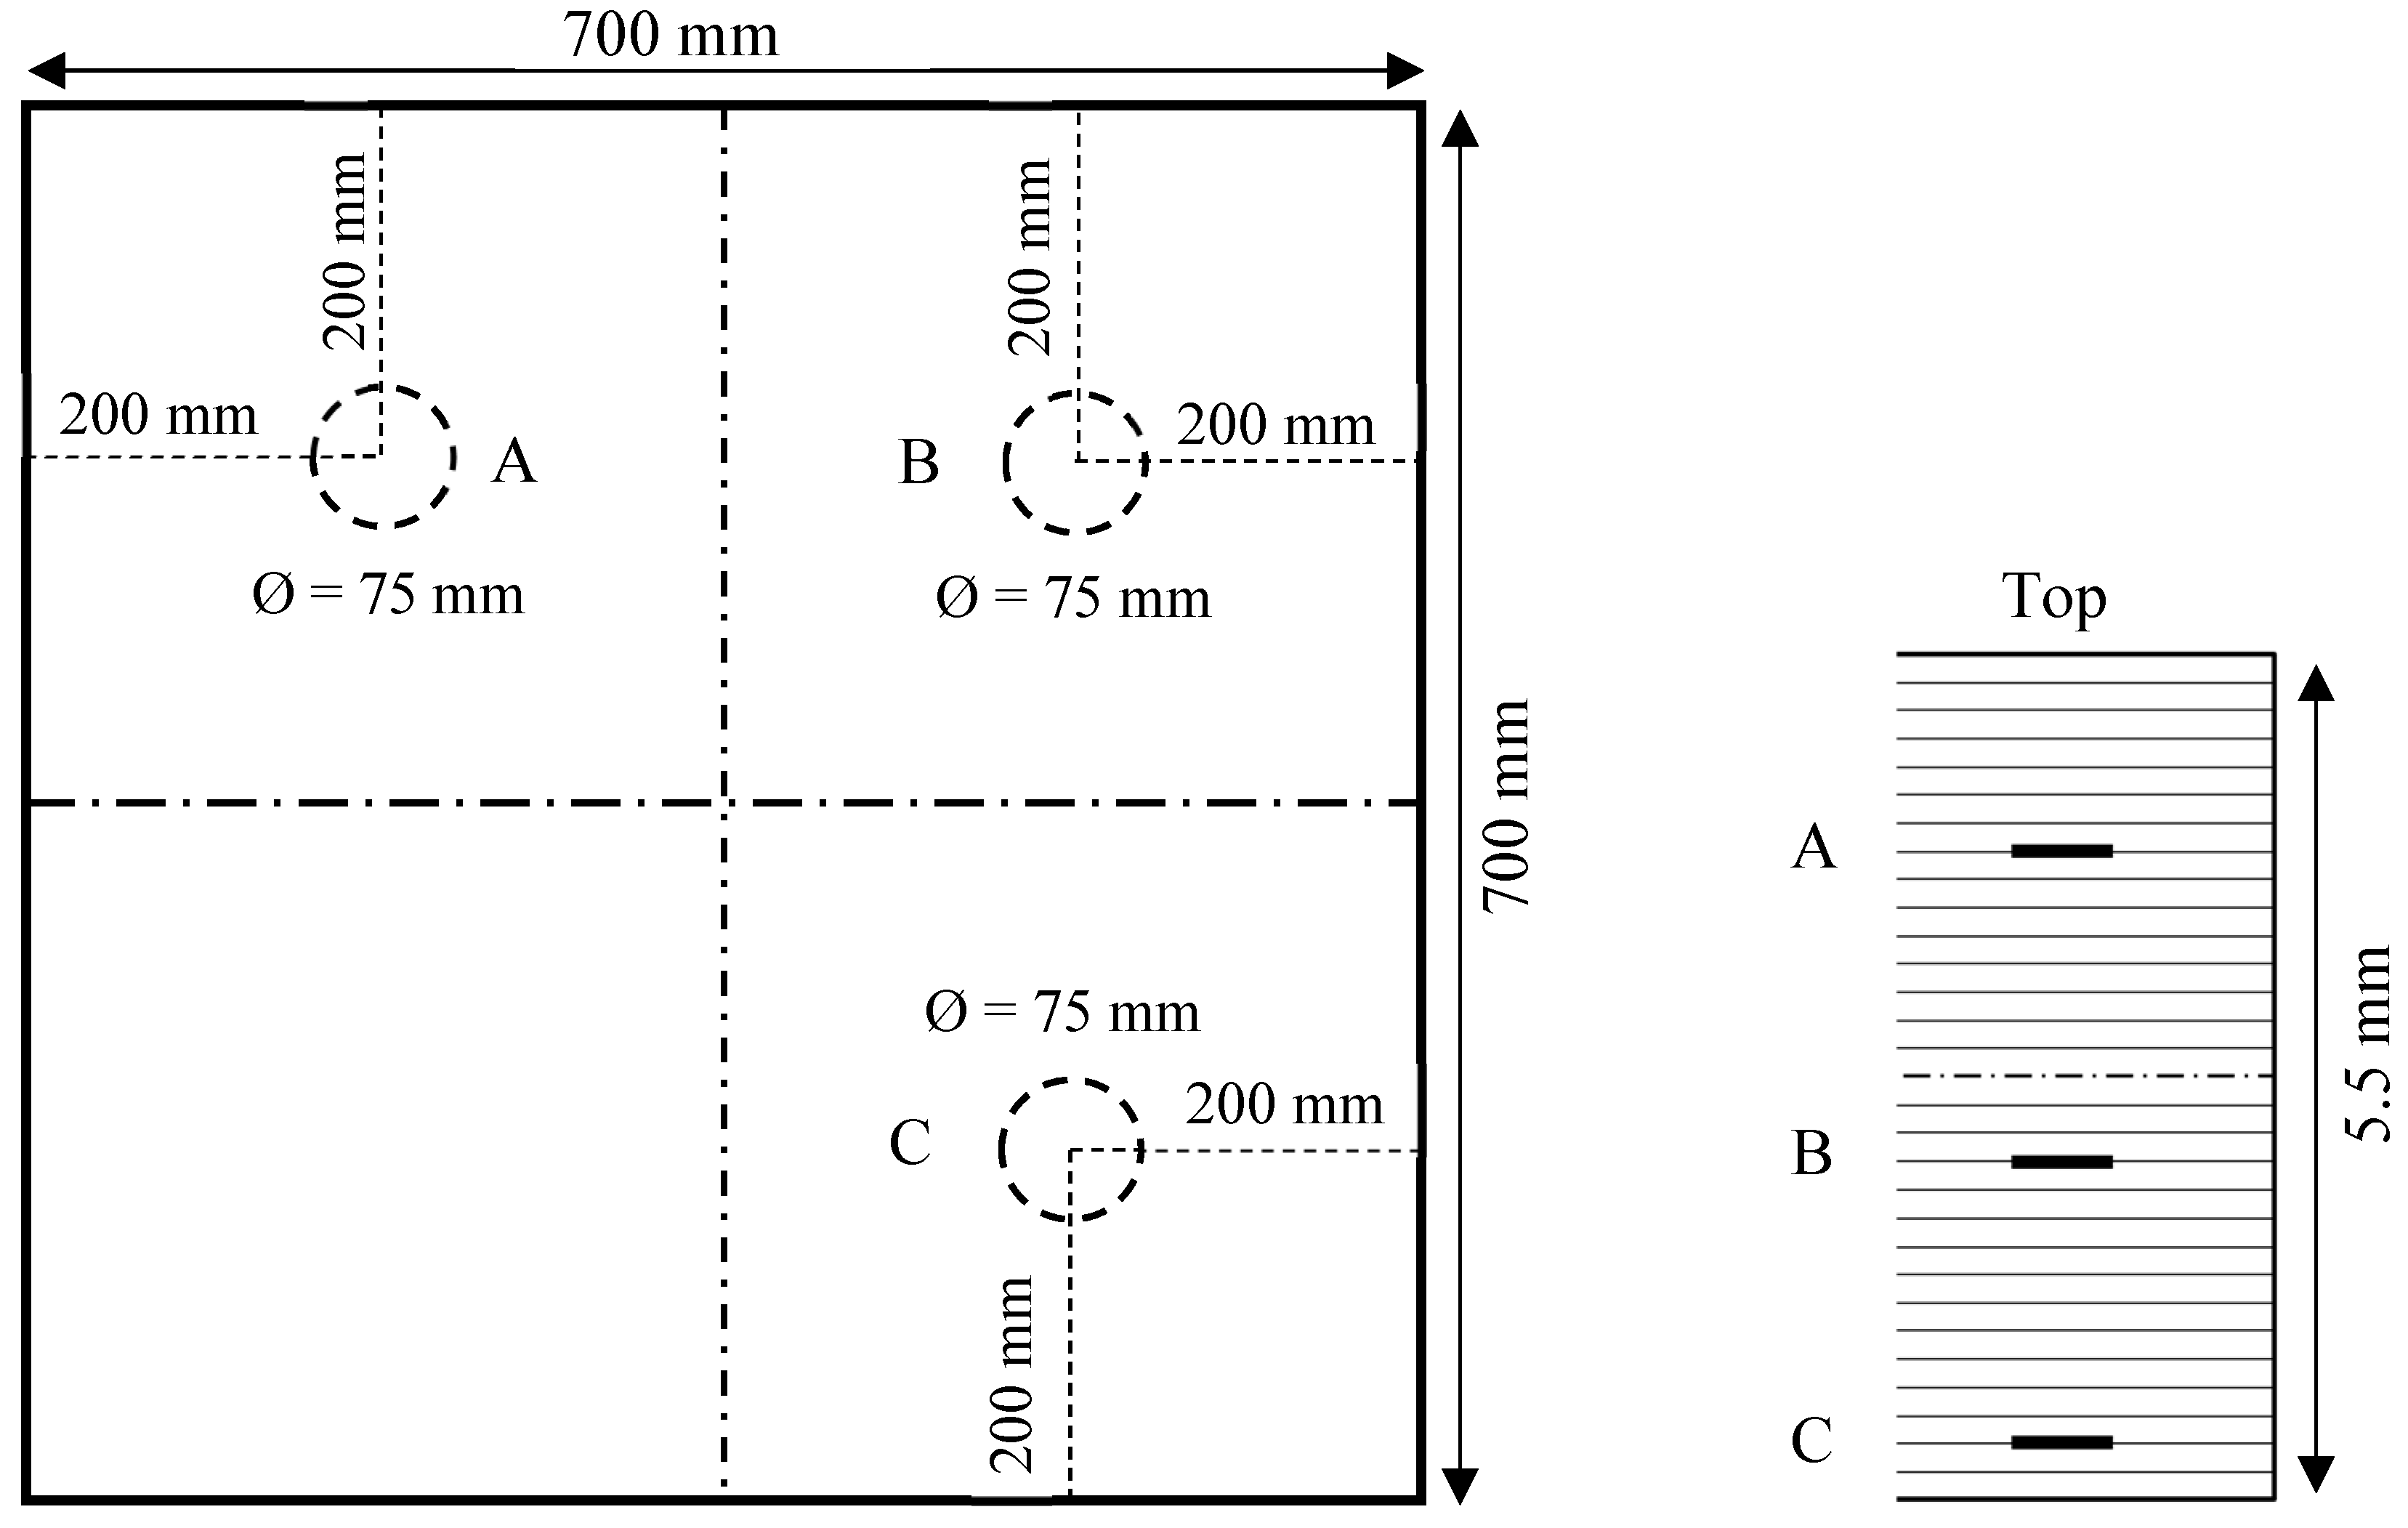
2. Composite Specimens
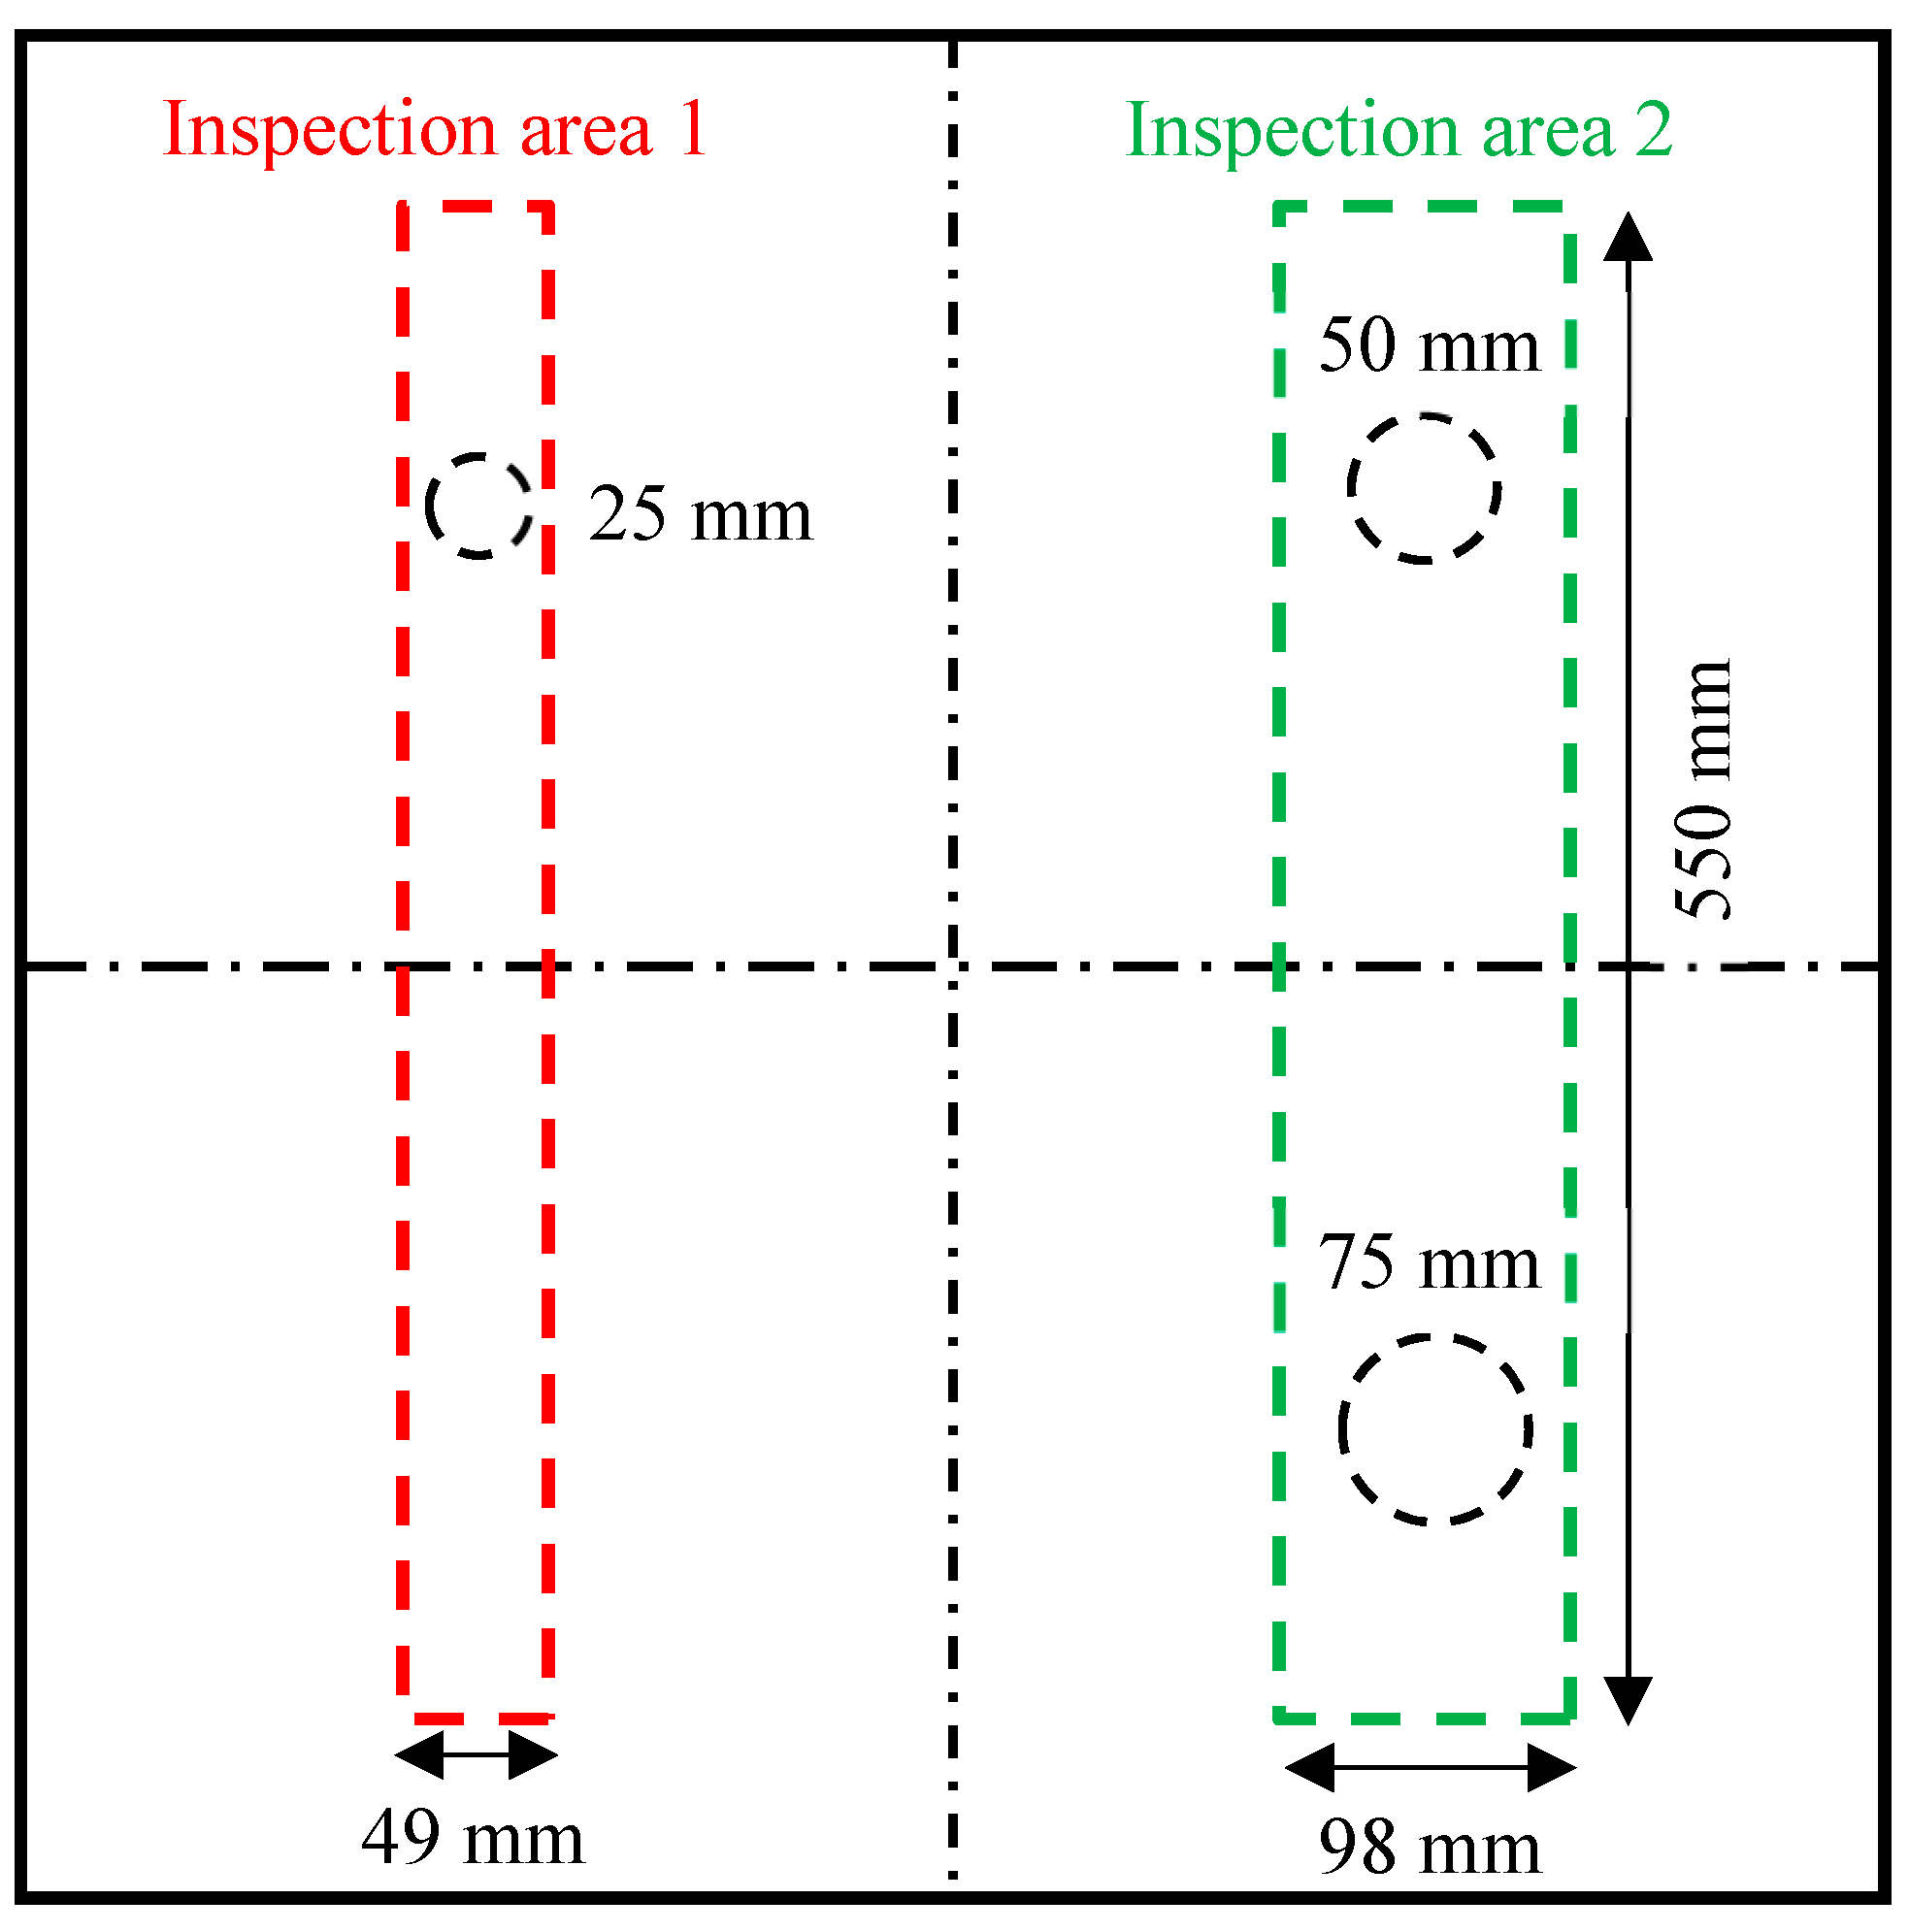
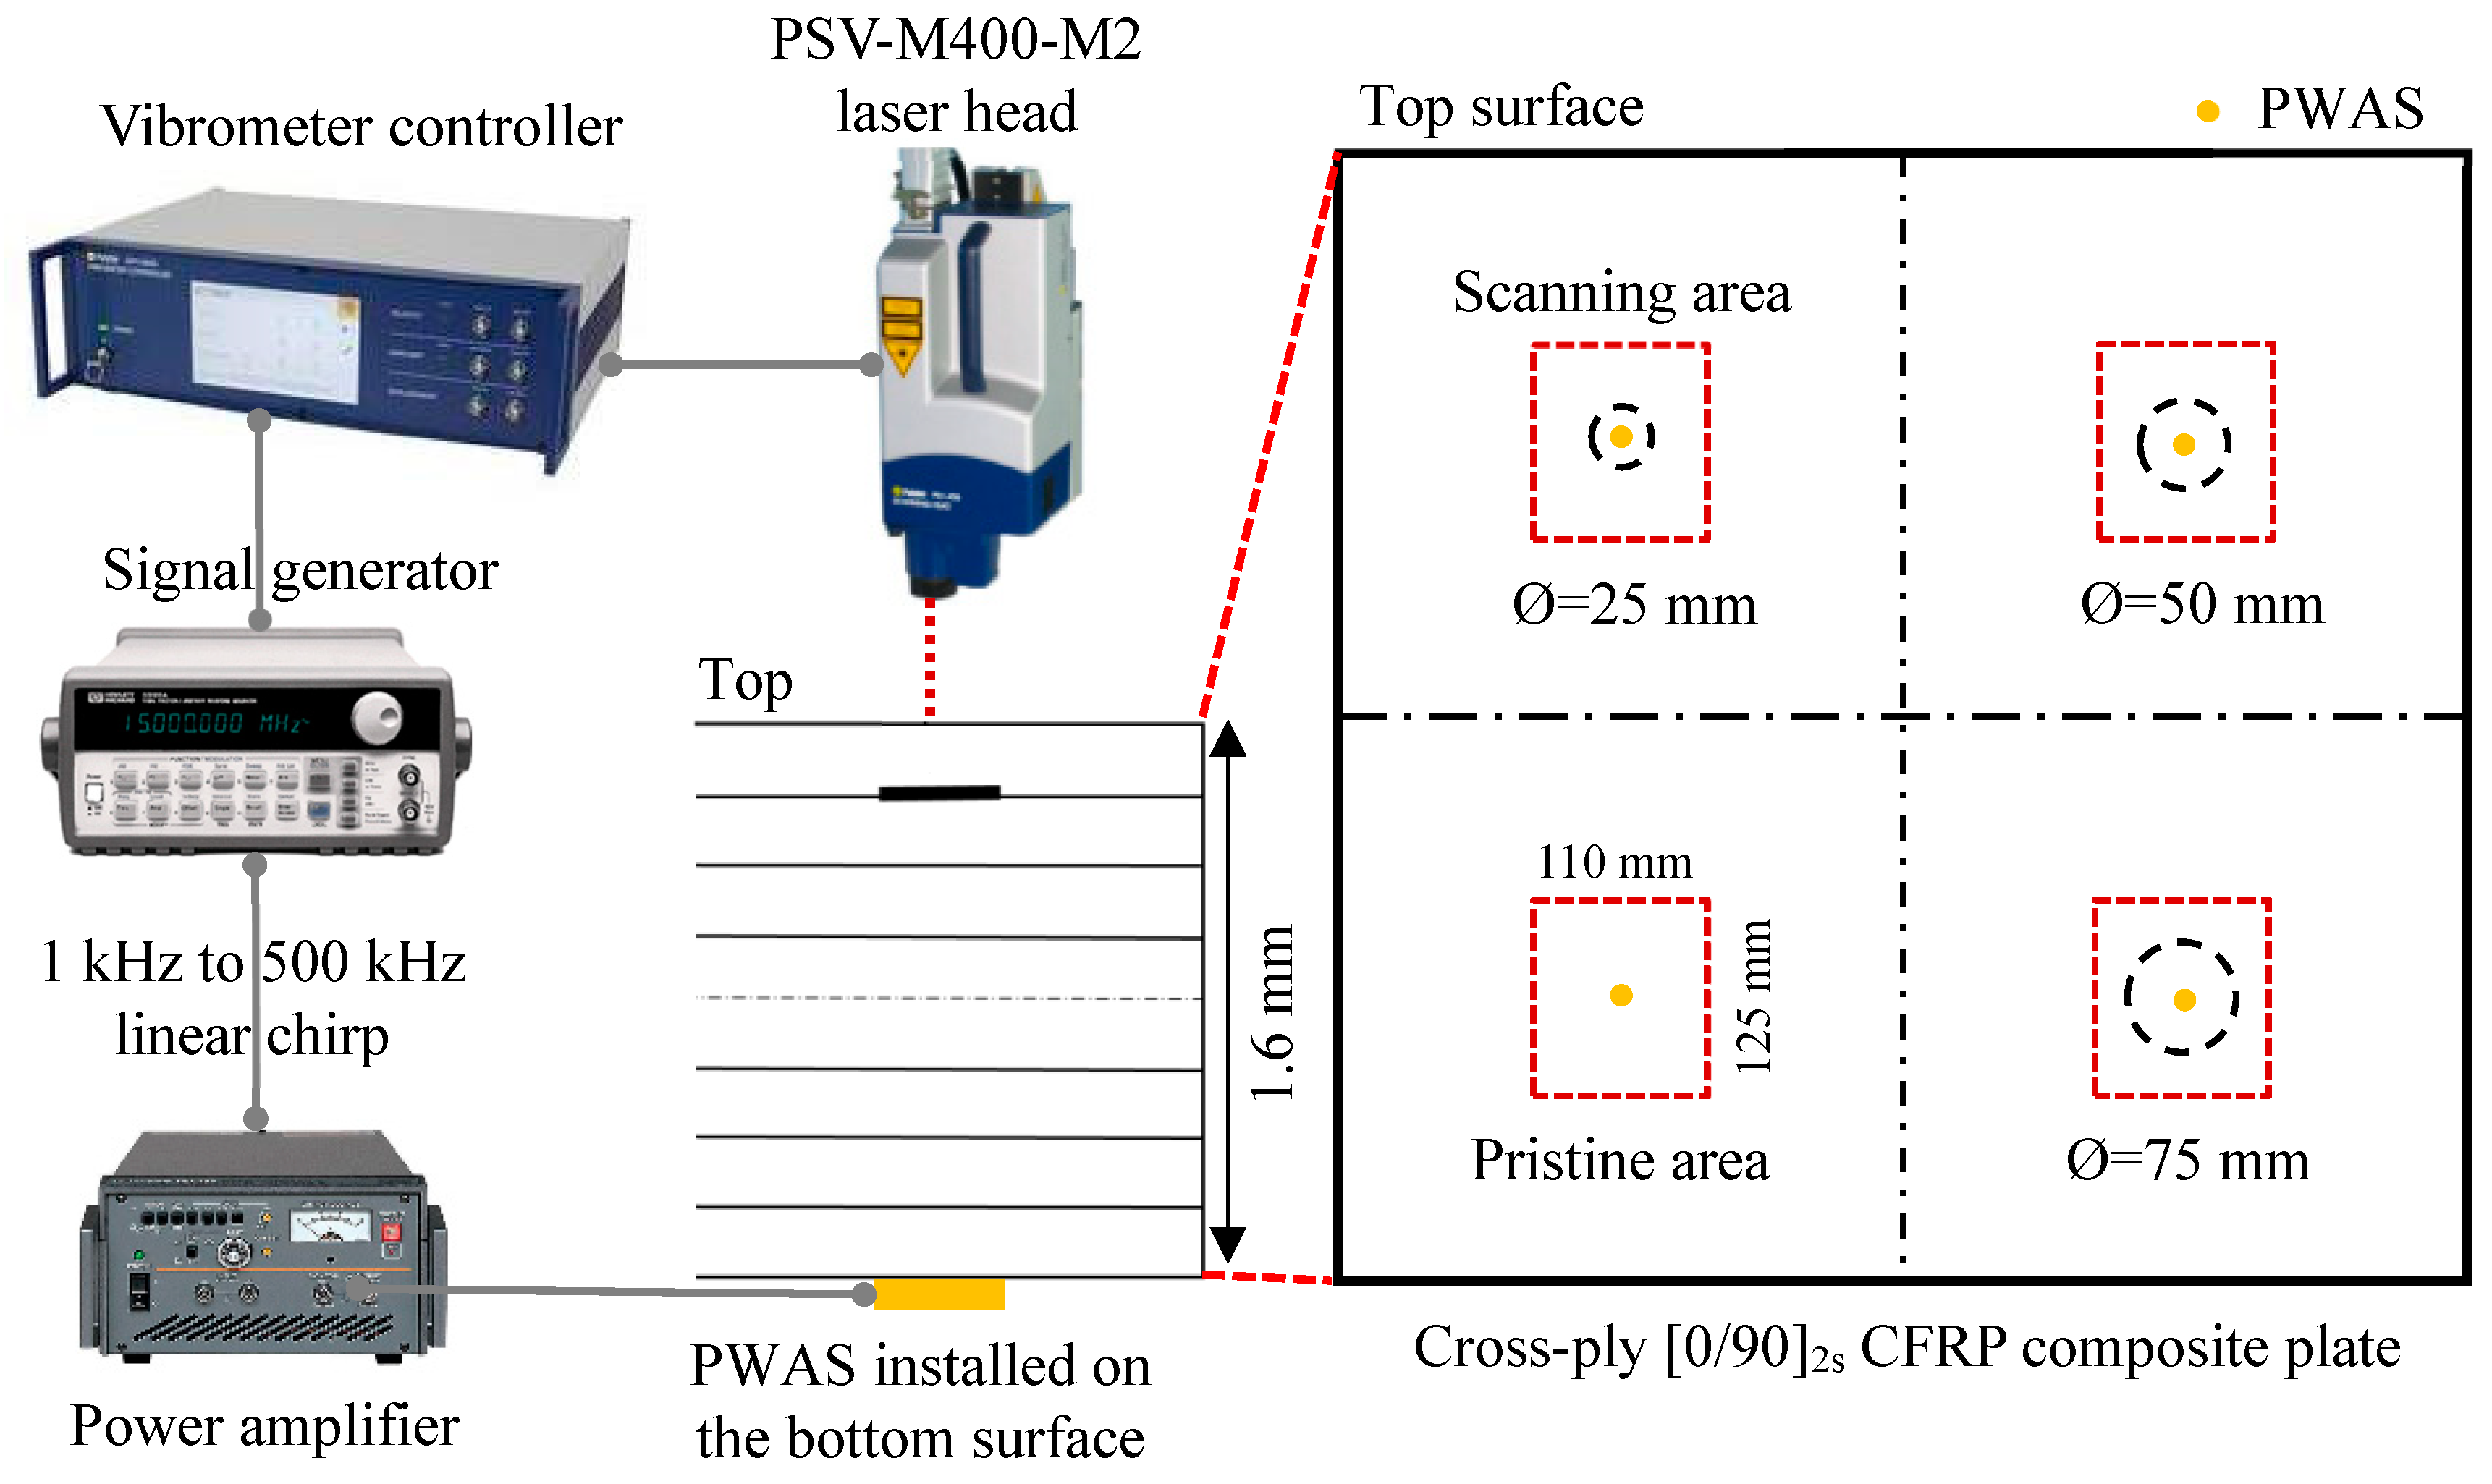
2.1. Cross-Ply Composite Plate
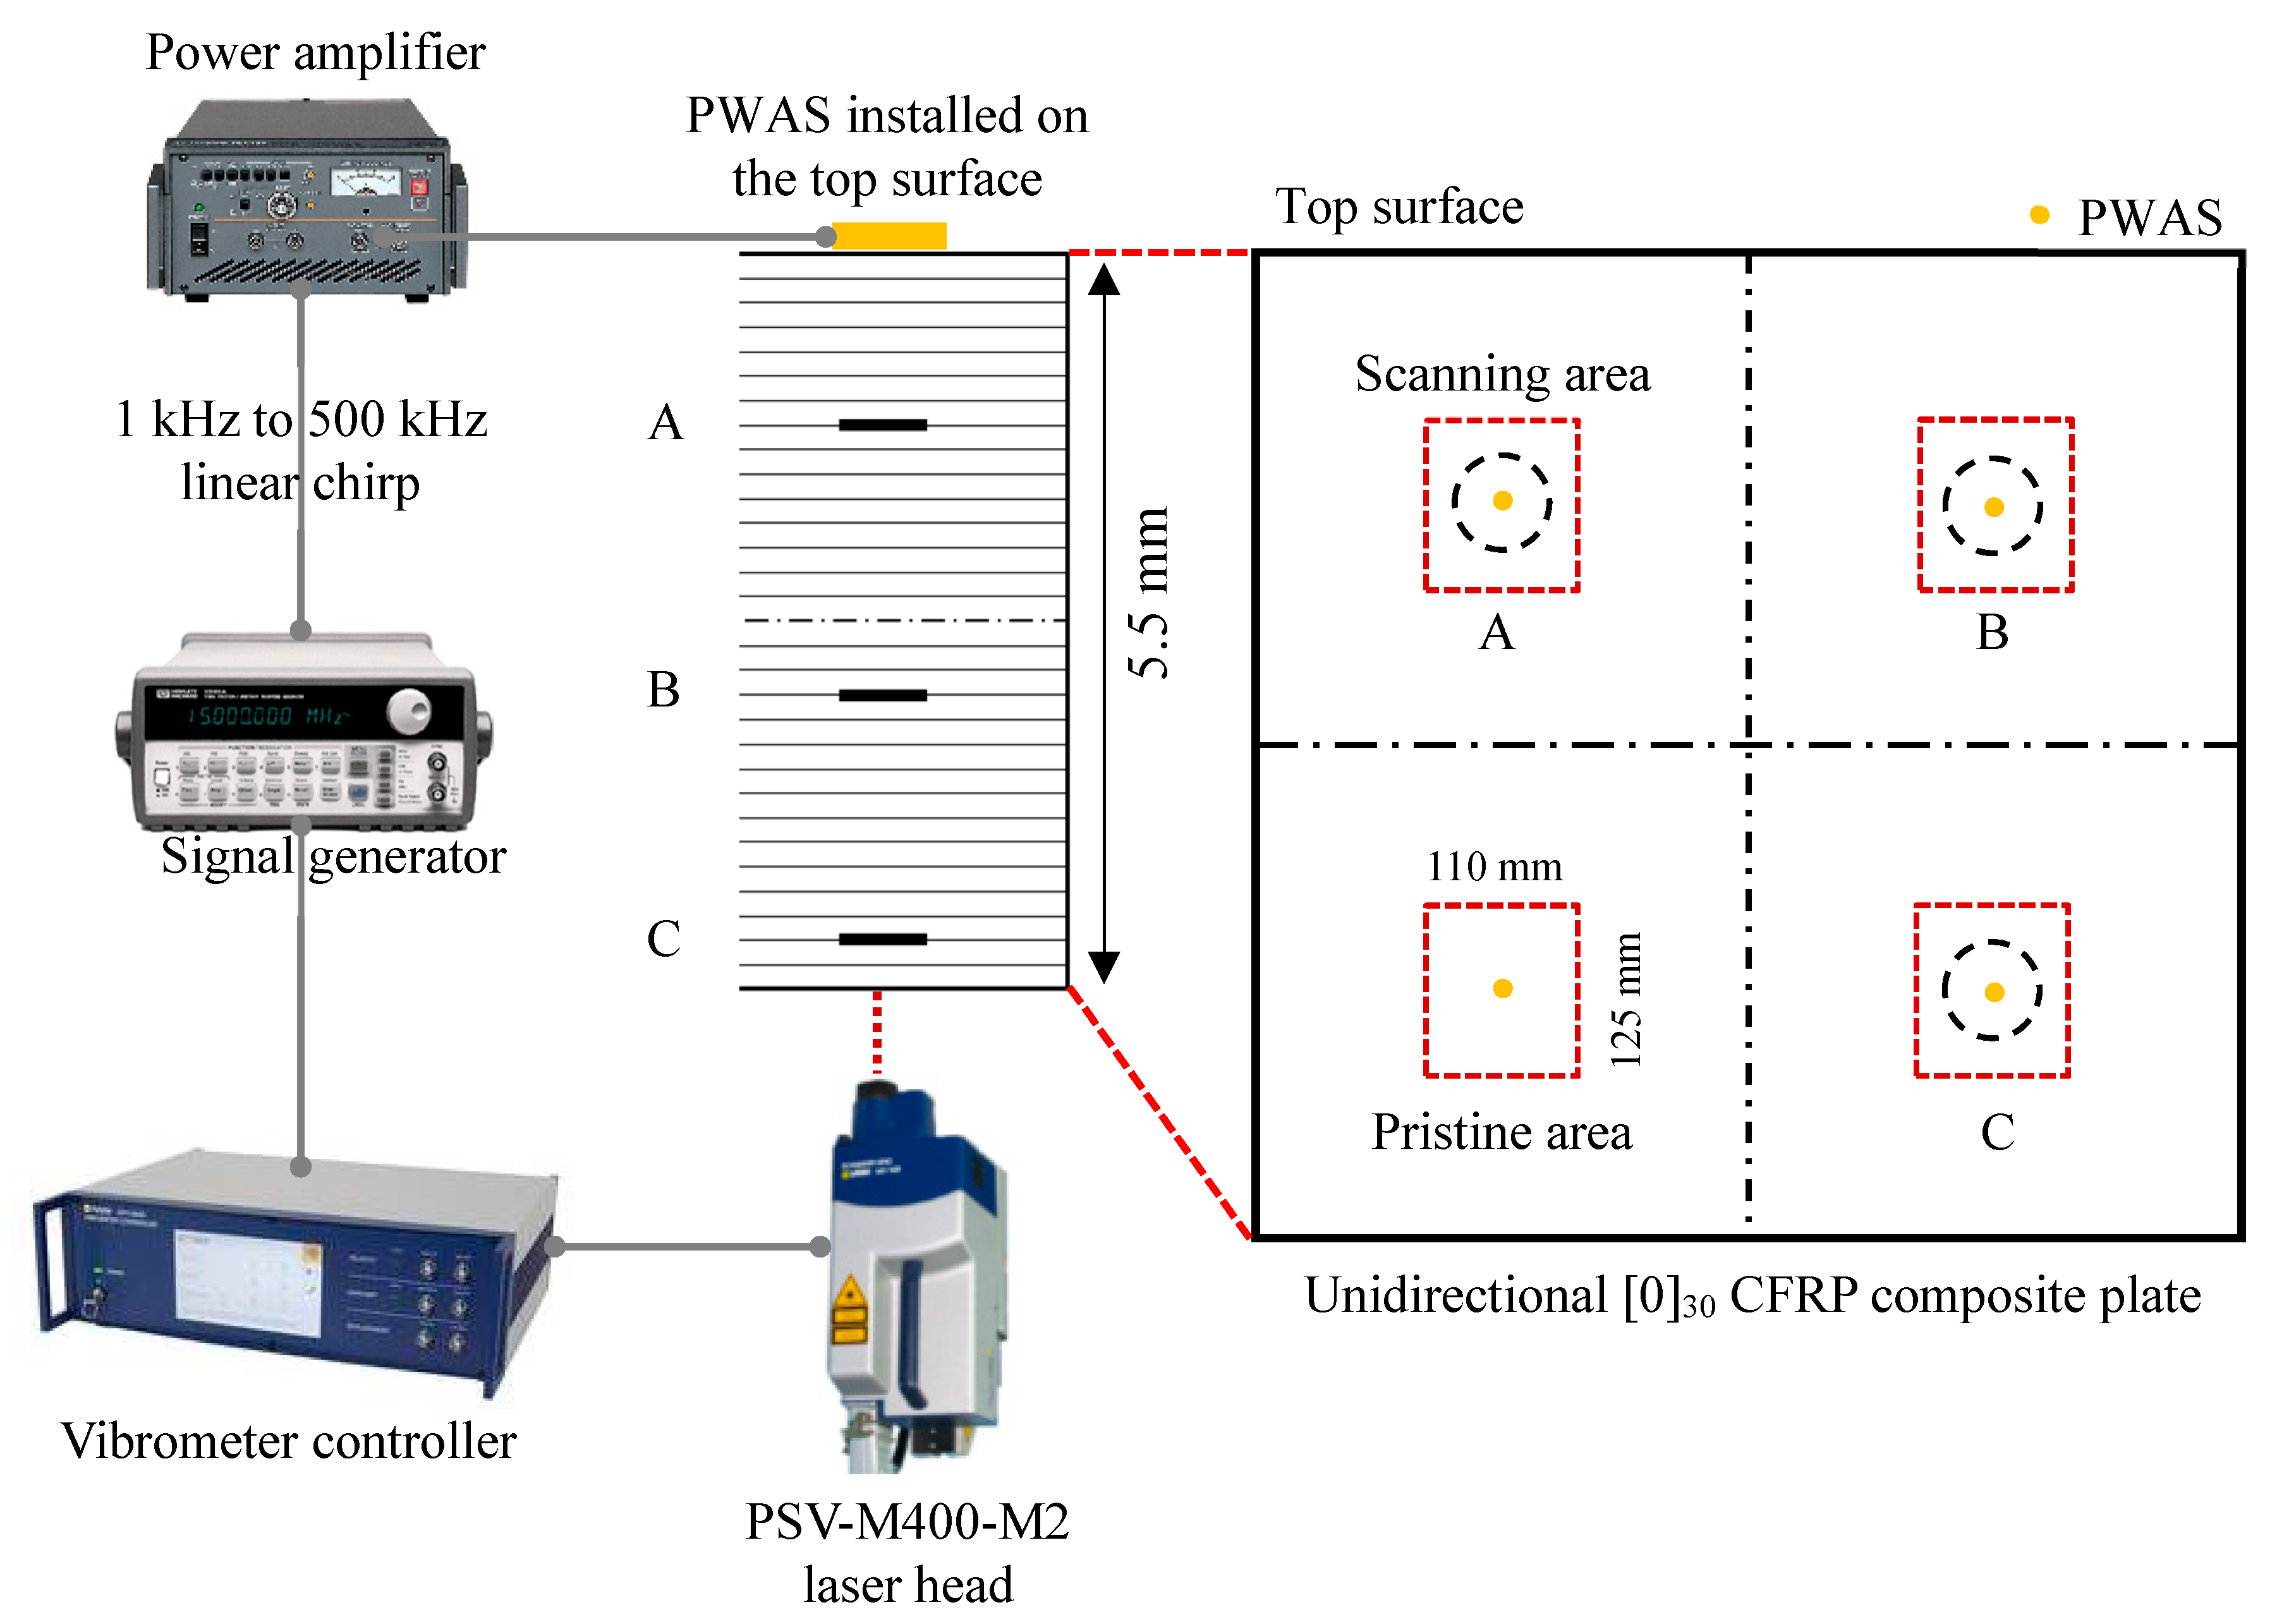
2.2. Unidirectional Composite Plate
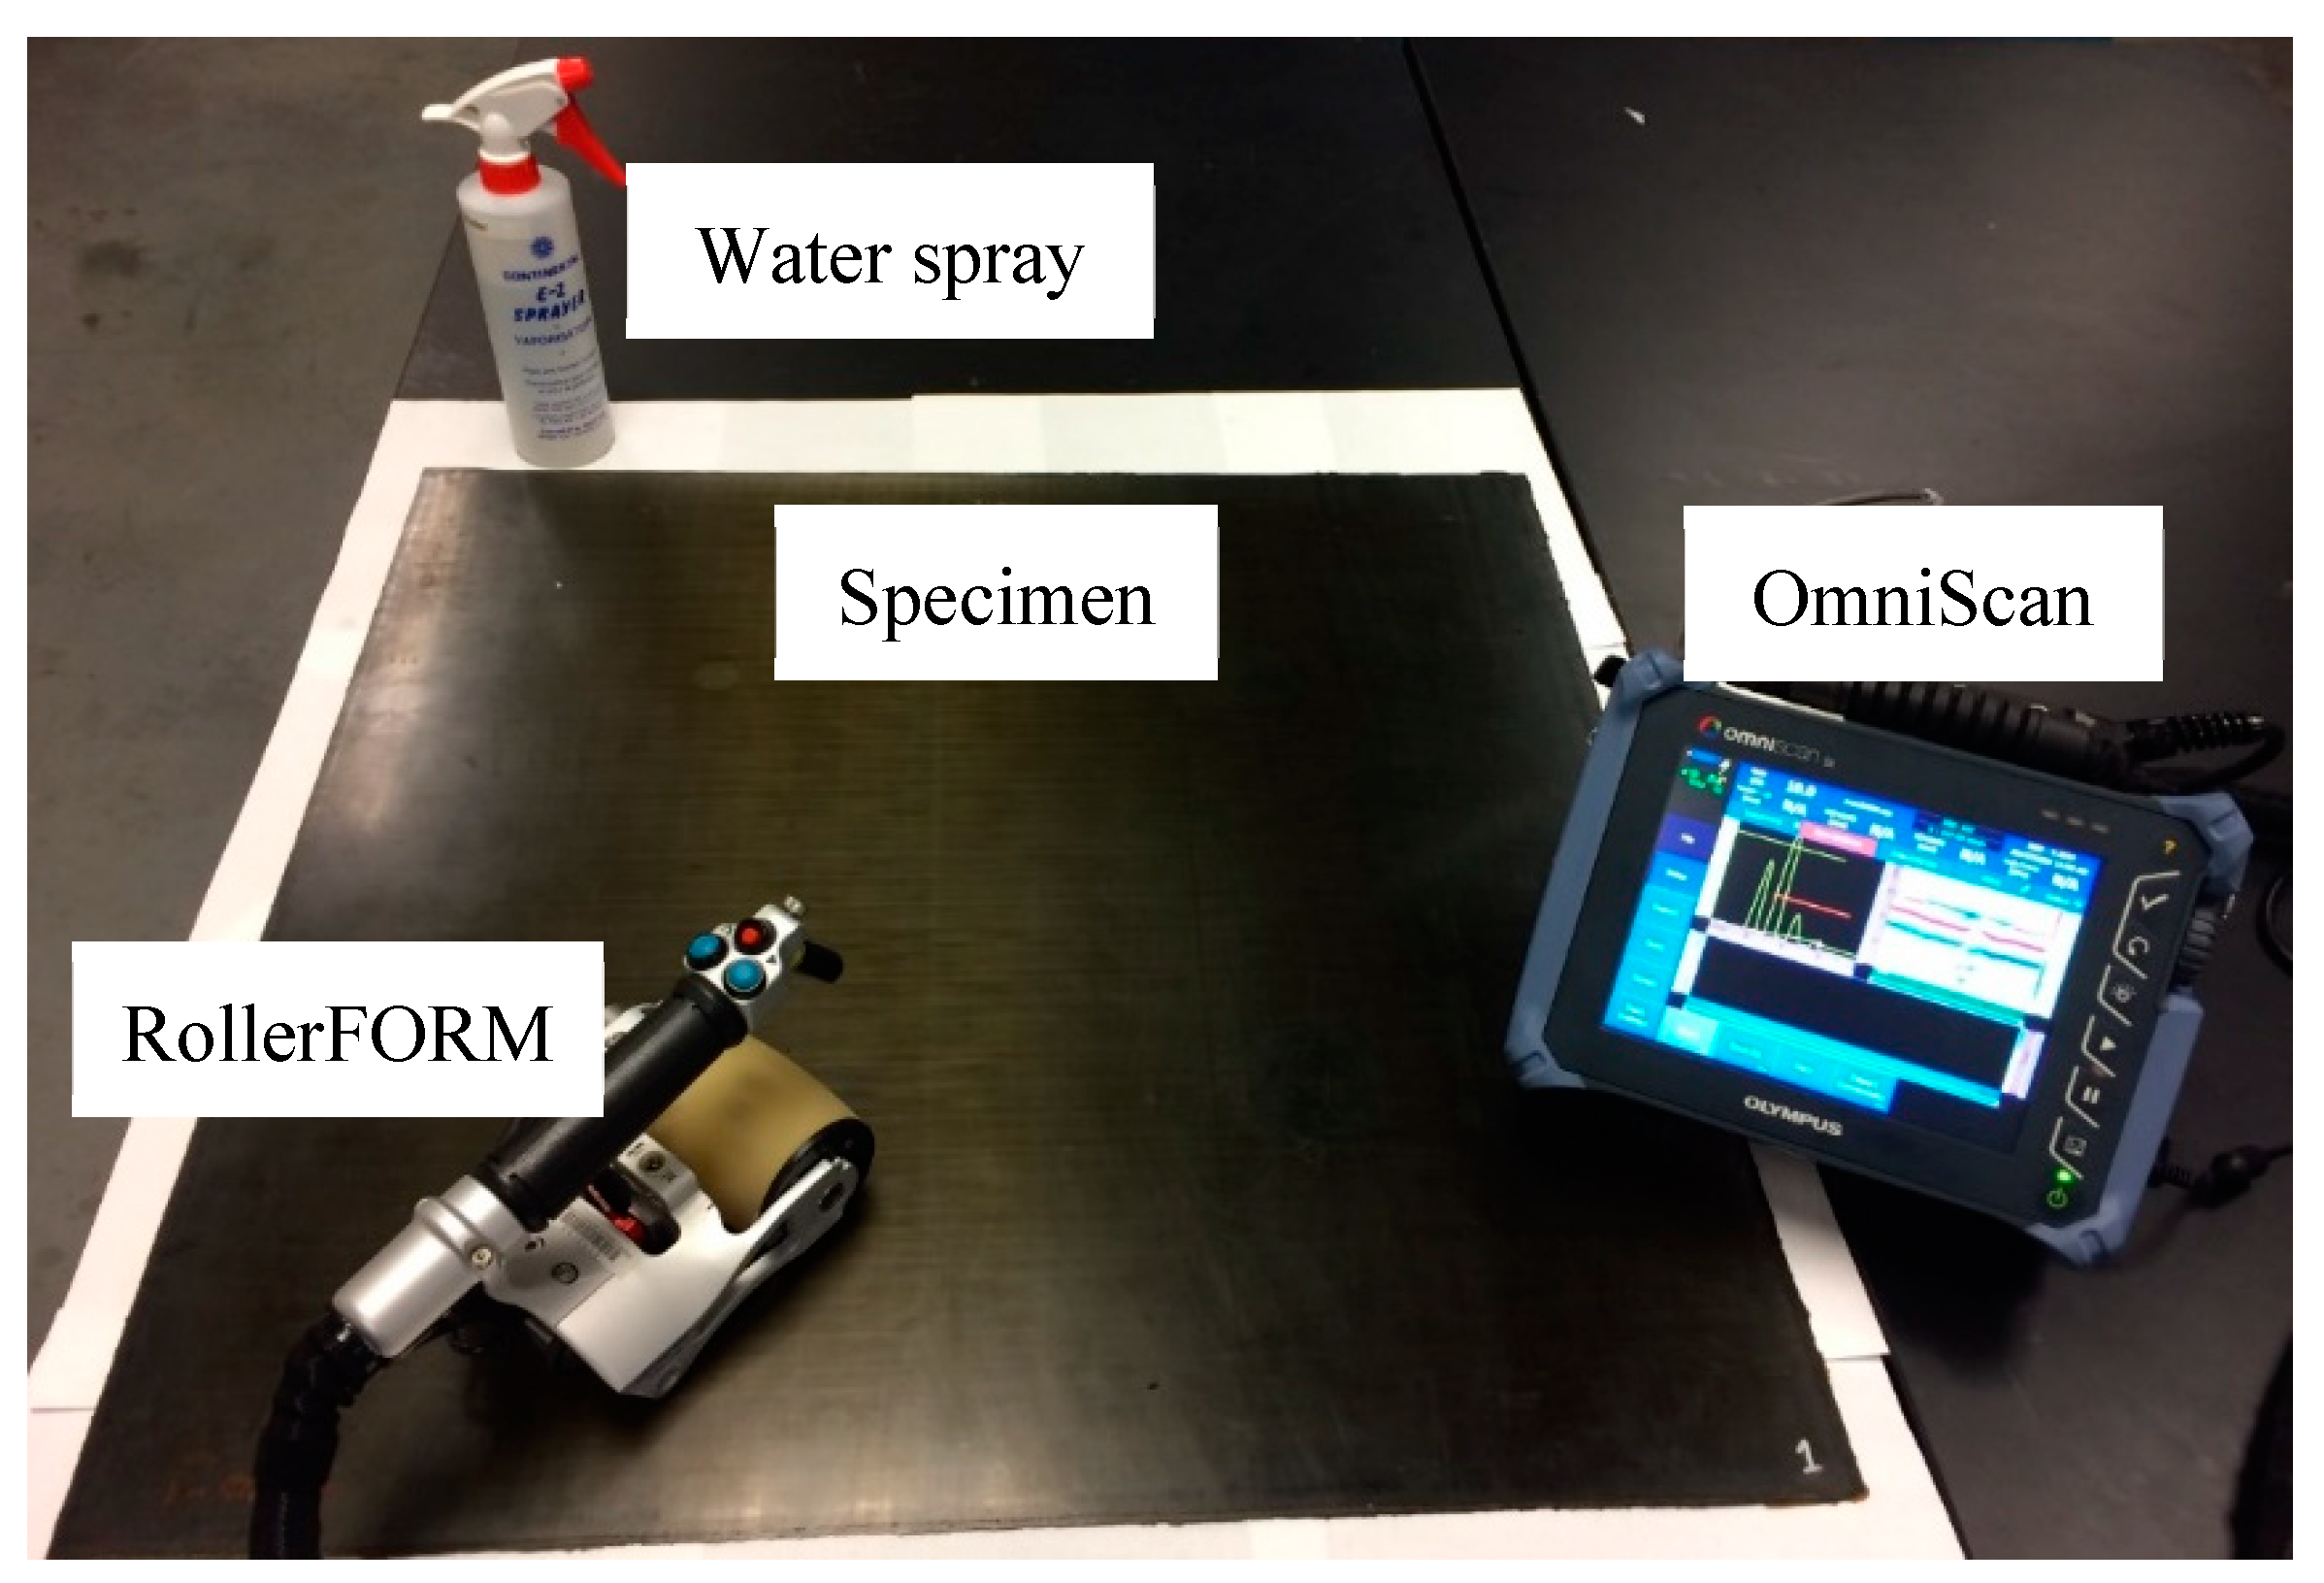
3. Ultrasonic Non-Destructive Testing (NDT) of the Composite Specimens
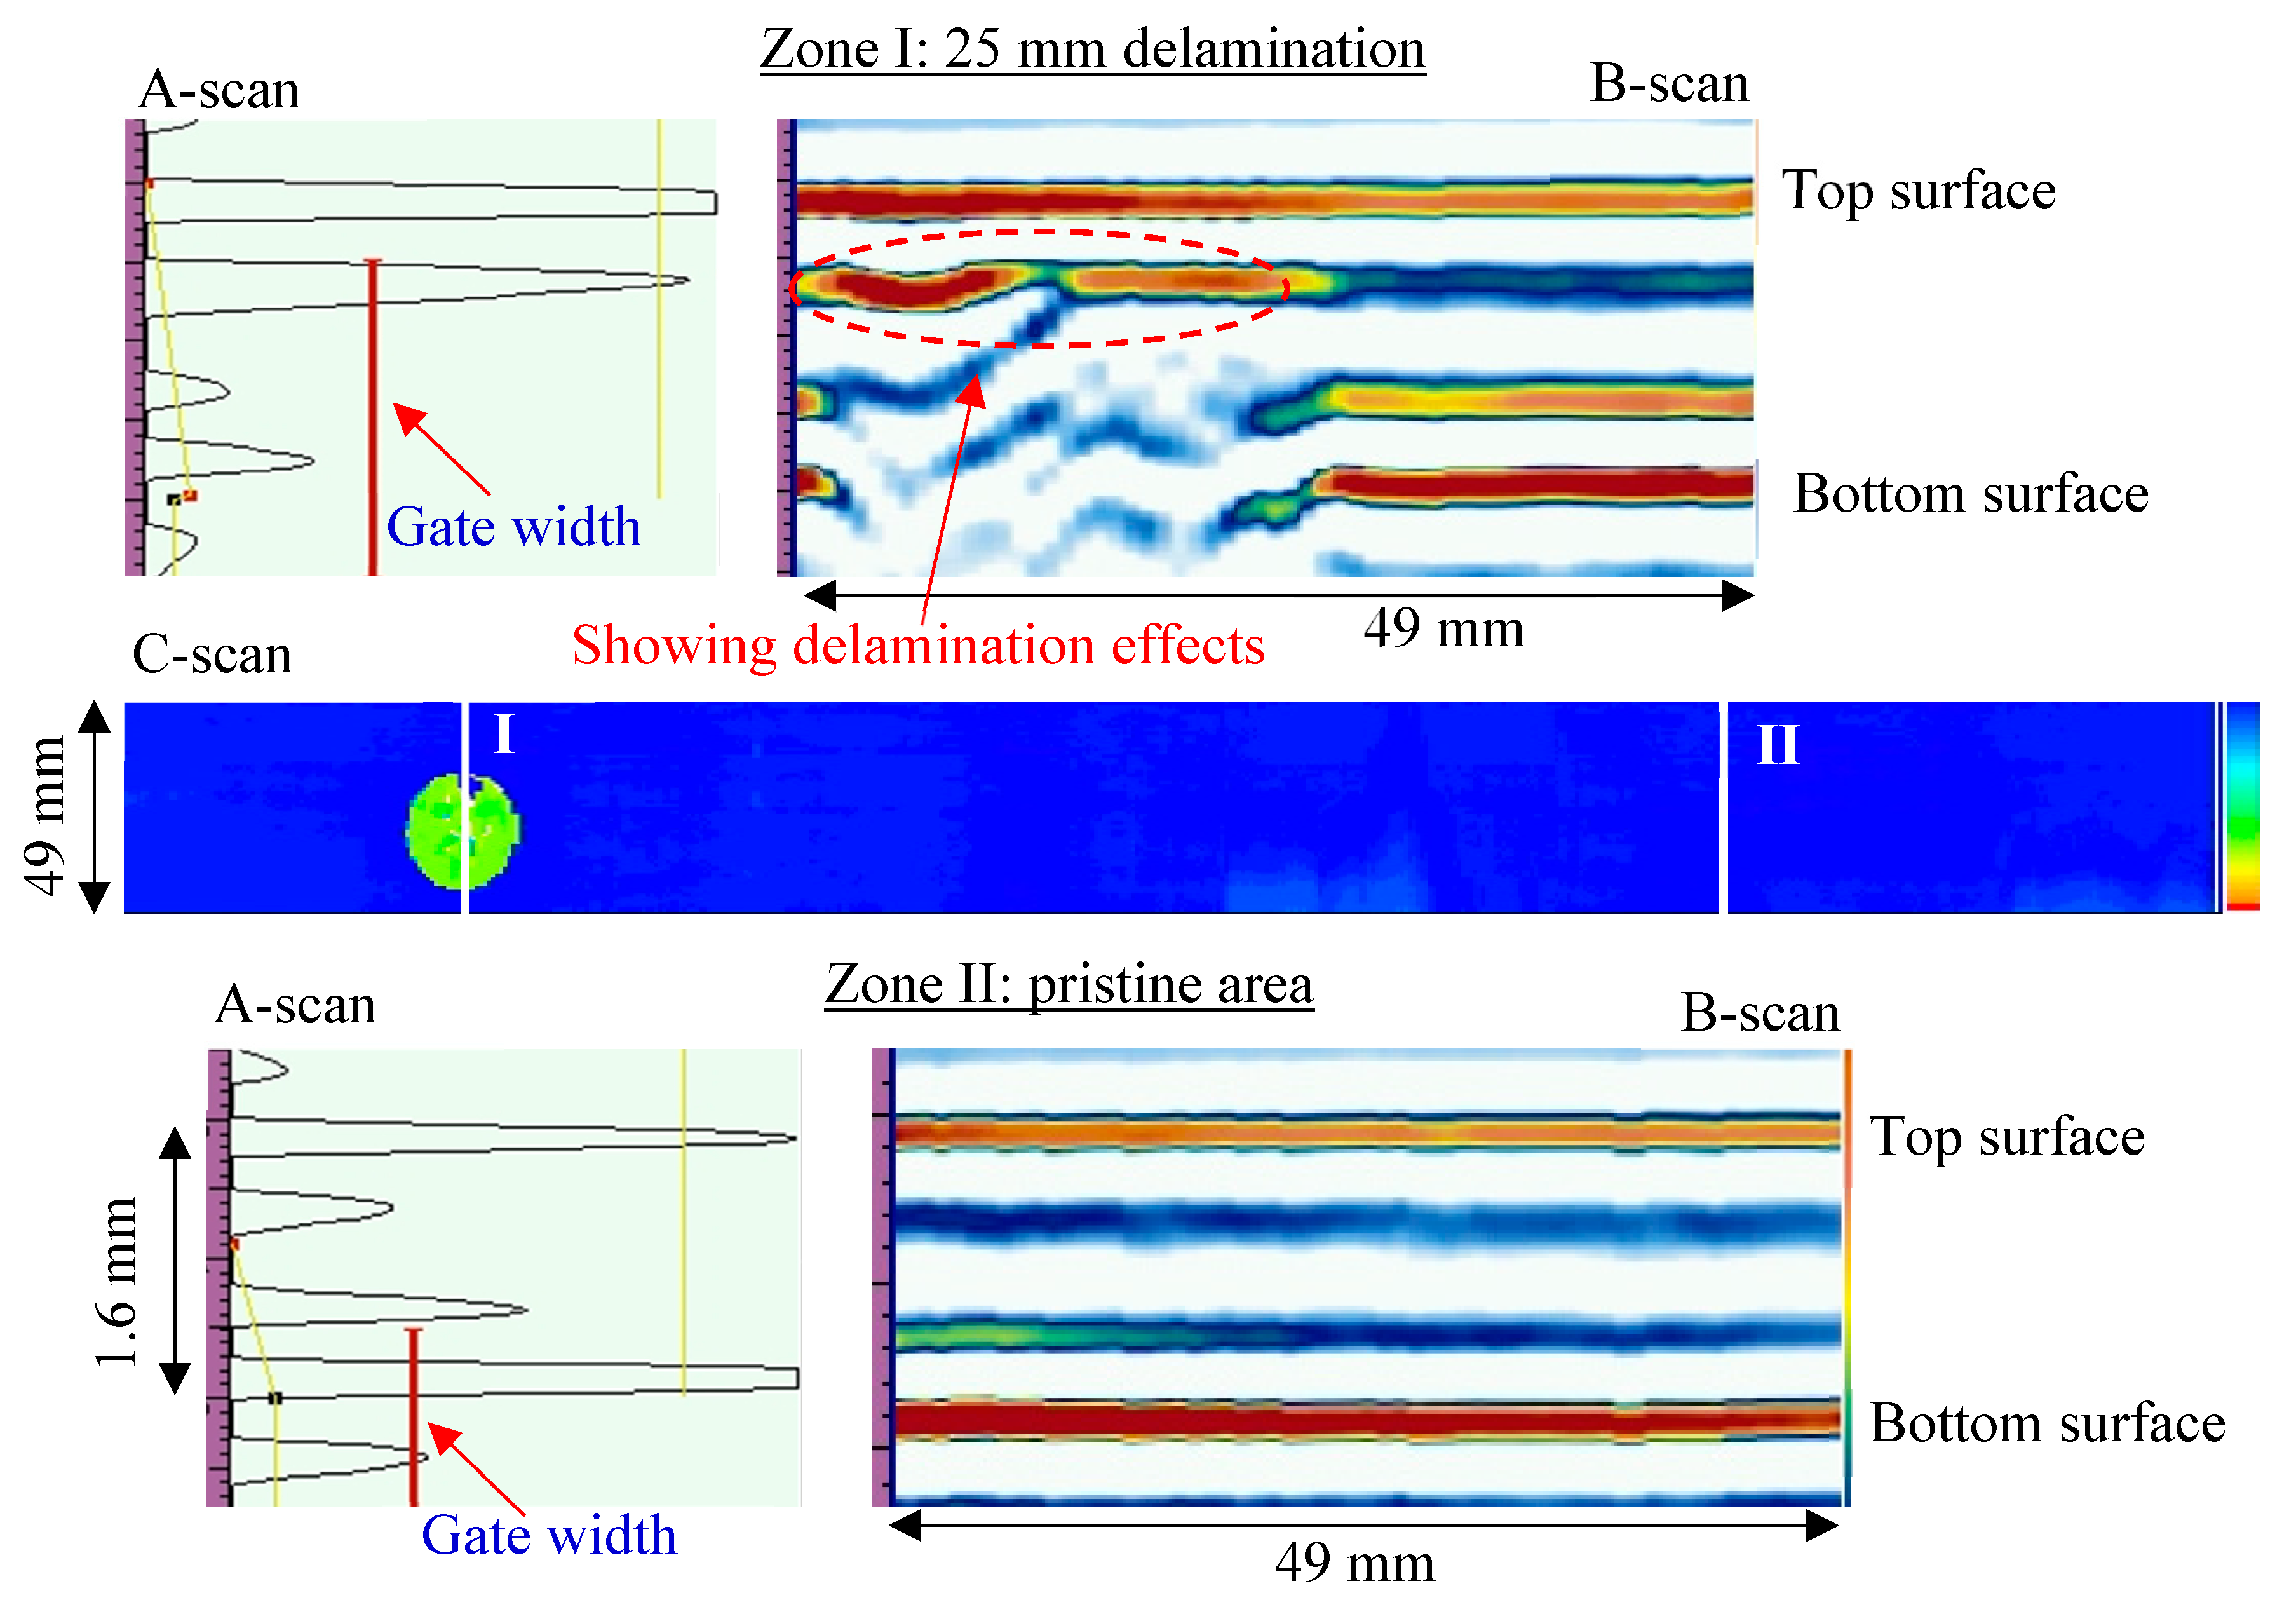
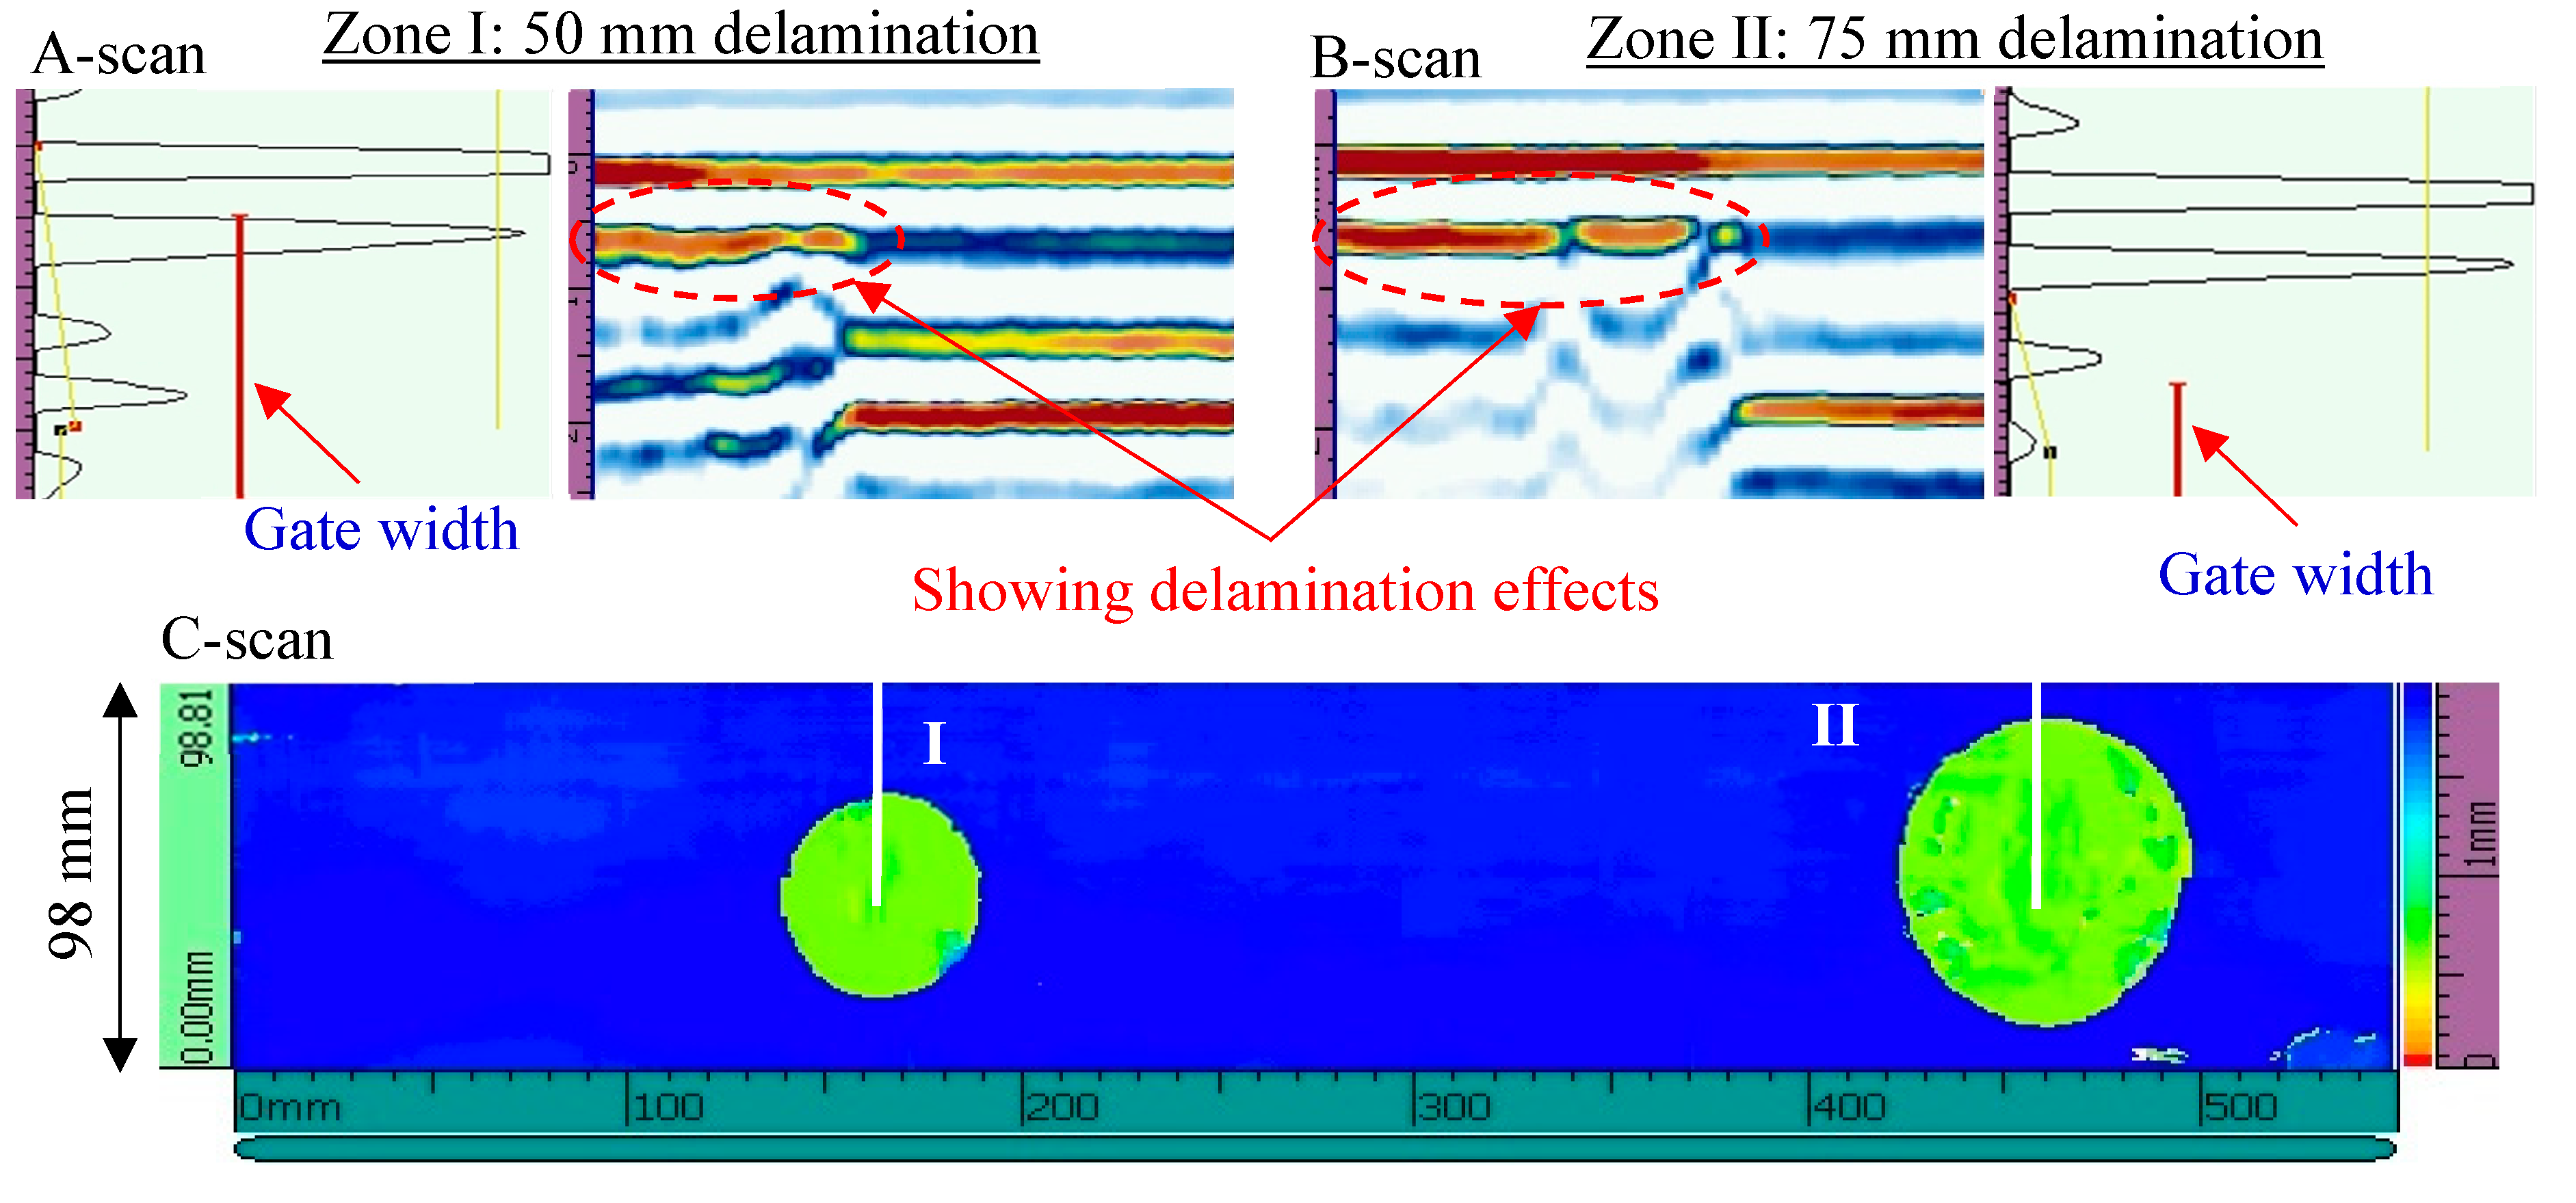
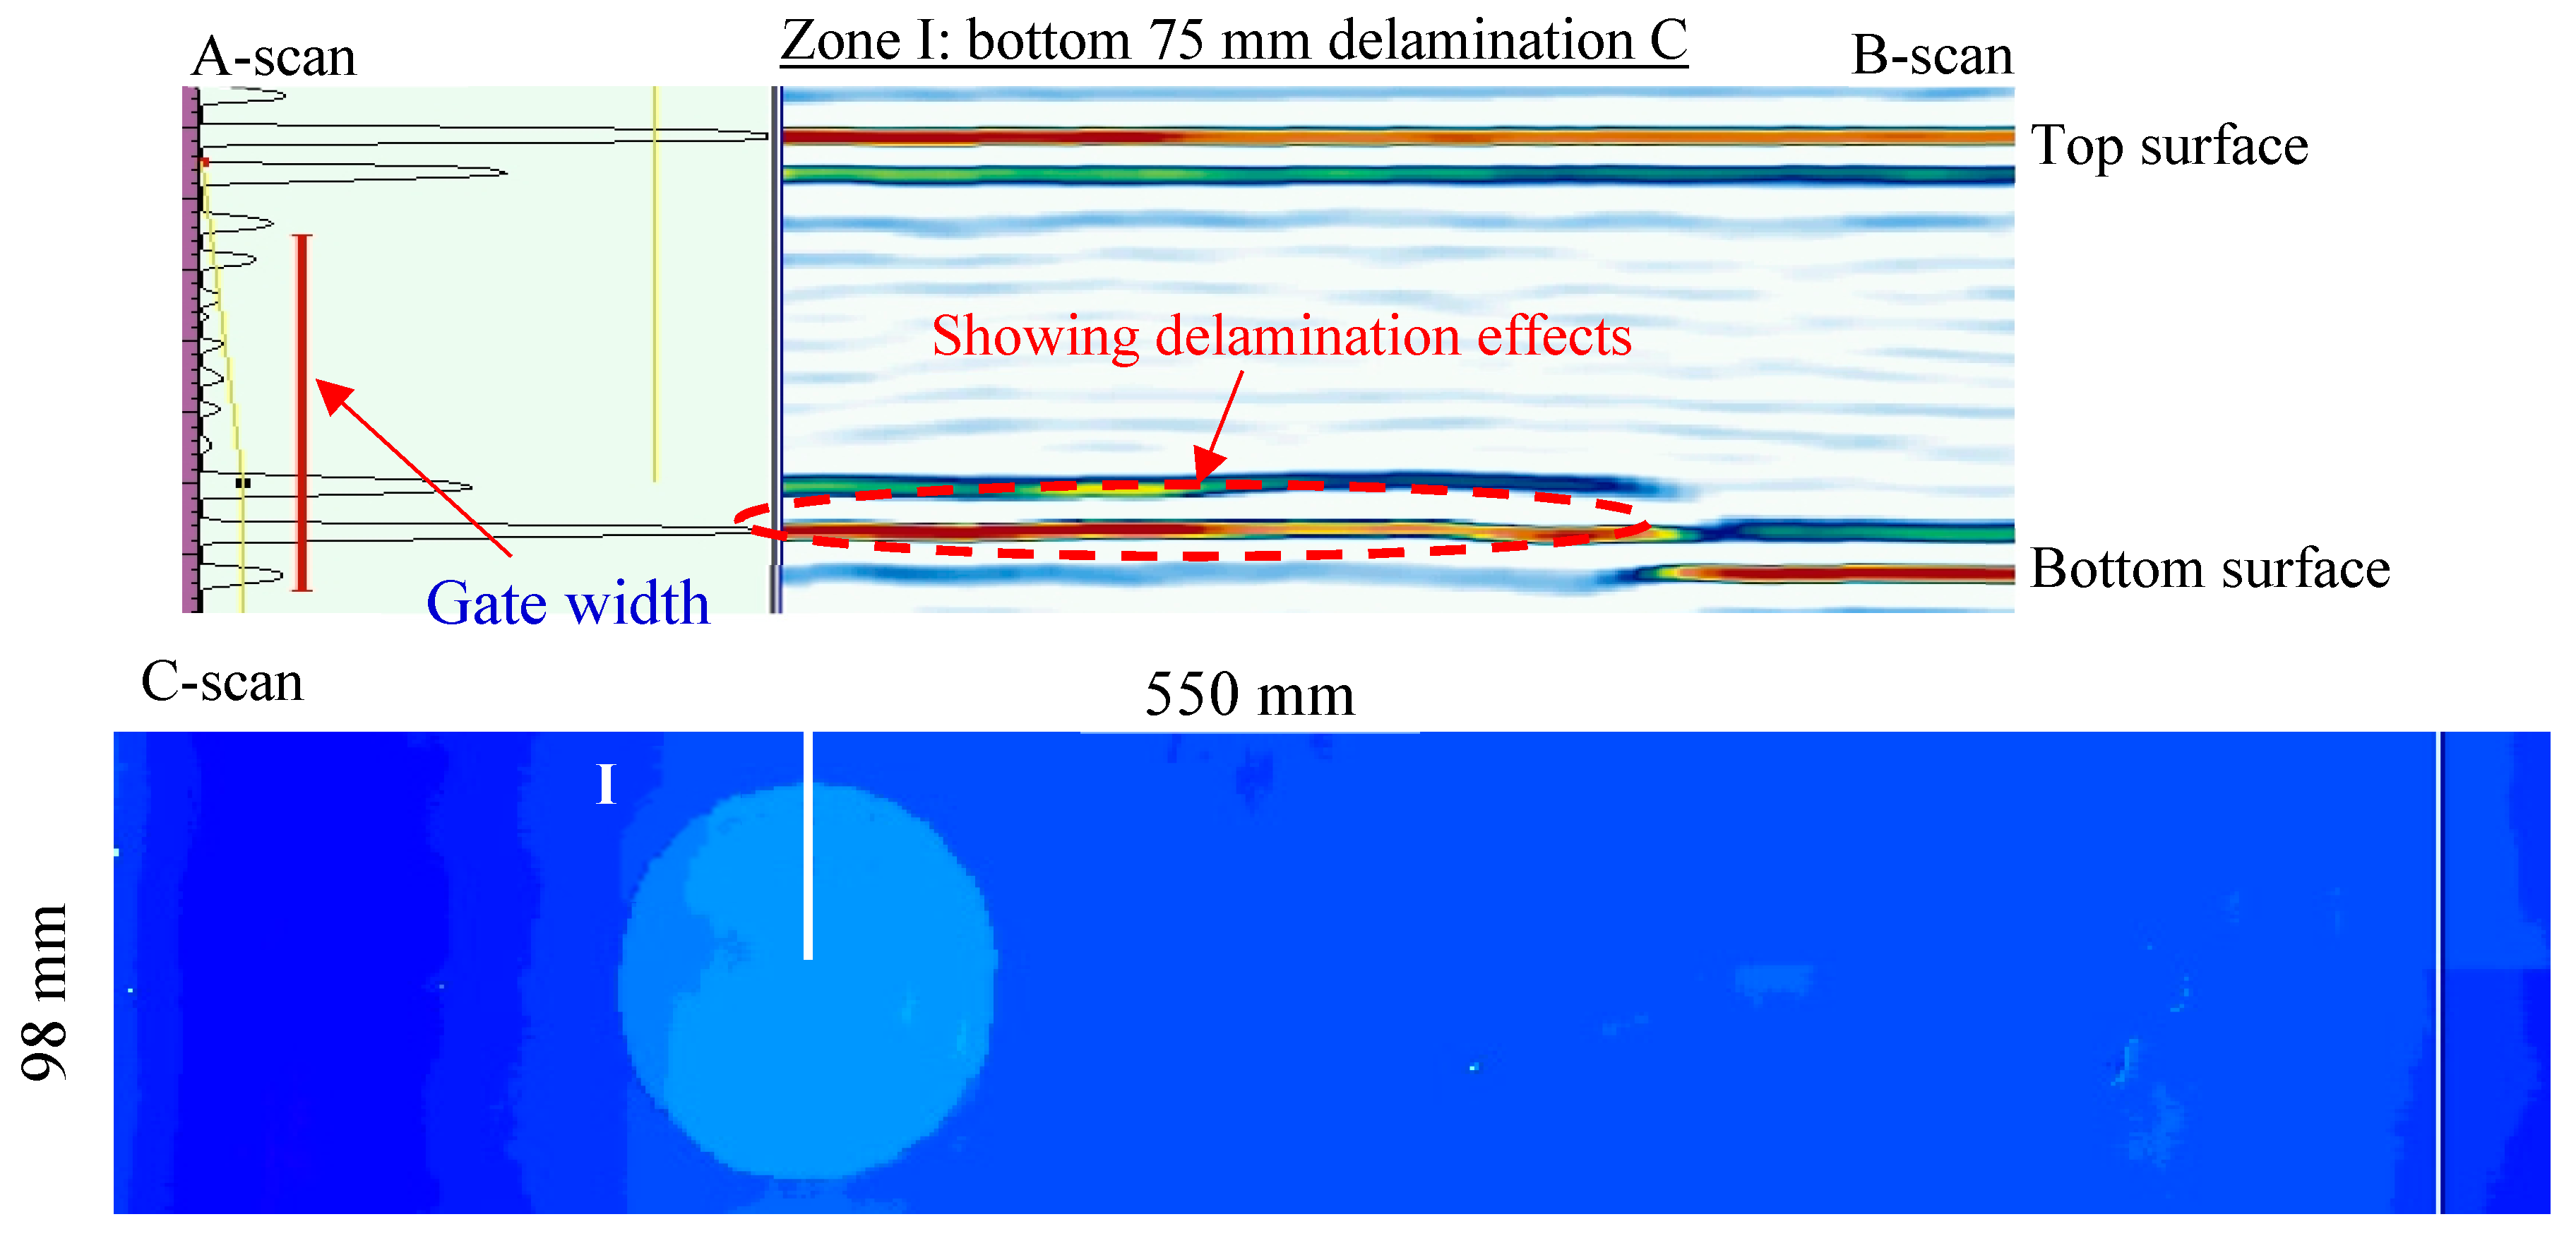
3.1. NDT Detection on the Cross-Ply Composite Plate
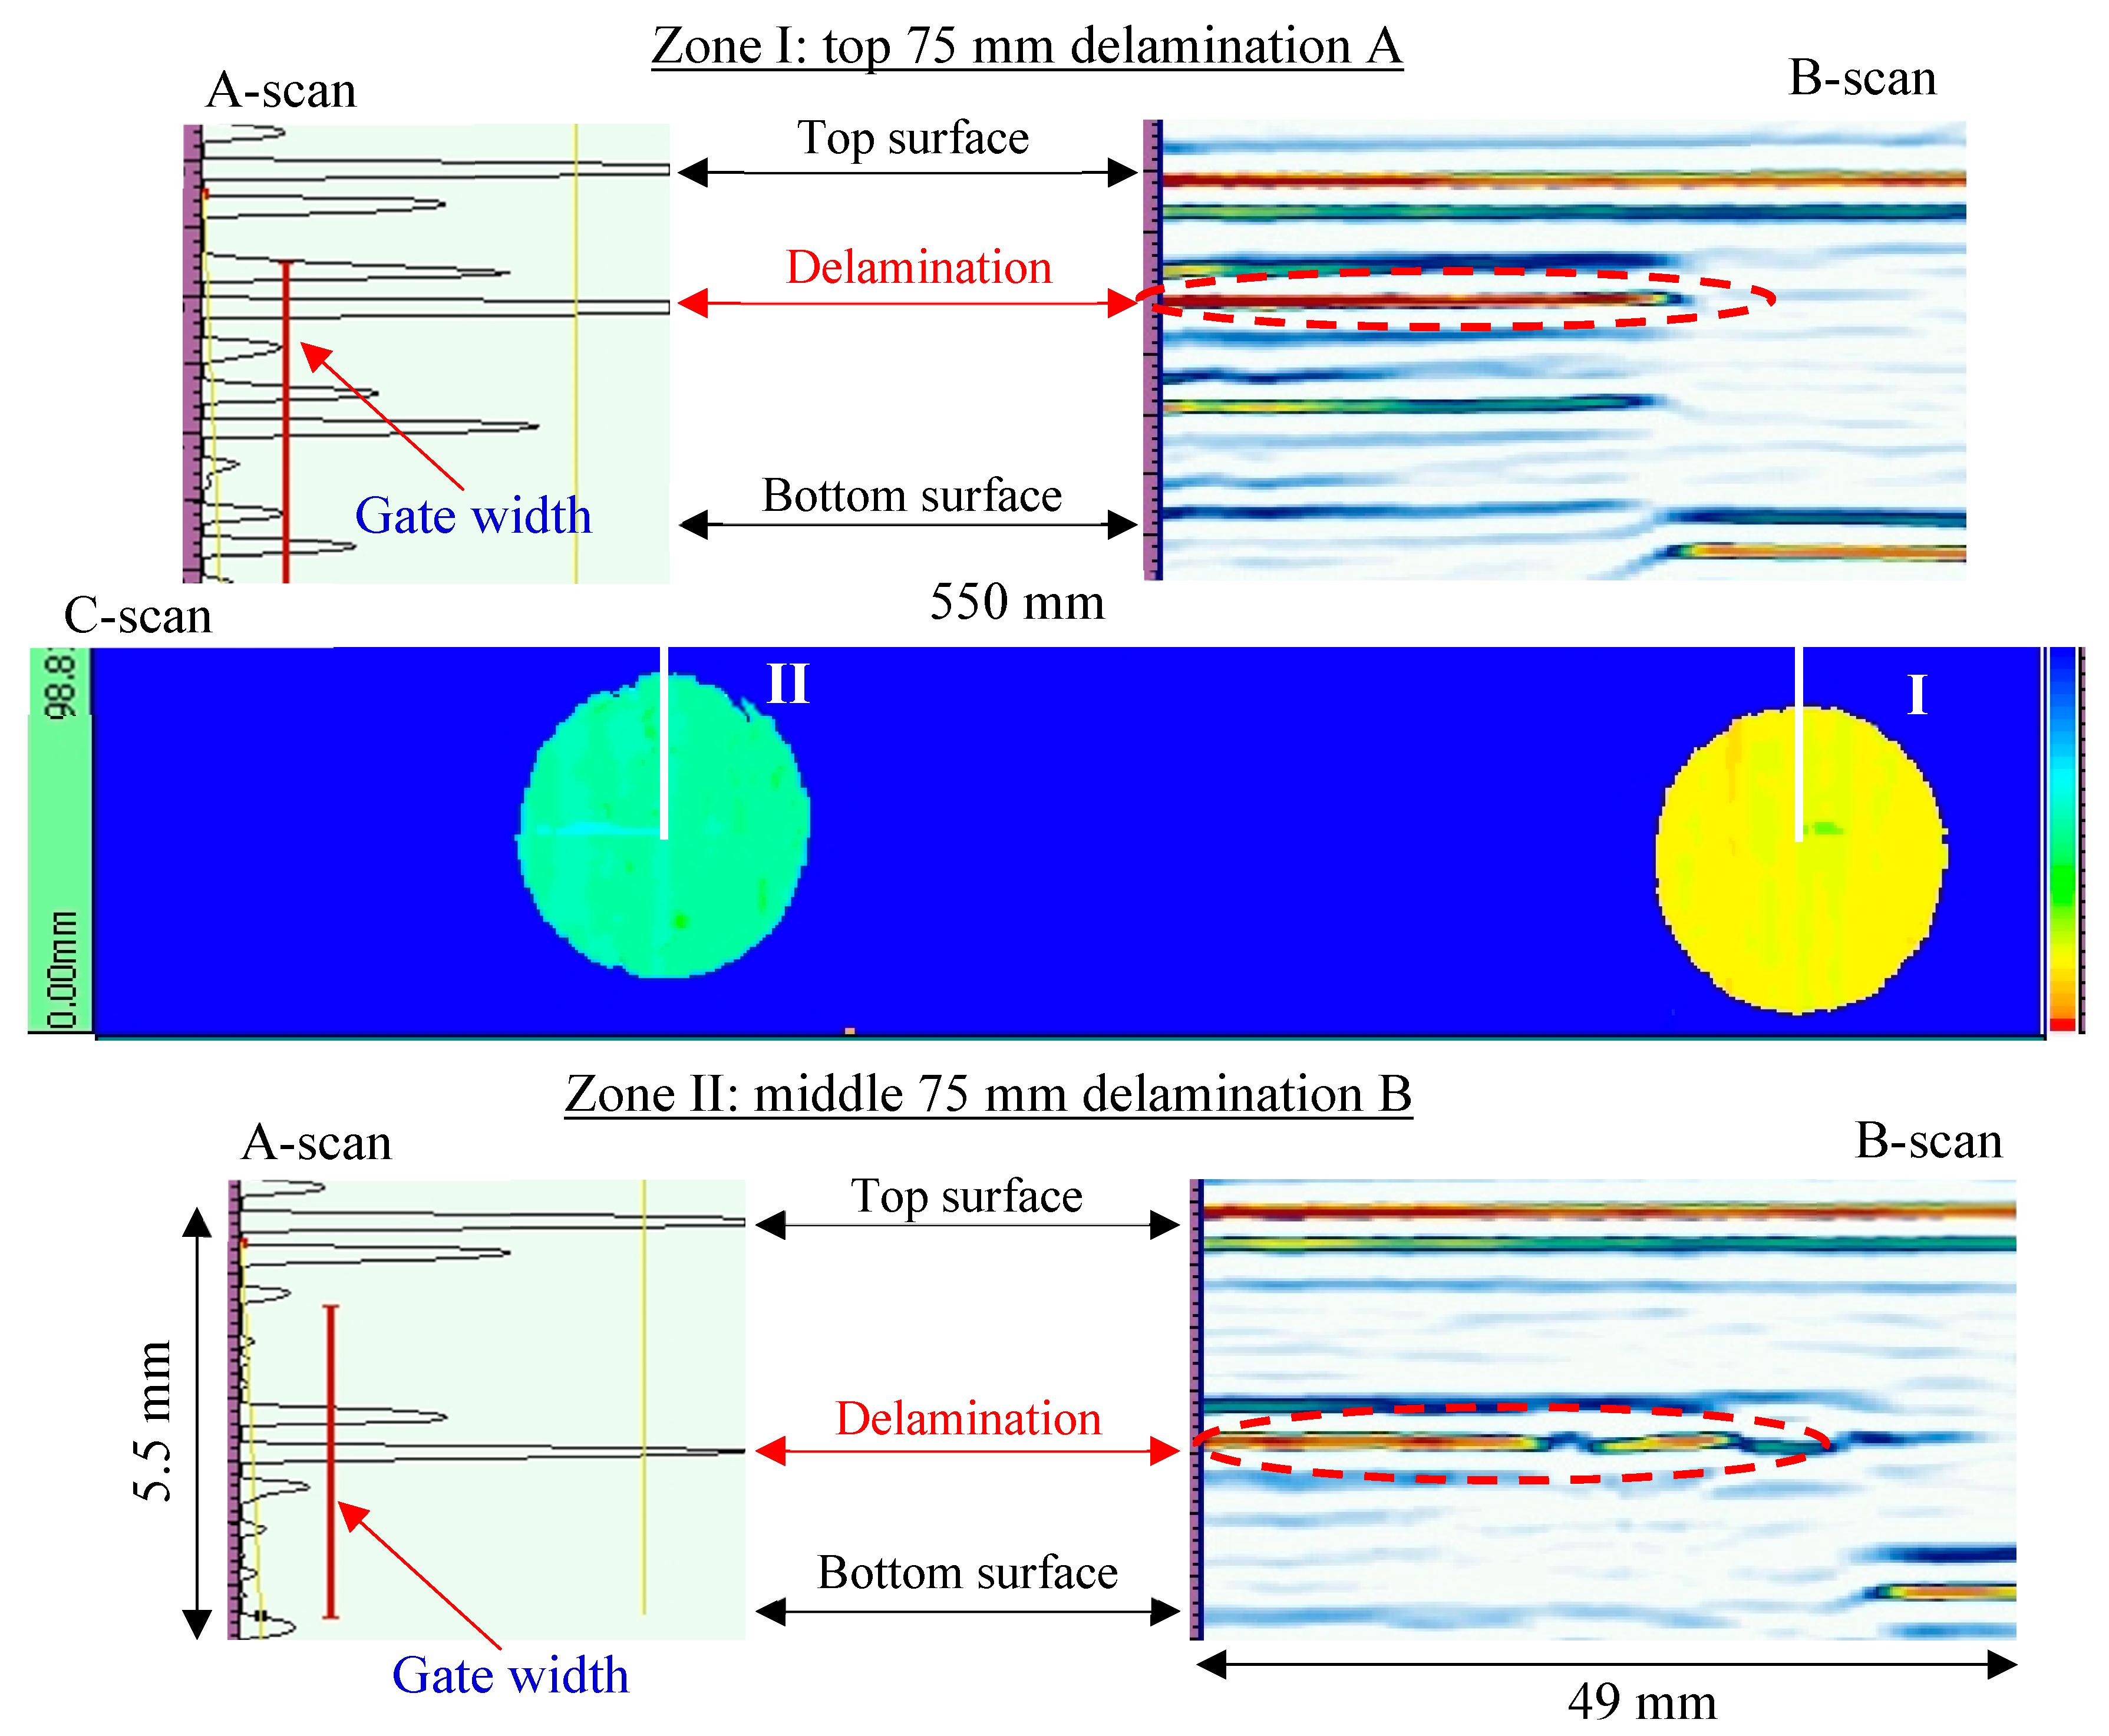
3.2. NDT Detection on the Unidirectional Composite Plate
4. Scanning Laser Doppler Vibrometer (SLDV) Measurements on the Composite Specimens
4.1. SLDV Measurement on the Cross-Ply Composite Plate
4.2. SLDV Measurement on the Unidirectional Composite Plate
5. Multi-Physics Finite Element Modeling
5.1. Finite Element Model for the Cross-Ply Composite Plate
5.2. Finite Element Model for the Unidirectional Composite Plate
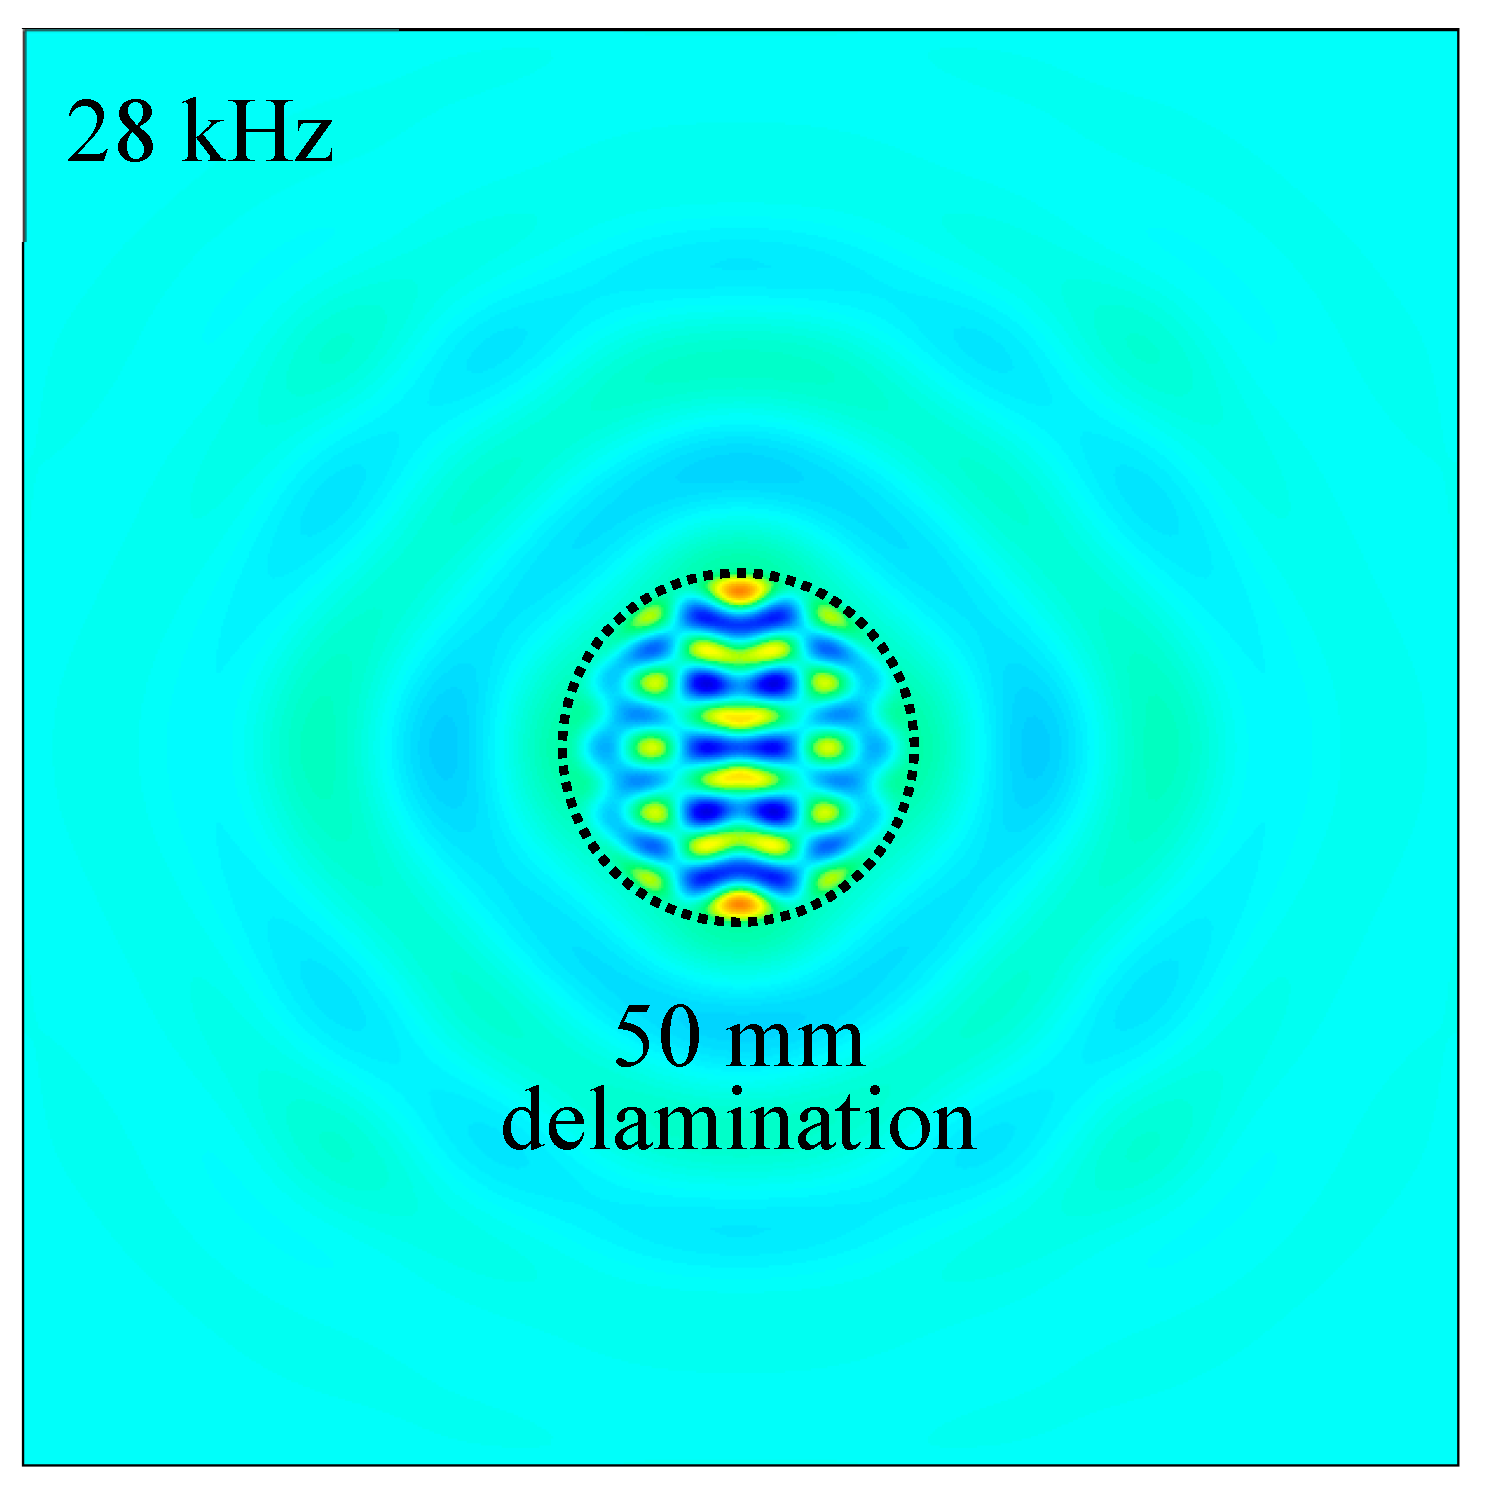
6. Vibration-Based Delamination Detection of Composite Plates
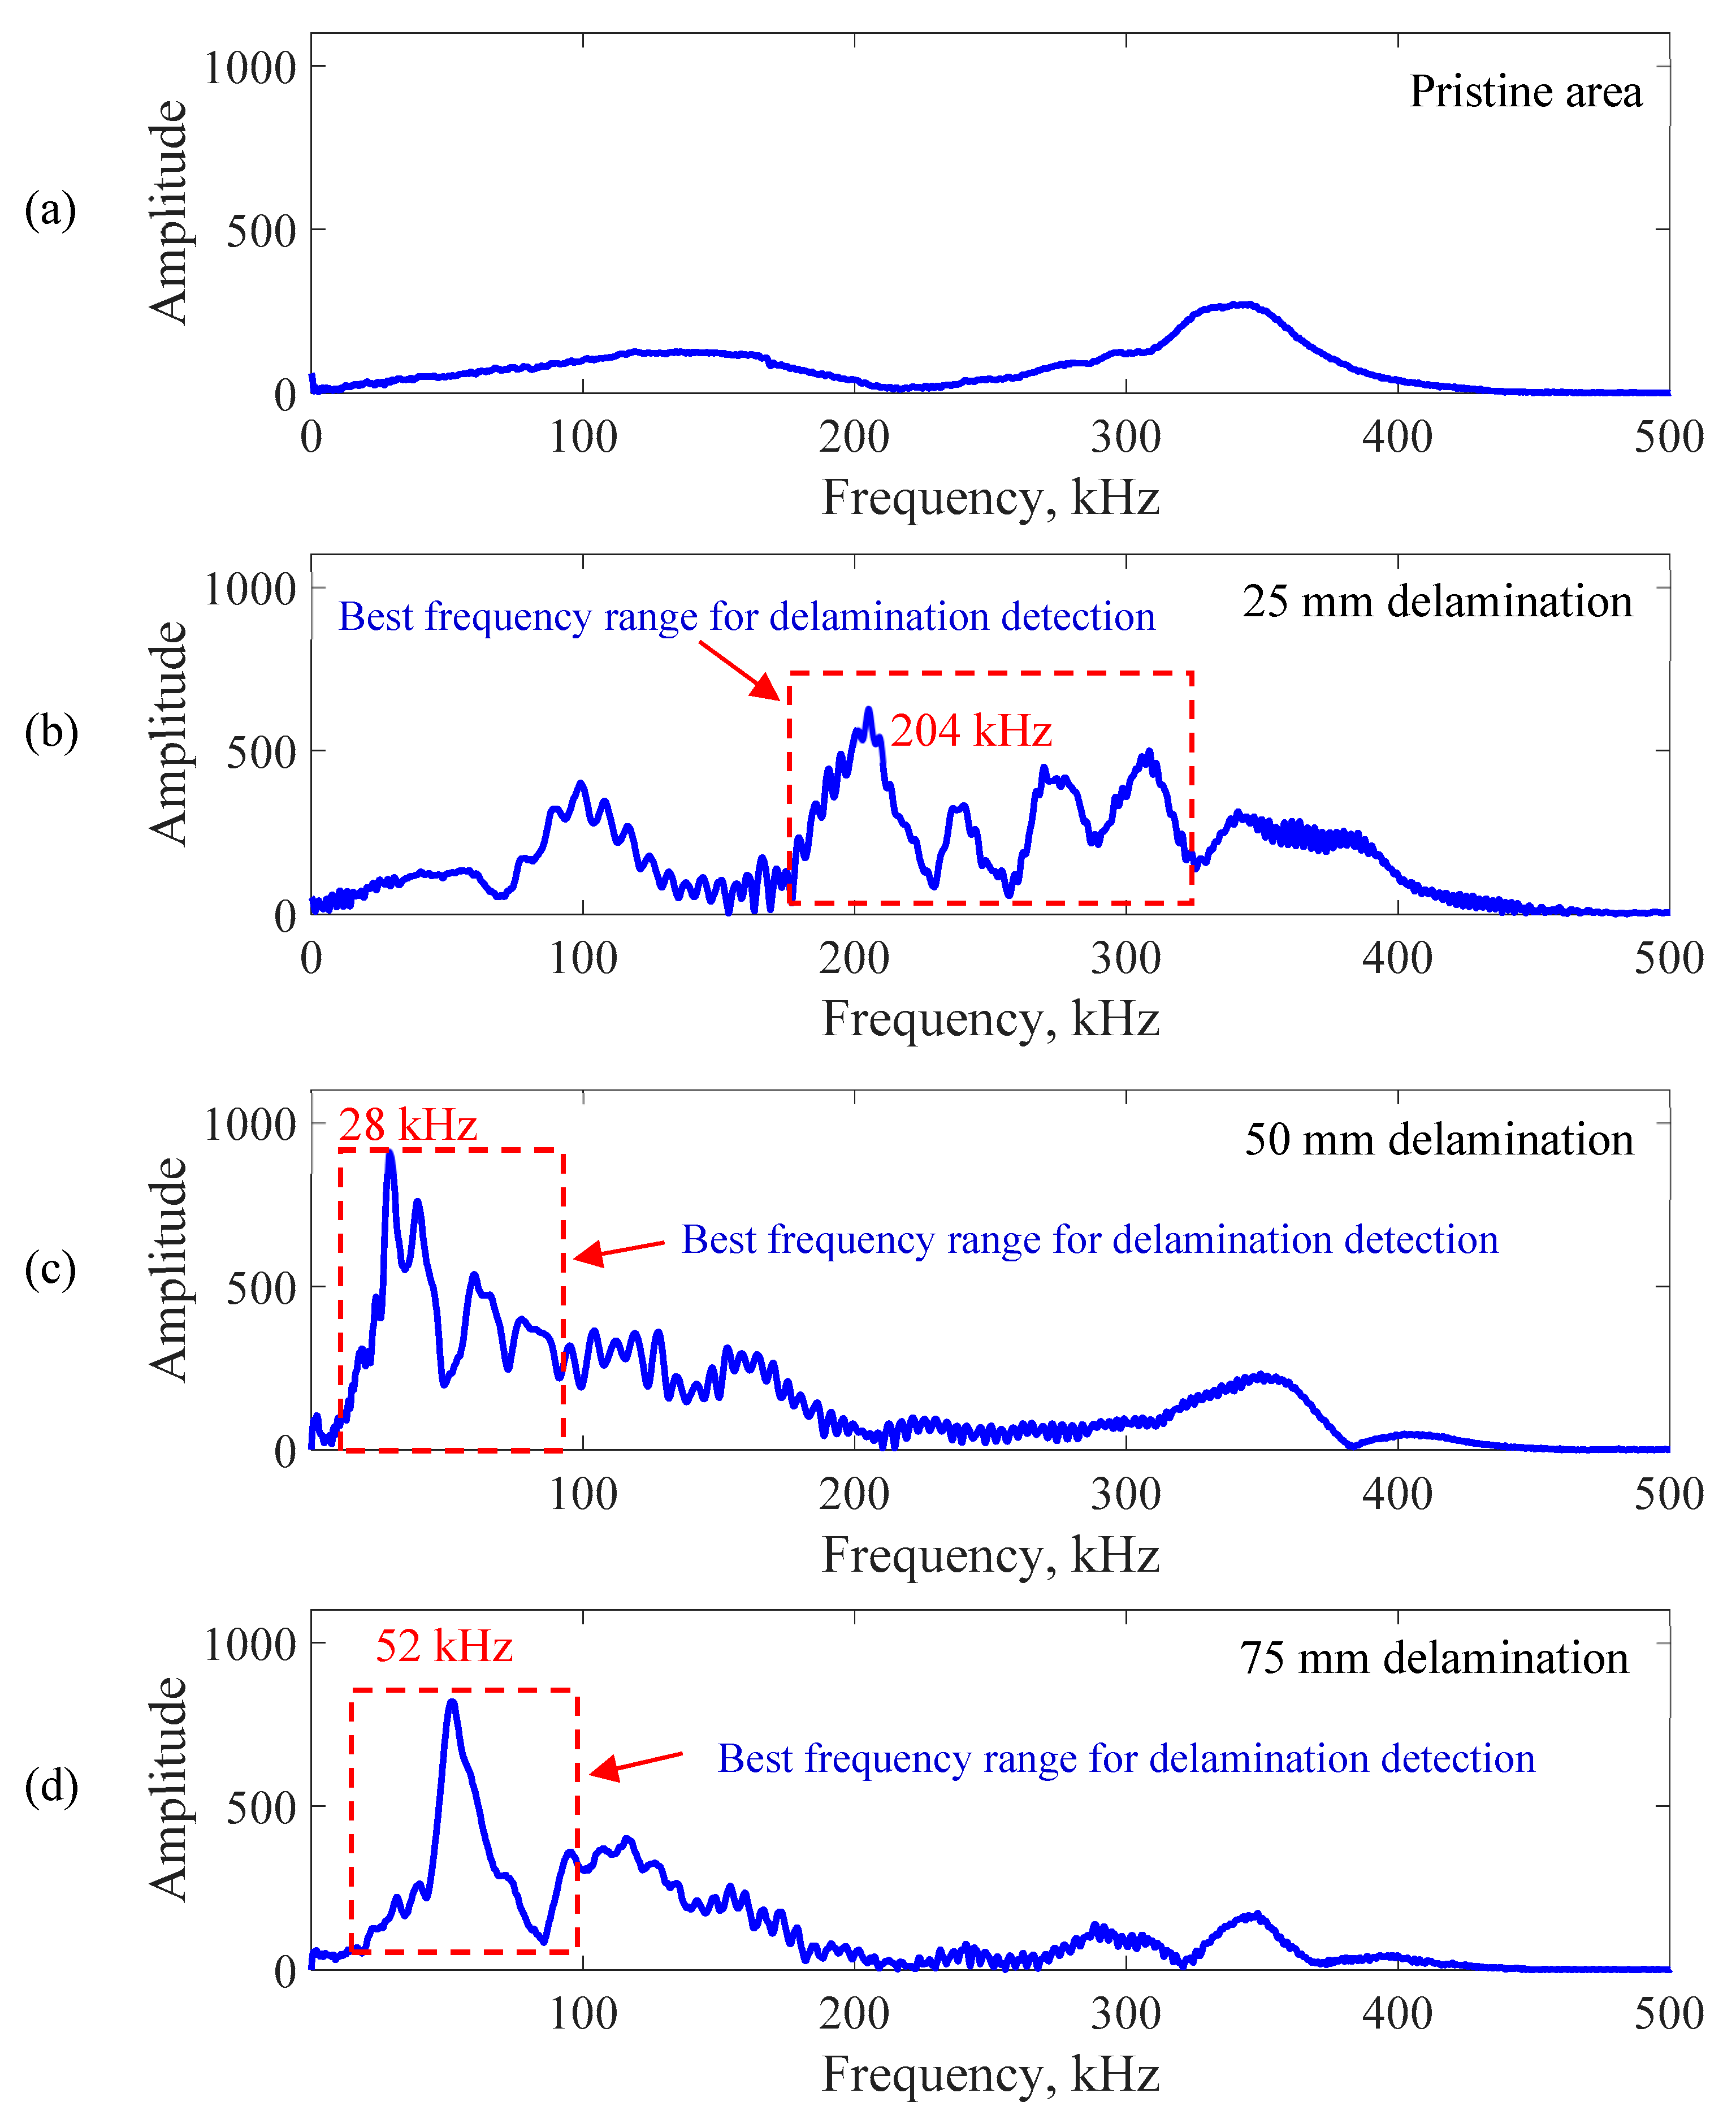
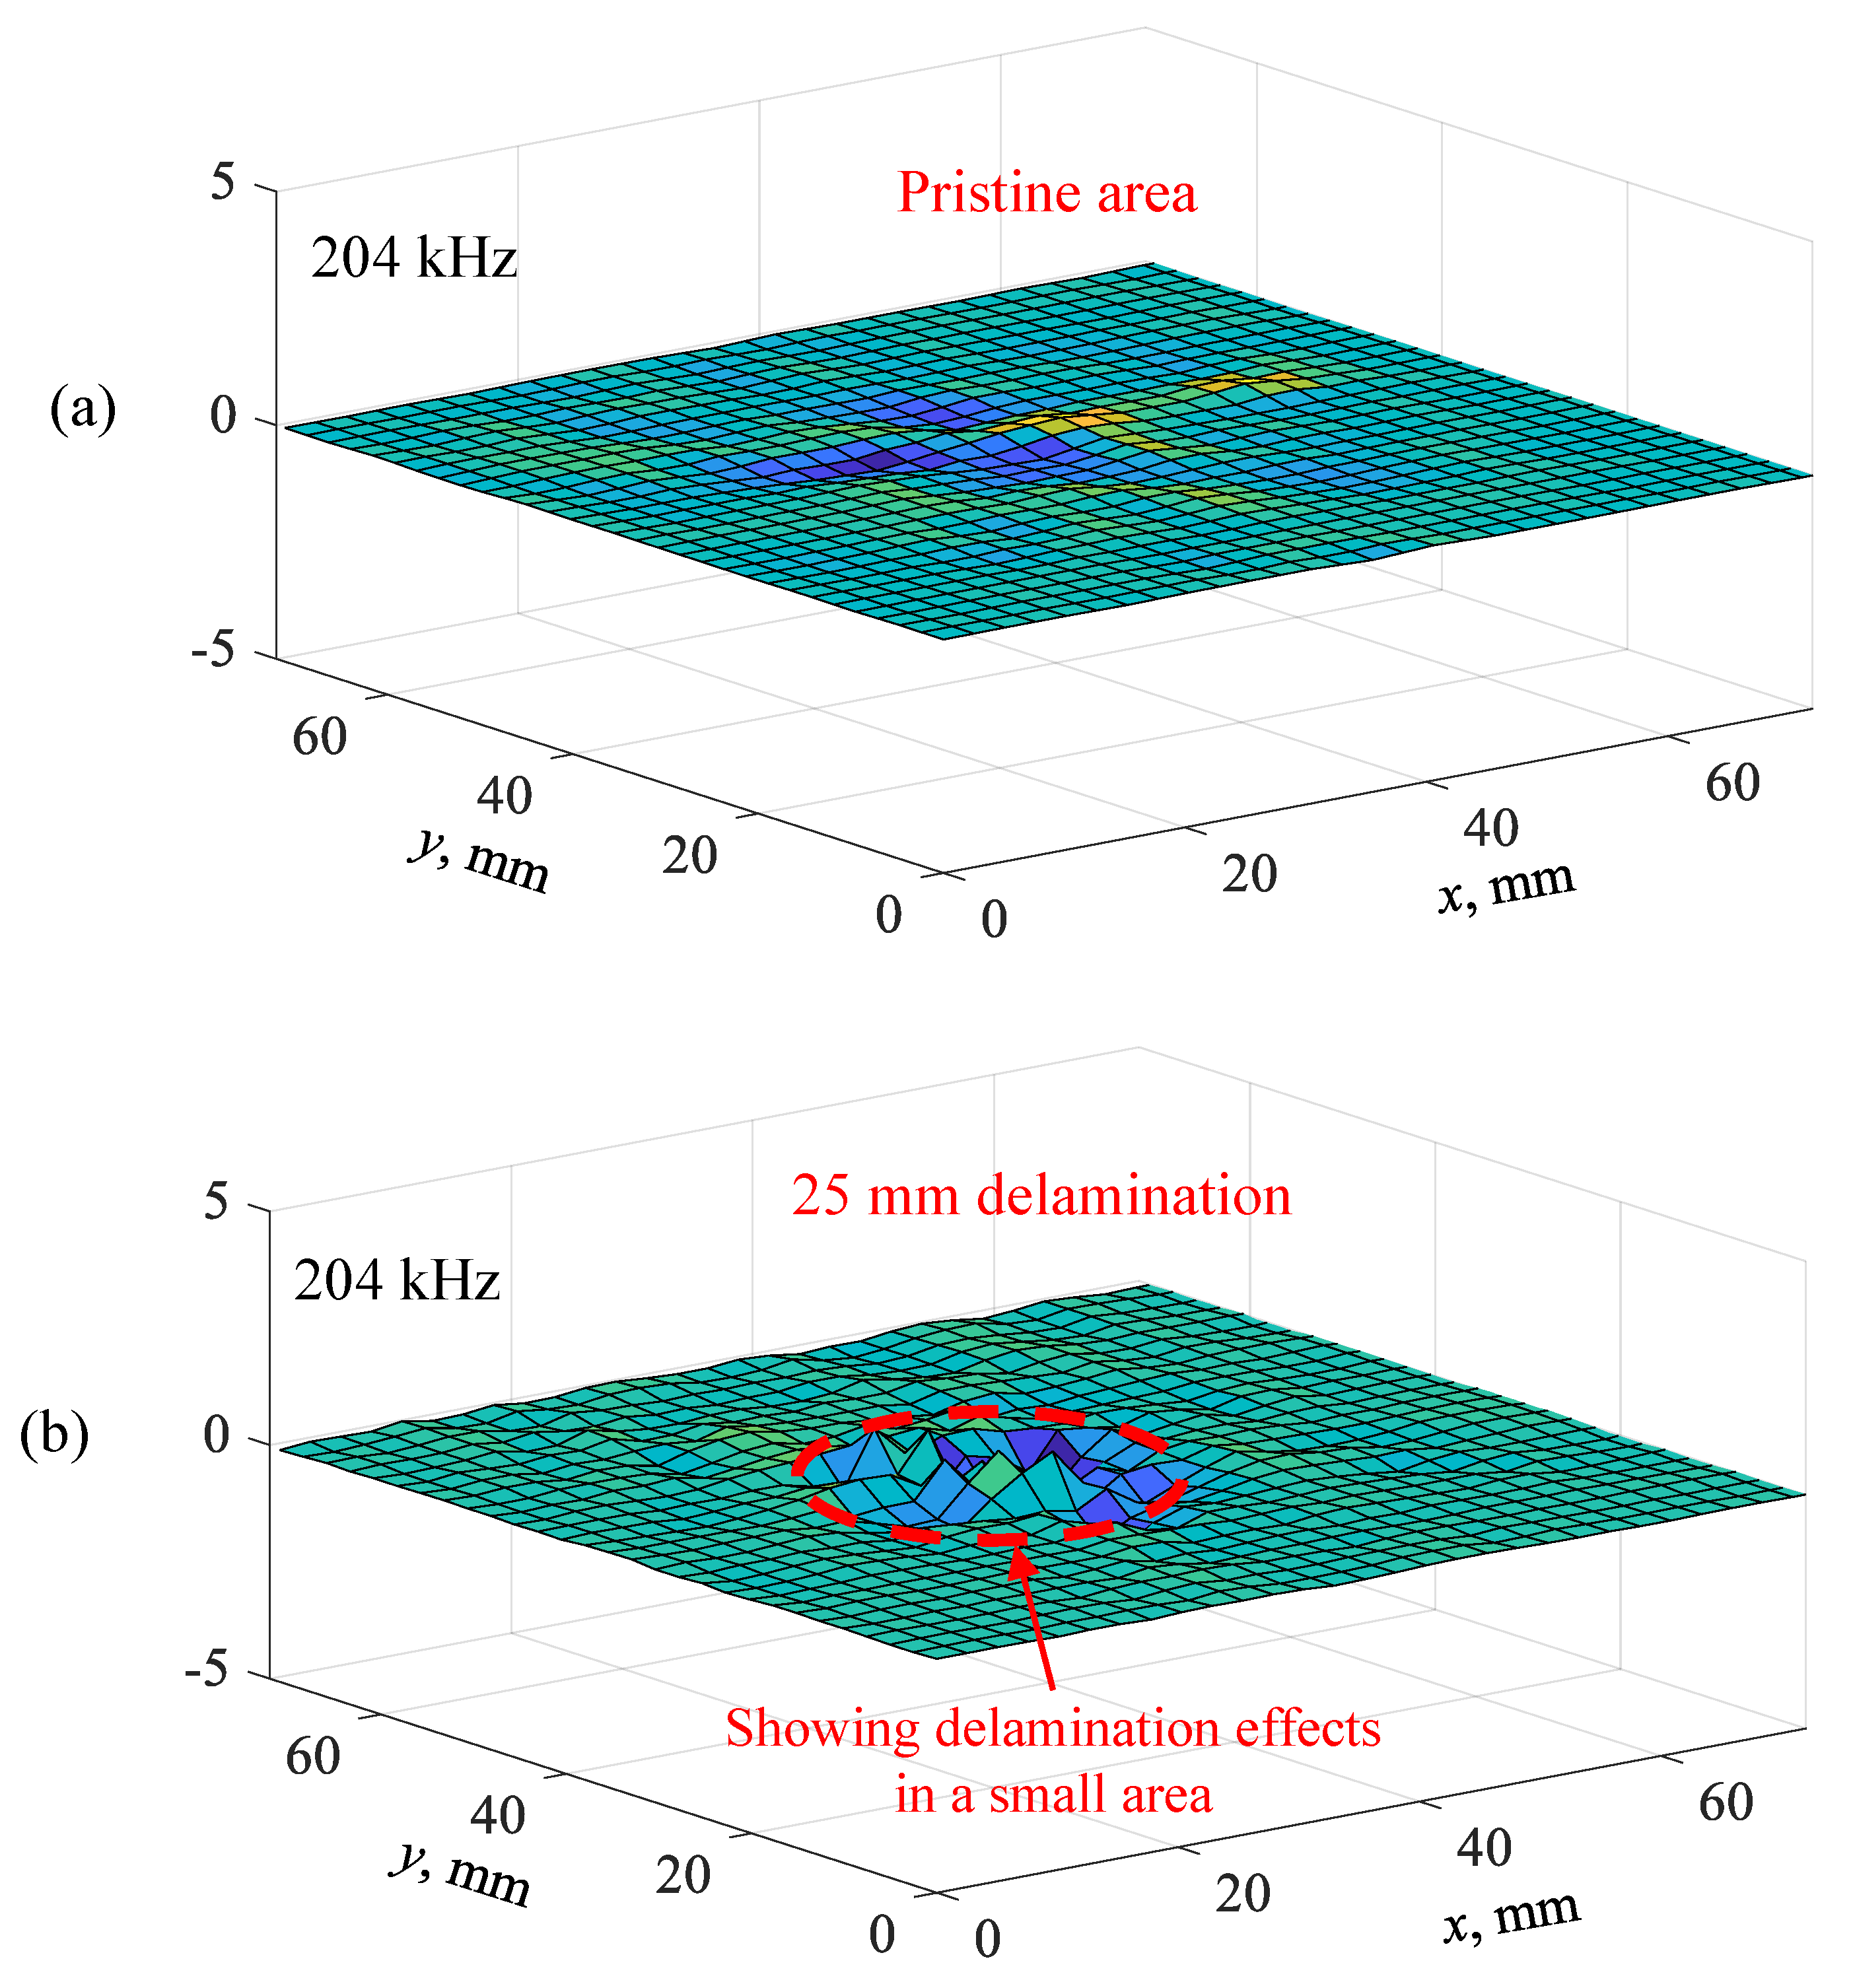
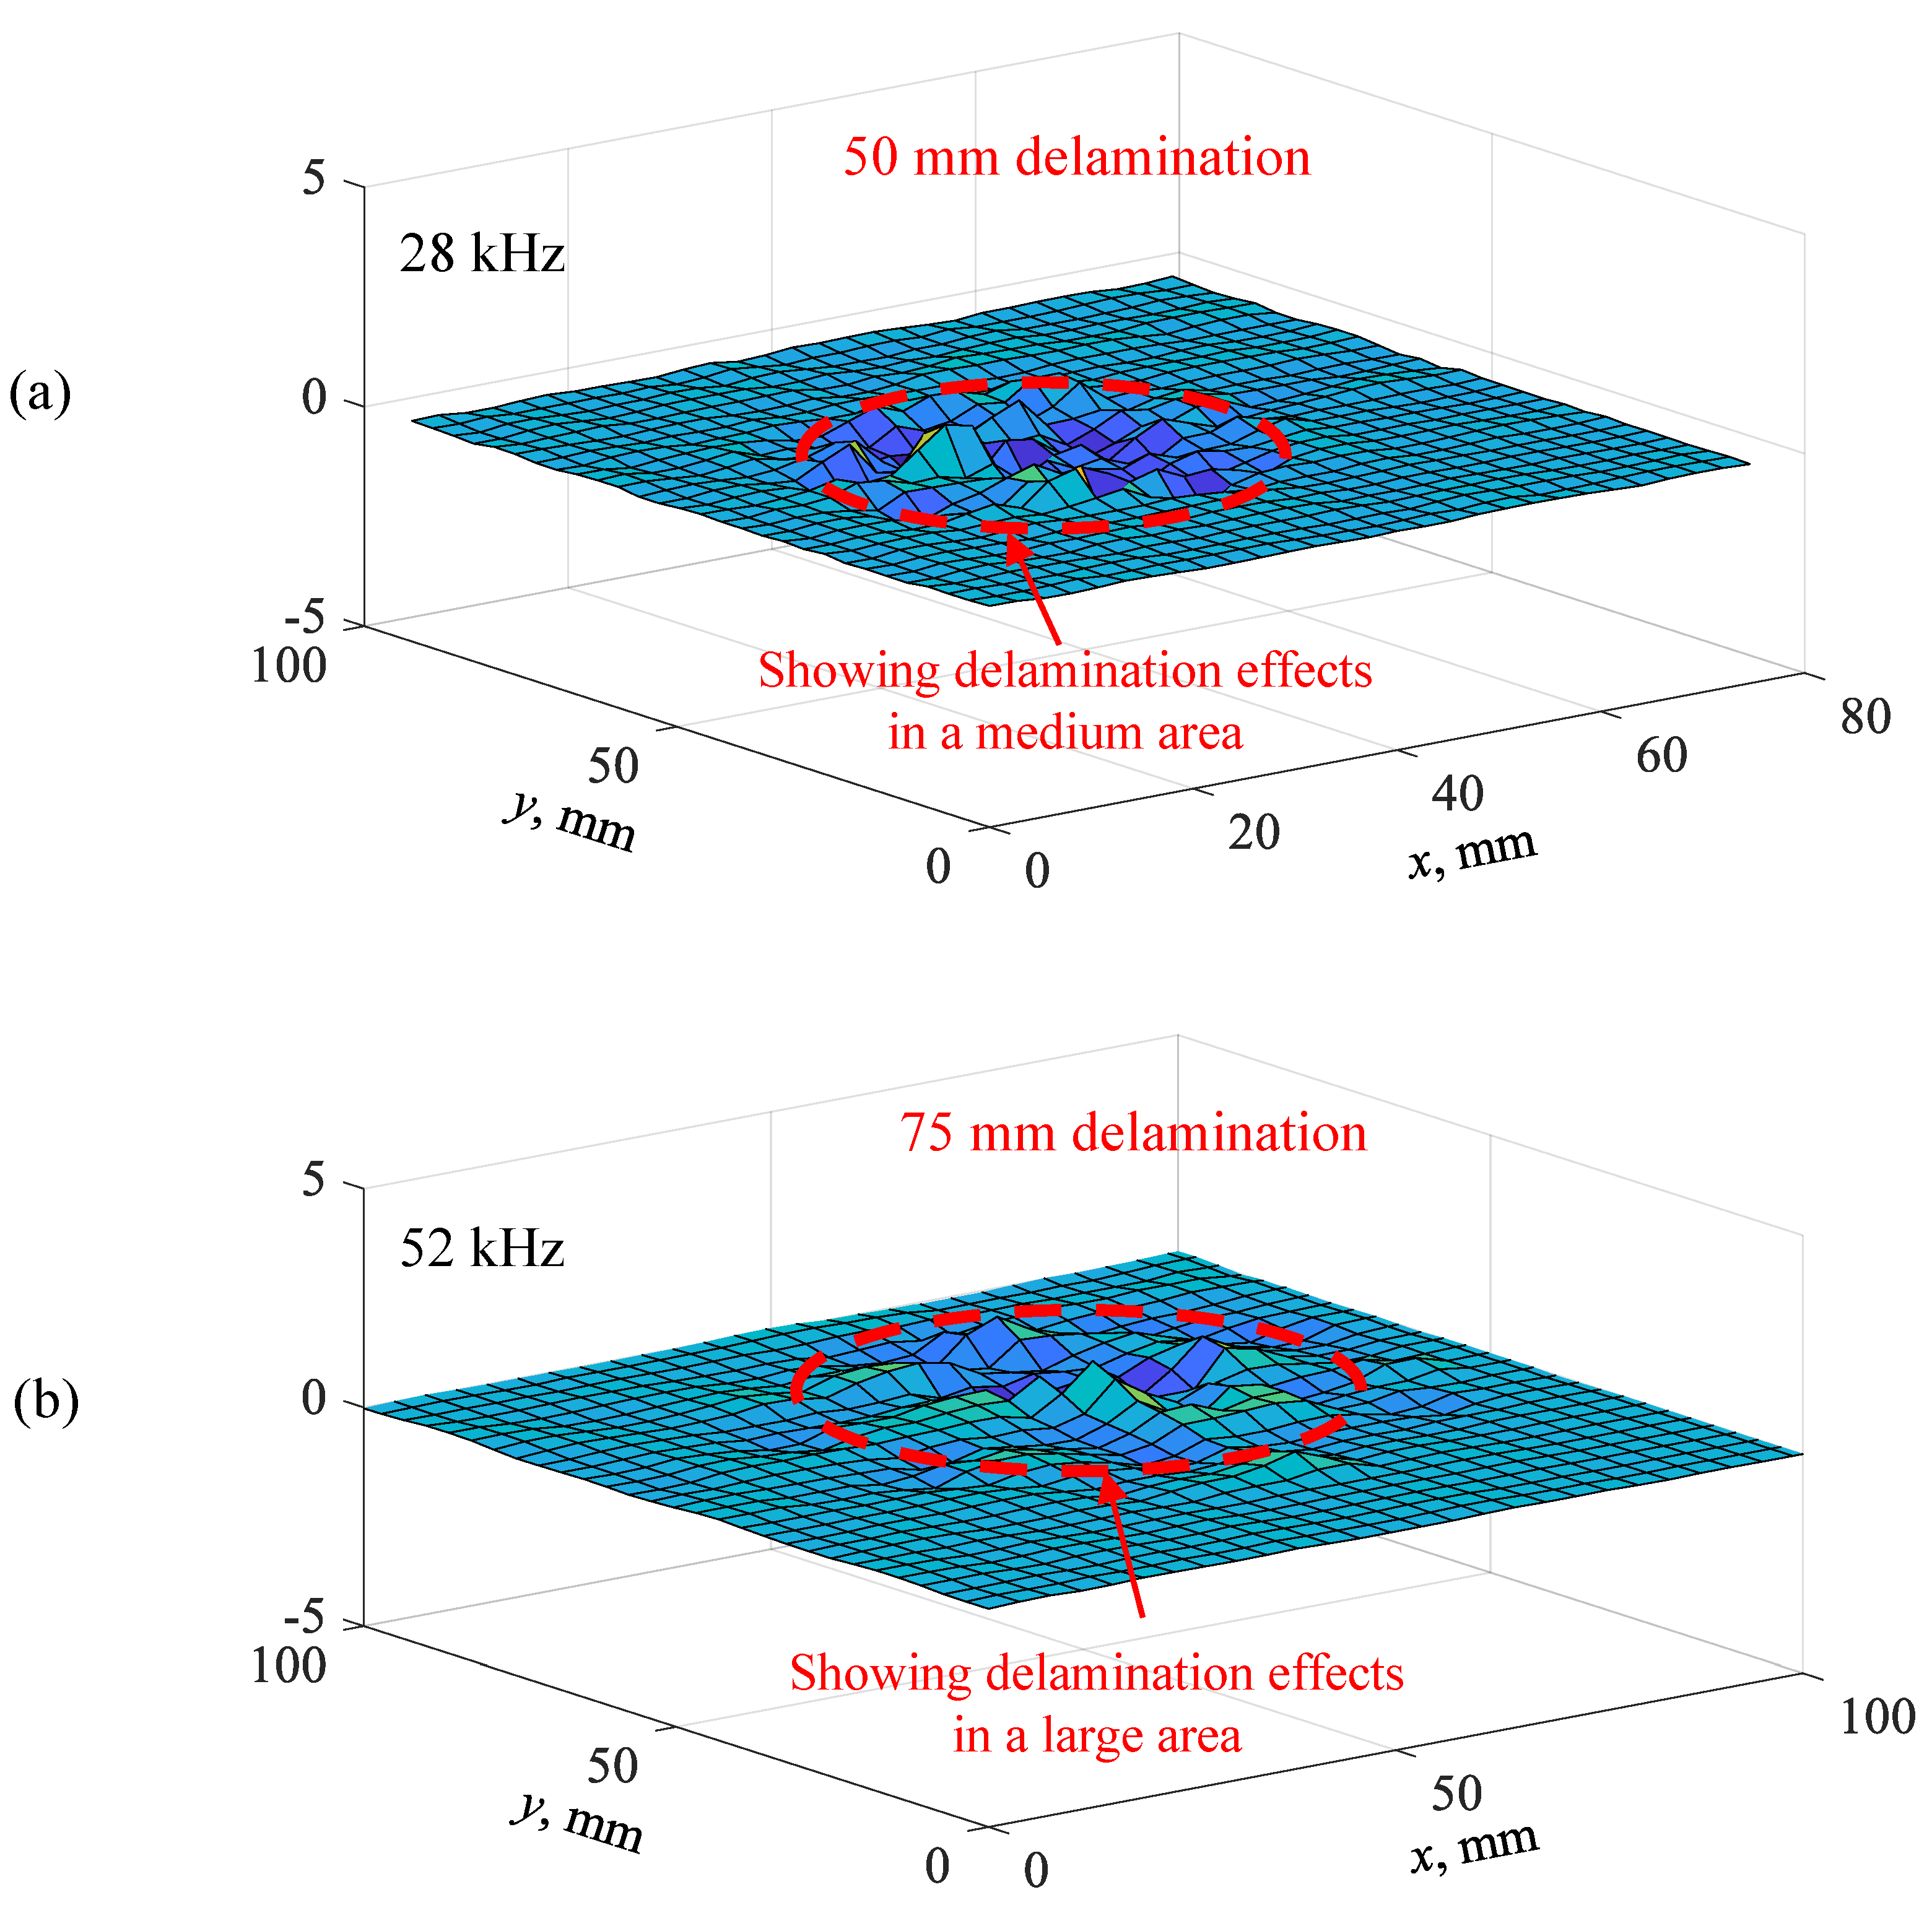
6.1. Delamination Detection on the Cross-Ply Composite Plate
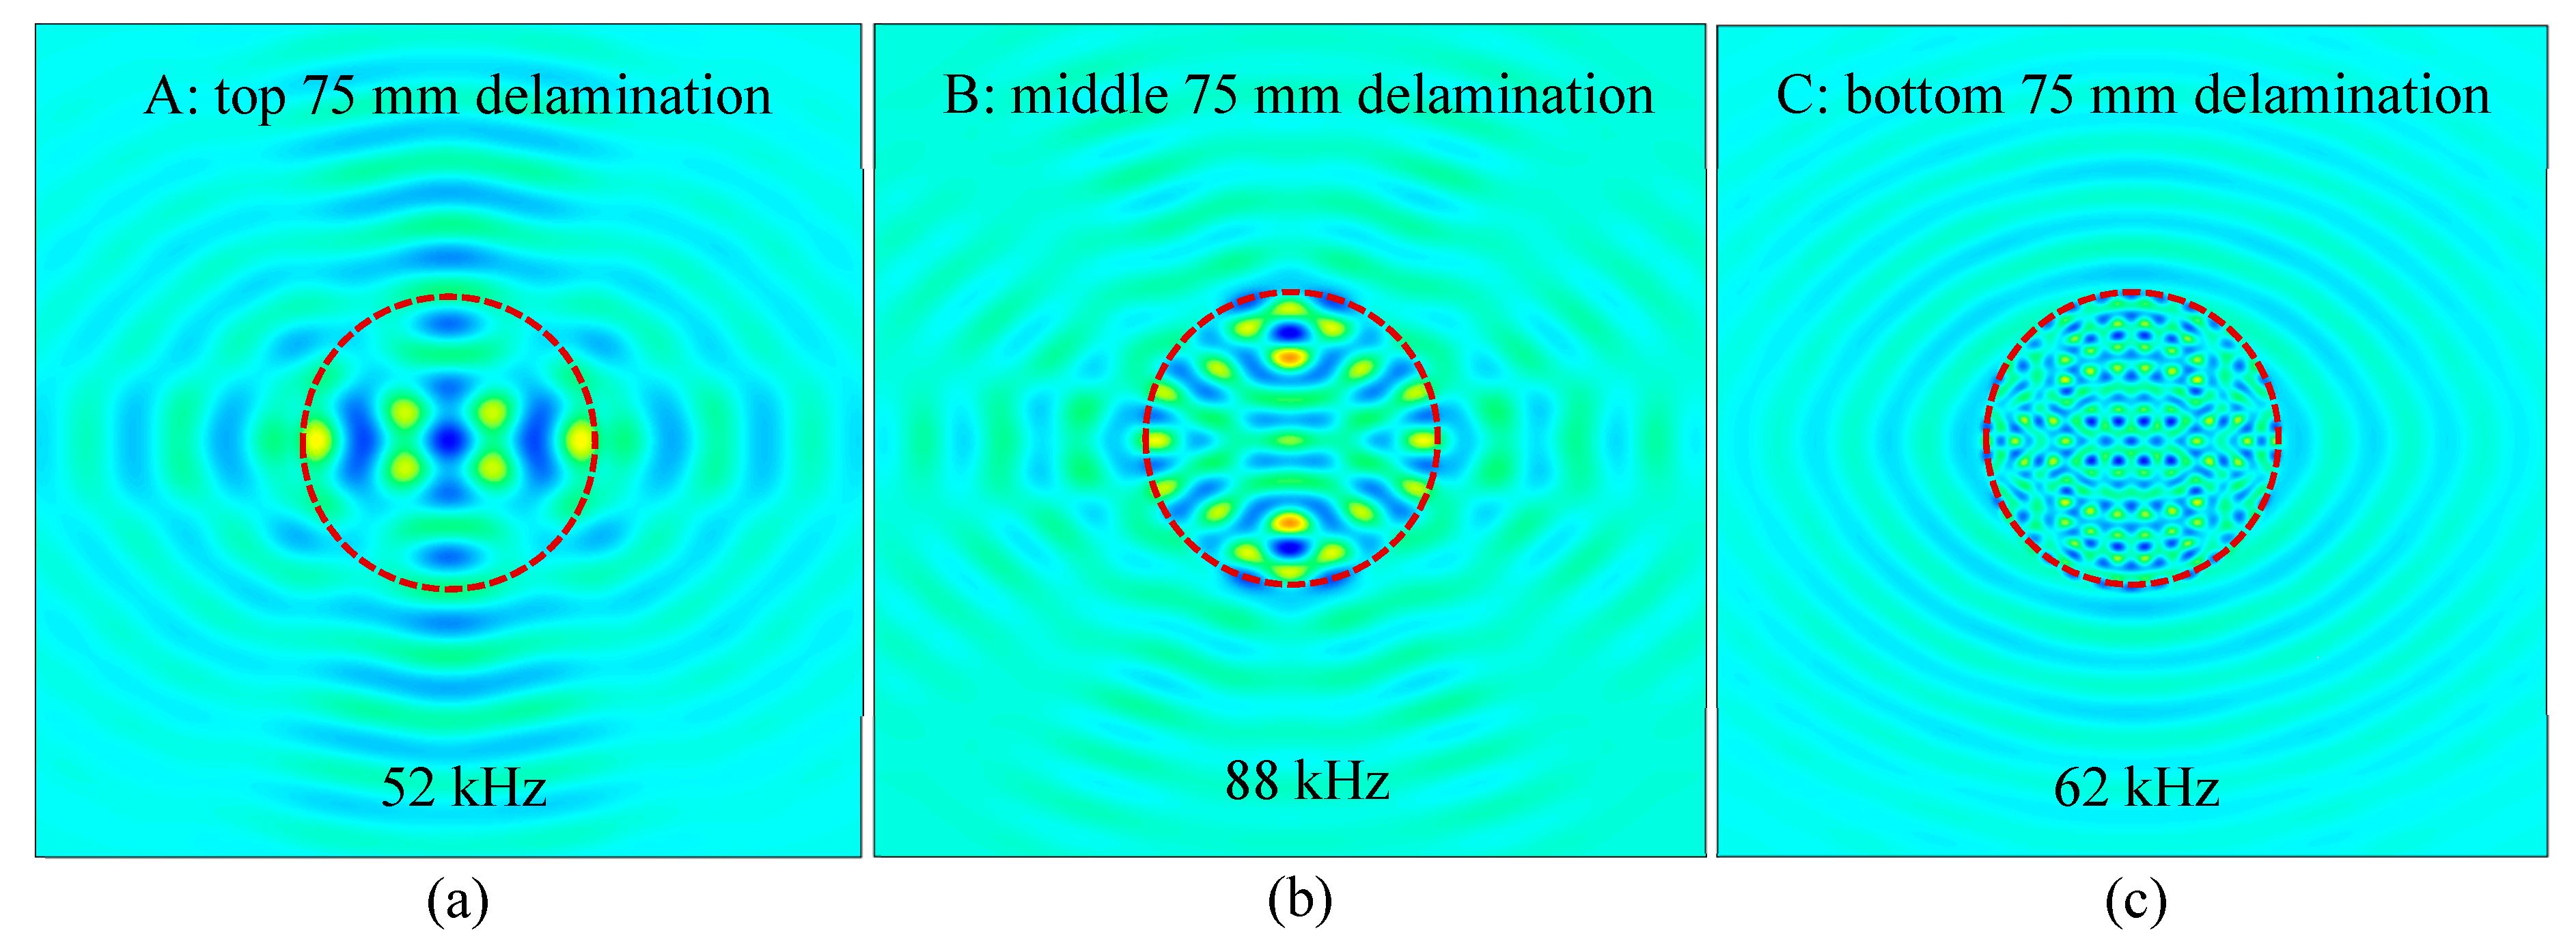
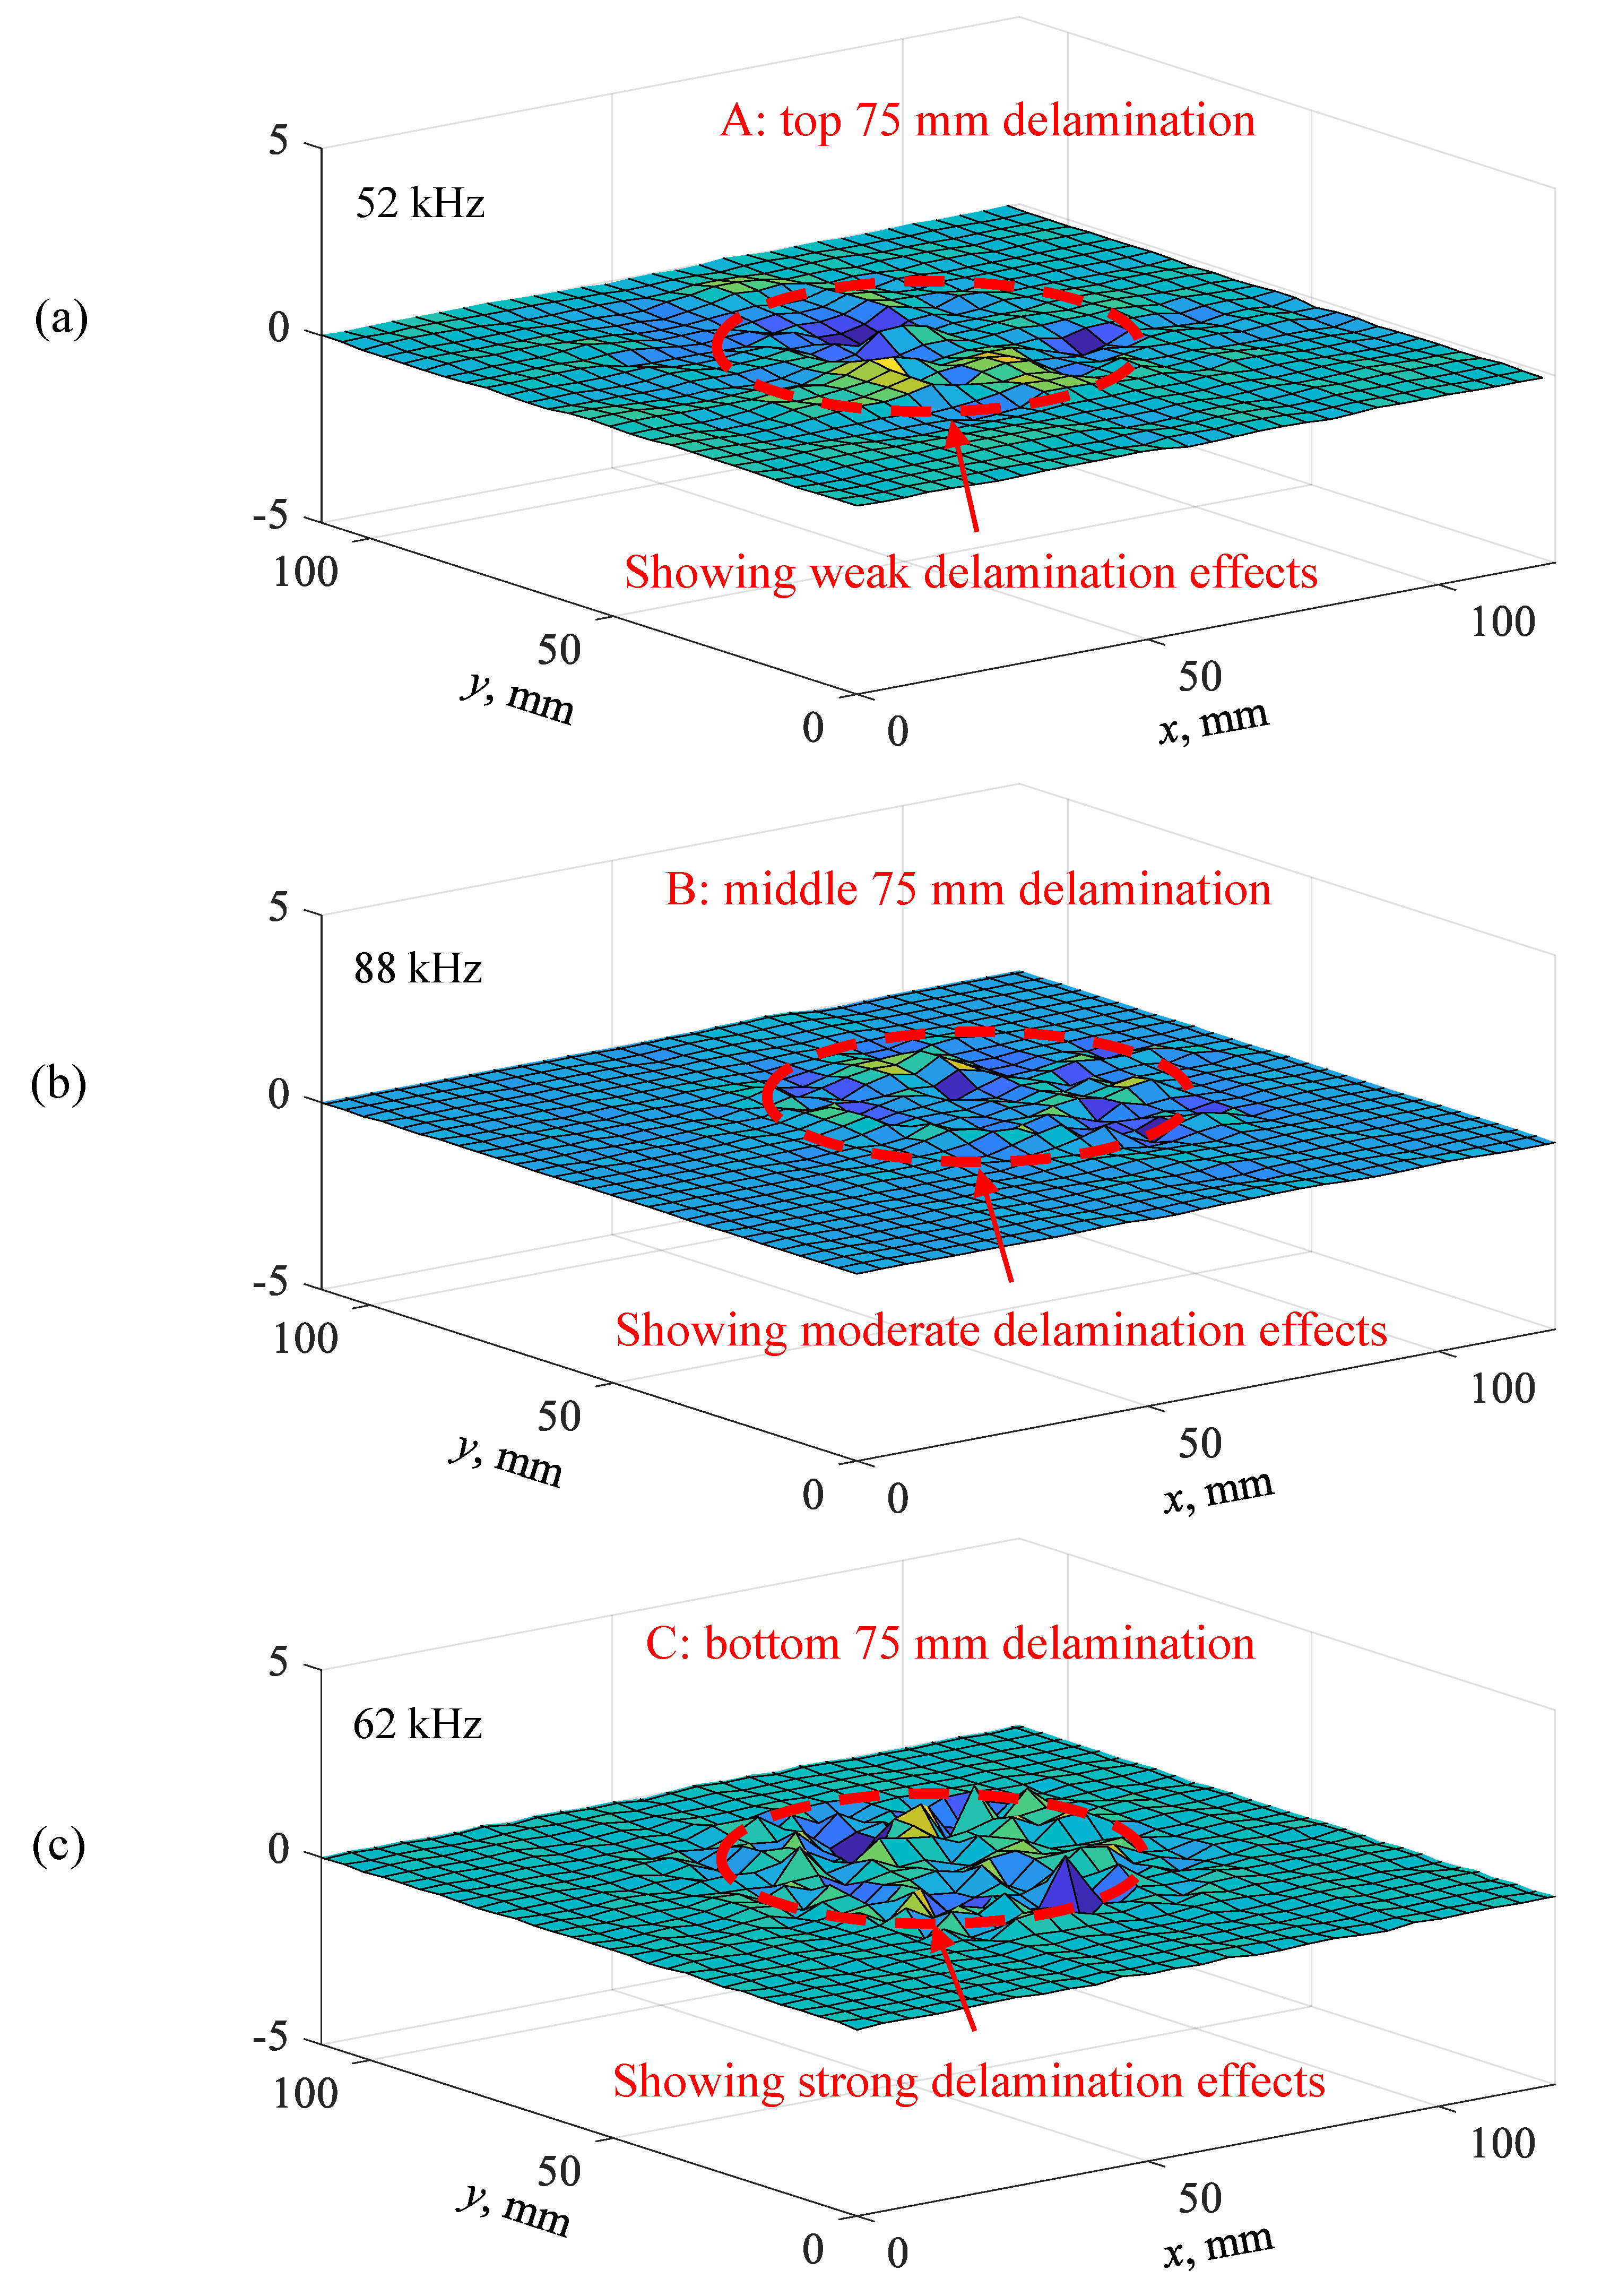
6.2. Delamination Detection on the Unidirectional Composite Plate
7. Conclusions
Author Contributions
Funding
Conflicts of Interest
References
- Giurgiutiu, V. Structural Health Monitoring of Aerospace Composites; Elsevier Academic Press, 2016; Available online: https://www.sciencedirect.com/book/9780124096059/structural-health-monitoring-of-aerospace-composites (accessed on 11 April 2019).
- Zou, Y.; Tong, L.P.S.G.; Steven, G.P. Vibration-based model-dependent damage (delamination) identification and health monitoring for composite structures—A review. J. Sound Vib. 2000, 230, 357–378. [Google Scholar] [CrossRef]
- Flores, M.; Mollenhauer, D.; Runatunga, V.; Beberniss, T.; Rapking, D.; Pankow, M. High-speed 3D digital image correlation of low-velocity impacts on composite plates. Compos. Part Eng. 2017, 131, 153–164. [Google Scholar] [CrossRef]
- Gomes, G.F.; Mendéz, Y.A.D.; Alexandrino, P.D.S.L.; da Cunha, S.S.; Ancelotti, A.C. The use of intelligent computational tools for damage detection and identification with an emphasis on composites—A review. Compos. Struct. 2018, 196, 44–54. [Google Scholar] [CrossRef]
- Mei, H.; Giurgiutiu, V. Guided wave excitation and propagation in damped composite plates. Struct. Health Monit. 2018. [Google Scholar] [CrossRef]
- Cheng, L.; Tian, G.Y. Comparison of nondestructive testing methods on detection of delaminations in composites. J. Sens. 2012. [Google Scholar] [CrossRef]
- Wallentine, S.M.; Uchic, M.D. A study on ground truth data for impact damaged polymer matrix composites. AIP Conf. Proc. 2018, 1949, 120002. [Google Scholar]
- Farrar, C.R.; Worden, K. An introduction to structural health monitoring. Philos. Trans. R. Soc. Math. Phys. Eng. Sci. 2006, 365, 303–315. [Google Scholar] [CrossRef]
- Su, Z.; Ye, L.; Lu, Y. Guided Lamb waves for identification of damage in composite structures: A review. J. Sound Vib. 2006, 295, 753–780. [Google Scholar] [CrossRef]
- Mei, H.; Yuan, S.; Qiu, L.; Zhang, J. Damage evaluation by a guided wave-hidden Markov model based method. Smart Mater. Struct. 2016, 25, 025021. [Google Scholar] [CrossRef]
- Mitra, M.; Gopalakrishnan, S. Guided wave based structural health monitoring: A review. Smart Mater. Struct. 2016, 25, 053001. [Google Scholar] [CrossRef]
- Giurgiutiu, V. Structural Health Monitoring with Piezoelectric Wafer Active Sensors, 2nd ed.; Elsevier Academic Press, 2014; Available online: https://www.sciencedirect.com/book/9780124186910/structural-health-monitoring-with-piezoelectric-wafer-active-sensors (accessed on 11 April 2019).
- Bois, C.; Hochard, C. Monitoring of laminated composites delamination based on electro-mechanical impedance measurement. J. Intell. Mater. Syst. Struct. 2014, 15, 59–67. [Google Scholar] [CrossRef]
- Gresil, M.; Yu, L.; Giurgiutiu, V.; Sutton, M. Predictive modeling of electromechanical impedance spectroscopy for composite materials. Struct. Health Monit. 2012, 11, 671–683. [Google Scholar] [CrossRef]
- Scholey, J.J.; Wilcox, P.D.; Wisnom, M.R.; Friswell, M.I. Quantitative experimental measurements of matrix cracking and delamination using acoustic emission. Compos. Part Appl. Sci. Manuf. 2010, 41, 612–623. [Google Scholar] [CrossRef]
- Nikbakht, M.; Yousefi, J.; Hosseini-Toudeshky, H.; Minak, G. Delamination evaluation of composite laminates with different interface fiber orientations using acoustic emission features and micro visualization. Compos. Part Eng. 2017, 113, 185–196. [Google Scholar] [CrossRef]
- Mei, H.; Haider, M.F.; Joseph, R.; Migot, A.; Giurgiutiu, V. Recent Advances in Piezoelectric Wafer Active Sensors for Structural Health Monitoring Applications. Sensors 2019, 19, 383. [Google Scholar] [CrossRef]
- Shen, Y.; Cesnik, C.E. Hybrid local FEM/global LISA modeling of damped guided wave propagation in complex composite structures. Smart Mater. Struct. 2016, 25, 095021. [Google Scholar] [CrossRef]
- Sohn, H.; Dutta, D.; Yang, J.Y.; Park, H.J.; DeSimio, M.; Olson, S.; Swenson, E. Delamination detection in composites through guided wave field image processing. Compos. Sci. Technol. 2011, 71, 1250–1256. [Google Scholar] [CrossRef]
- Park, B.; An, Y.K.; Sohn, H. Visualization of hidden delamination and debonding in composites through noncontact laser ultrasonic scanning. Compos. Sci. Technol. 2014, 100, 10–18. [Google Scholar] [CrossRef]
- Girolamo, D.; Chang, H.Y.; Yuan, F.G. Impact damage visualization in a honeycomb composite panel through laser inspection using zero-lag cross-correlation imaging condition. Ultrasonics 2018, 87, 152–165. [Google Scholar] [CrossRef] [PubMed]
- Rogge, M.D.; Leckey, C.A. Characterization of impact damage in composite laminates using guided wavefield imaging and local wavenumber domain analysis. Ultrasonics 2013, 53, 1217–1226. [Google Scholar] [CrossRef]
- Tian, Z.; Yu, L.; Leckey, C. Delamination detection and quantification on laminated composite structures with Lamb waves and wavenumber analysis. J. Intell. Mater. Syst. Struct. 2015, 26, 1723–1738. [Google Scholar] [CrossRef]
- Kudela, P.; Radzienski, M.; Ostachowicz, W. Impact induced damage assessment by means of Lamb wave image processing. Mech. Syst. Signal Process. 2018, 102, 23–36. [Google Scholar] [CrossRef]
- Sikdar, S.; Fiborek, P.; Kudela, P.; Banerjee, S.; Ostachowicz, W. Effects of debonding on Lamb wave propagation in a bonded composite structure under variable temperature conditions. Smart Mater. Struct. 2018, 28, 015021. [Google Scholar] [CrossRef]
- Sikdar, S.; Ostachowicz, W. Nondestructive analysis of core-junction and joint-debond effects in advanced composite structure. Polym. Test. 2019, 73, 31–38. [Google Scholar] [CrossRef]
- Sikdar, S.; Ostachowicz, W. Ultrasonic Lamb wavebased debonding monitoring of advanced honeycomb sandwich composite structures. Strain 2019, 55, e12302. [Google Scholar] [CrossRef]
- Sikdar, S.; Banerjee, S. Structural Health Monitoring of Advanced Composites Using Guided Waves; Lap Lambert Academic Publisher: Beau-Bassin, Mauritius, 2017. [Google Scholar]
- Fan, W.; Qiao, P. Vibration-based damage identification methods: A review and comparative study. Struct. Health Monit. 2011, 10, 83–111. [Google Scholar] [CrossRef]
- Shang, S.; Yun, G.J.; Qiao, P. Delamination identification of laminated composite plates using a continuum damage mechanics model and subset selection technique. Smart Mater. Struct. 2010, 19, 055024. [Google Scholar] [CrossRef]
- Klepka, A.; Pieczonka, L.; Staszewski, W.J.; Aymerich, F. Impact damage detection in laminated composites by non-linear vibro-acoustic wave modulations. Compos. Part Eng. 2014, 65, 99–108. [Google Scholar] [CrossRef]
- Ooijevaar, T.H.; Warnet, L.L.; Loendersloot, R.; Akkerman, R.; Tinga, T. Impact damage identification in composite skin-stiffener structures based on modal curvatures. Struct. Control Health Monit. 2016, 23, 198–217. [Google Scholar]
- Garcia, D.; Palazzetti, R.; Trendafilova, I.; Fiorini, C.; Zucchelli, A. Vibration-based delamination diagnosis and modelling for composite laminate plates. Compos. Struct. 2015, 130, 155–162. [Google Scholar] [CrossRef] [Green Version]
- Gaudenzi, P.; Nardi, D.; Chiappetta, I.; Atek, S.; Lampani, L.; Pasquali, M.; Valente, T. Sparse sensing detection of impact-induced delaminations in composite laminates. Compos. Struct. 2015, 133, 1209–1219. [Google Scholar] [CrossRef]
- Yang, C.; Oyadiji, S.O. Delamination detection in composite laminate plates using 2D wavelet analysis of modal frequency surface. Comput. Struct. 2017, 179, 109–126. [Google Scholar] [CrossRef]
- Katunin, A. Vibration-based spatial damage identification in honeycomb-core sandwich composite structures using wavelet analysis. Compos. Struct. 2014, 118, 385–391. [Google Scholar] [CrossRef]
- Li, B.; Li, Z.; Zhou, J.; Ye, L.; Li, E. Damage localization in composite lattice truss core sandwich structures based on vibration characteristics. Compos. Struct. 2015, 126, 34–51. [Google Scholar] [CrossRef]
- Zhang, Z.; He, M.; Liu, A.; Singh, H.K.; Ramakrishnan, K.R.; Hui, D.; Shankar, K.; Morozov, E.V. Vibration-based assessment of delaminations in FRP composite plates. Compos. Part Eng. 2018, 144, 254–266. [Google Scholar] [CrossRef]
- Perez, M.A.; Gil, L.; Oller, S. Impact damage identification in composite laminates using vibration testing. Compos. Struct. 2014, 108, 267–276. [Google Scholar] [CrossRef]
- Chen, D.M.; Xu, Y.F.; Zhu, W.D. Non-Model-Based Identification of Delamination in Laminated Composite Plates Using a Continuously Scanning Laser Doppler Vibrometer System. J. Vib. Acoust. 2018, 140, 041001. [Google Scholar] [CrossRef]
- Qiao, P.; Lu, K.; Lestari, W.; Wang, J. Curvature mode shape-based damage detection in composite laminated plates. Compos. Struct. 2007, 80, 409–428. [Google Scholar] [CrossRef]
- Xu, W.; Cao, M.; Li, X.; Radzieński, M.; Ostachowicz, W.; Bai, R. Delamination monitoring in CFRP laminated plates under noisy conditions using complex-wavelet 2D curvature mode shapes. Smart Mater. Struct. 2017, 26, 104008. [Google Scholar] [CrossRef] [Green Version]
- Xu, W.; Fang, H.; Cao, M.; Zhou, L.; Wang, Q.; Ostachowicz, W. A noise-robust damage indicator for characterizing singularity of mode shapes for incipient delamination identification in CFRP laminates. Mech. Syst. Signal Process. 2019, 121, 183–200. [Google Scholar] [CrossRef]
- Solodov, I.; Bai, J.; Bekgulyan, S.; Busse, G. A local defect resonance to enhance acoustic wave-defect interaction in ultrasonic nondestructive evaluation. Appl. Phys. Lett. 2011, 99, 211911. [Google Scholar] [CrossRef]
- Solodov, I.; Rahammer, M.; Derusova, D.; Busse, G. Highly-efficient and noncontact vibro-thermography via local defect resonance. Quant. InfraRed Thermogr. J. 2015, 12, 98–111. [Google Scholar] [CrossRef]
- Rahammer, M.; Kreutzbruck, M. Fourier-transform vibrothermography with frequency sweep excitation utilizing local defect resonances. NDT Int. 2017, 86, 83–88. [Google Scholar] [CrossRef]
- Hettler, J.; Tabatabaeipour, M.; Delrue, S.; Van Den Abeele, K. Detection and characterization of local defect resonances arising from delaminations and flat bottom holes. J. Nondestruct. Eval. 2017, 36, 2. [Google Scholar] [CrossRef]
- Segers, J.; Kersemans, M.; Hedayatrasa, S.; Calderon, J.; Van Paepegem, W. Towards in-plane local defect resonance for non-destructive testing of polymers and composites. NDT Int. 2018, 98, 130–133. [Google Scholar] [CrossRef]
- Segers, J.; Hedayatrasa, S.; Verboven, E.; Poelman, G.; Van Paepegem, W.; Kersemans, M. In-plane local defect resonances for efficient vibrothermography of impacted carbon fiber-reinforced polymers (CFRP). NDT Int. 2019, 102, 218–225. [Google Scholar] [CrossRef]
- Roy, S.; Bose, T.; Debnath, K. Detection of local defect resonance frequencies using bicoherence analysis. J. Sound Vib. 2019, 443, 703–716. [Google Scholar] [CrossRef]
- RollerFORM Specifications. Available online: https://www.olympus-ims.com/en/rollerform/ (accessed on 15 December 2018).
- Shen, Y.; Giurgiutiu, V. Effective non-reflective boundary for Lamb waves: Theory, finite element implementation, and applications. Wave Motion 2015, 58, 22–41. [Google Scholar] [CrossRef] [Green Version]
- Gresil, M.; Giurgiutiu, V. Prediction of attenuated guided waves propagation in carbon fiber composites using Rayleigh damping model. J. Intell. Mater. Syst. Struct. 2015, 26, 2151–2169. [Google Scholar] [CrossRef]
- Murat, B.I.; Khalili, P.; Fromme, P. Scattering of guided waves at delaminations in composite plates. J. Acoust. Soc. Am. 2016, 139, 3044–3052. [Google Scholar] [CrossRef] [Green Version]
- Moser, F.; Jacobs, L.J.; Qu, J. Modeling elastic wave propagation in waveguides with the finite element method. NDT Int. 1999, 32, 225–234. [Google Scholar] [CrossRef]


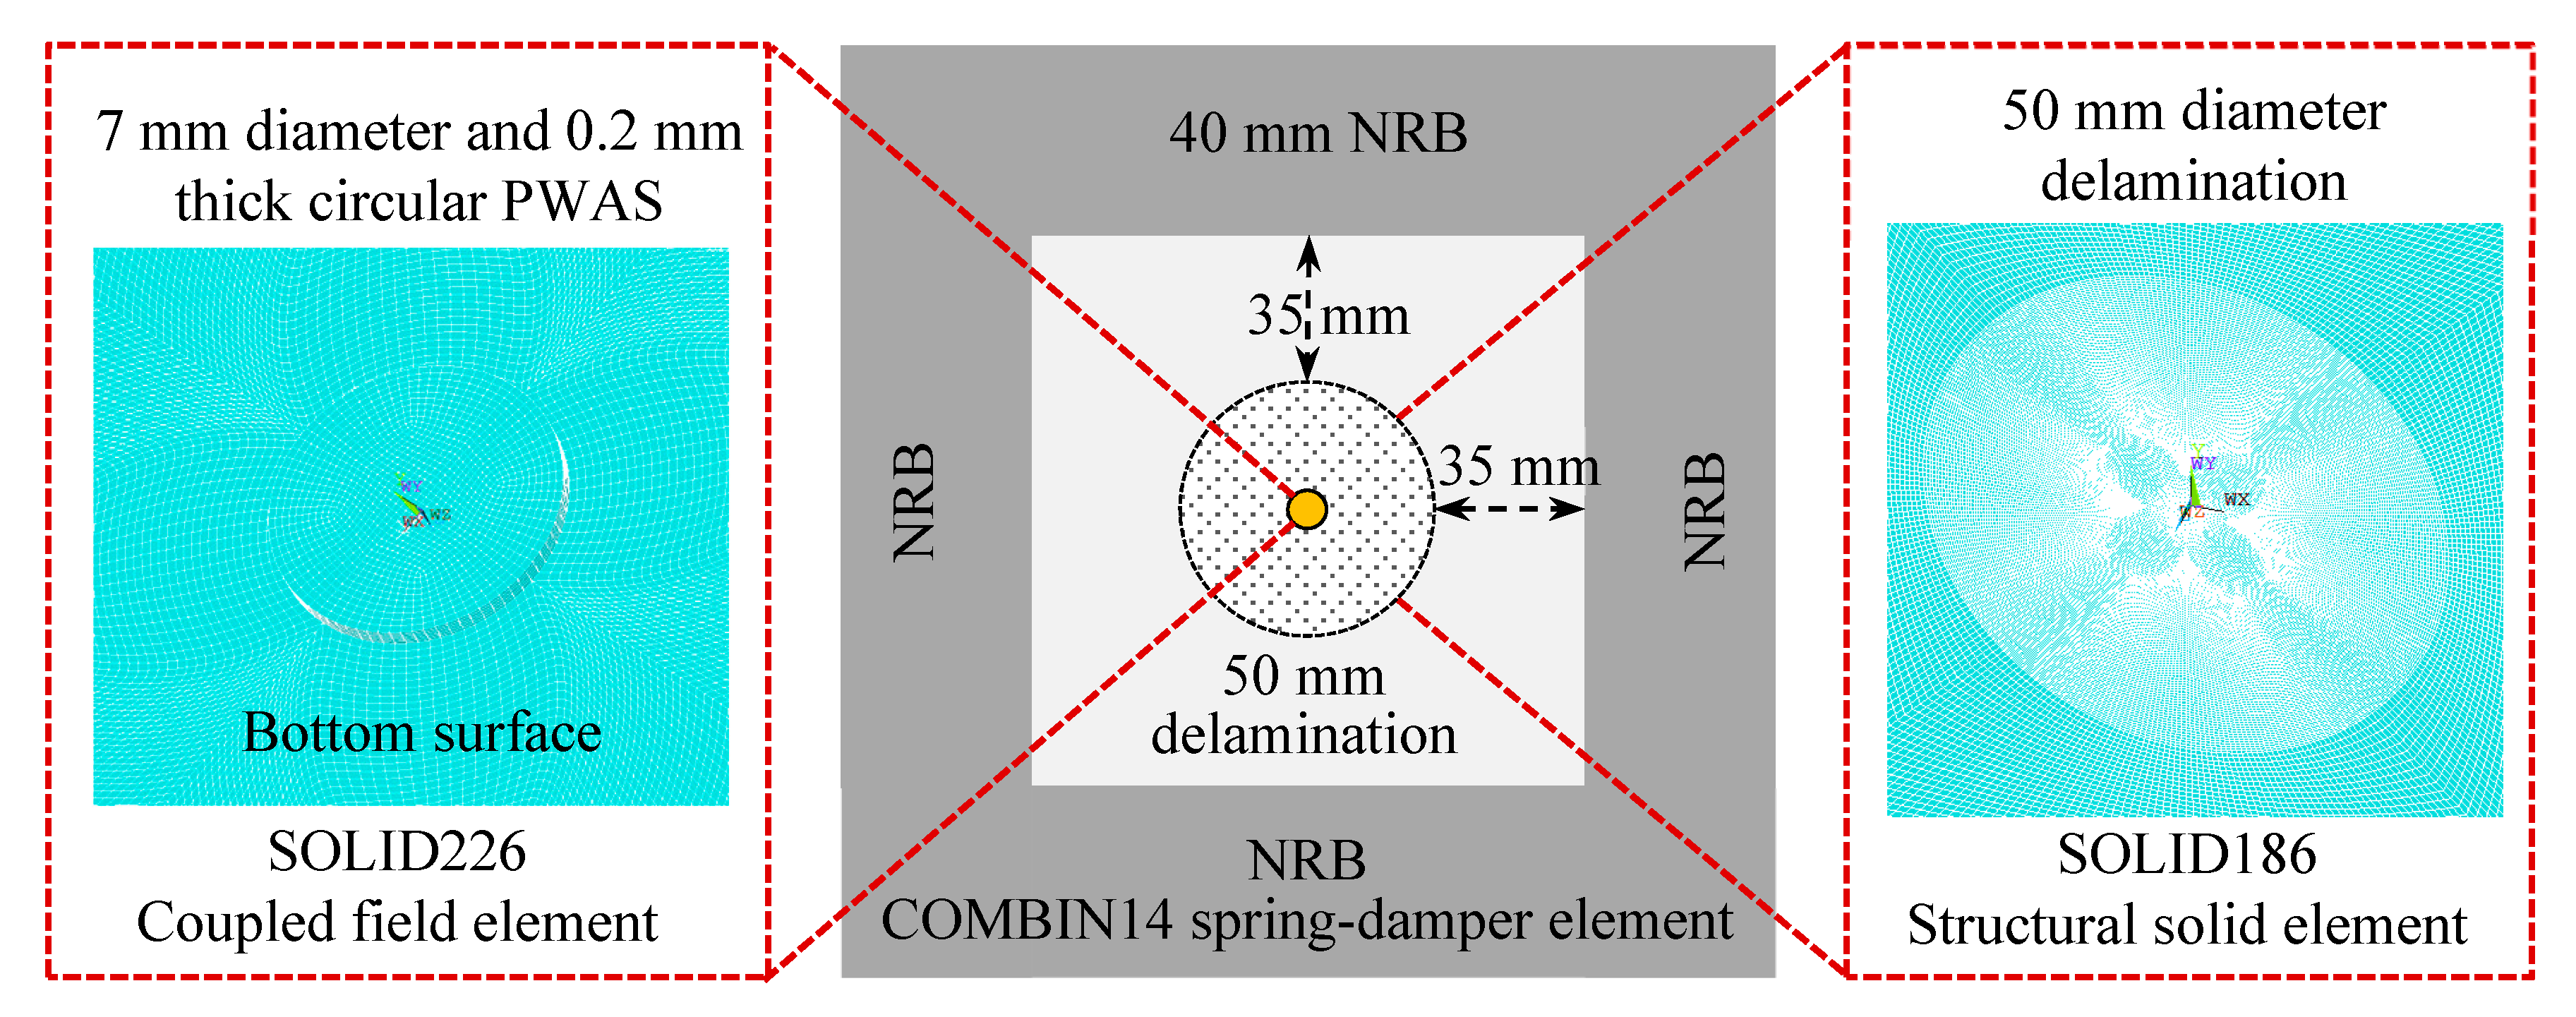
| E11 | E22 | E33 | ν12 | ν13 | ν23 | G12 | G13 | G23 | ρ |
|---|---|---|---|---|---|---|---|---|---|
| 140.8 GPa | 11.3 GPa | 11.3 GPa | 0.31 | 0.31 | 0.5 | 5.7 GPa | 5.7 GPa | 3.4 GPa | 1640 kg/m3 |
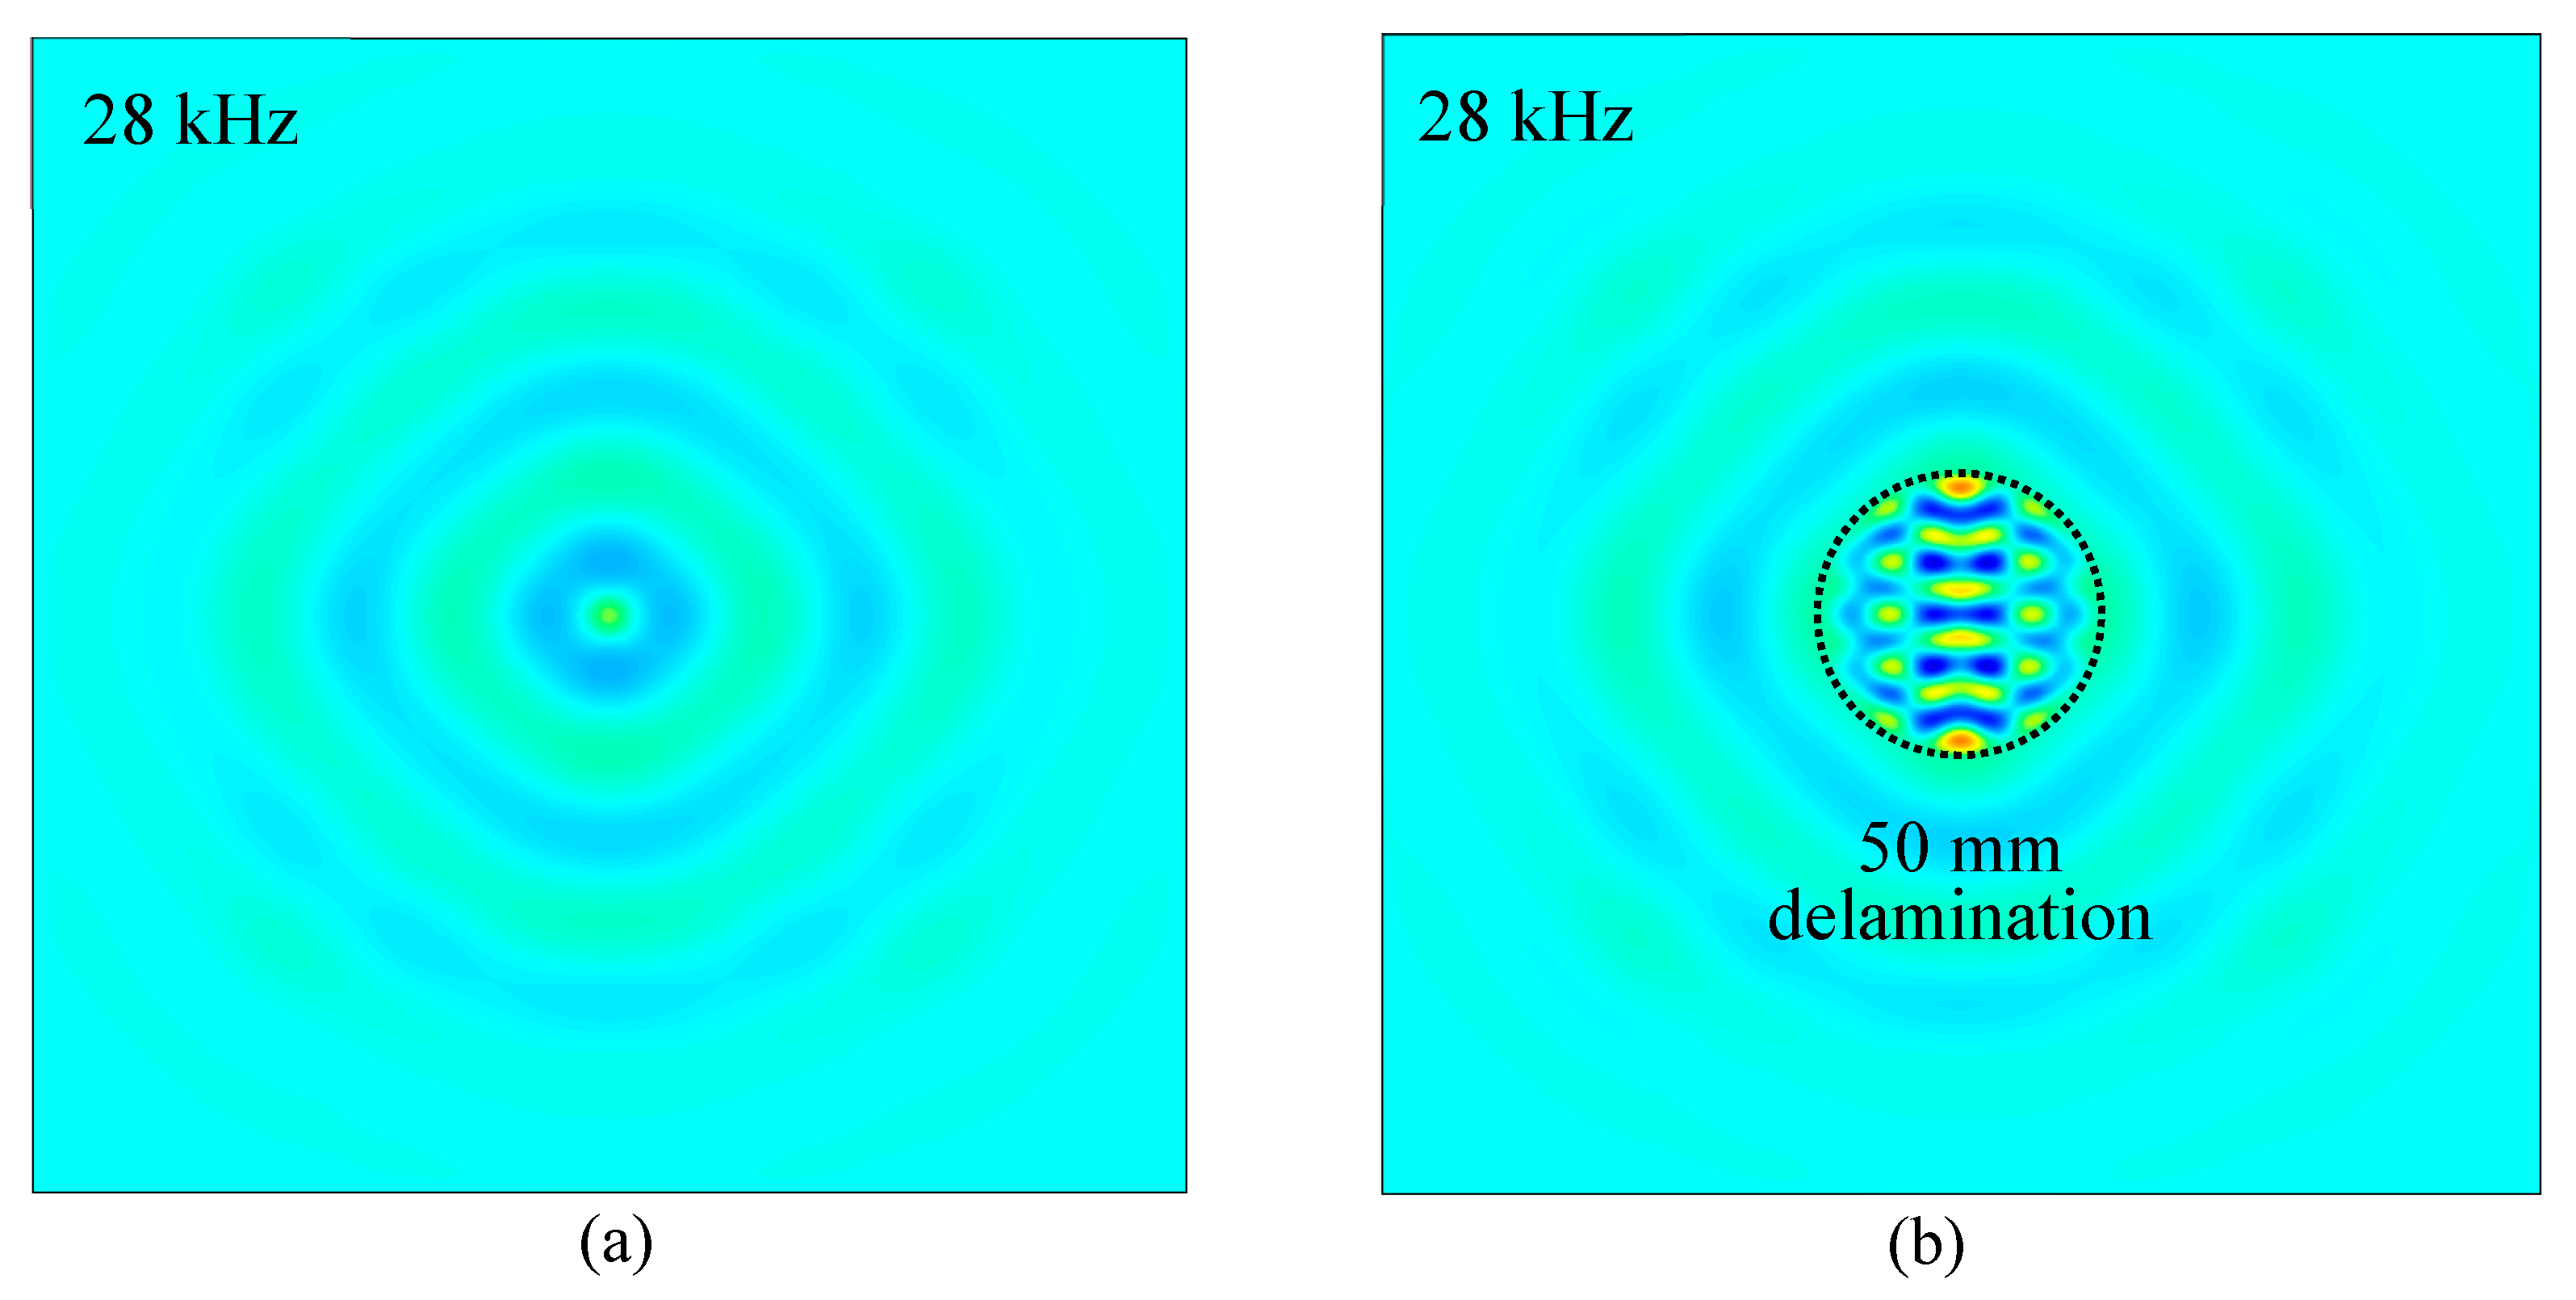
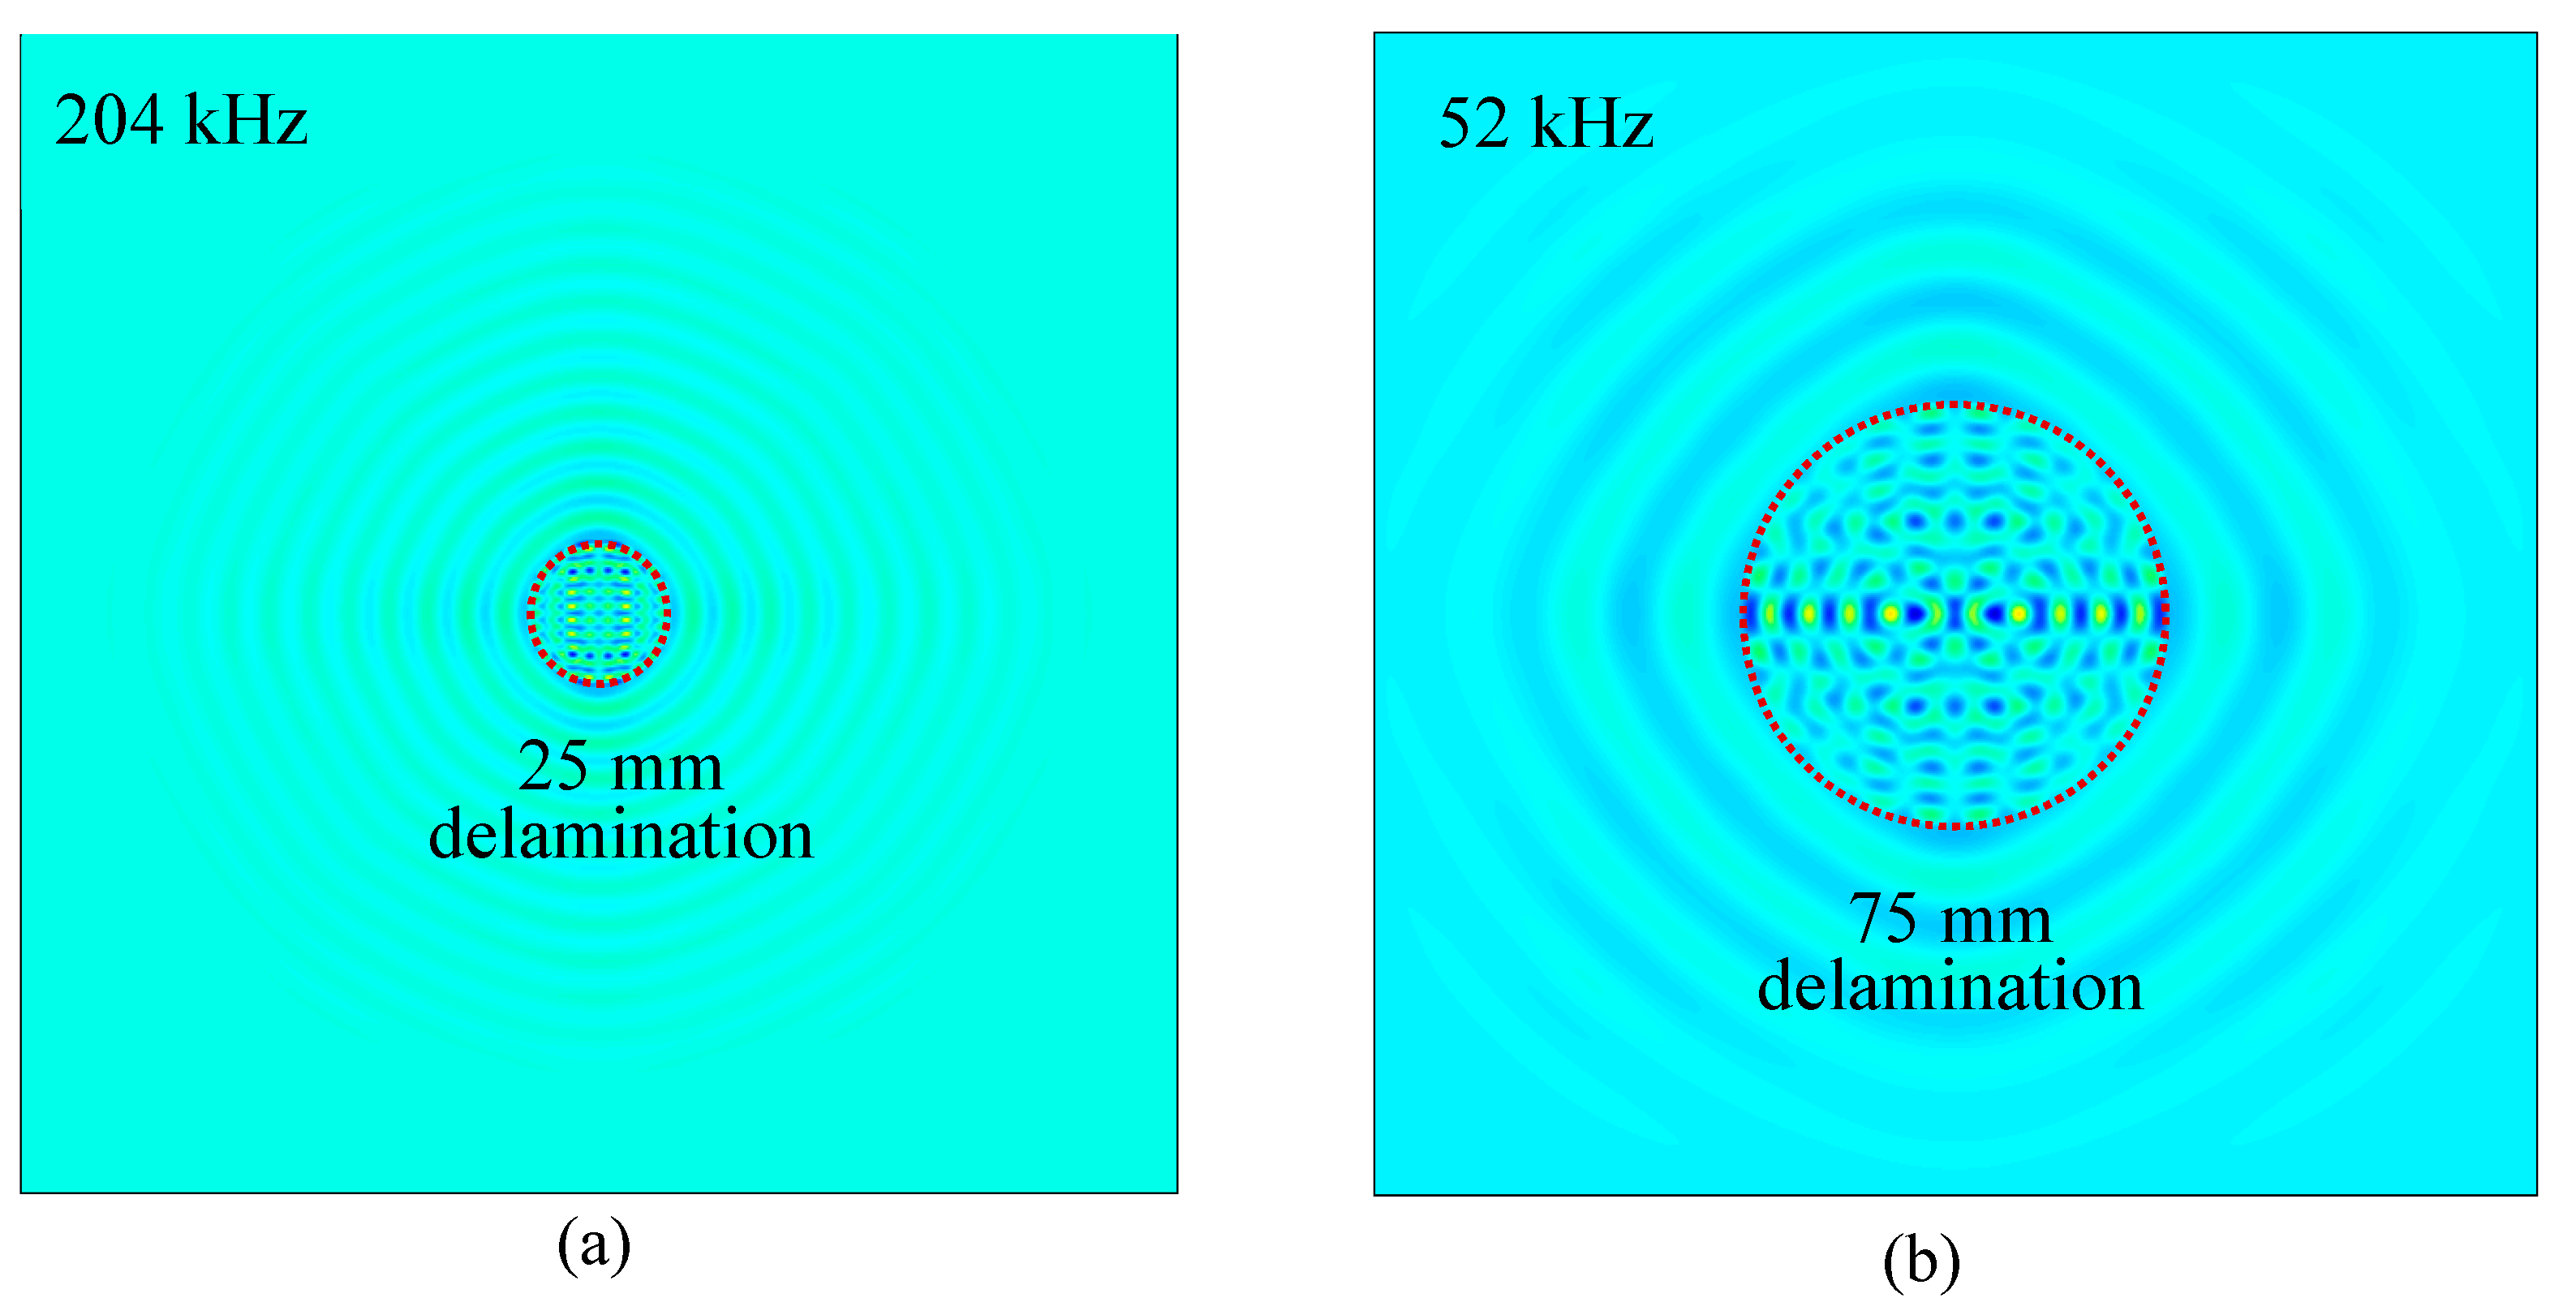
| Delaminations | 25 mm | 50 mm | 75 mm |
| Resonance Frequency (kHz) | 99, 204 | 28 | 52 |
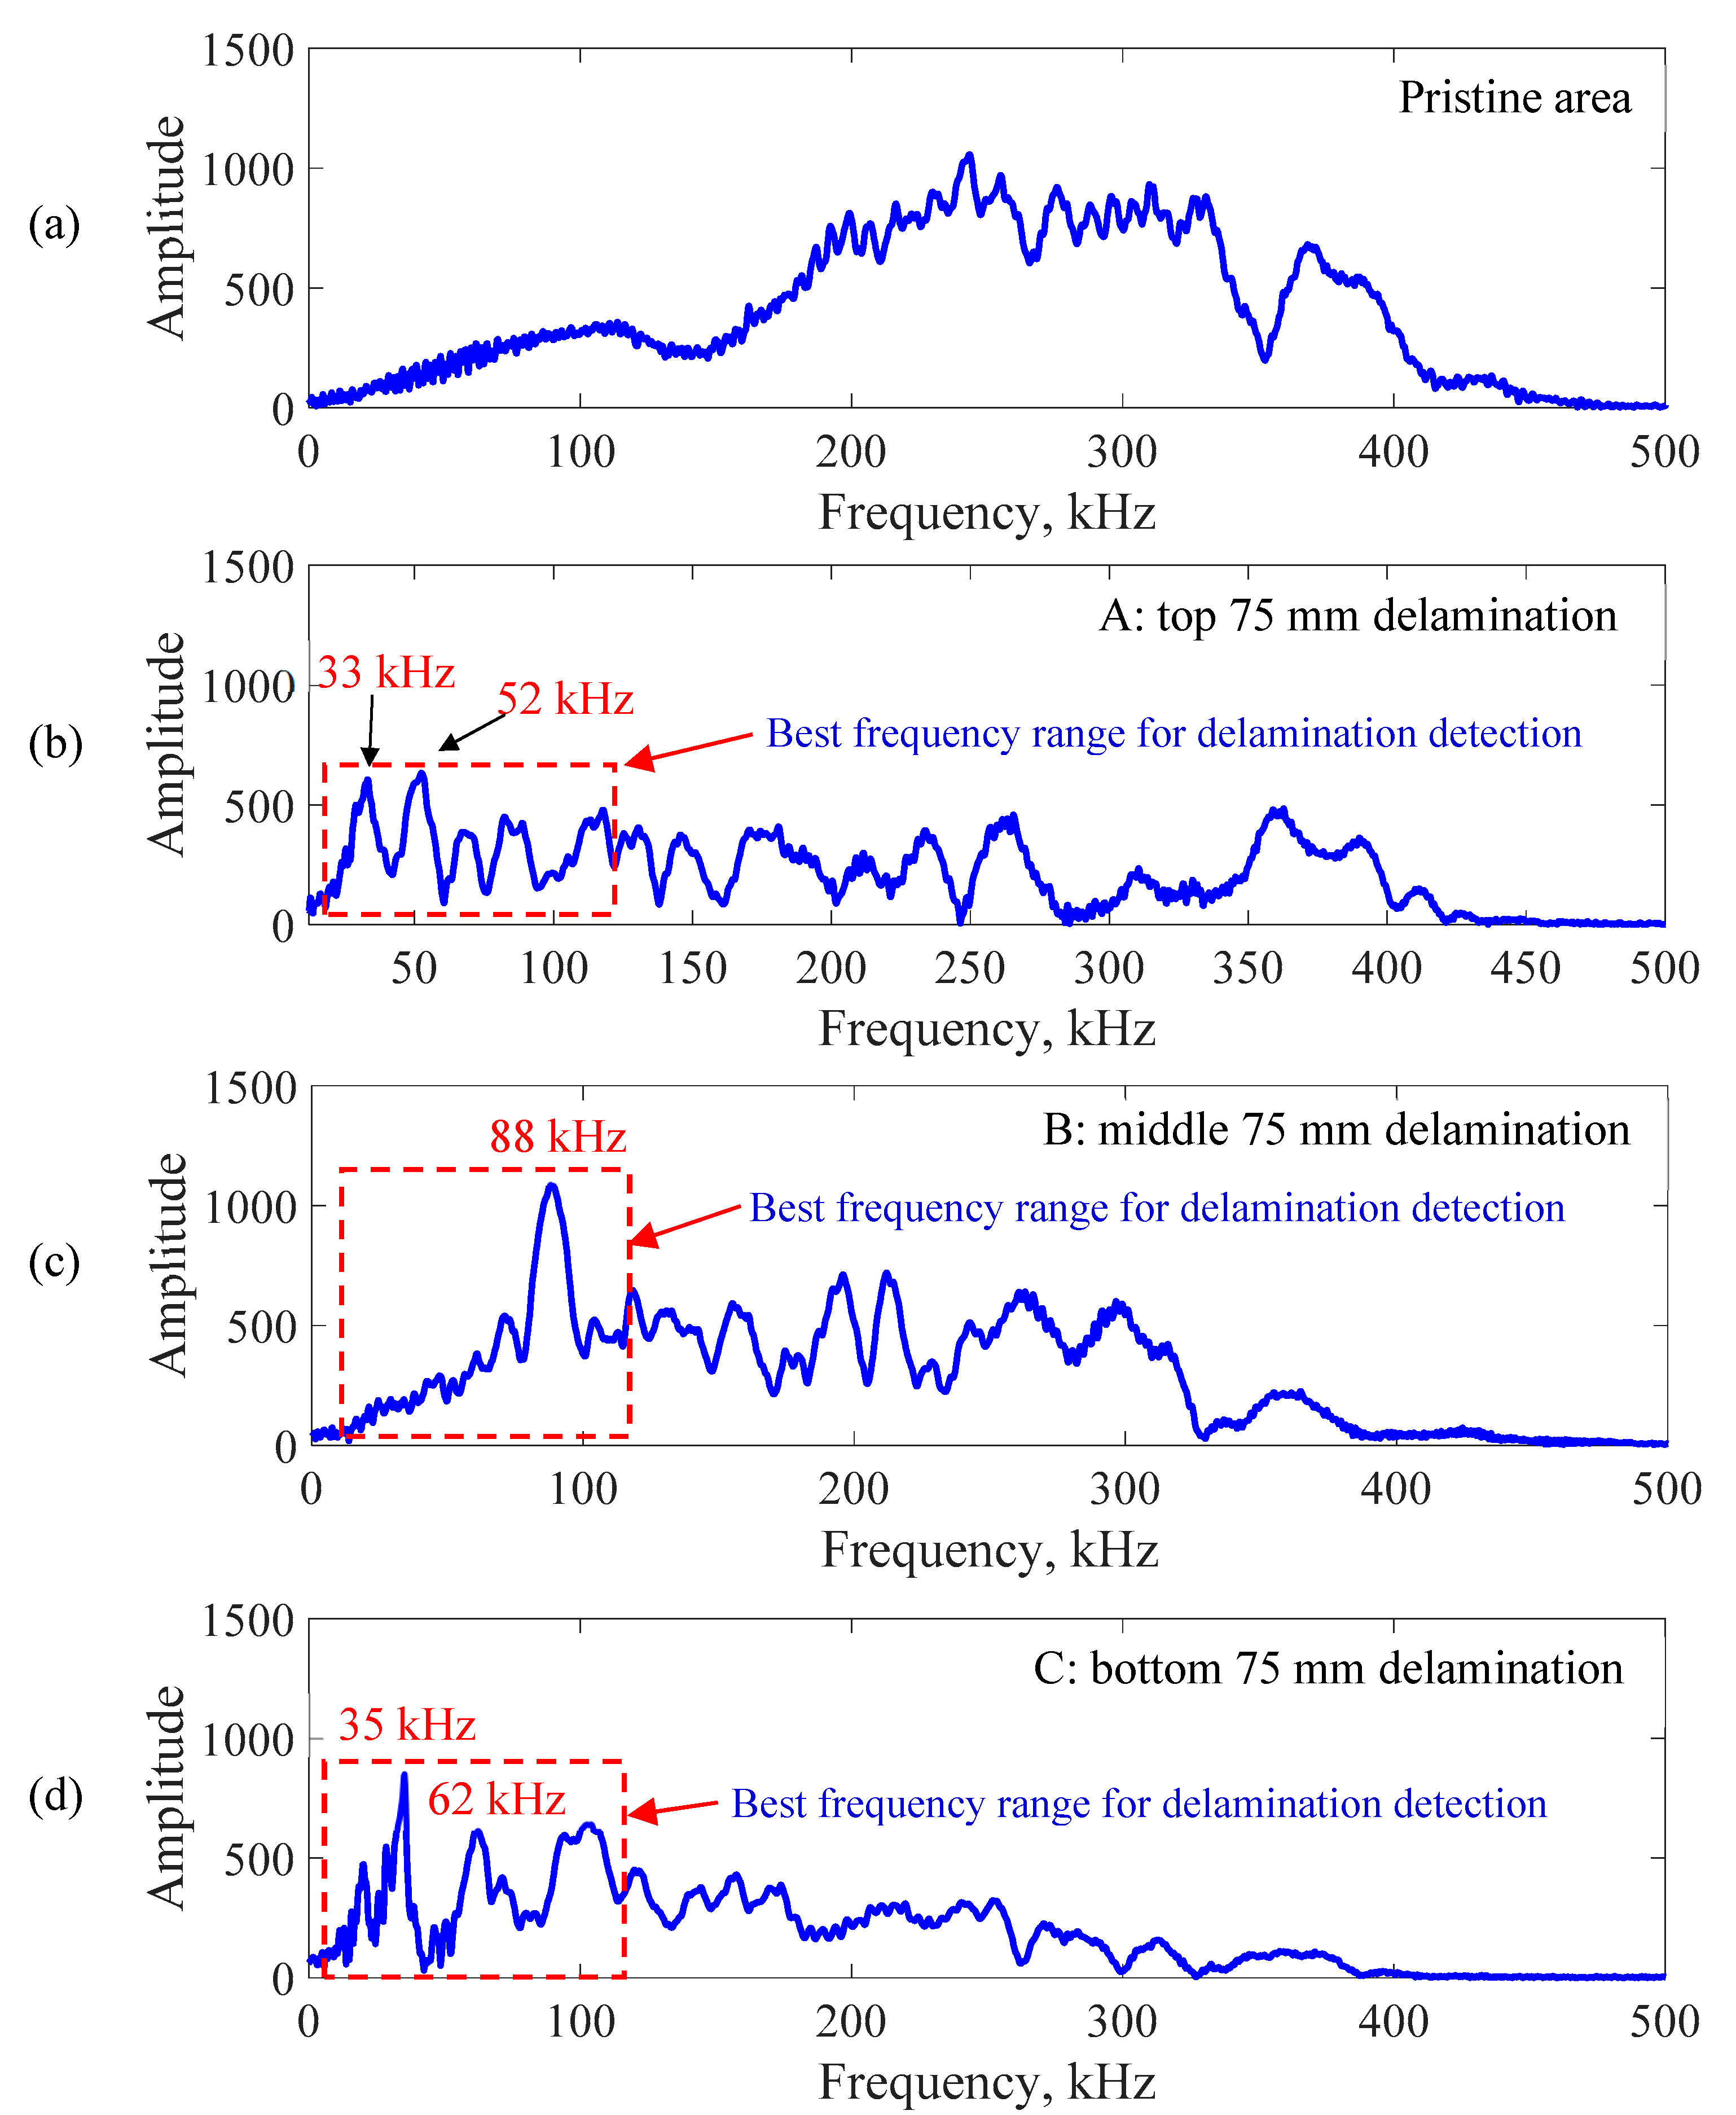
| Delaminations | Top | Middle | Bottom |
| Resonance Frequency (kHz) | 33, 52 | 88 | 35, 62 |
© 2019 by the authors. Licensee MDPI, Basel, Switzerland. This article is an open access article distributed under the terms and conditions of the Creative Commons Attribution (CC BY) license (http://creativecommons.org/licenses/by/4.0/).
Share and Cite
Mei, H.; Migot, A.; Haider, M.F.; Joseph, R.; Bhuiyan, M.Y.; Giurgiutiu, V. Vibration-Based In-Situ Detection and Quantification of Delamination in Composite Plates. Sensors 2019, 19, 1734. https://doi.org/10.3390/s19071734
Mei H, Migot A, Haider MF, Joseph R, Bhuiyan MY, Giurgiutiu V. Vibration-Based In-Situ Detection and Quantification of Delamination in Composite Plates. Sensors. 2019; 19(7):1734. https://doi.org/10.3390/s19071734
Chicago/Turabian StyleMei, Hanfei, Asaad Migot, Mohammad Faisal Haider, Roshan Joseph, Md Yeasin Bhuiyan, and Victor Giurgiutiu. 2019. "Vibration-Based In-Situ Detection and Quantification of Delamination in Composite Plates" Sensors 19, no. 7: 1734. https://doi.org/10.3390/s19071734