Permafrost Deformation Monitoring Along the Qinghai-Tibet Plateau Engineering Corridor Using InSAR Observations with Multi-Sensor SAR Datasets from 1997–2018

Abstract
:1. Introduction
2. Study Area and Datasets
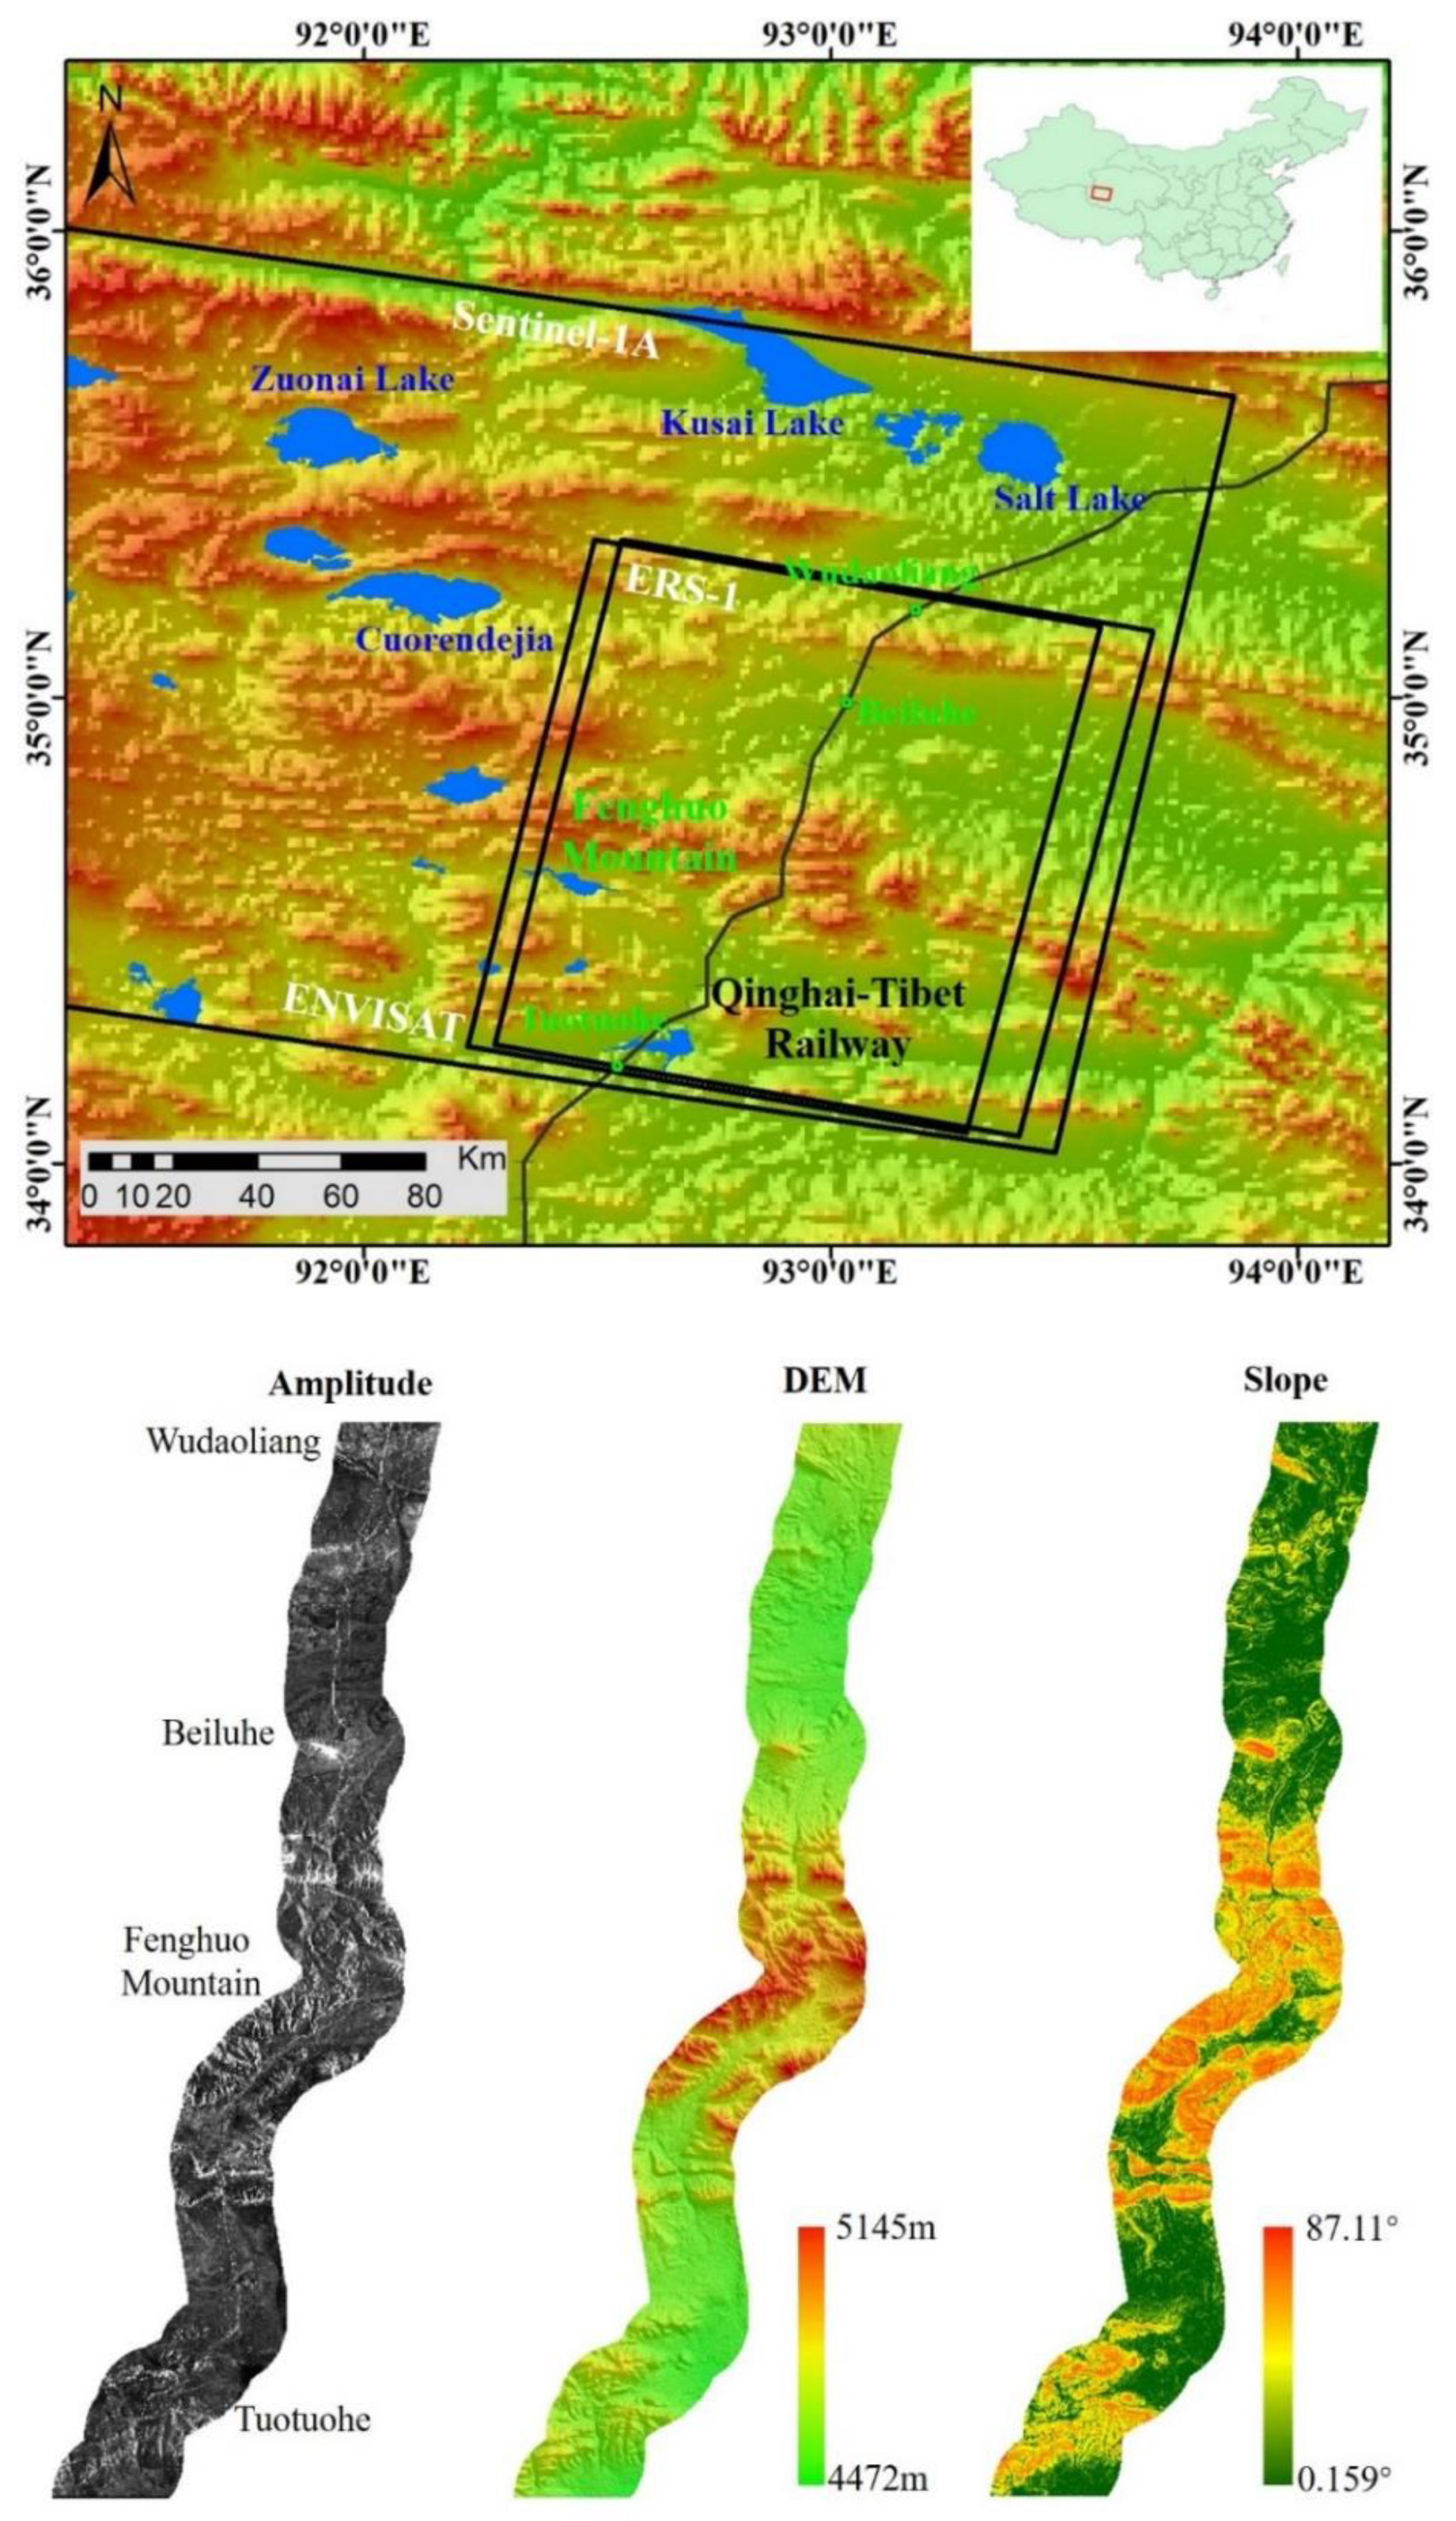
2.1. Study Area
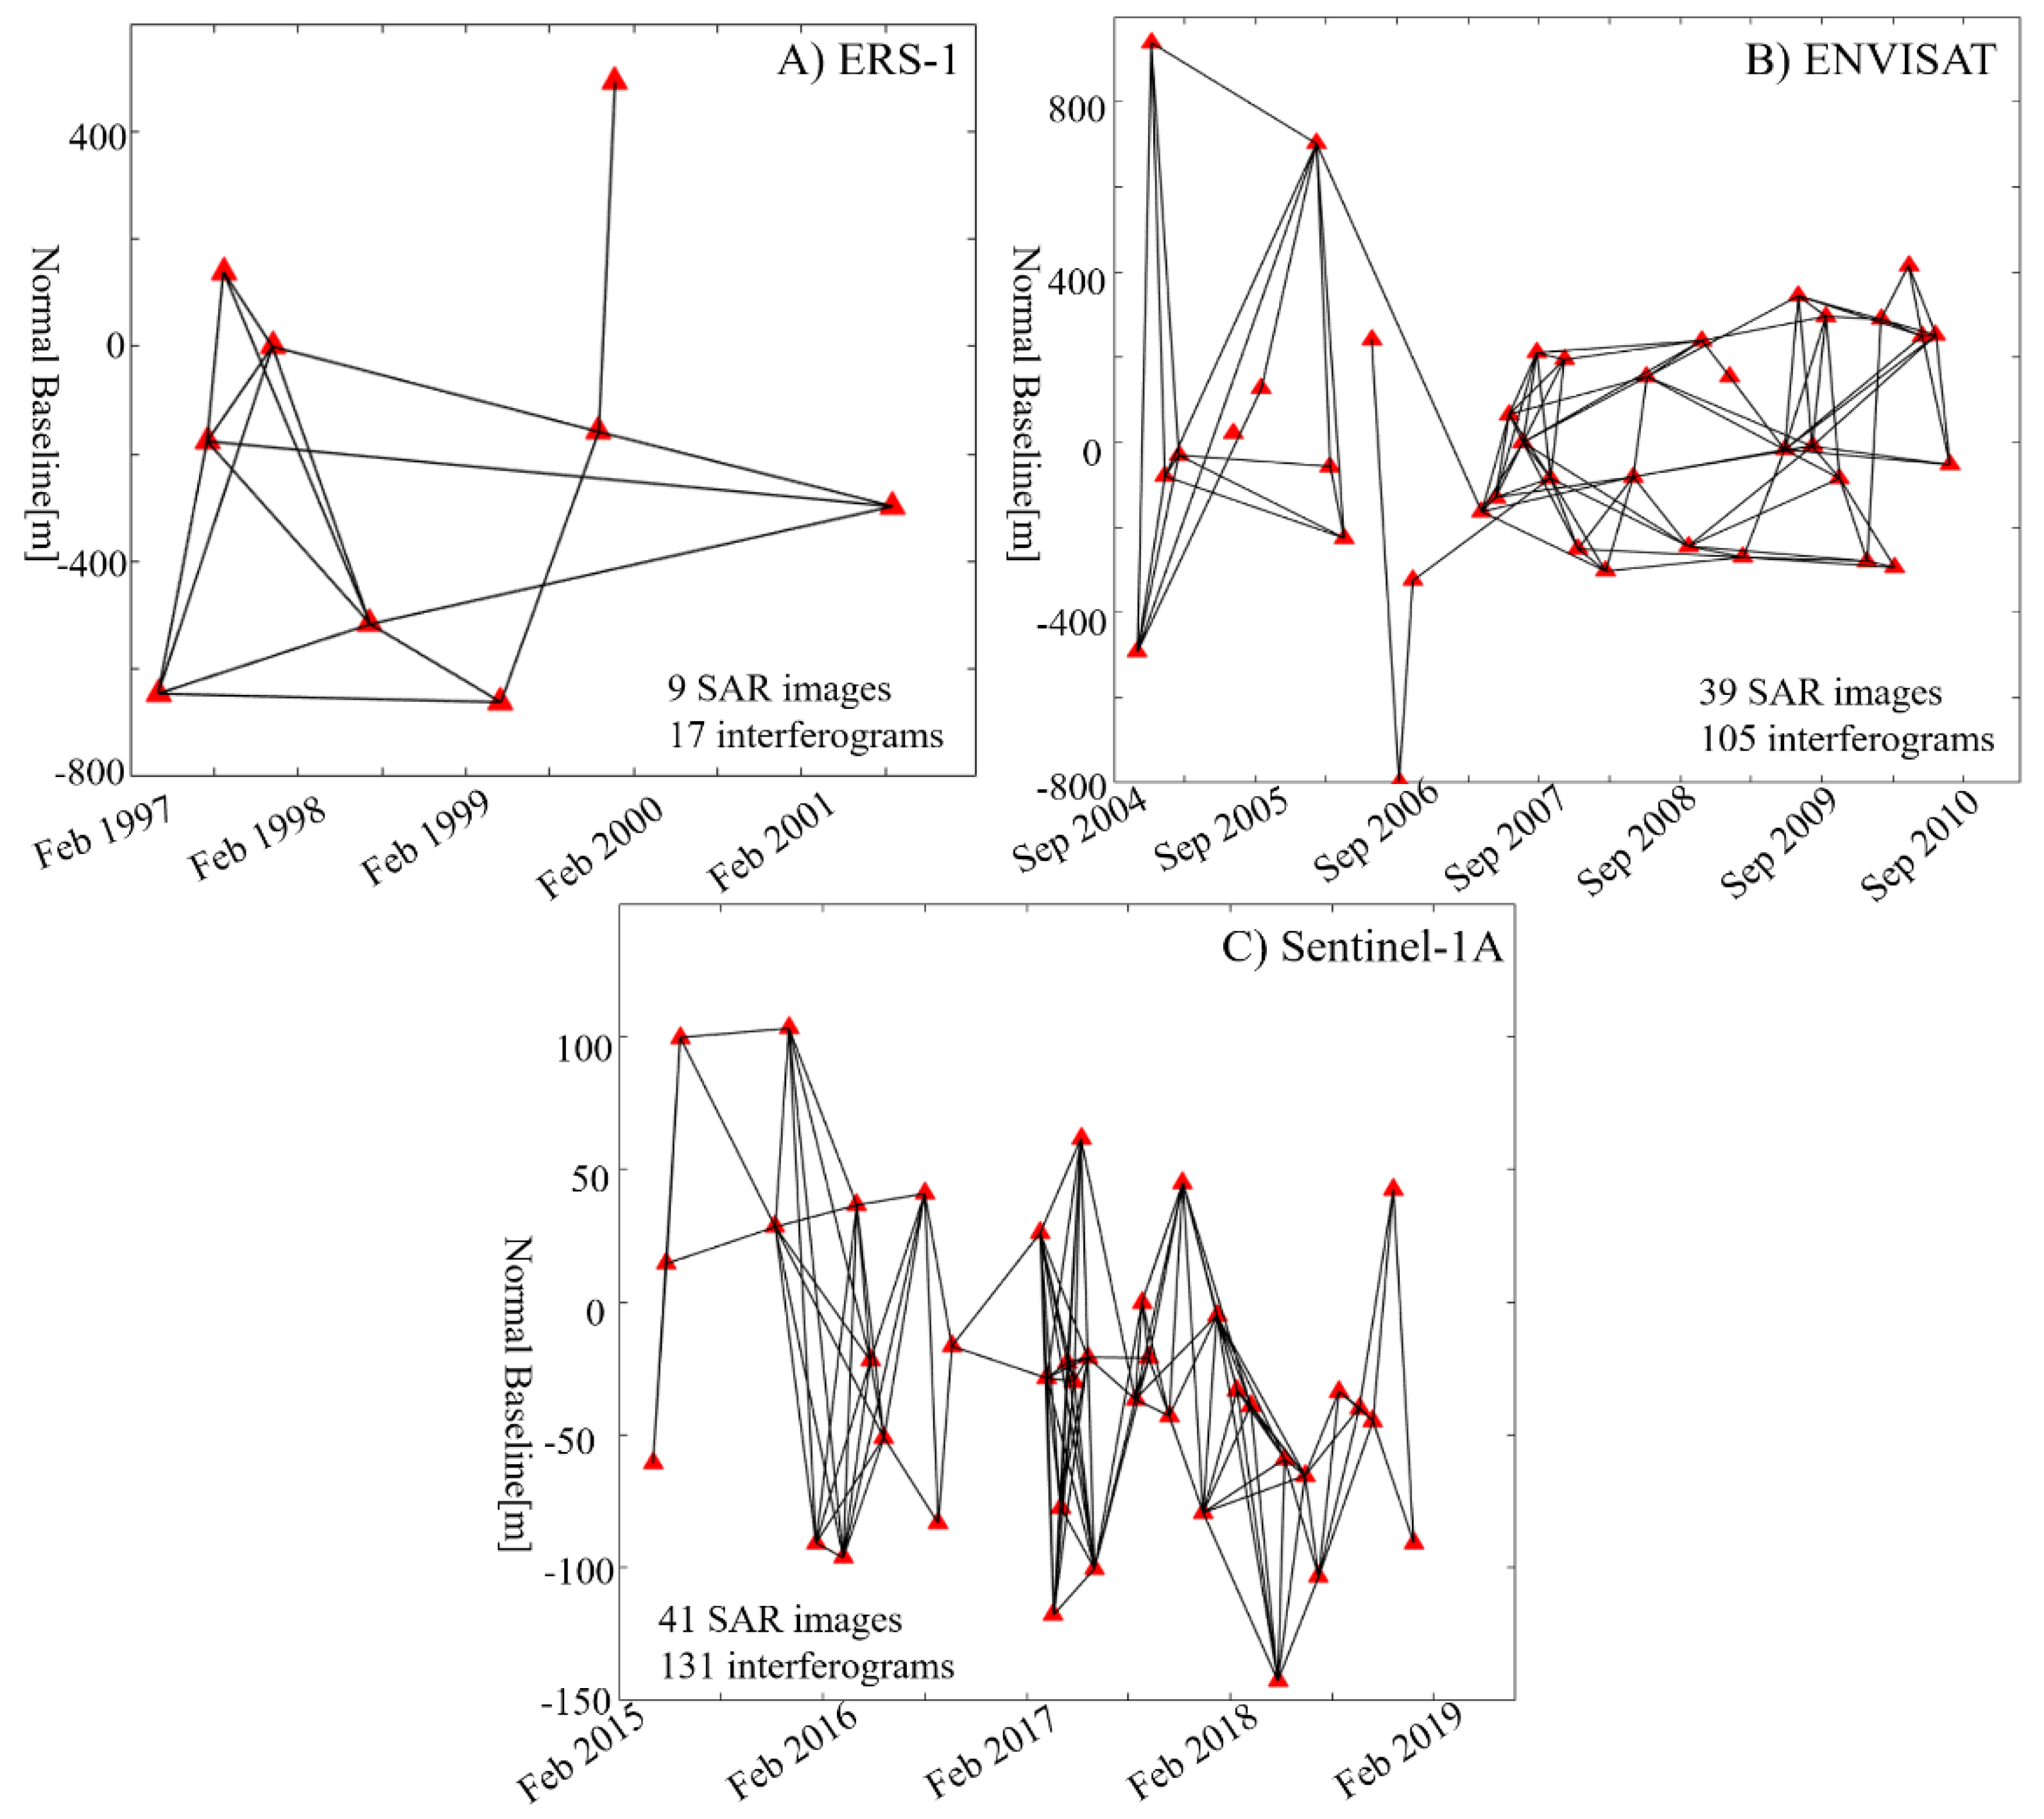
2.2. Datasets
3. Methodology
3.1. InSAR Processing
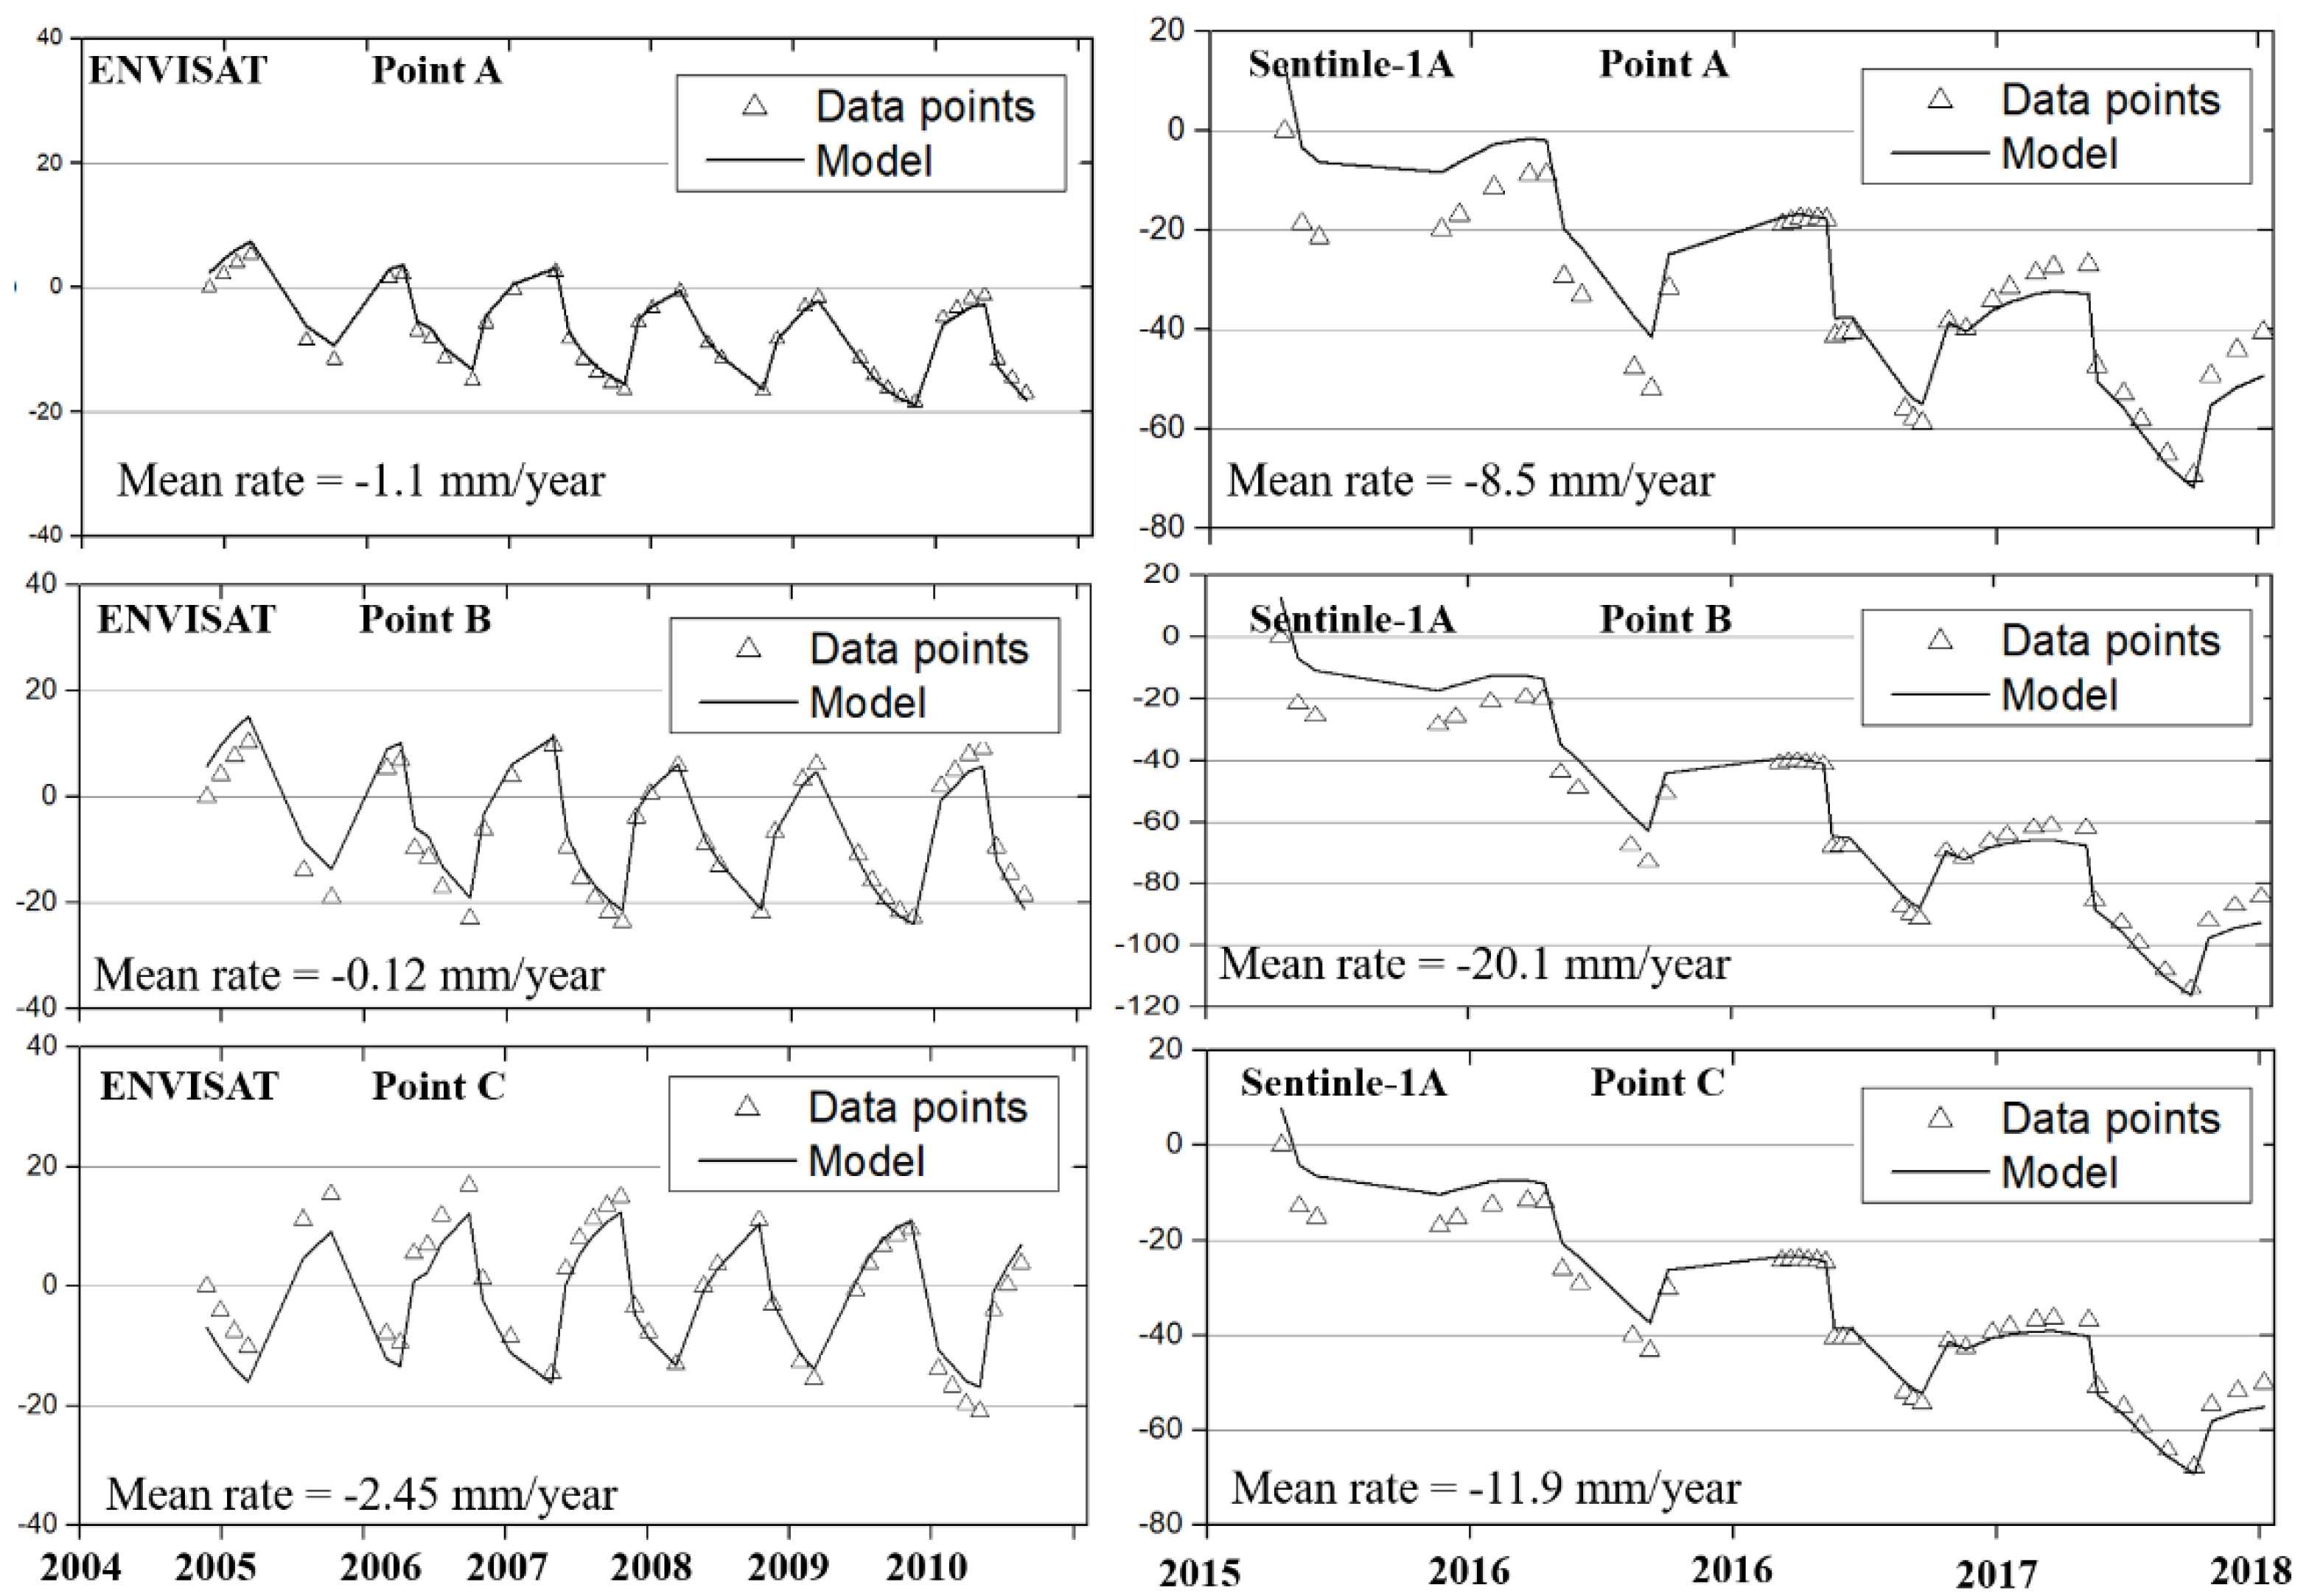
3.2. Seasonal and Long-Term Deformation Model
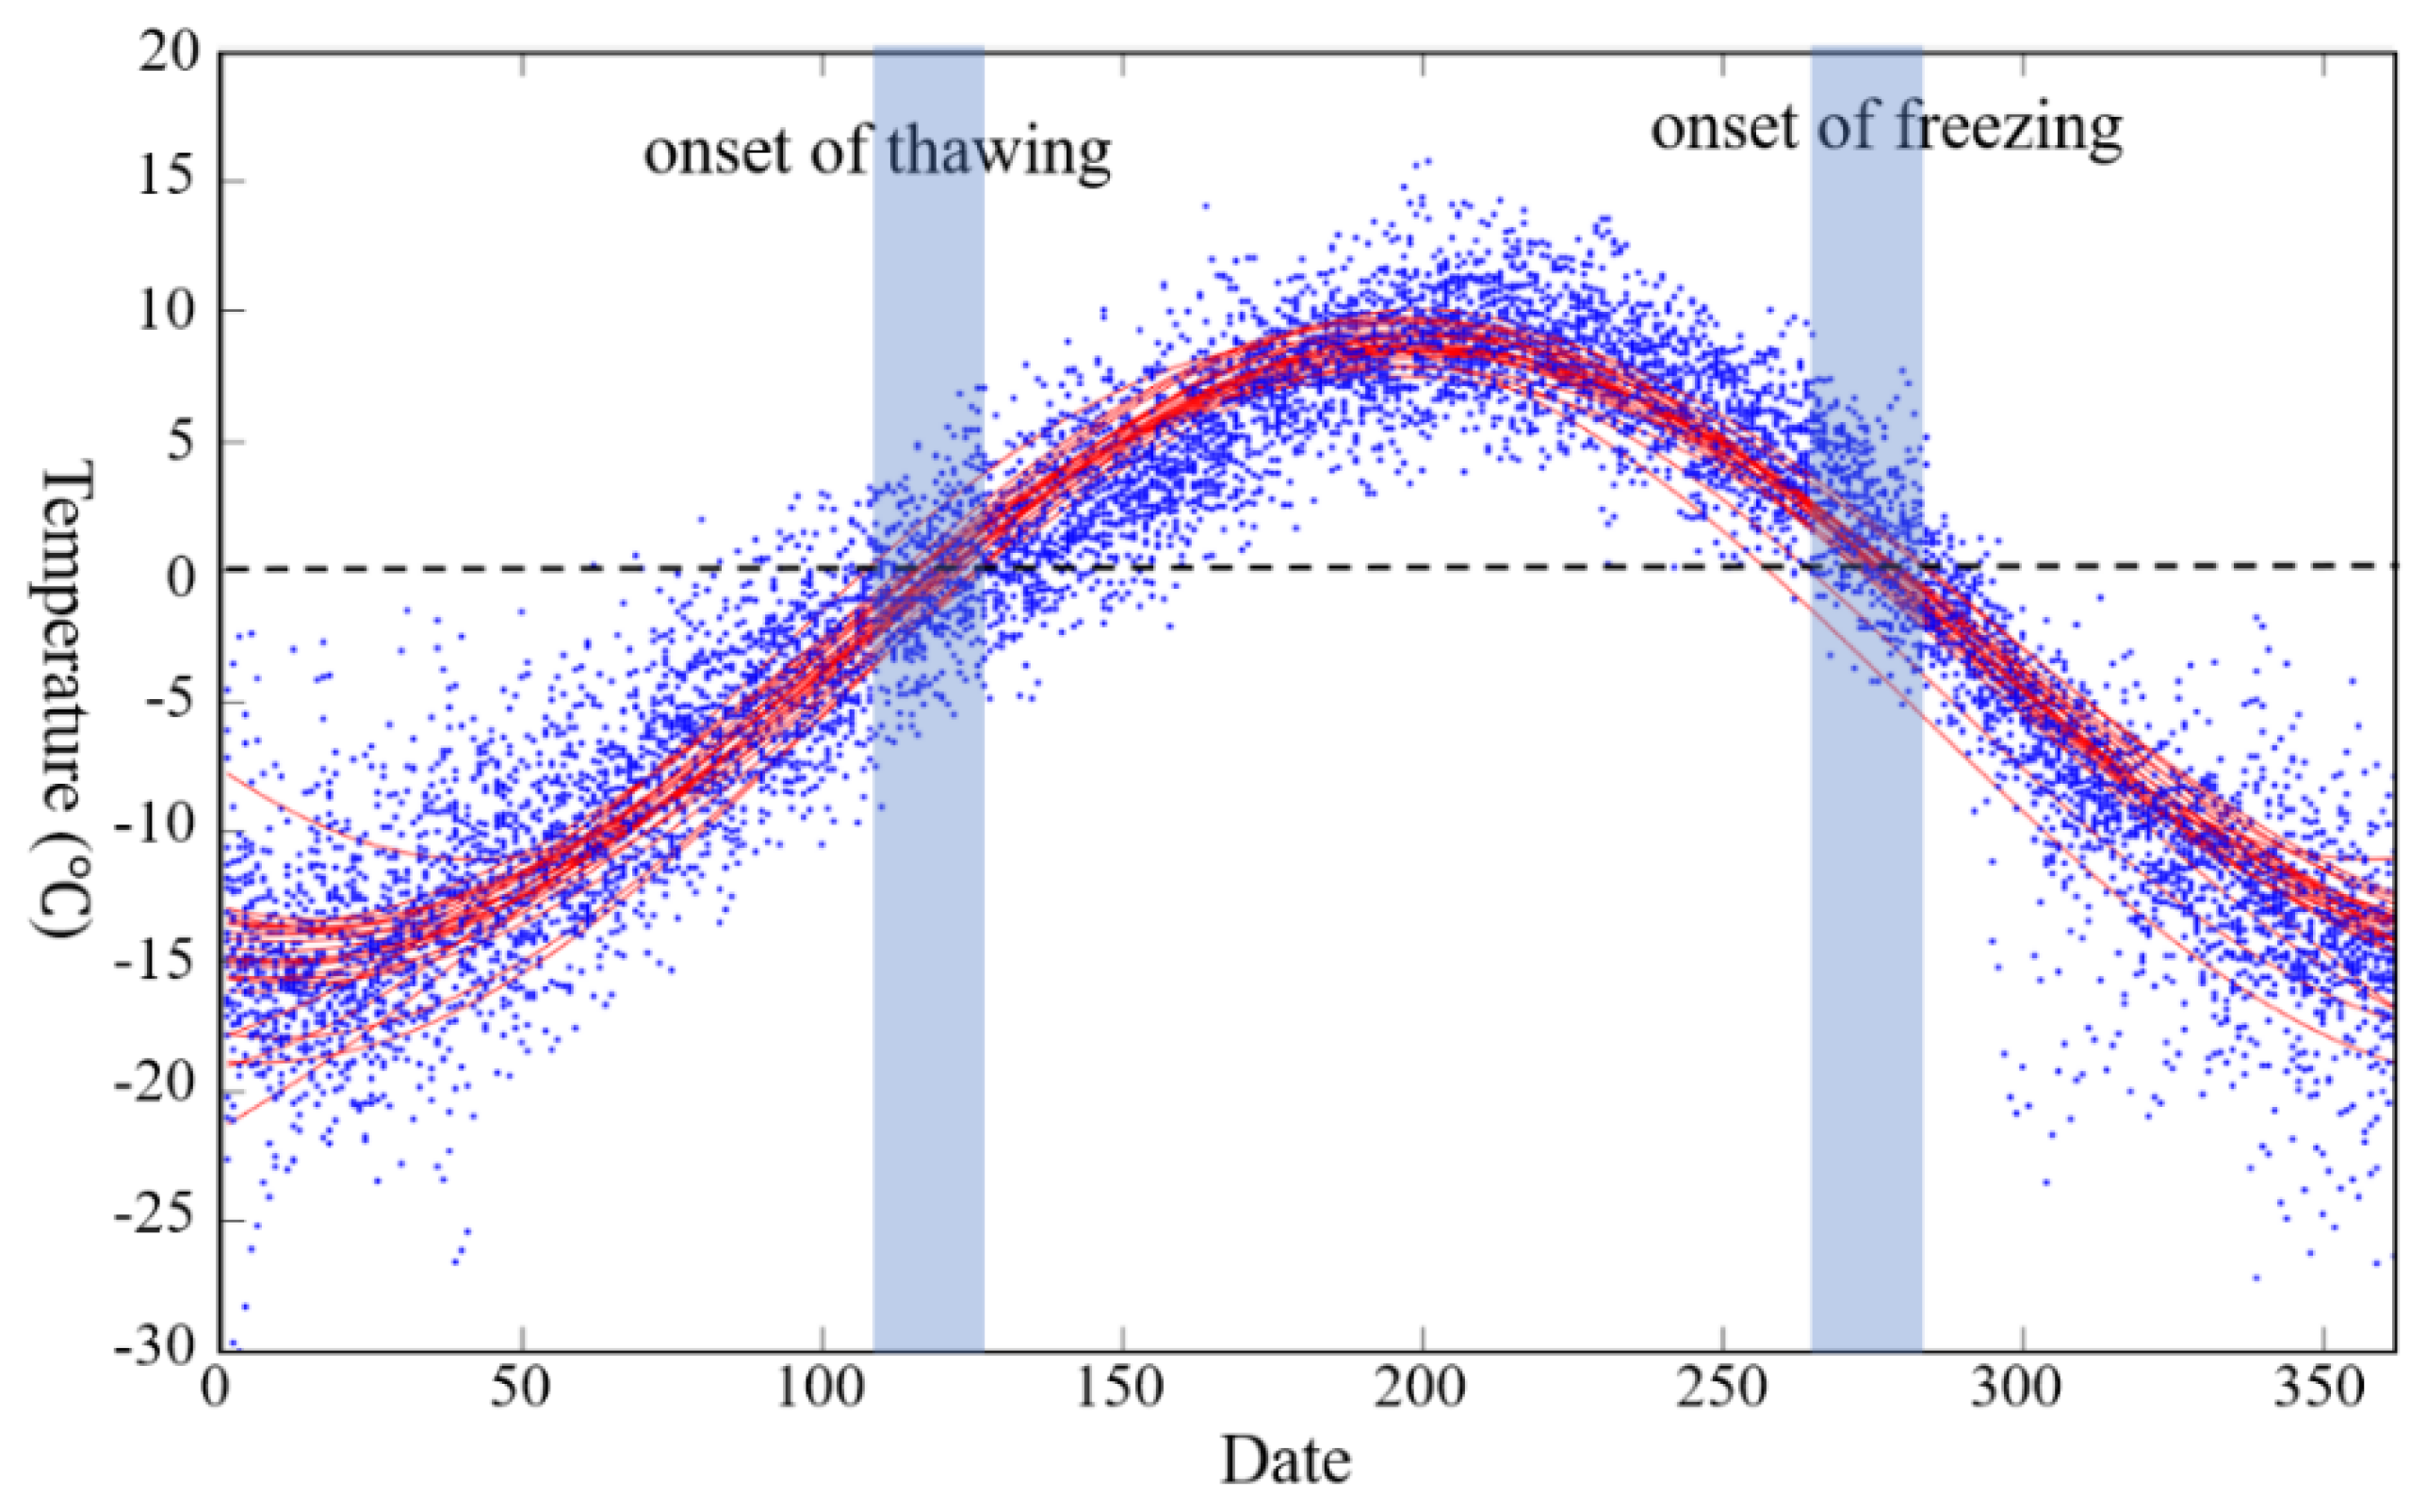
3.3. Calculation of ADDT and ADDF
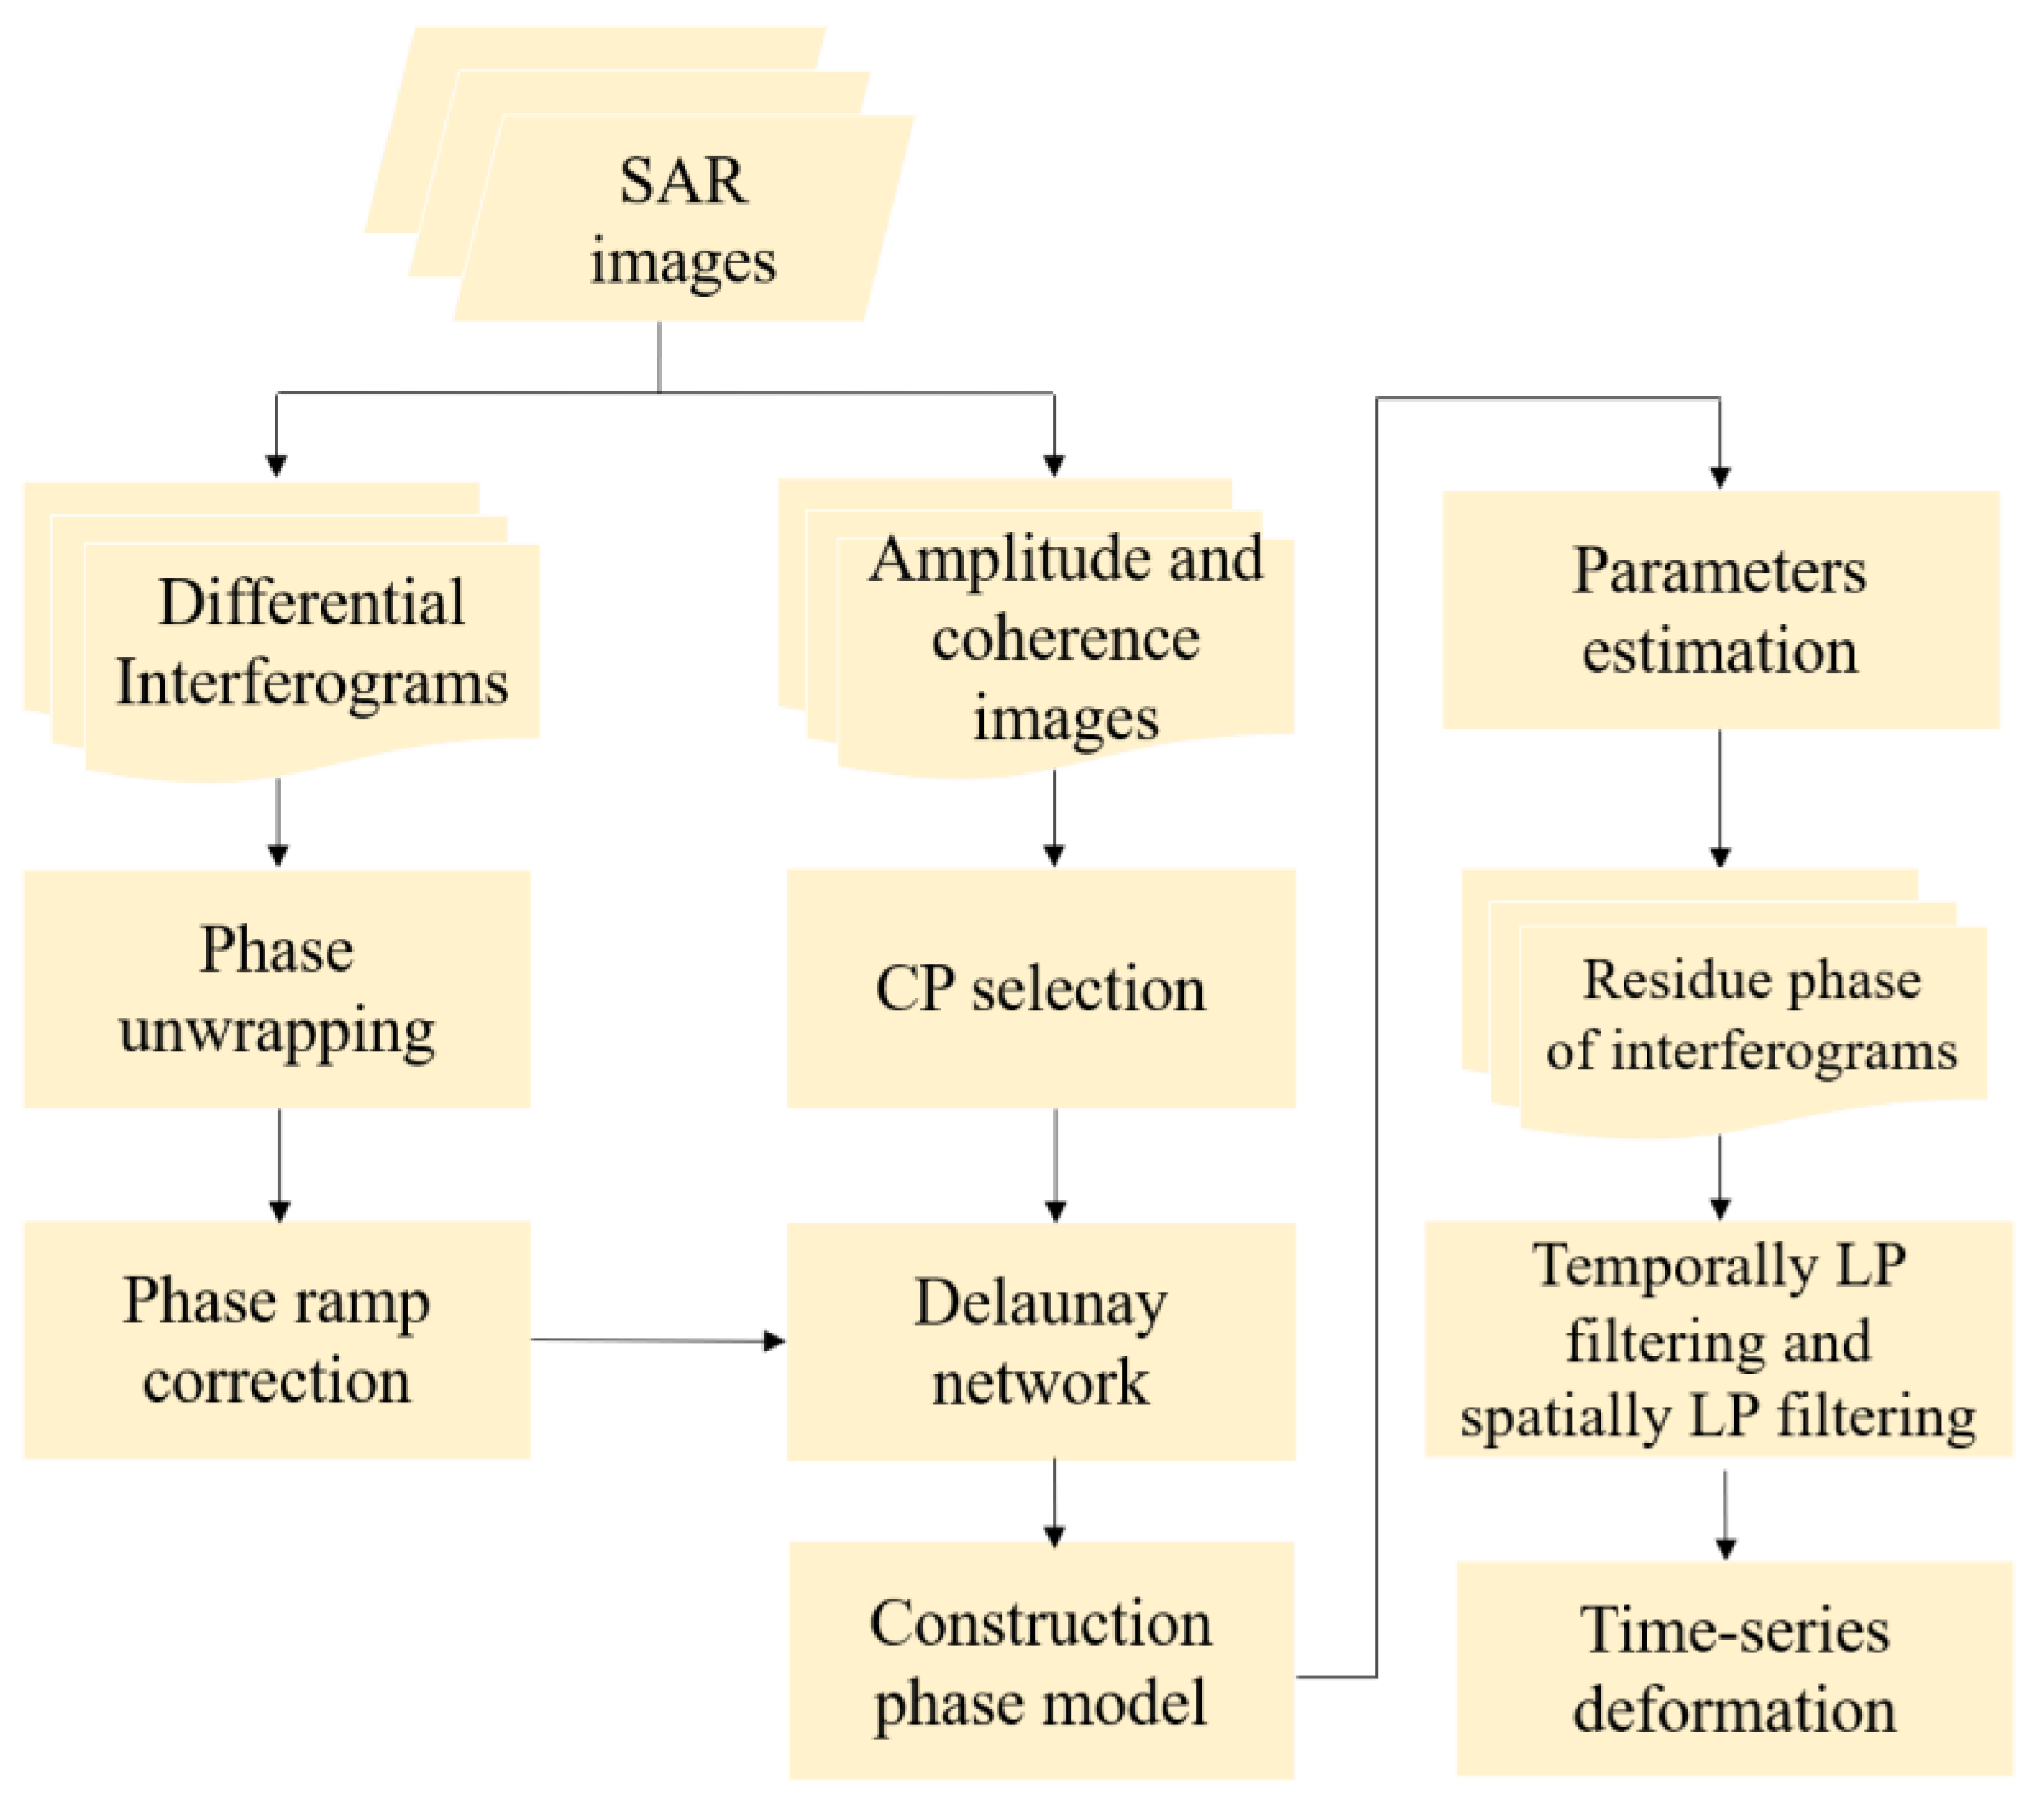
3.4. Time-Series InSAR Method
3.4.1. Coherence Point (CP) Selection
3.4.2. Topographic and Orbit Error Removal
3.4.3. Atmospheric Phase Screen (APS) Removal
3.4.4. Parameter Estimation
4. Results and Analysis
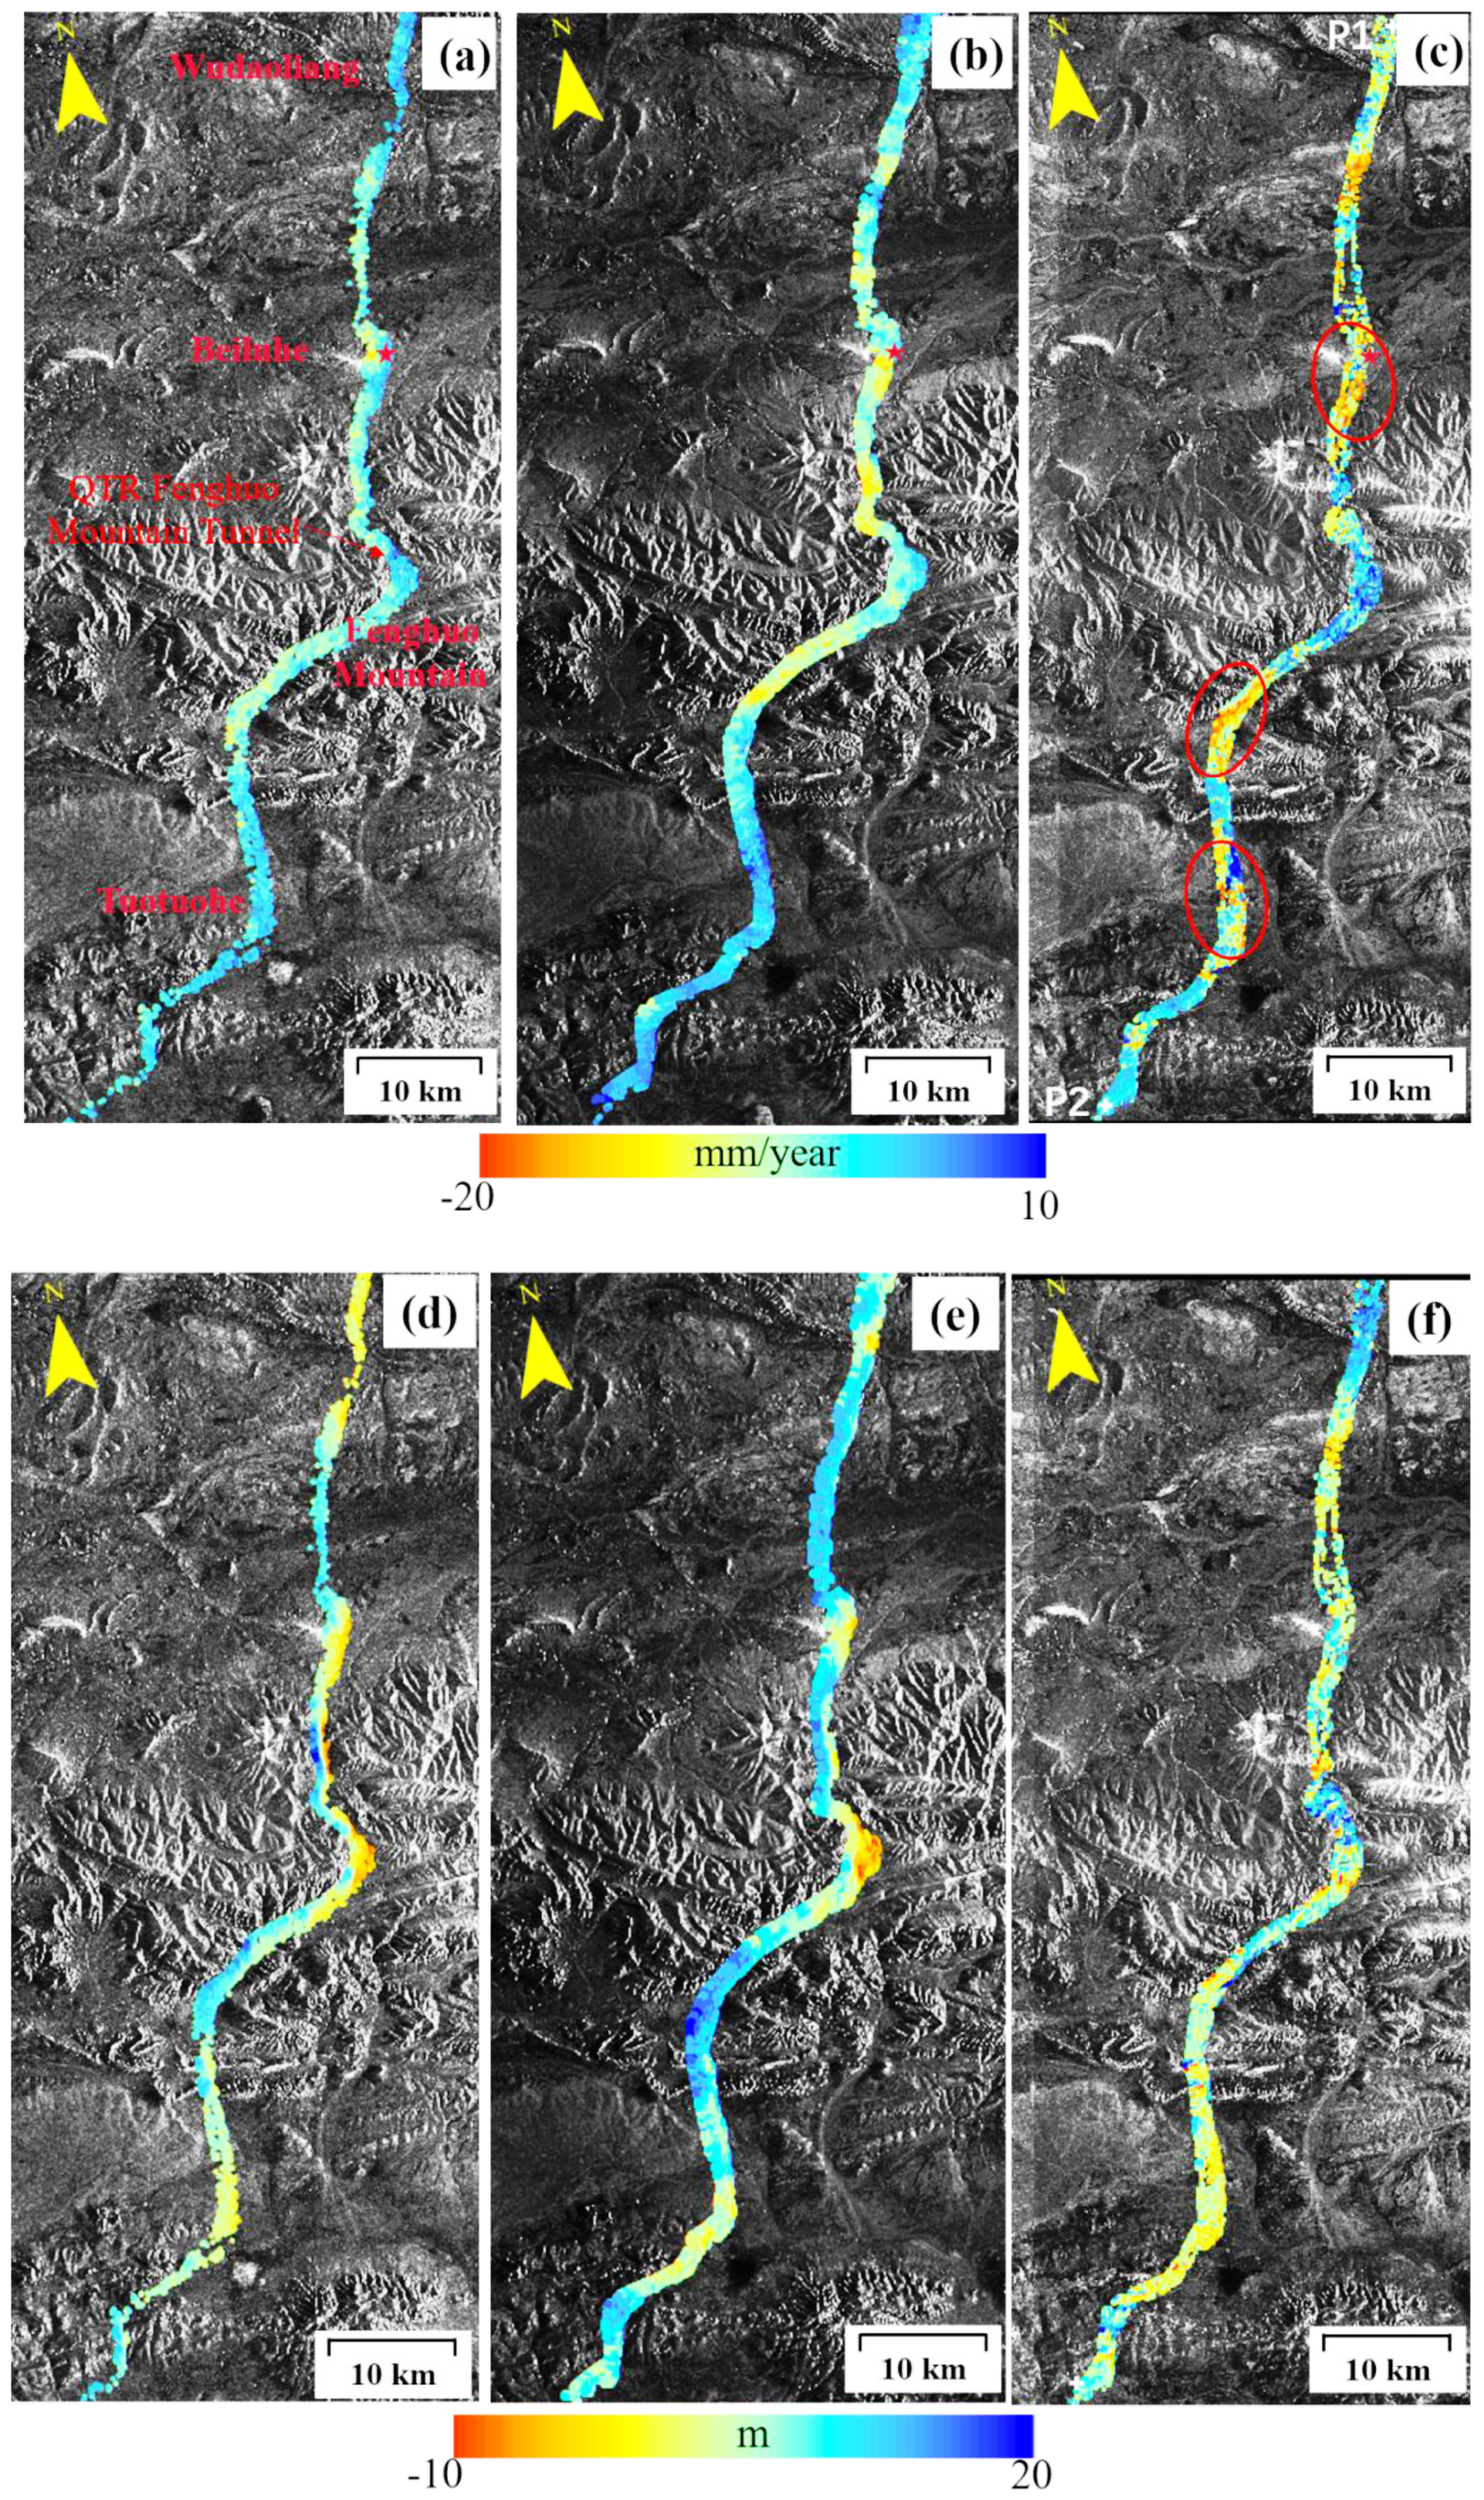
4.1. InSAR Results
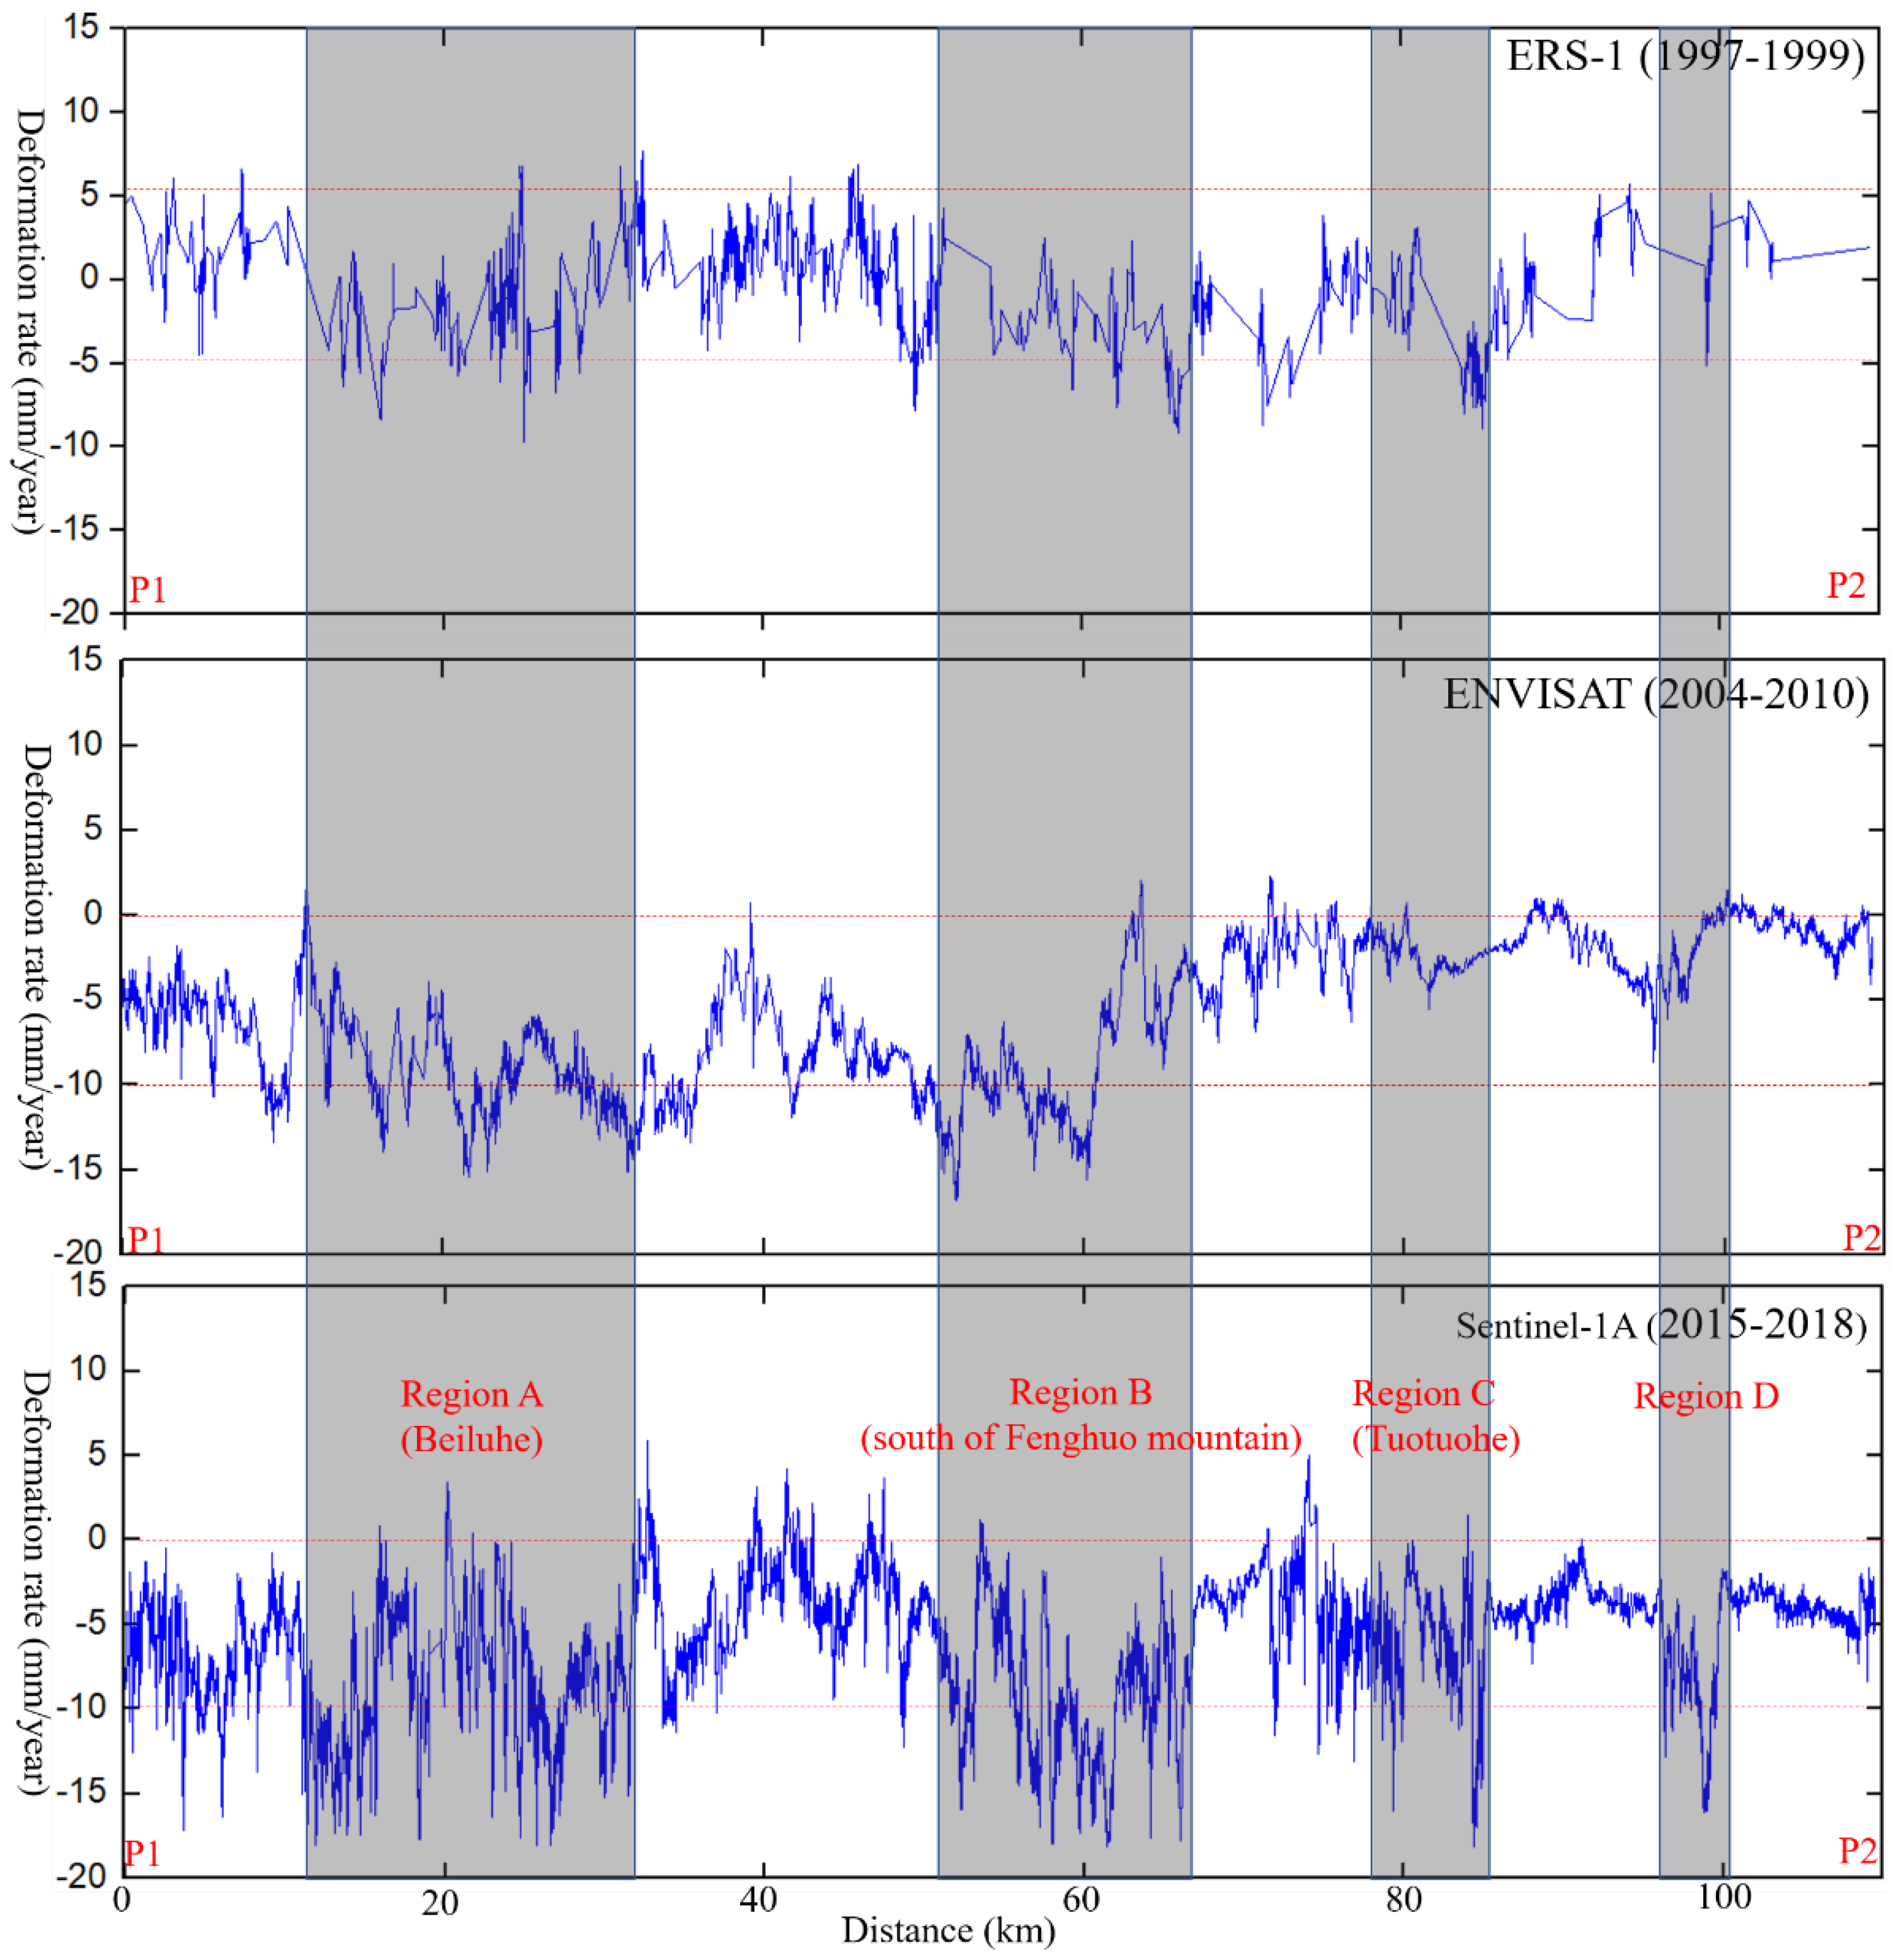
4.2. Regional Analysis
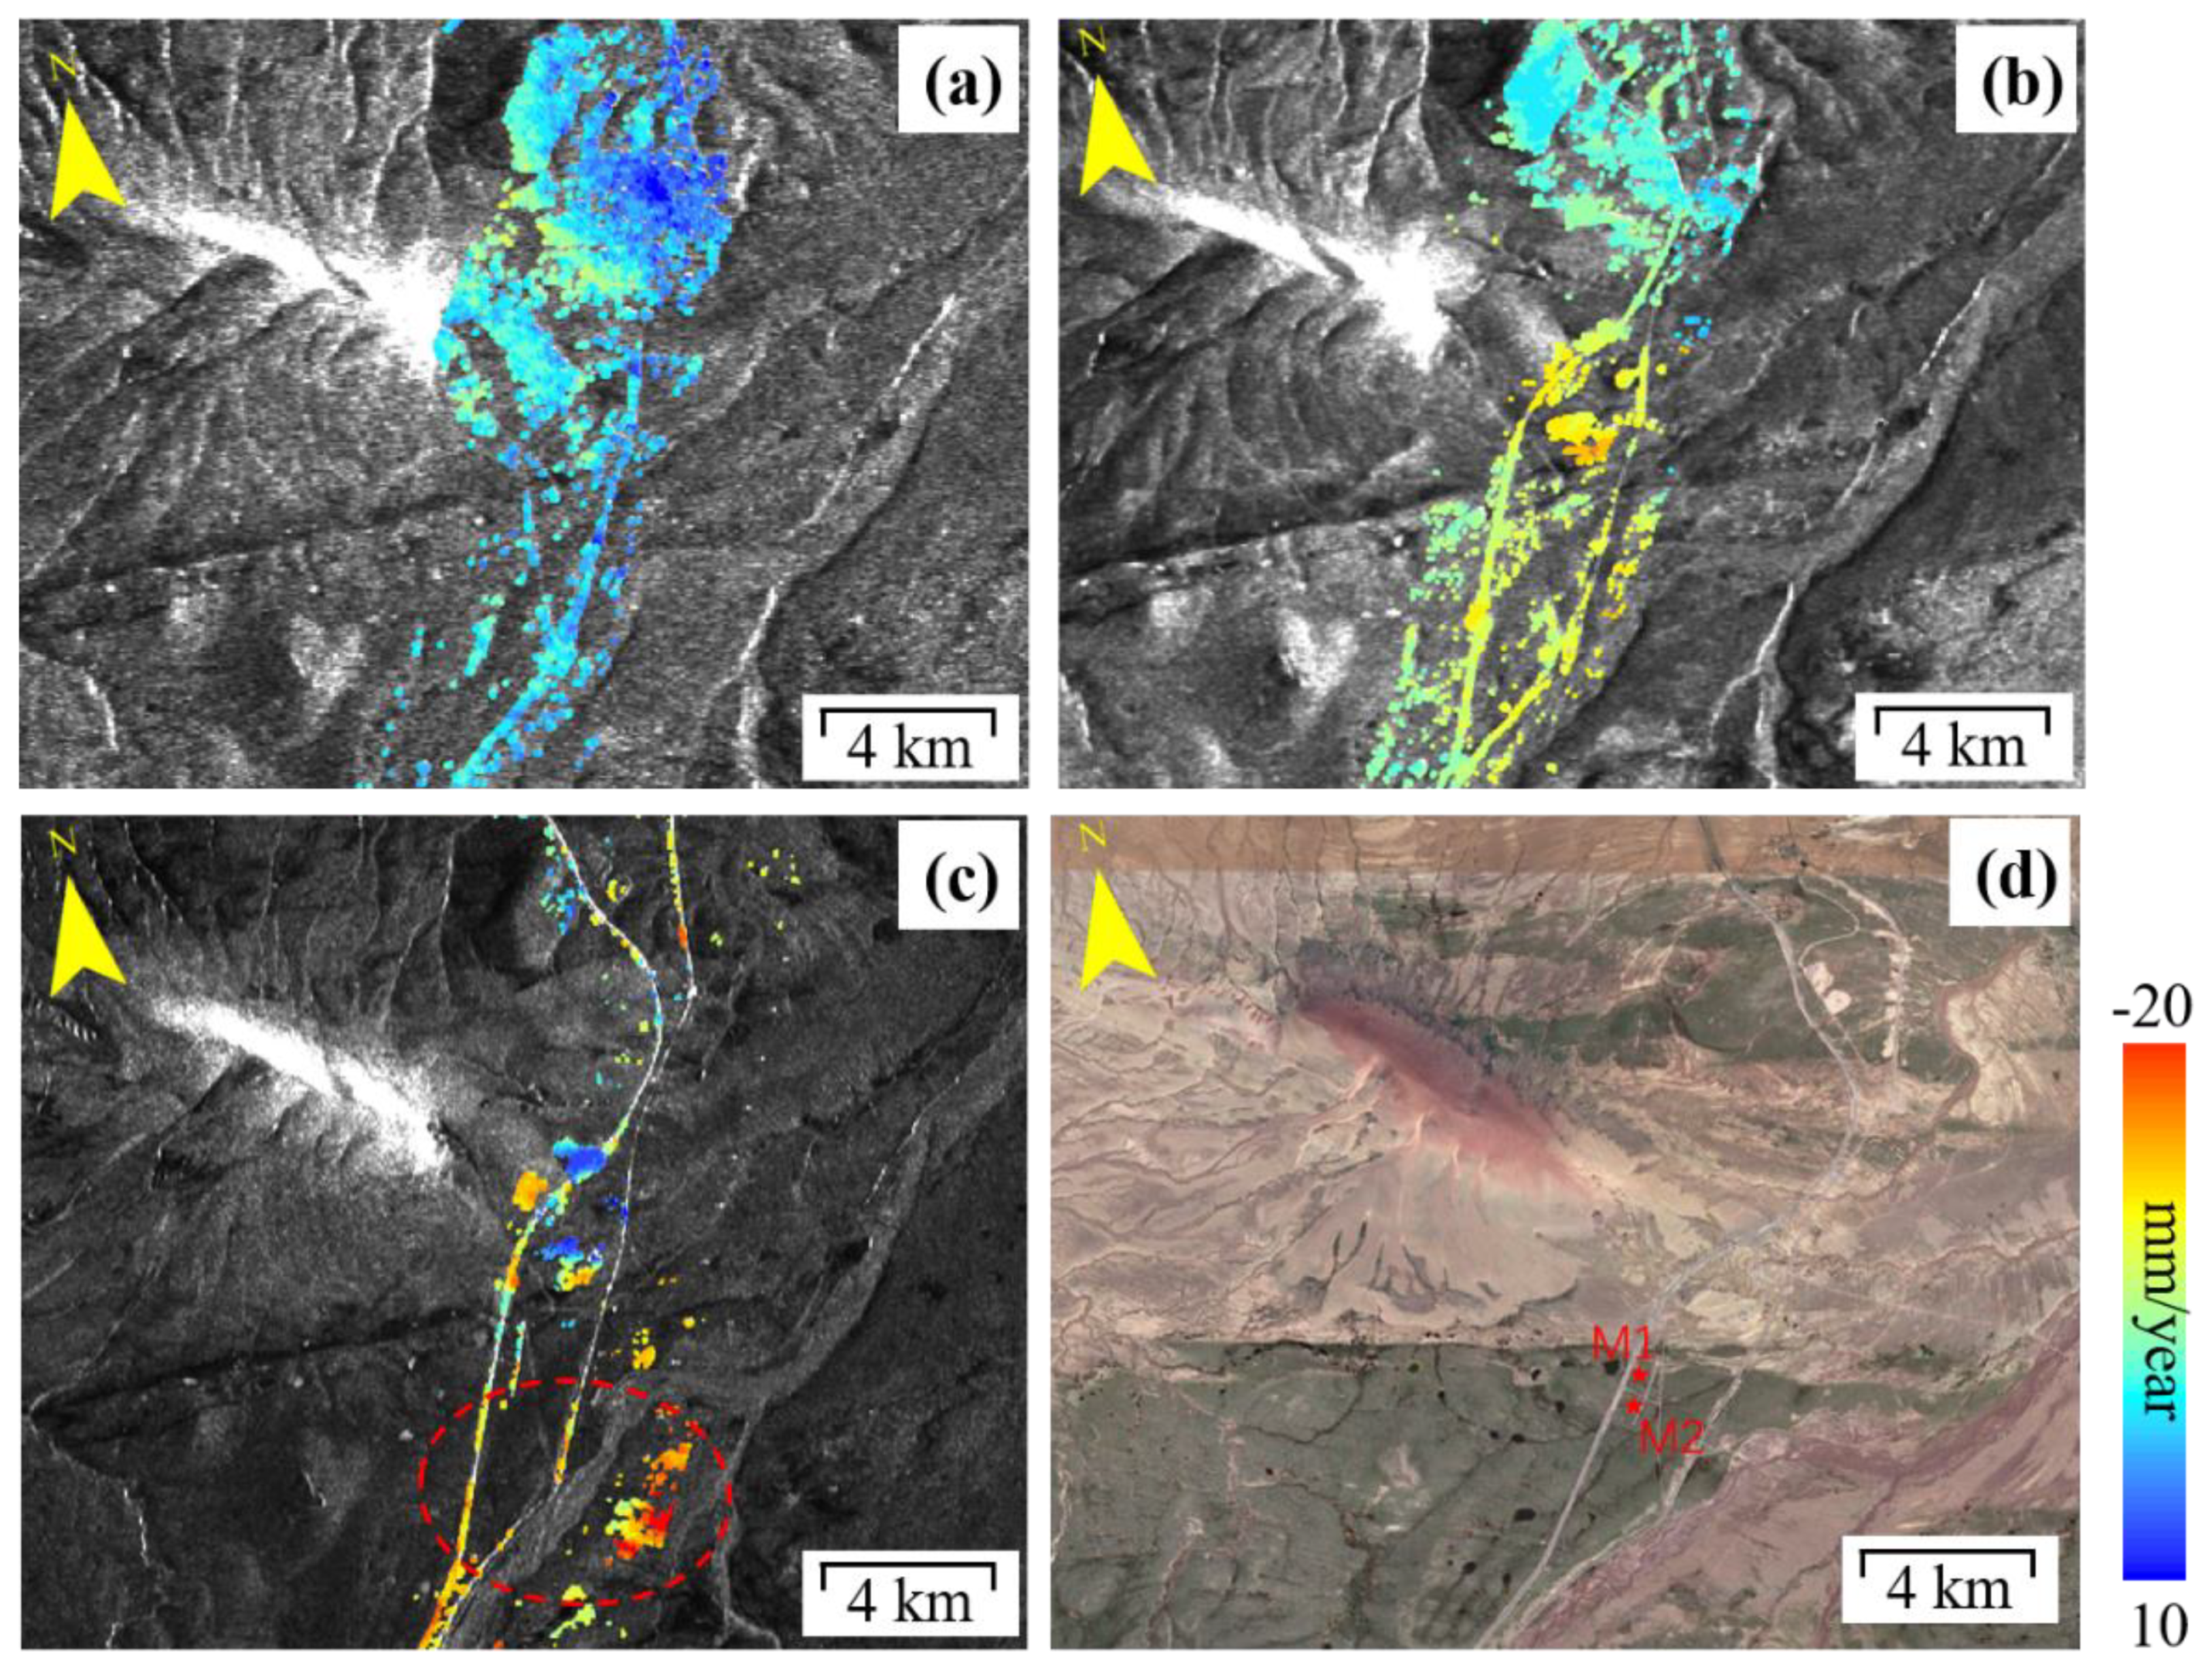
4.2.1. Beiluhe
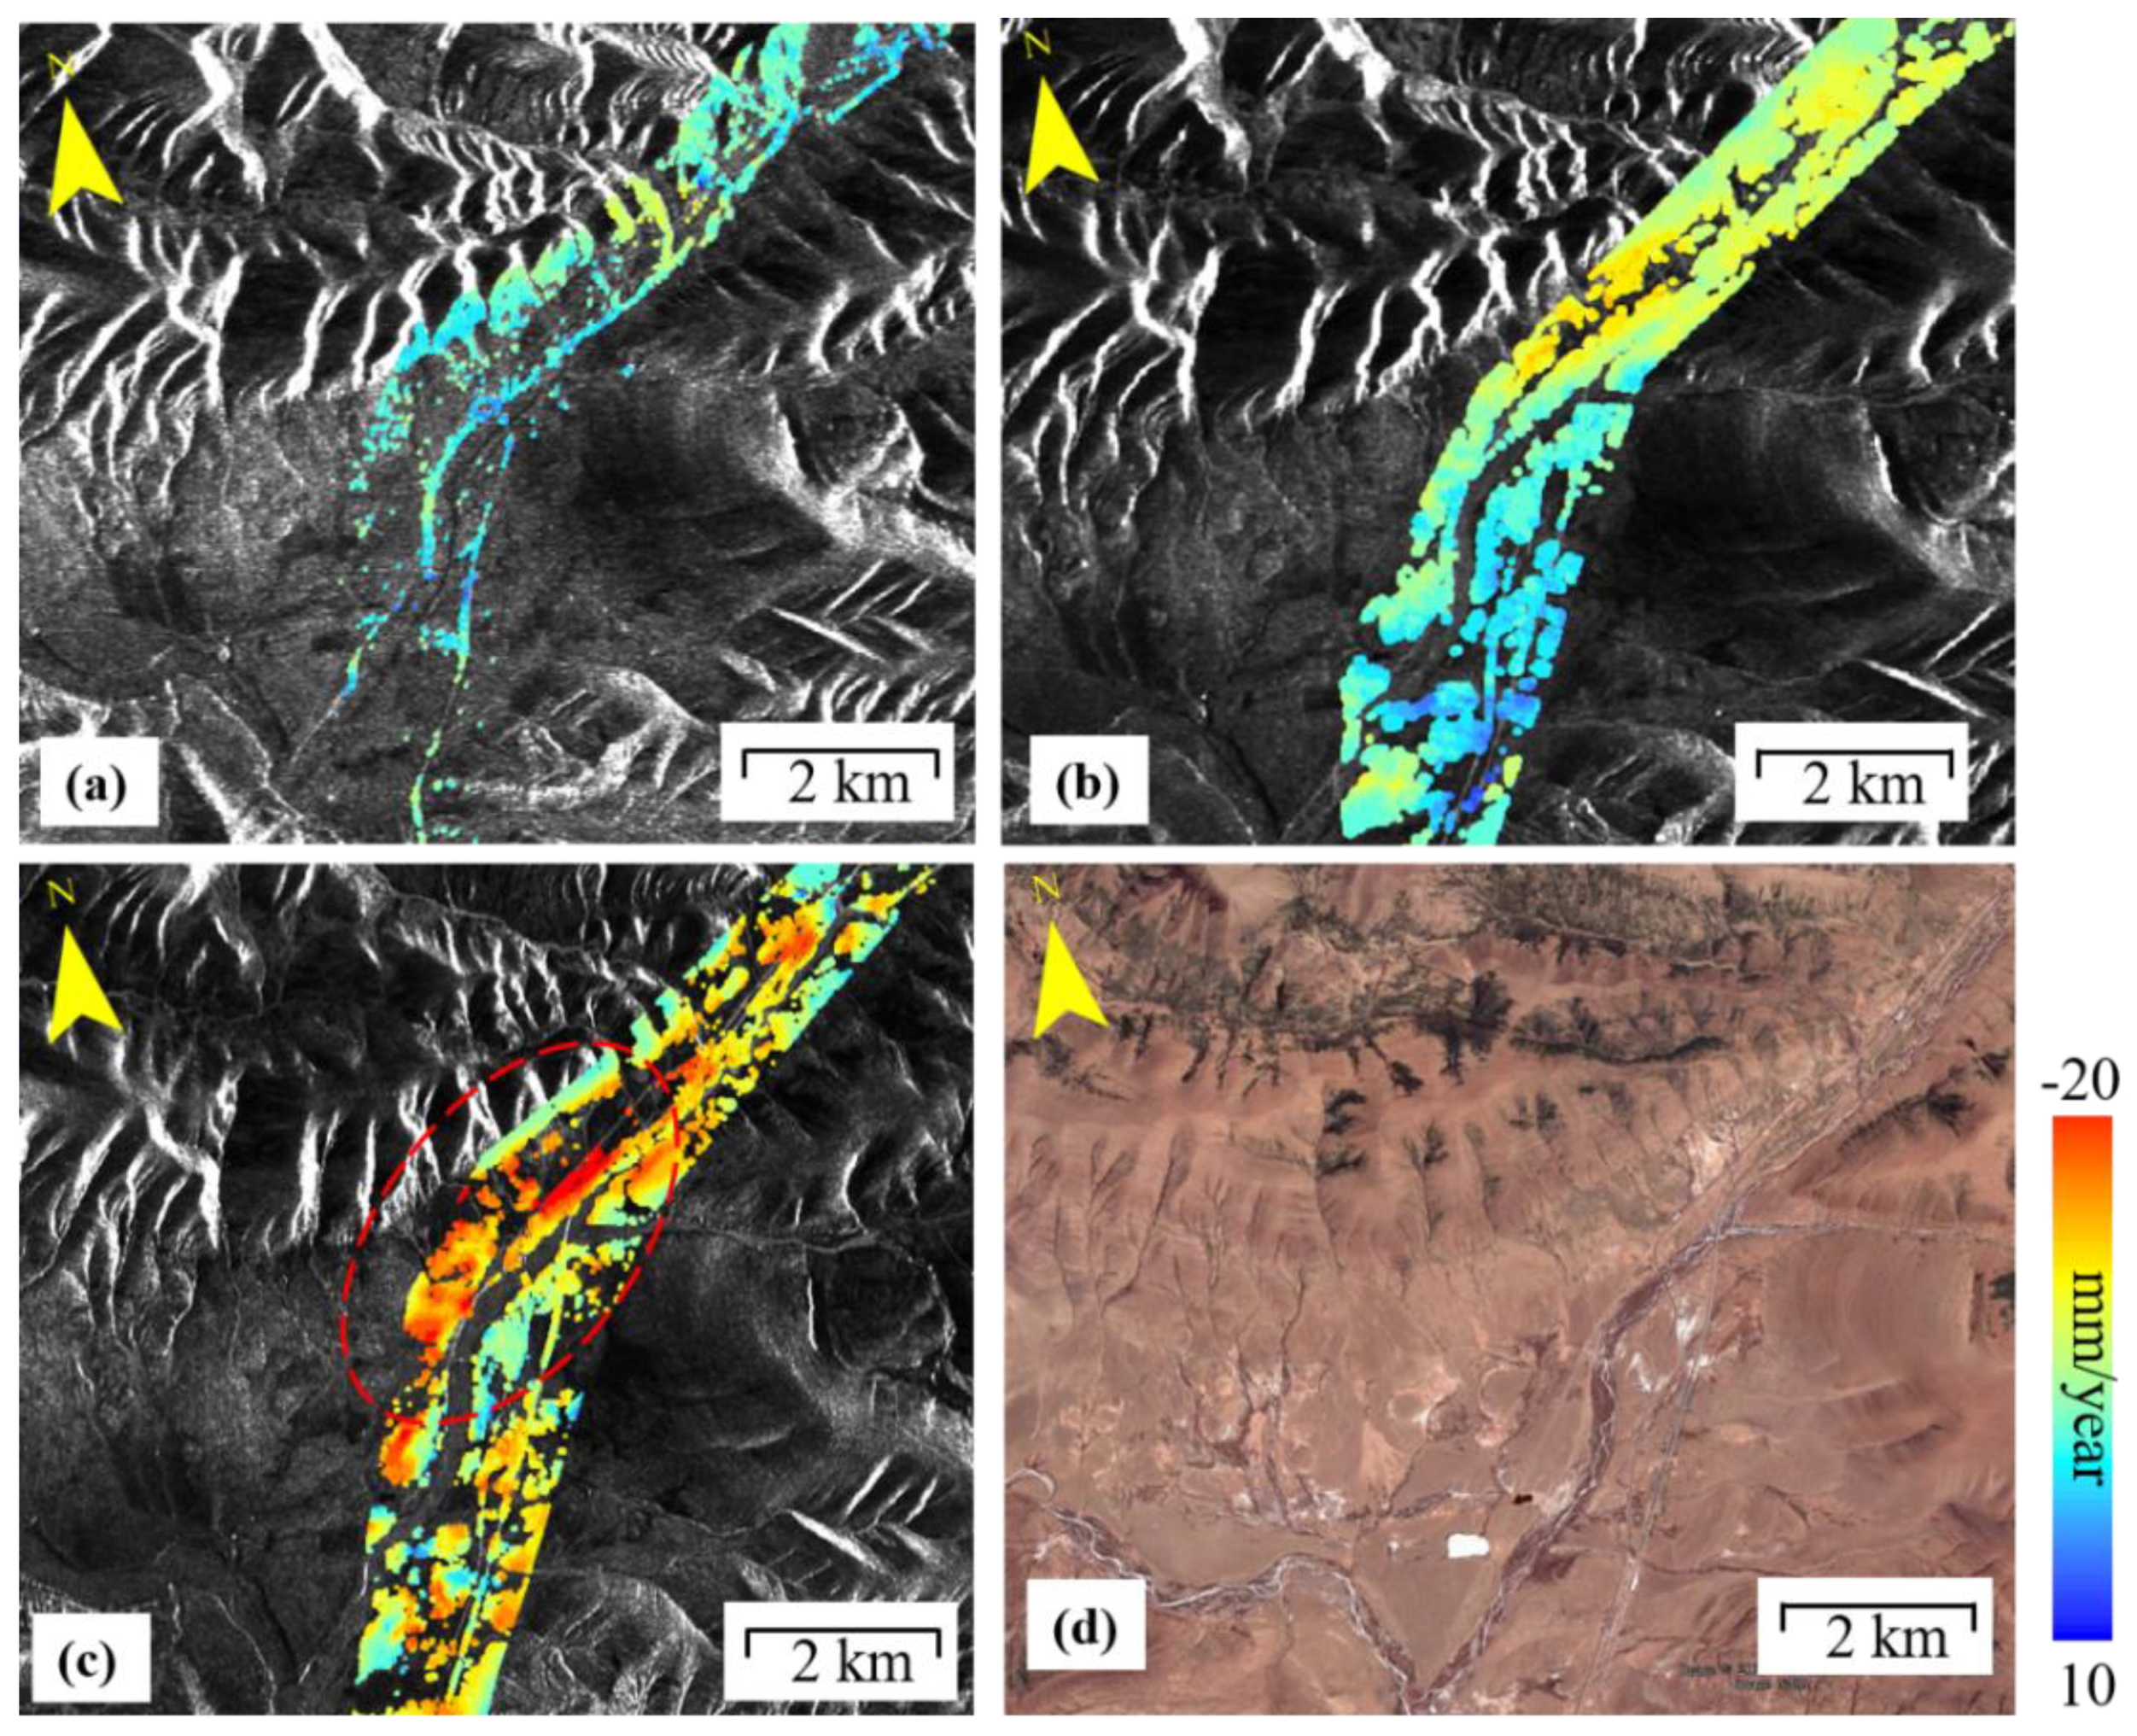
4.2.2. Southern of Fenghuo Mountain
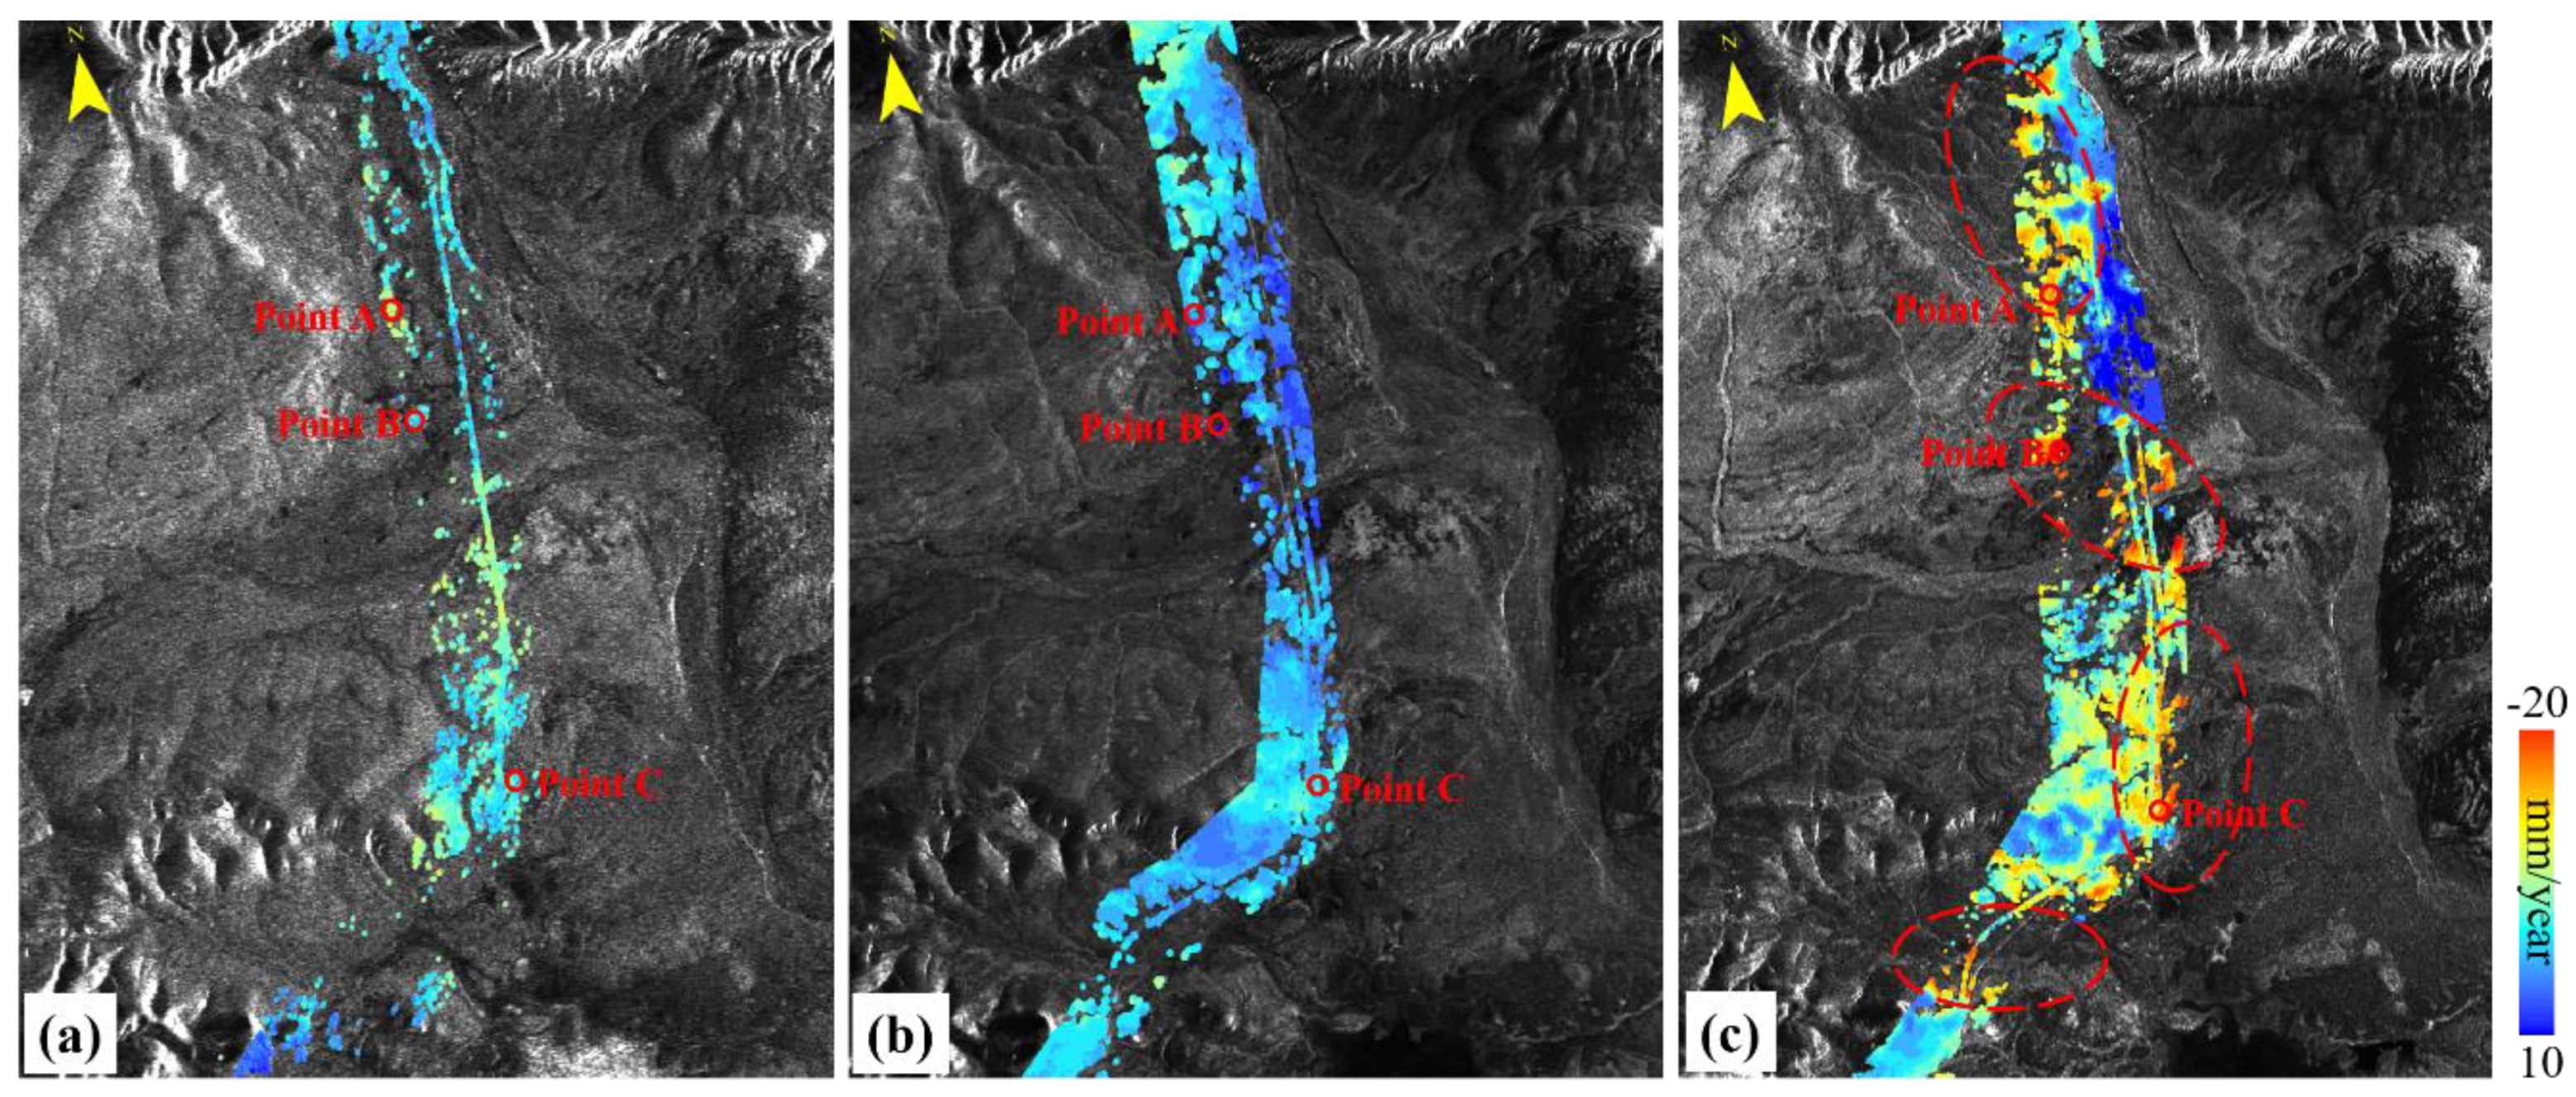
4.2.3. Tuotuohe
4.3. Deformation Analysis
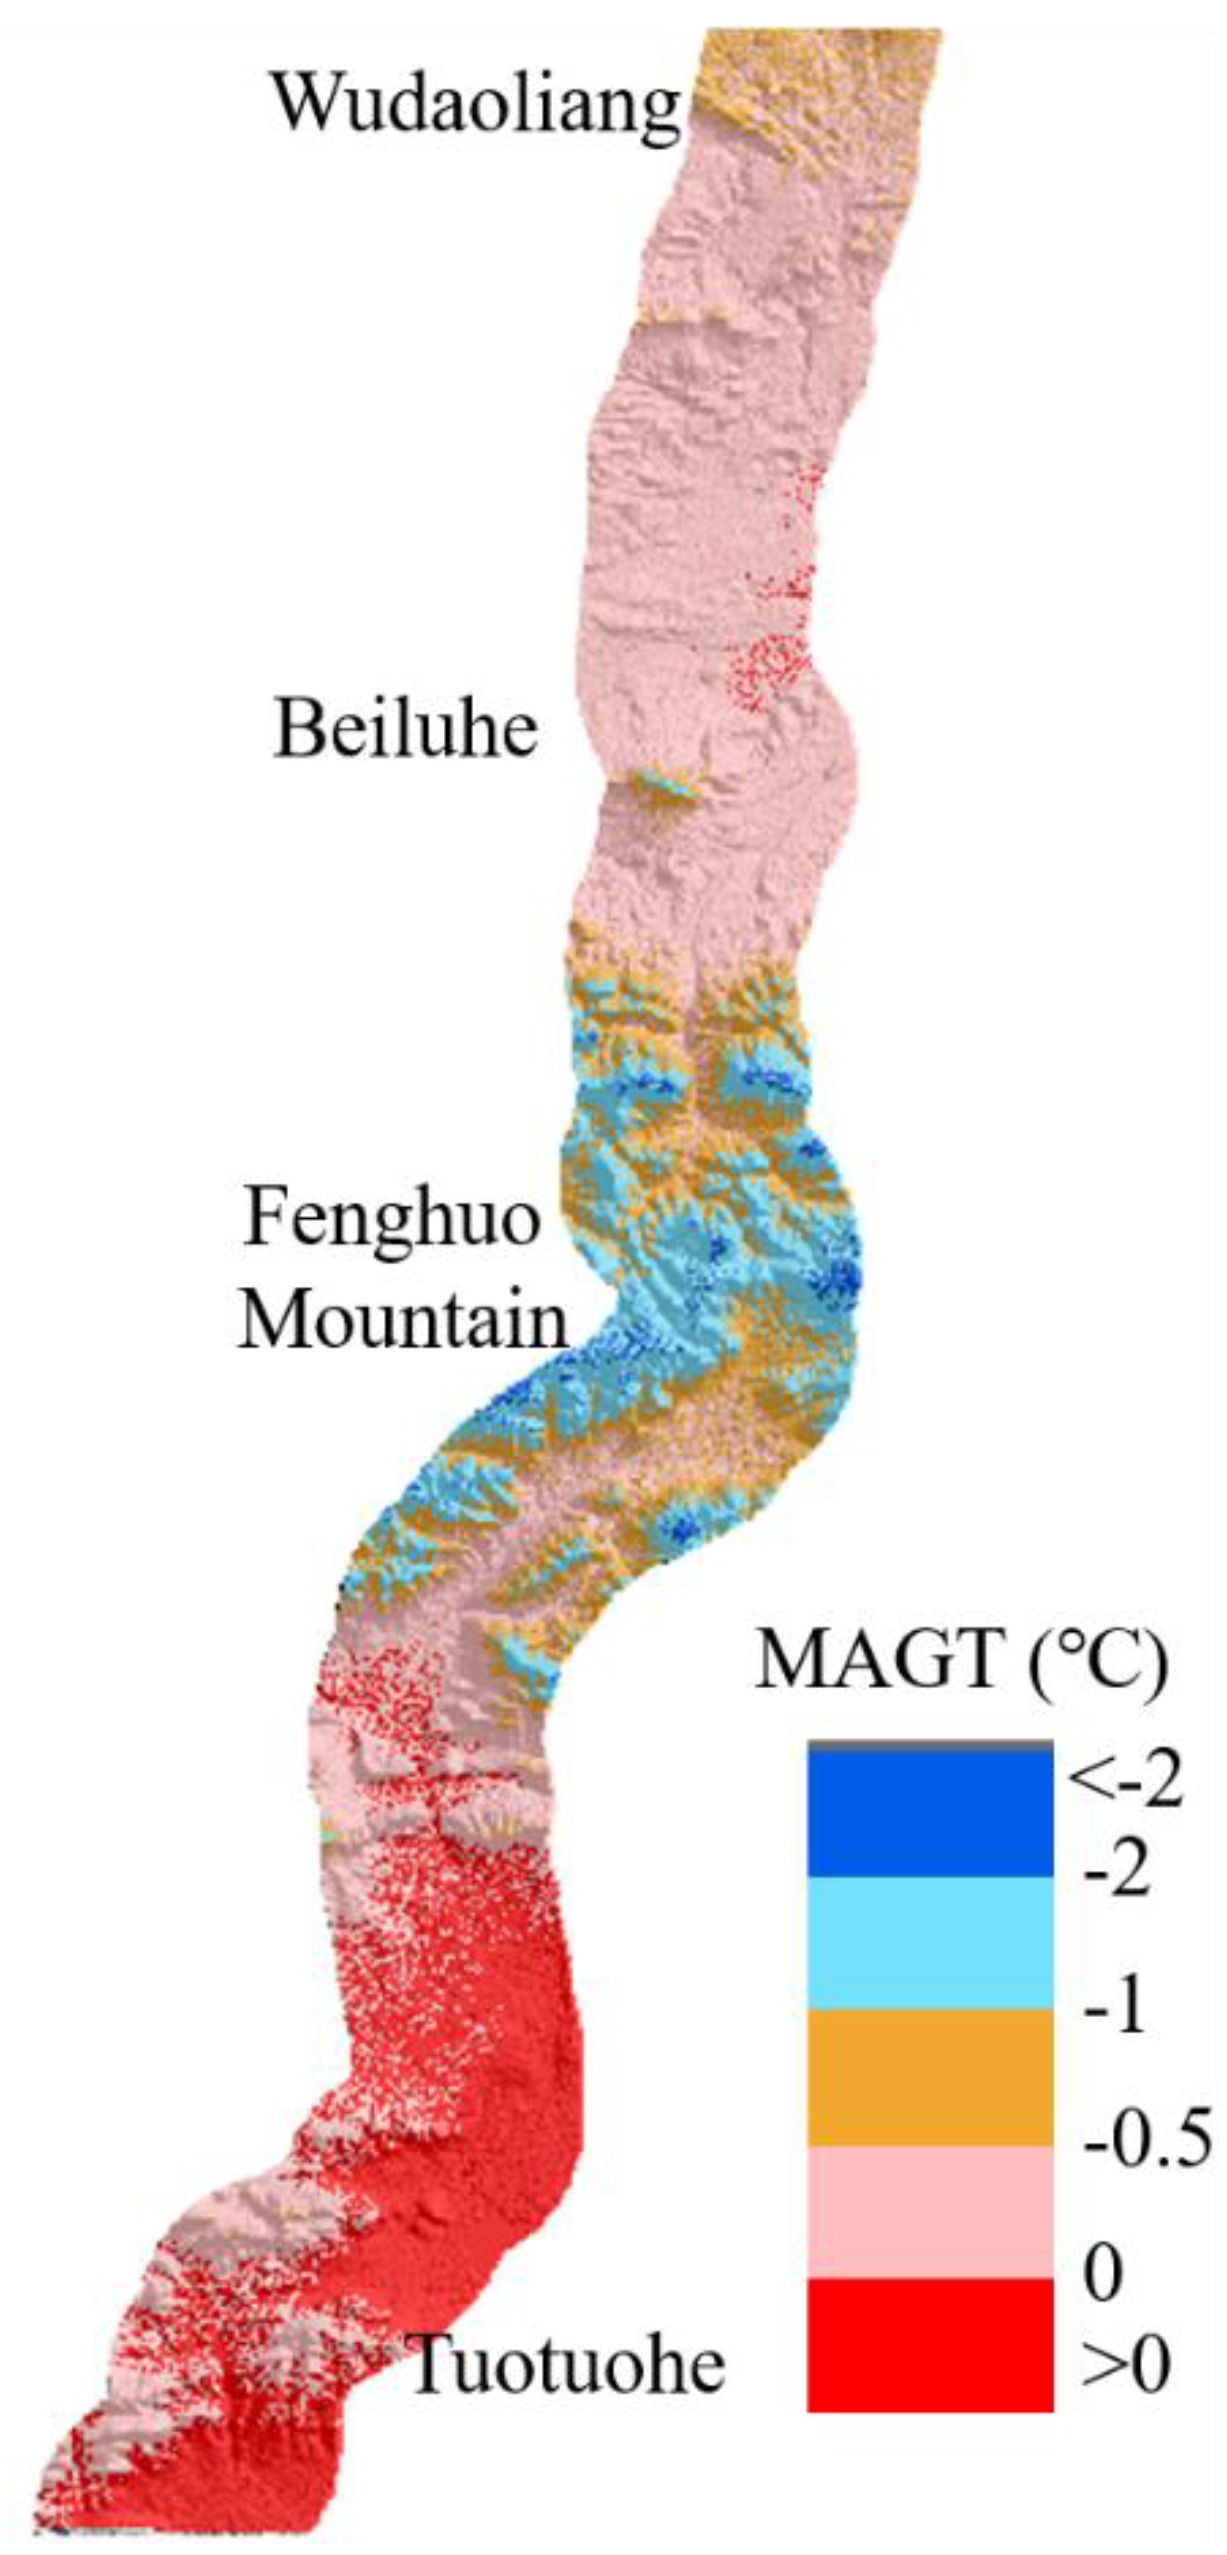
4.3.1. Deformation and Permafrost Thermal Regimes
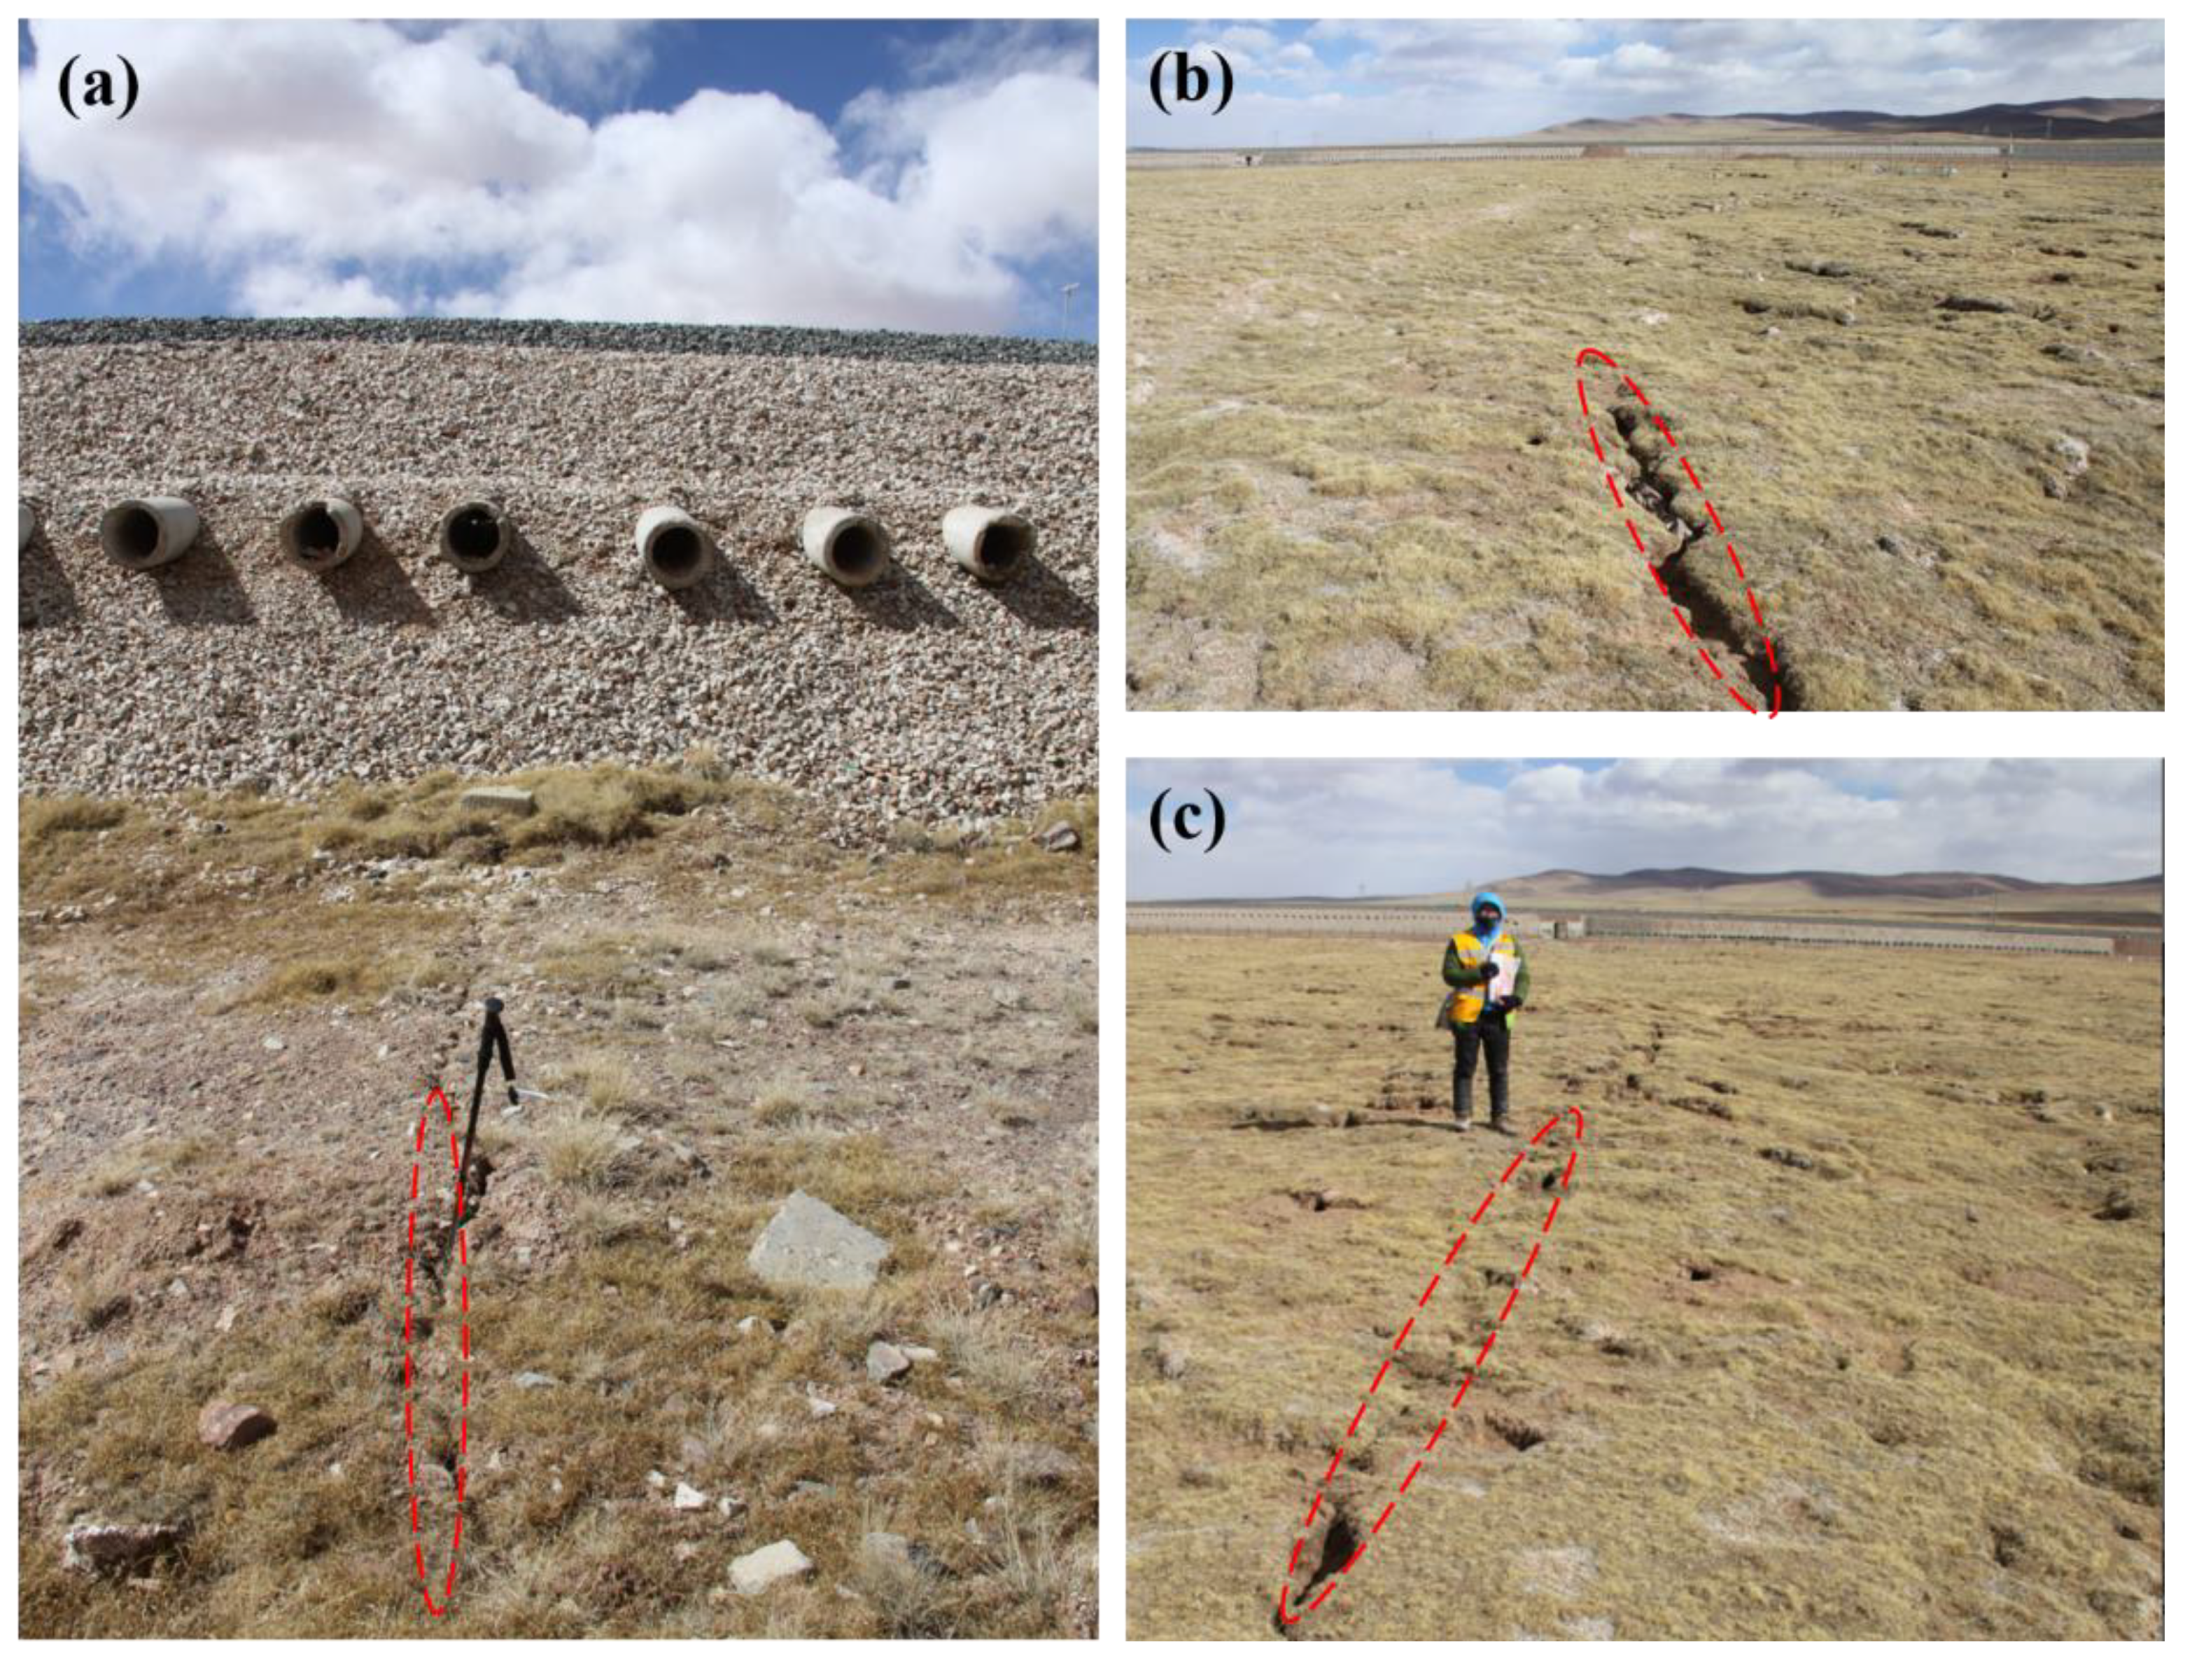
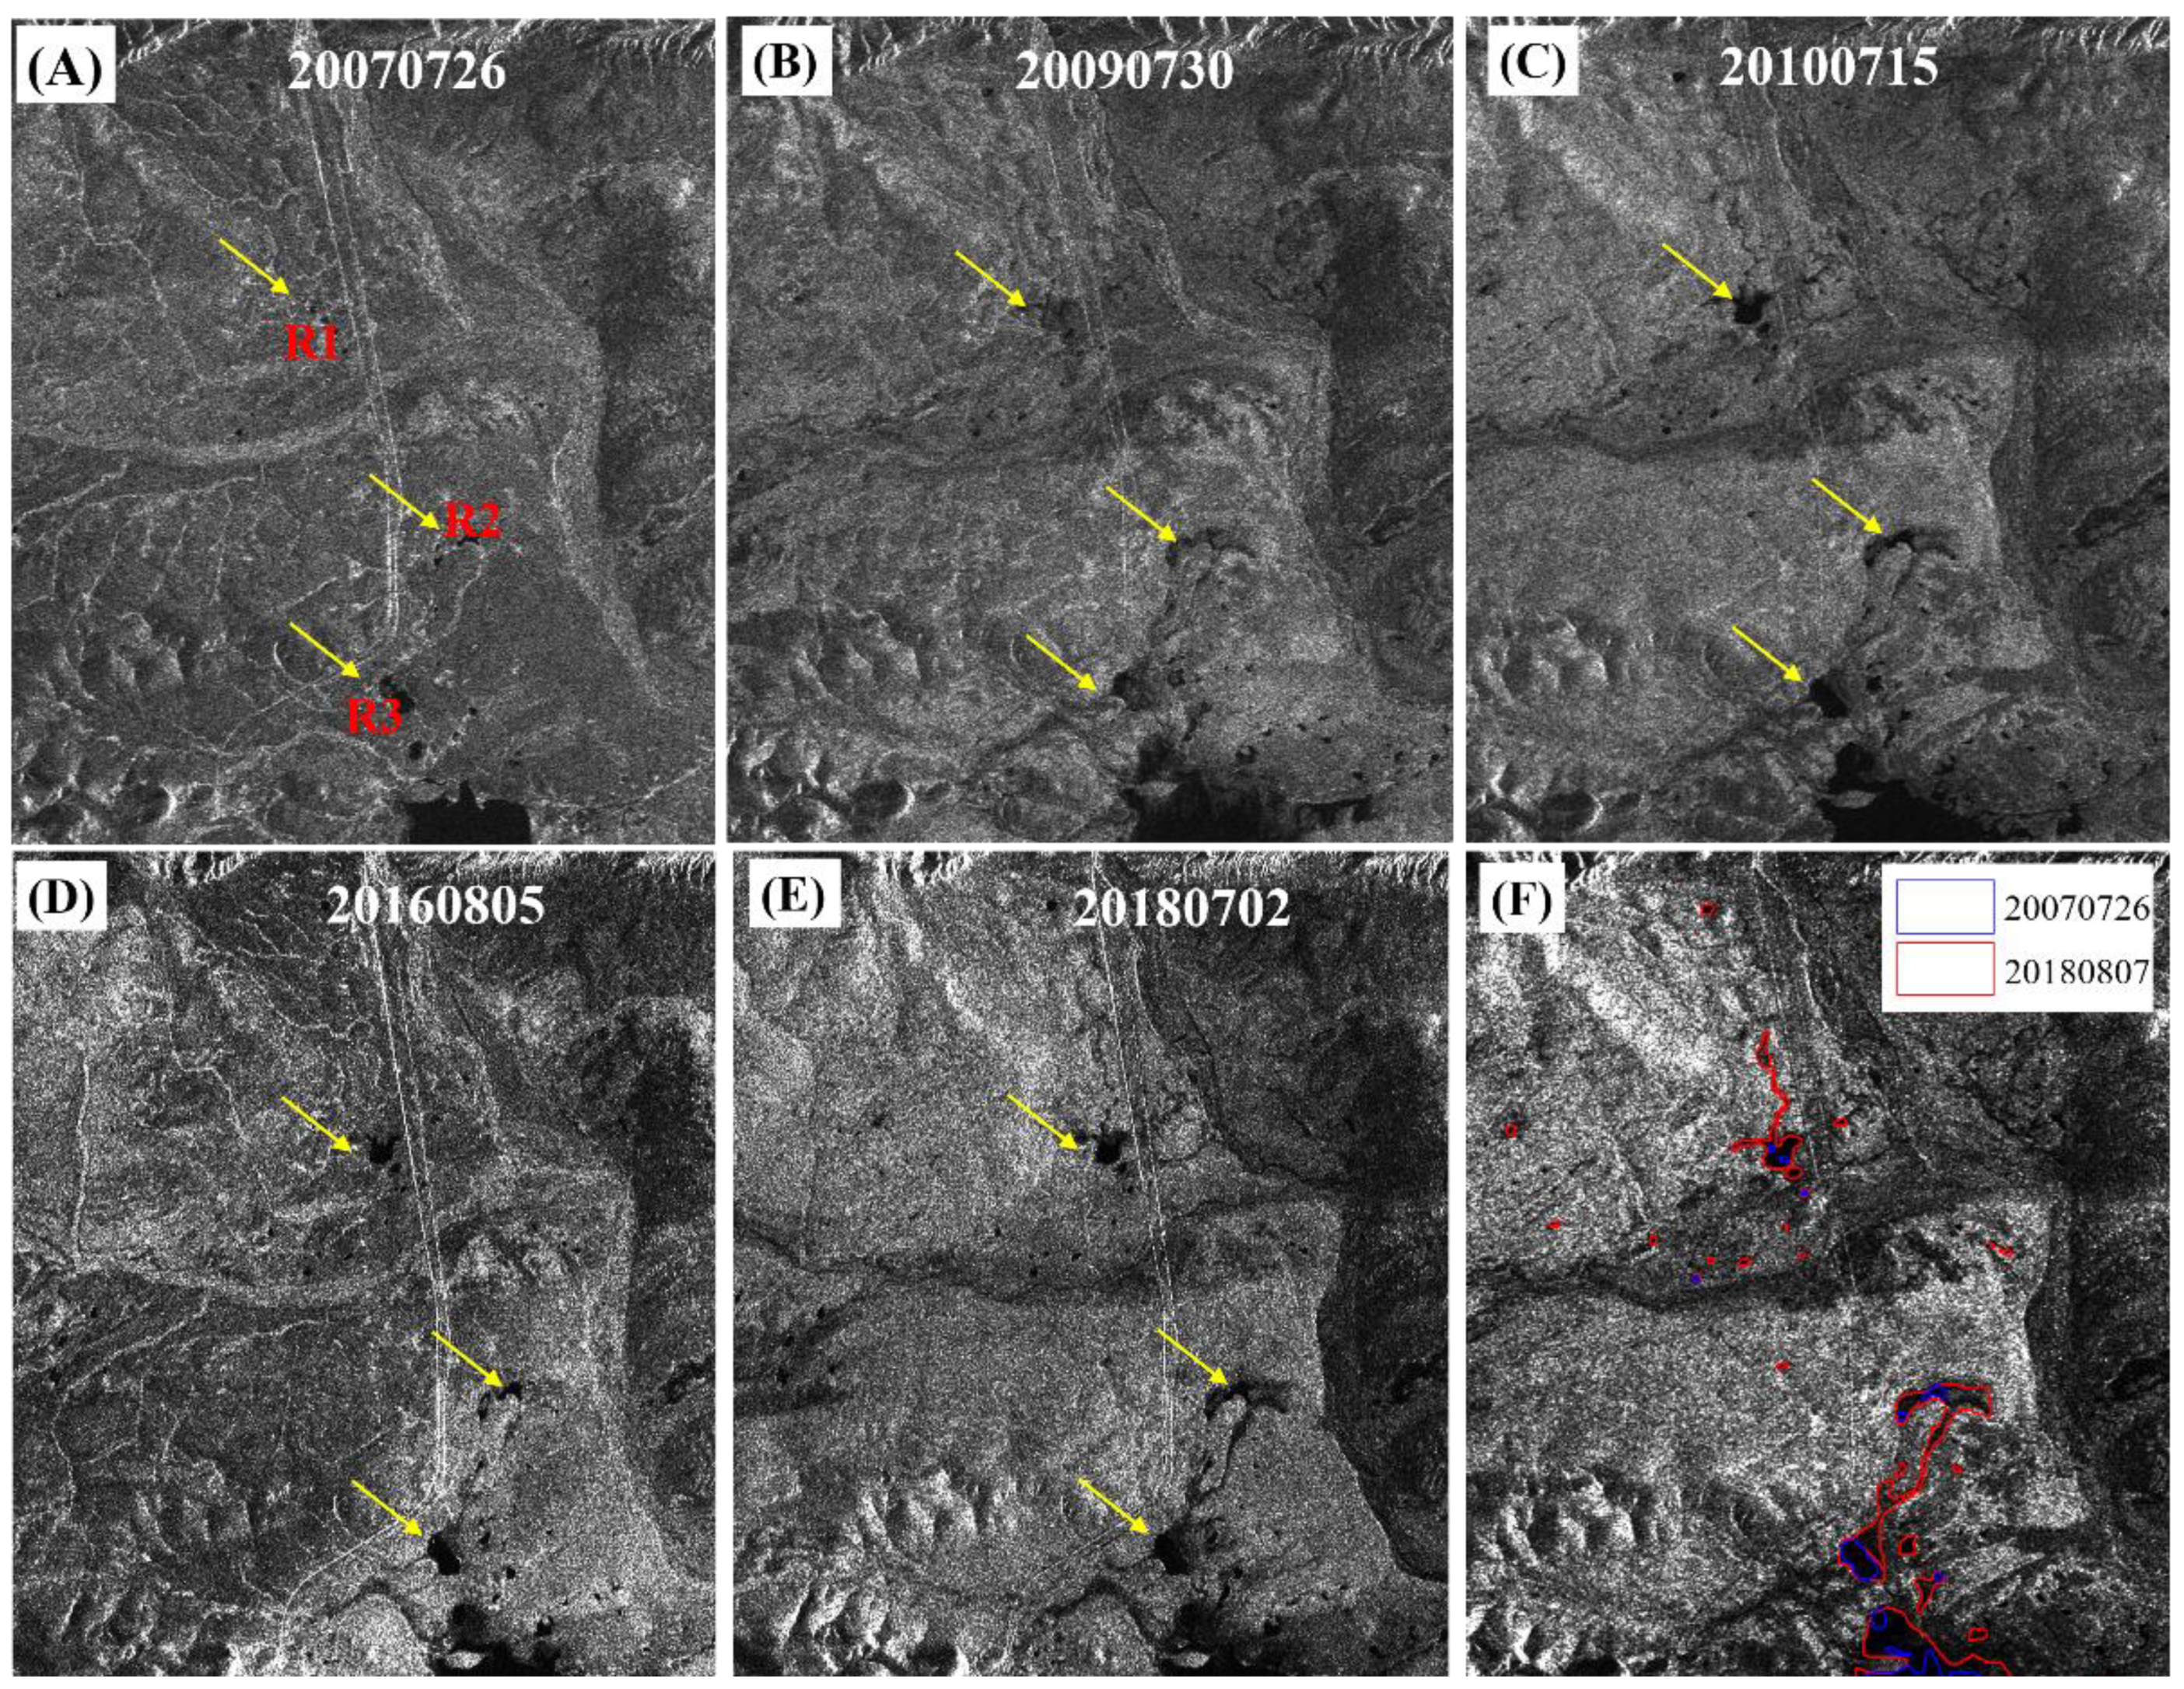
4.3.2. Deformation and Thaw Slumping
5. Discussion
6. Conclusions
- (1)
- Before the operation of the QTR, the QTEC from Wudaoliang to Tuotuohe was in stable with a deformation velocity of less than −5 mm/year from ERS-1 images. The embankment of the engineering structure was considered stable. The thawing and freezing of the active layer were the main deformation driving-forces. After the QTR started operation and the human activities increased, some sections of the QTEC were underwent obvious deformation, and the deformation has increased more recently.
- (2)
- From 2015 to 2018, obvious deformation was found in three areas: Beiluhe, southern of Fenghuo Mountain, and Tuotuohe, with the large deformation rates of over −20 mm/year. Real-time deformation monitoring must be conducted in these sections. The subsiding areas are consistent with the permafrost areas with large MAGTs.
- (3)
- This work demonstrated the potential of the time-series InSAR for the surveillance of the state of QTEC on a large scale. Interferometric decorrelation is still one of the problems for time-series InSAR monitoring of the ground deformation in permafrost region. With the proposed innovative methods and newly-launched SAR systems with shorter revisit cycles (Sentinel-1A/1B and TerraSAR-L), higher temporal sampling allows us to better characterize the ground deformation related to the process of permafrost thawing and freezing.
Author Contributions
Funding
Acknowledgments
Conflicts of Interest
References
- Short, N.; Brisco, B.; Couture, N.; Pollard, W.; Murnaghan, K.; Budkewitsch, P. A comparison of Terrasar-x, Radarsat-2 and ALOS-PALSAR interferometry for monitoring permafrost environments, case study from Herschel Island, Canada. Remote Sens. Environ. 2011, 115, 3491–3506. [Google Scholar] [CrossRef]
- Widhalm, B.; Bartsch, A.; Leibman, M.; Khomutov, A. Active-layer thickness estimation from x-band SAR backscatter intensity. Cryosphere 2017, 11, 483–496. [Google Scholar] [CrossRef]
- Liu, X.; Chen, B. Climatic warming in the Tibetan Plateau during recent decades. Int. J. Climatol. 2000, 20, 1729–1742. [Google Scholar] [CrossRef]
- Osterkamp, T.E. Characteristics of the recent warming of permafrost in Alaska. J. Geophys. Res. Earth Surf. 2007, 112. [Google Scholar] [CrossRef]
- Wu, Q.; Zhang, T.; Liu, Y. Permafrost temperatures and thickness on the Qinghai-Tibet Plateau. Global Planet. Chang. 2010, 72, 32–38. [Google Scholar] [CrossRef]
- Niu, F.; Lin, Z.; Liu, H.; Lu, J. Characteristics of thermokarst lakes and their influence on permafrost in Qinghai–Tibet Plateau. Geomorphology 2011, 132, 222–233. [Google Scholar] [CrossRef]
- Cheng, G. A roadbed cooling approach for the construction of Qinghai–Tibet Railway. Cold Reg. Sci. Technol. 2005, 42, 169–176. [Google Scholar] [CrossRef]
- Ma, W.; Mu, Y.; Wu, Q.; Sun, Z.; Liu, Y. Characteristics and mechanisms of embankment deformation along the Qinghai–Tibet railway in permafrost regions. Cold Reg. Sci. Technol. 2011, 67, 178–186. [Google Scholar] [CrossRef]
- Wu, Q.; Shi, B.; Fang, H.Y. Engineering geological characteristics and processes of permafrost along the Qinghai–Xizang (Tibet) Highway. Eng. Geol. 2003, 68, 387–396. [Google Scholar] [CrossRef]
- He, R.; Jin, H. Permafrost and cold-region environmental problems of the oil product pipeline from Golmud to Lhasa on the Qinghai–Tibet Plateau and their mitigation. Cold Reg. Sci. Technol. 2010, 64, 279–288. [Google Scholar] [CrossRef]
- Yu, Q.; Zhang, Z.; Wang, G.; Lei, G.; Wang, X.; Wang, P.; Bao, Z. Analysis of tower foundation stability along the qinghai–tibet power transmission line and impact of the route on the permafrost. Cold Reg. Sci. Technol. 2016, 121, 205–213. [Google Scholar] [CrossRef]
- Jin, H.; Wei, Z.; Wang, S.; Yu, Q.; Lü, L.; Wu, Q.; Ji, Y. Assessment of frozen-ground conditions for engineering geology along the Qinghai–Tibet highway and railway, China. Eng. Geol. 2008, 101, 96–109. [Google Scholar] [CrossRef]
- Cheng, G.; Wu, T. Responses of permafrost to climate change and their environmental significance, qinghai-tibet plateau. J. Geophys. Res. 2007, 112. [Google Scholar] [CrossRef]
- Pastick, N.J.; Jorgenson, M.T.; Wylie, B.K.; Nield, S.J.; Johnson, K.D.; Finley, A.O. Distribution of near-surface permafrost in Alaska: Estimates of present and future conditions. Remote Sens. Environ. 2015, 168, 301–315. [Google Scholar] [CrossRef]
- Rouyet, L.; Lauknes, T.R.; Christiansen, H.H.; Strand, S.M.; Larsen, Y. Seasonal dynamics of a permafrost landscape, Adventdalen, Svalbard, investigated by InSAR. Remote Sens. Environ. 2019, 231, 111236. [Google Scholar] [CrossRef]
- Amelung, F.; Galloway, D.L.; Bell, J.W.; Zebker, H.A.; Laczniak, R.J. Sensing the ups and downs of lavages: InSAR reveals structural control of land subsidence and aquifer-system deformation. Geology 1999, 27, 483. [Google Scholar] [CrossRef]
- Massonnet, D.; Briole, P.; Arnaud, A. Deflation of Mount Etna monitored by spaceborne radar interferometry. Nature 1995, 375, 567–570. [Google Scholar] [CrossRef]
- Massonnet, D.; Rossi, M.; Carmona, C.; Adragna, F.; Peltzer, G.; Feigl, K.; Rabaute, T. The displacement field of the Landers earthquake mapped by radar interferometry. Nature 1993, 364, 138–142. [Google Scholar] [CrossRef]
- Liu, Y.; Zhao, C.; Zhang, Q.; Yang, C.; Zhang, J. Land subsidence in Taiyuan, China, monitored by InSAR technique with multisensor SAR datasets from 1992 to 2015. IEEE J. Sel. Top. Appl. Earth Obs. Remote Sens. 2018, 11, 1509–1519. [Google Scholar] [CrossRef]
- Ma, P.; Wang, W.; Zhang, B.; Wang, J.; Shi, G.; Huang, G.; Chen, F.; Jiang, L.; Lin, H. sensing large- and small-scale ground subsidence: A case study of the Guangdong–Hong Kong–Macao Greater Bay Area of China. Remote Sens. Environ. 2019, 232, 111282. [Google Scholar] [CrossRef]
- Liu, L.; Schaefer, K.; Zhang, T.; Wahr, J. Estimating 1992–2000 average active layer thickness on the Alaskan North Slope from remotely sensed surface subsidence. J. Geophys. Res. Earth Surf. 2012, 117. [Google Scholar] [CrossRef]
- Short, N.; Leblanc, A.M.; Sladen, W.; Oldenborger, G.; Mathon-Dufour, V.; Brisco, B. Radarsat-2 D-InNSAR for ground displacement in permafrost terrain, validation from Iqaluit airport, Baffin Island, Canada. Remote Sens. Environ. 2014, 141, 40–51. [Google Scholar] [CrossRef]
- Zebker, H.A.; Villasenor, J. Decorrelation in interferometric radar echoes. IEEE Trans. Geosci. Remote Sens. 1992, 30, 950–959. [Google Scholar] [CrossRef]
- Ferretti, A.; Prati, C.; Rocca, F. Nonlinear subsidence rate estimation using permanent scatterers in differential SAR interferometry. IEEE Trans. Geosci. Remote Sens. 2002, 38, 2202–2212. [Google Scholar] [CrossRef]
- Hooper, A.; Zebker, H.; Segall, P.; Kampes, B. A new method for measuring deformation on volcanoes and other natural terrains using INSAR persistent scatterers. Geophys. Rese. Lett. 2004, 31. [Google Scholar] [CrossRef]
- Berardino, P.; Fornaro, G.; Lanari, R.; Sansosti, E. A new algorithm for surface deformation monitoring based on small baseline differential SAR interferograms. IEEE Trans. Geosci. Remote Sens. 2002, 40, 2375–2383. [Google Scholar] [CrossRef]
- Mora, O.; Mallorqui, J.J.; Broquetas, A. Linear and nonlinear terrain deformation maps from a reduced set of interferometric SAR images. IEEE Trans. Geosci. Remote Sens. 2003, 41, 2243–2253. [Google Scholar] [CrossRef]
- Perissin, D.; Wang, T. Repeat-pass SAR interferometry with partially coherent targets. IEEE Trans. Geosci. Remote Sens. 2012, 50, 271–280. [Google Scholar] [CrossRef]
- Xie, C.; Li, Z.; Xu, J.; Li, X. Analysis of deformation over permafrost regions of Qinghai-Tibet plateau based on permanent scatterers. Int. J. Remote Sens. 2010, 31, 1995–2008. [Google Scholar] [CrossRef]
- Chen, F.; Lin, H.; Li, Z.; Chen, Q.; Zhou, J. Interaction between permafrost and infrastructure along the Qinghai–Tibet Railway detected via jointly analysis of C-and L-band small baseline SAR interferometry. Remote Sens. Environ. 2012, 123, 532–540. [Google Scholar] [CrossRef]
- Chen, F.; Lin, H.; Zhou, W.; Hong, T.; Wang, G. Surface deformation detected by ALOS PALSAR small baseline SAR interferometry over permafrost environment of Beiluhe section, Tibet Plateau, China. Remote Sens. Environ. 2013, 138, 10–18. [Google Scholar] [CrossRef]
- Li, Z.; Tang, P.; Zhou, J.; Tian, B.; Chen, Q.; Fu, S. Permafrost environment monitoring on the Qinghai-Tibet Plateau using time series ASAR images. Int. J. Digit. Earth 2015, 8, 840–860. [Google Scholar] [CrossRef]
- Chang, L.; Hanssen, R.F. Detection of permafrost sensitivity of the Qinghai–Tibet railway using satellite radar interferometry. Int. J. Remote Sens. 2015, 36, 691–700. [Google Scholar] [CrossRef]
- Li, Y.; Zhang, J.; Li, Z.; Luo, Y.; Jiang, W.; Tian, Y. Measurement of subsidence in the Yangbajing geothermal fields, Tibet, from TerraSAR-X InSAR time series analysis. Int. J. Digit. Earth 2016, 9, 697–709. [Google Scholar] [CrossRef]
- Zhao, R.; Li, Z.W.; Feng, G.C.; Wang, Q.J.; Hu, J. Monitoring surface deformation over permafrost with an improved SBAS-InSAR algorithm: With emphasis on climatic factors modeling. Remote Sens. Environ. 2016, 184, 276–287. [Google Scholar] [CrossRef]
- Jia, Y.; Kim, J.W.; Shum, C.; Lu, Z.; Ding, X.; Zhang, L.; Erkan, K.; Kuo, C.-Y.; Shang, K.; Tseng, K.-H.; et al. Characterization of active layer thickening rate over the northern Qinghai-Tibetan plateau permafrost region using ALOS interferometric synthetic aperture radar data, 2007–2009. Remote Sens. 2017, 9, 84. [Google Scholar] [CrossRef] [Green Version]
- Wang, C.; Zhang, Z.; Zhang, H.; Zhang, B.; Tang, Y.; Wu, Q. Active Layer Thickness Retrieval of Qinghai–Tibet Permafrost Using the TerraSAR-X InSAR Technique. IEEE J. Sel. Top. Appl. Earth Obs. Remote Sens. 2018, 11, 4403–4413. [Google Scholar] [CrossRef]
- Zhang, X.; Zhang, H.; Wang, C.; Zhang, B.; Wu, F.; Wang, J.; Zhang, Z. Time-Series InSAR Monitoring of Permafrost Freeze-Thaw Seasonal Displacement over Qinghai–Tibetan Plateau Using Sentinel-1 Data. Remote Sens. 2019, 11, 1000. [Google Scholar] [CrossRef] [Green Version]
- Daout, S.; Doin, M.P.; Peltzer, G.; Socquet, A.; Lasserre, C. Large-scale InSAR monitoring of permafrost freeze-thaw cycles on the Tibetan Plateau. Geophys. Rese. Lett. 2017, 44, 901–909. [Google Scholar] [CrossRef]
- Bartsch, A.; Leibman, M.; Strozzi, T.; Khomutov, A.; Widhalm, B.; Babkina, E.; Mullanurov, D.; Ermokhina, K.; Kroisleitner, C.; Bergstedt, H. Seasonal Progression of Ground Displacement Identified with Satellite Radar Interferometry and the Impact of Unusually Warm Conditions on Permafrost at the Yamal Peninsula in 2016. Remote Sens. 2019, 11, 1865. [Google Scholar] [CrossRef] [Green Version]
- Dai, K.; Li, Z.; Tomás, R.; Liu, G.; Yu, B.; Wang, X.; Cheng, H.; Chen, J.; Stockamp, J. Monitoring activity at the Daguangbao mega-landslide (China) using Sentinel-1 TOPS time series interferometry. Remote Sens. Environ. 2016, 186, 501–513. [Google Scholar] [CrossRef] [Green Version]
- Hooper, A. A multi-temporal InSAR method incorporating both persistent scatterer and small baseline approaches. Geophys. Rese. Lett. 2008, 35. [Google Scholar] [CrossRef] [Green Version]
- Wu, Q.; Zhang, T.; Liu, Y. Thermal state of the active layer and permafrost along the Qinghai-Xizang (Tibet) Railway from 2006 to 2010. Cryosphere 2012, 6, 607–612. [Google Scholar] [CrossRef] [Green Version]
- Wang, M.; He, G.; Zhang, Z.; Wang, G.; Zhang, Z.; Cao, X.; Wu, Z.; Liu, X. Comparison of spatial interpolation and regression analysis models for an estimation of monthly near surface air temperature in China. Remote Sens. 2017, 9, 1278. [Google Scholar] [CrossRef] [Green Version]
- Jarvis, A.; Reuter, H.I.; Nelson, A.; Guevara, E. Hole-Filled Seamless SRTM Data V4. International Centre for Tropical Agriculture (CIAT). 2008. Available online: http://srtm.csi.cgiar.org (accessed on 30 October 2018).
- Wang, C.; Zhang, Z.; Zhang, H.; Wu, Q.; Zhang, B.; Tang, Y. Seasonal deformation features on Qinghai-Tibet railway observed using time-series InSAR technique with high-resolution TerraSAR-X images. Remote Sens. Lett. 2017, 8, 1–10. [Google Scholar] [CrossRef]
- Zhang, Z.; Wang, C.; Zhang, H.; Tang, Y.; Liu, X. Analysis of permafrost region coherence variation in the Qinghai–Tibet Plateau with a high-resolution TerraSAR-X image. Remote Sens. 2018, 10, 298. [Google Scholar] [CrossRef] [Green Version]
- Lanari, R.; Mora, O.; Manunta, M.; Mallorquí, J.J.; Berardino, P.; Sansosti, E. A small-baseline approach for investigating deformations on full-resolution differential SAR interferograms. IEEE Trans. Geosci. Remote Sens. 2004, 42, 1377–1386. [Google Scholar] [CrossRef]
- Goldstein, R.M.; Werner, C.L. Radar interferogram filtering for geophysical applications. Geophys. Res. Lett. 1998, 25, 4035–4038. [Google Scholar] [CrossRef] [Green Version]
- Li, Z.; Zhao, R.; Hu, J.; Wen, L.; Feng, G.; Zhang, Z.; Wang, Q. InSAR analysis of surface deformation over permafrost to estimate active layer thickness based on one-dimensional heat transfer model of soils. Sci. Rep. 2015, 5, 15542. [Google Scholar] [CrossRef]
- Liu, L.; Schaefer, K.; Gusmeroli, A.; Grosse, G.; Jones, B.M.; Zhang, T.; Parsekian, A.D.; Zebker, H.A. Seasonal thaw settlement at drained thermokarst lake basins, Arctic Alaska. Cryosphere 2014, 8, 815–826. [Google Scholar] [CrossRef] [Green Version]
- Sun, Q.; Zhang, L.; Ding, X.L.; Hu, J.; Li, Z.W.; Zhu, J.J. Slope deformation prior to Zhouqu, China landslide from InSAR time series analysis. Remote Sens. Environ. 2015, 156, 45–57. [Google Scholar] [CrossRef]
- Costantini, M. A novel phase unwrapping method based on network programming. IEEE Trans. Geosci. Remote Sens. 1998, 36, 813–821. [Google Scholar] [CrossRef]
- Ge, L.; Ng, A.H.M.; Li, X.; Abidin, H.Z.; Gumilar, I. Land subsidence characteristics of Bandung Basin as revealed by ENVISAT ASAR and ALOS PALSAR interferometry. Remote Sens. Environ. 2014, 154, 46–60. [Google Scholar] [CrossRef]
- Wang, C.; Zhang, Z.; Paloscia, S.; Zhang, H.; Wu, F.; Wu, Q. Permafrost Soil Moisture Monitoring Using Multi-Temporal TerraSAR-X Data in Beiluhe of Northern Tibet, China. Remote Sens. 2018, 10, 1577. [Google Scholar] [CrossRef] [Green Version]
- Li, X.; Cheng, G.; Jin, H.; Kang, E.; Che, T.; Jin, R.; Wu, L.; Nan, Z.; Wang, J.; Shen, Y. Cryospheric change in China. Global Planet. Chang. 2008, 62, 210–218. [Google Scholar] [CrossRef]
- Lu, J.H.; Niu, F.J.; Lin, Z.J.; Liu, H.; Luo, J. Permafrost modeling and mapping along the Qinghai–Tibet engineering corridor considering slope-aspect. Geogr. Geoinf. Sci. 2012, 28, 63–67. (In Chinese) [Google Scholar]
- Yin, G.; Zheng, H.; Niu, F.; Luo, J.; Lin, Z.; Liu, M. Numerical Mapping and Modeling Permafrost Thermal Dynamics across the Qinghai-Tibet Engineering Corridor, China Integrated with Remote Sensing. Remote Sens. 2018, 10, 2069. [Google Scholar] [CrossRef] [Green Version]
- Niu, F.; Yin, G.; Luo, J.; Lin, Z.; Liu, M. Permafrost distribution along the Qinghai-Tibet Engineering Corridor, China using high-resolution statistical mapping and modeling integrated with remote sensing and GIS. Remote Sens. 2018, 10, 215. [Google Scholar] [CrossRef] [Green Version]
- Niu, F.; Lin, Z.; Lu, J.; Luo, J.; Wang, H. Assessment of terrain susceptibility to thermokarst lake development along the Qinghai–Tibet engineering corridor, China. Environ. Earth Sci. 2015, 73, 5631–5642. [Google Scholar] [CrossRef]
- Luo, J.; Niu, F.; Lin, Z.; Liu, M.; Yin, G. Recent acceleration of thaw slumping in permafrost terrain of Qinghai-Tibet Plateau: An example from the Beiluhe Region. Geomorphology 2019, 341, 79–85. [Google Scholar] [CrossRef]
- Dini, B.; Daout, S.; Manconi, A.; Loew, S. Classification of slope processes based on multitemporal DInSAR analyses in the Himalaya of NW Bhutan. Remote Sens. Environ. 2019, 233, 111408. [Google Scholar] [CrossRef]
- Ferretti, A.; Fumagalli, A.; Novali, F.; Prati, C.; Rocca, F.; Rucci, A. A new algorithm for processing interferometric data-stacks: SqueeSAR. IEEE Trans. Geosci. Remote Sens. 2011, 49, 3460–3470. [Google Scholar] [CrossRef]


| Study Areas | InSAR Method | SAR Dataset | Observation Period | Deformation Rate (mm/year) | References |
|---|---|---|---|---|---|
| Beiluhe | PSI | ENVISAT | August 2003–May 2007 | −20 to 3 | [29] |
| Beiluhe | IPTA and SBAS | ALOS-1 and ENVISAT | November 2004–December 2010 | −20 to 20 | [30] |
| Beiluhe | SBAS | ALOS-1 | June 2007–December 2010 | −20 to 20 | [31] |
| Beiluhe | SBAS | ENVISAT | April 2003–July 2010 | −16 to 2 | [32] |
| Tanggula | PSI | ENVISAT | February 2007–September 2009 | −10 to 0 | [33] |
| Yangbajing | MTInSAR | TerraSAR-X | December 2011–November 2012 | −30 to 10 | [34] |
| Yangbajing | SBAS | ENVISAT | May 2007–September 2010 | −50 to 10 | [35] |
| Wudaoliang | SBAS | ALOS-1 | May 2007–March 2009 | −2 to 0 | [36] |
| Beiluhe | MTInSAR | TerraSAR-X | July 2014–March 2017 | −20 to 0 | [37] |
| Wudaoliang-Fenghuo Mountain | MTInSAR | Sentinle-1A | November 2017–December 2018 | — | [38] |
| Northwestern Tibet | NSBAS (new small baseline subset) | ENVISAT | 2003–2011 | −4 to 4 | [39] |
| Sensors | Start and End Date | Acquisitions (n) | Incidence Angle (°) | Polarization | Pixel Spacing/Range (m) | Pixel Spacing/Azimuth (m) |
|---|---|---|---|---|---|---|
| ERS-1 | 1997-04-24 to 1999-12-30 | 9 | 19.3~26.5 | VV | 7.9 | 3.9 |
| ENVISAT | 2004-11-18 to 2010-07-15 | 39 | 18.6~26.2 | VV | 7.8 | 4 |
| Sentinel-1A | 2015-04-13 to 2018-12-17 | 40 | 30.7~37.6 | VV | 5 | 20 |
| Region | Areas (km2) | ||
|---|---|---|---|
| 26 July 2007 | 7 August 2018 | Change | |
| R1 | 0.023 | 0.458 | 0.435 |
| R2 | 0.068 | 0.747 | 0.679 |
| R3 | 0.244 | 0.561 | 0.317 |
© 2019 by the authors. Licensee MDPI, Basel, Switzerland. This article is an open access article distributed under the terms and conditions of the Creative Commons Attribution (CC BY) license (http://creativecommons.org/licenses/by/4.0/).
Share and Cite
Zhang, Z.; Wang, M.; Wu, Z.; Liu, X. Permafrost Deformation Monitoring Along the Qinghai-Tibet Plateau Engineering Corridor Using InSAR Observations with Multi-Sensor SAR Datasets from 1997–2018. Sensors 2019, 19, 5306. https://doi.org/10.3390/s19235306
Zhang Z, Wang M, Wu Z, Liu X. Permafrost Deformation Monitoring Along the Qinghai-Tibet Plateau Engineering Corridor Using InSAR Observations with Multi-Sensor SAR Datasets from 1997–2018. Sensors. 2019; 19(23):5306. https://doi.org/10.3390/s19235306
Chicago/Turabian StyleZhang, Zhengjia, Mengmeng Wang, Zhijie Wu, and Xiuguo Liu. 2019. "Permafrost Deformation Monitoring Along the Qinghai-Tibet Plateau Engineering Corridor Using InSAR Observations with Multi-Sensor SAR Datasets from 1997–2018" Sensors 19, no. 23: 5306. https://doi.org/10.3390/s19235306