Experimental Validation of Slip-Forming Using Ultrasonic Sensors


Abstract
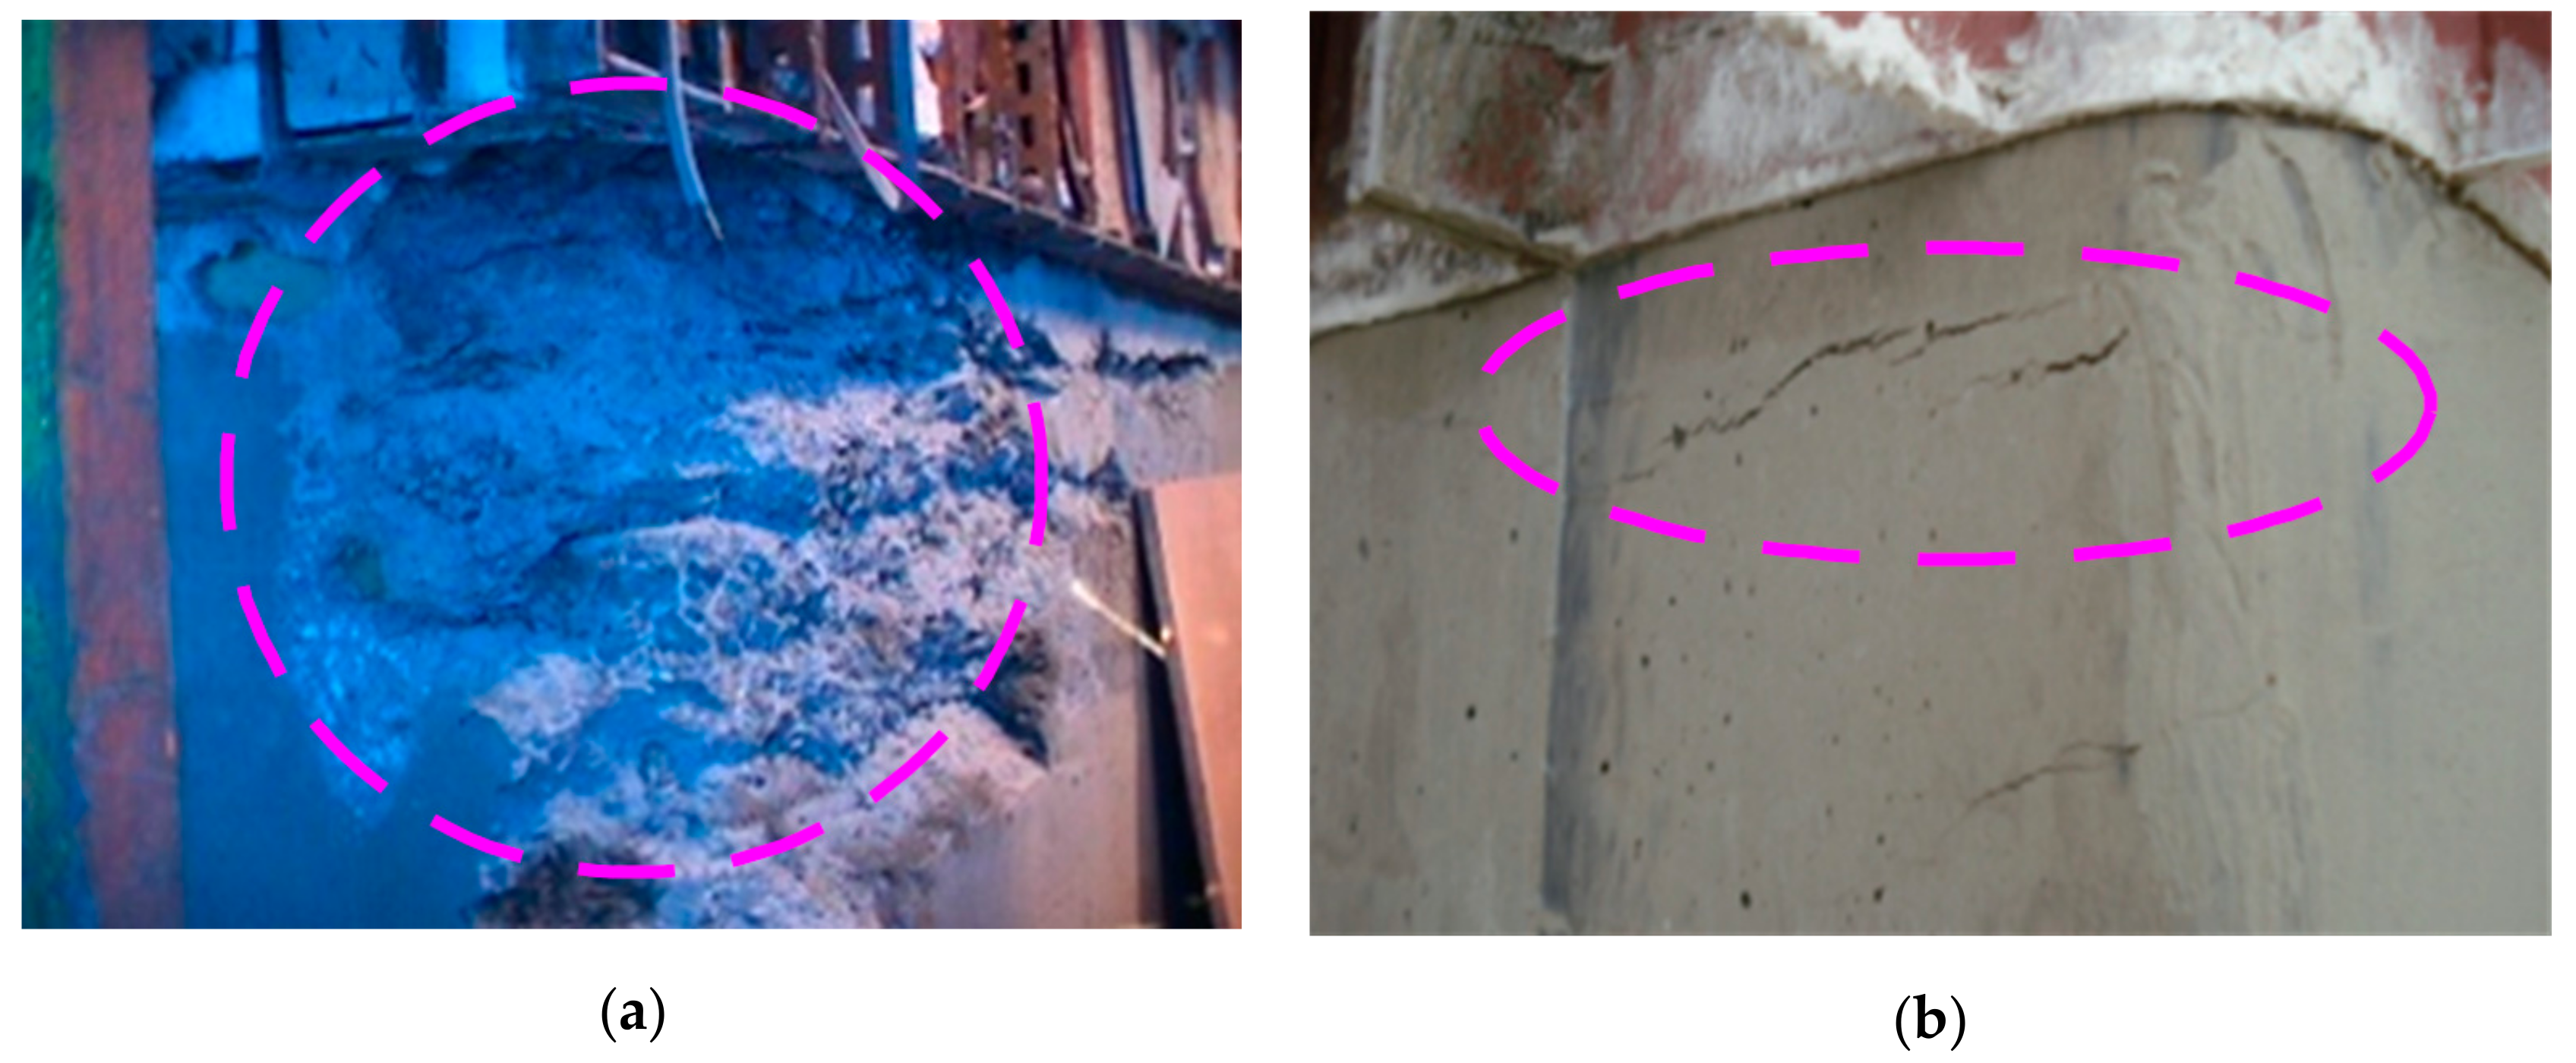
:1. Introduction
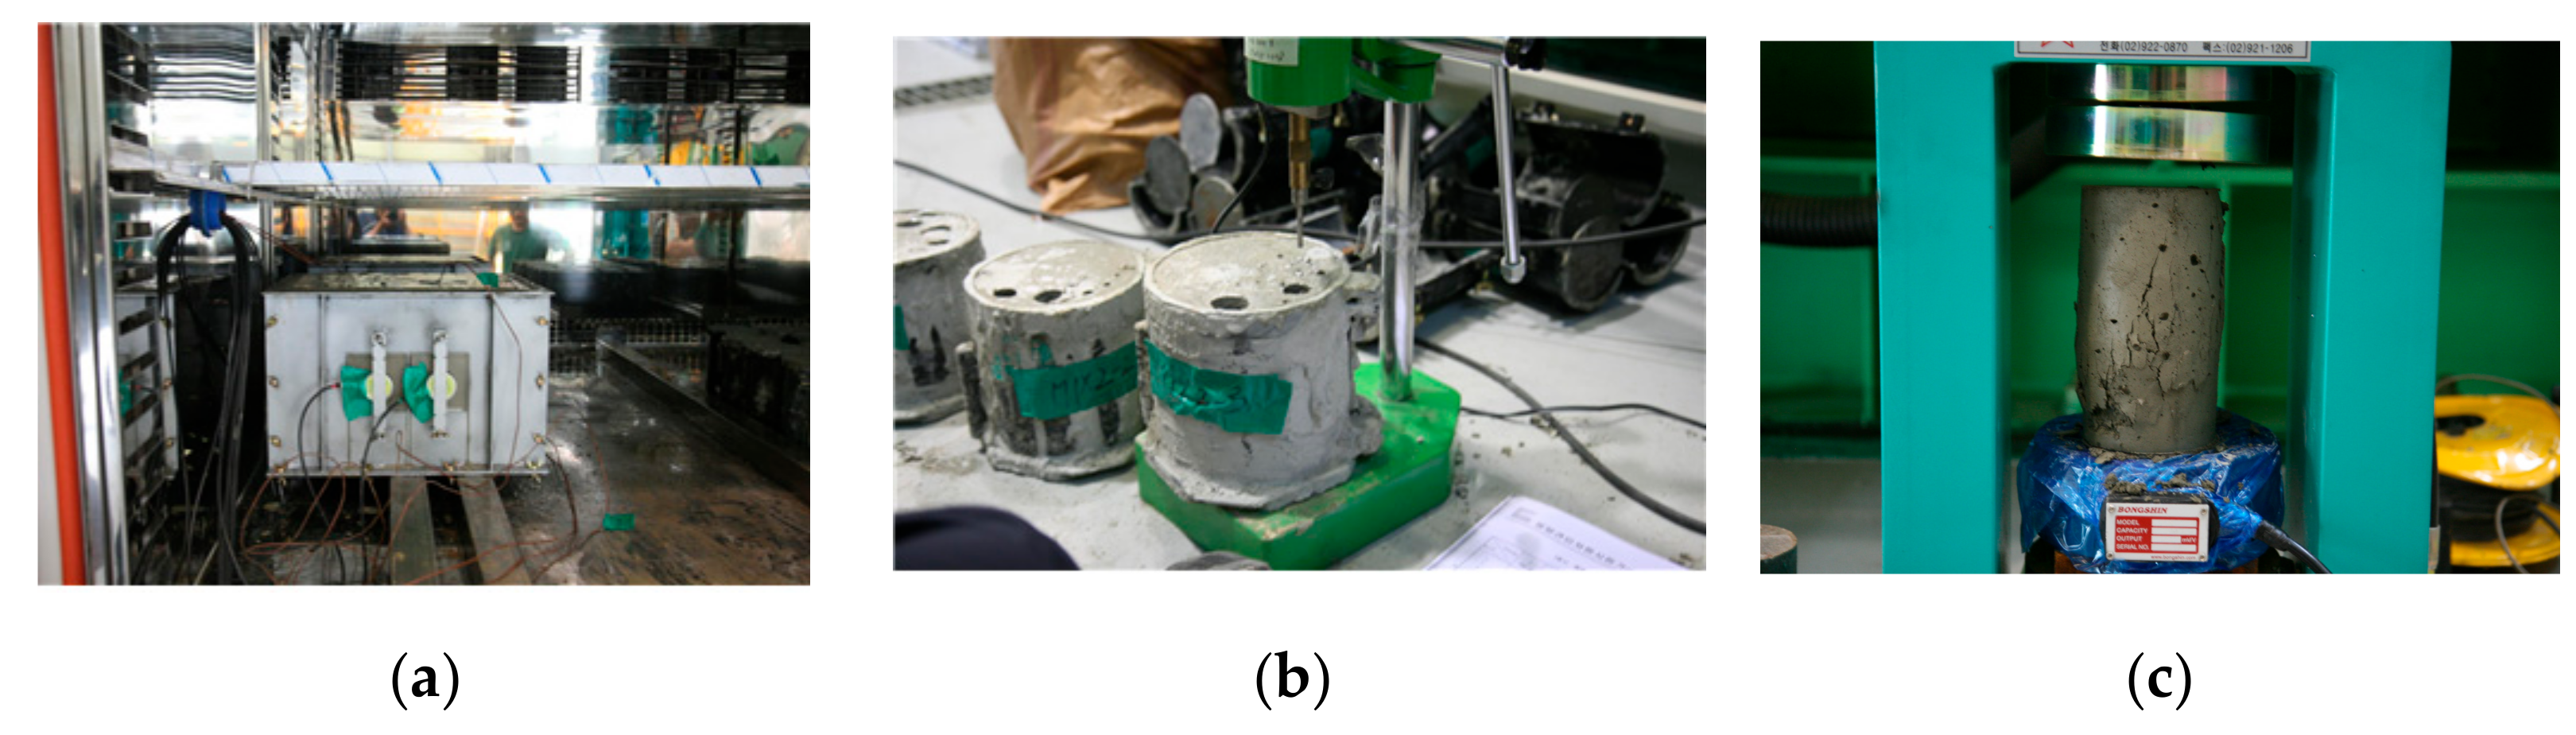
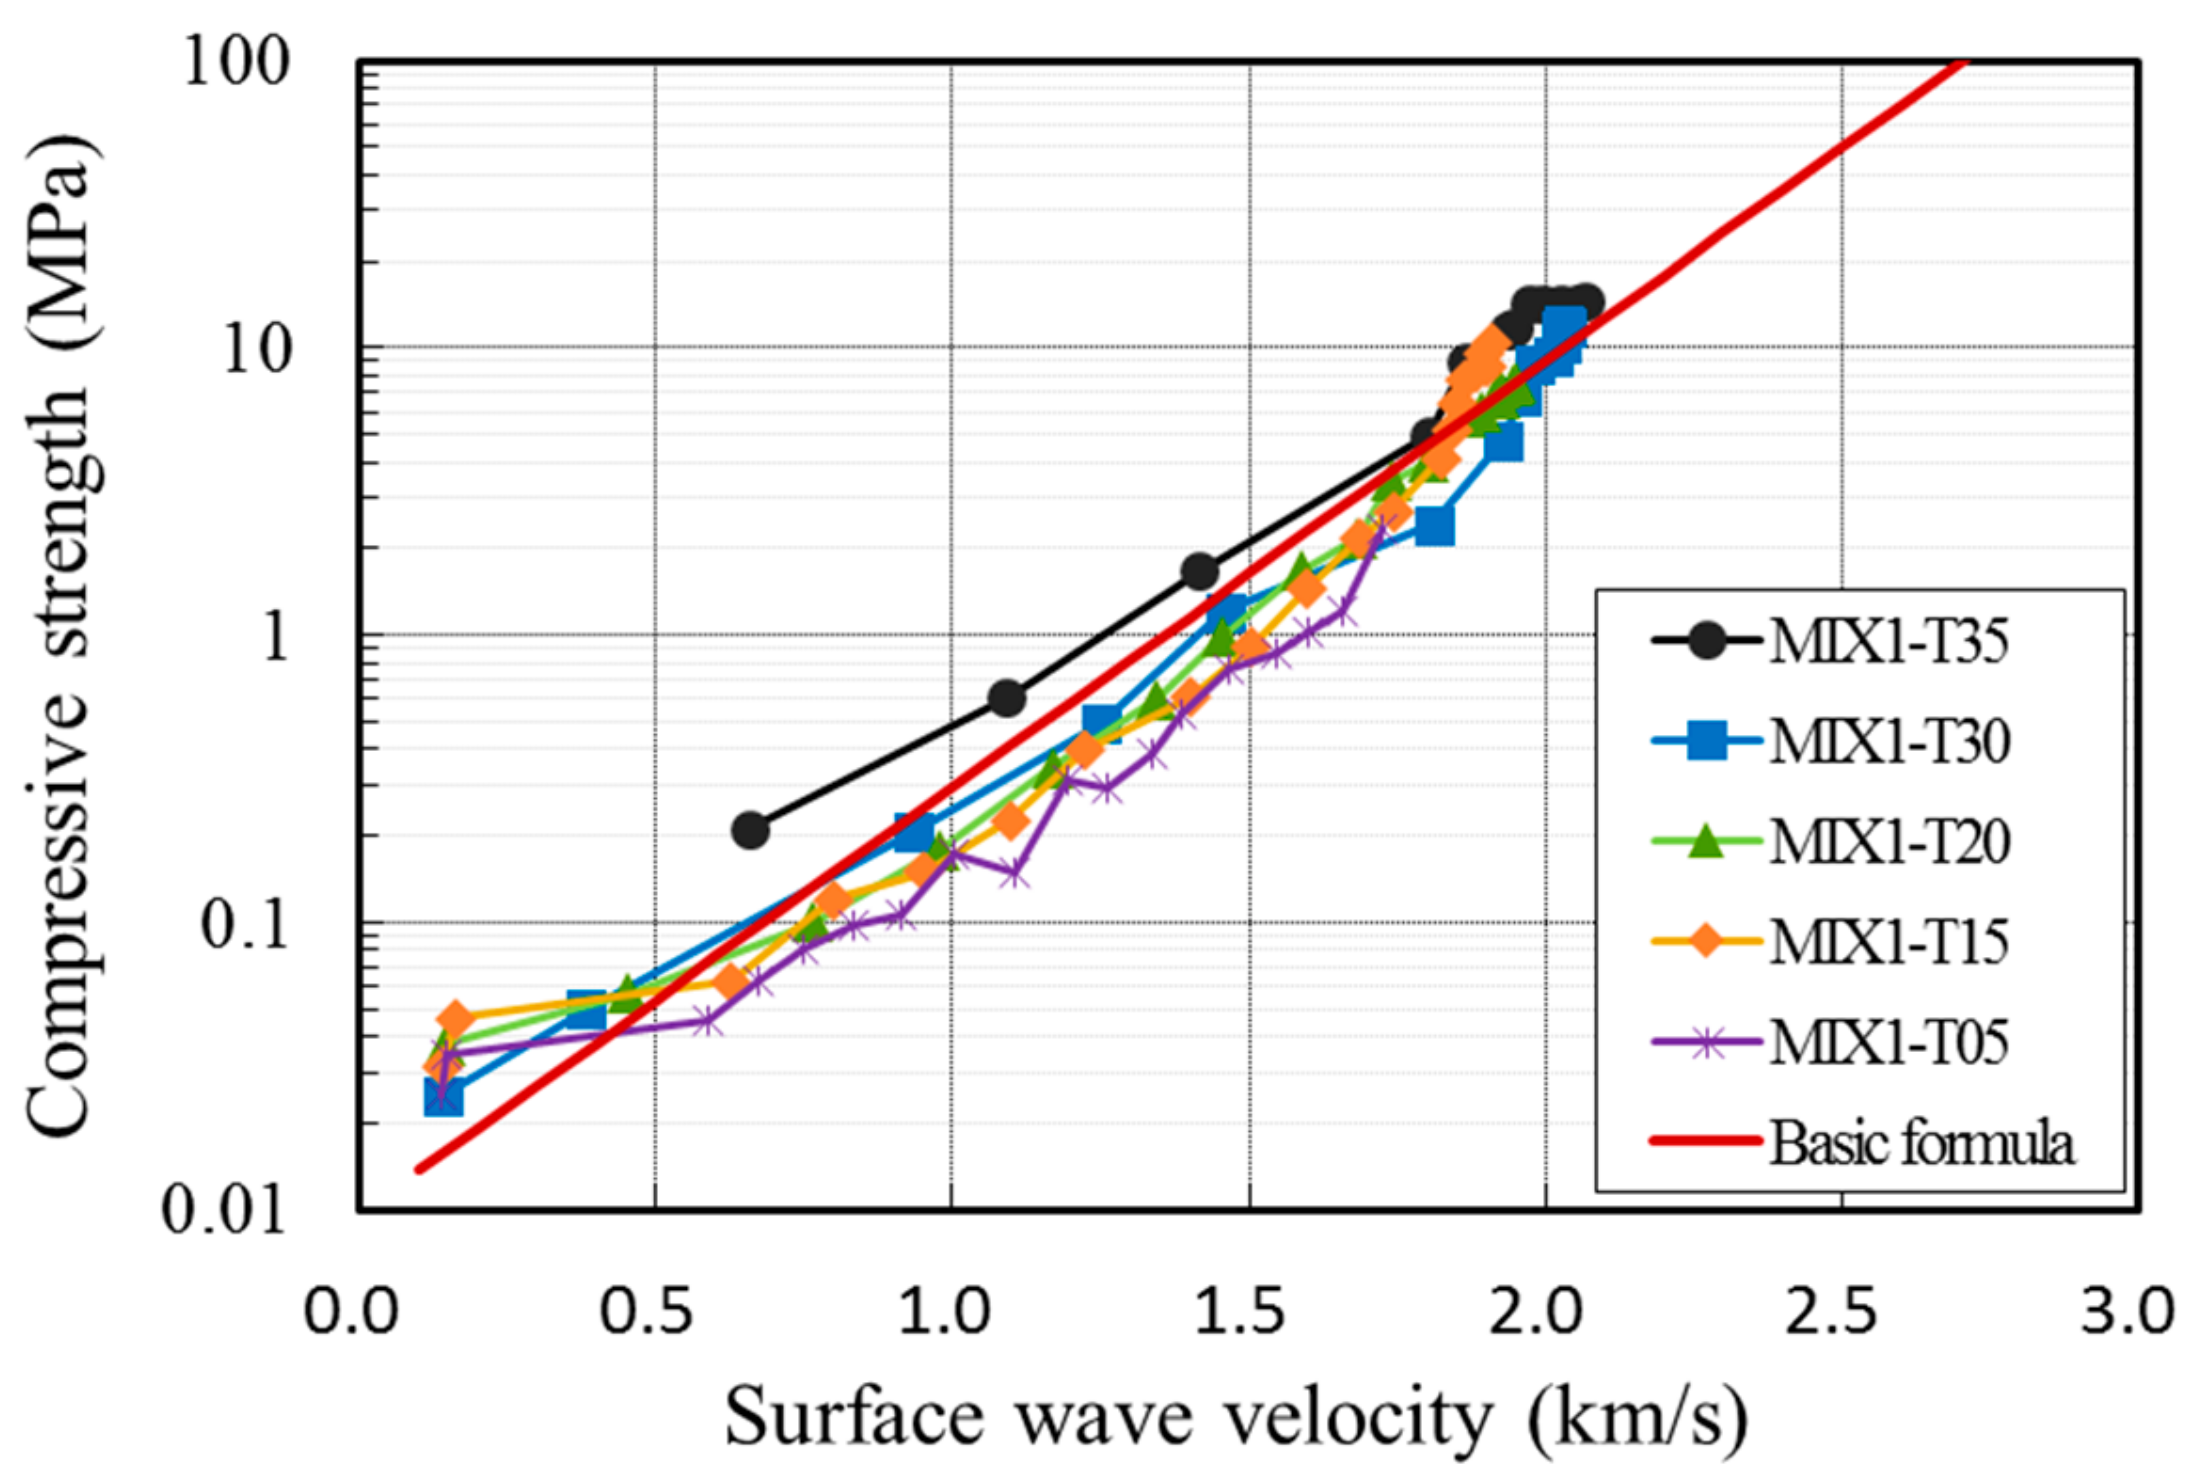
2. Evaluation of the Compressive Strength of Concrete in Early Ages
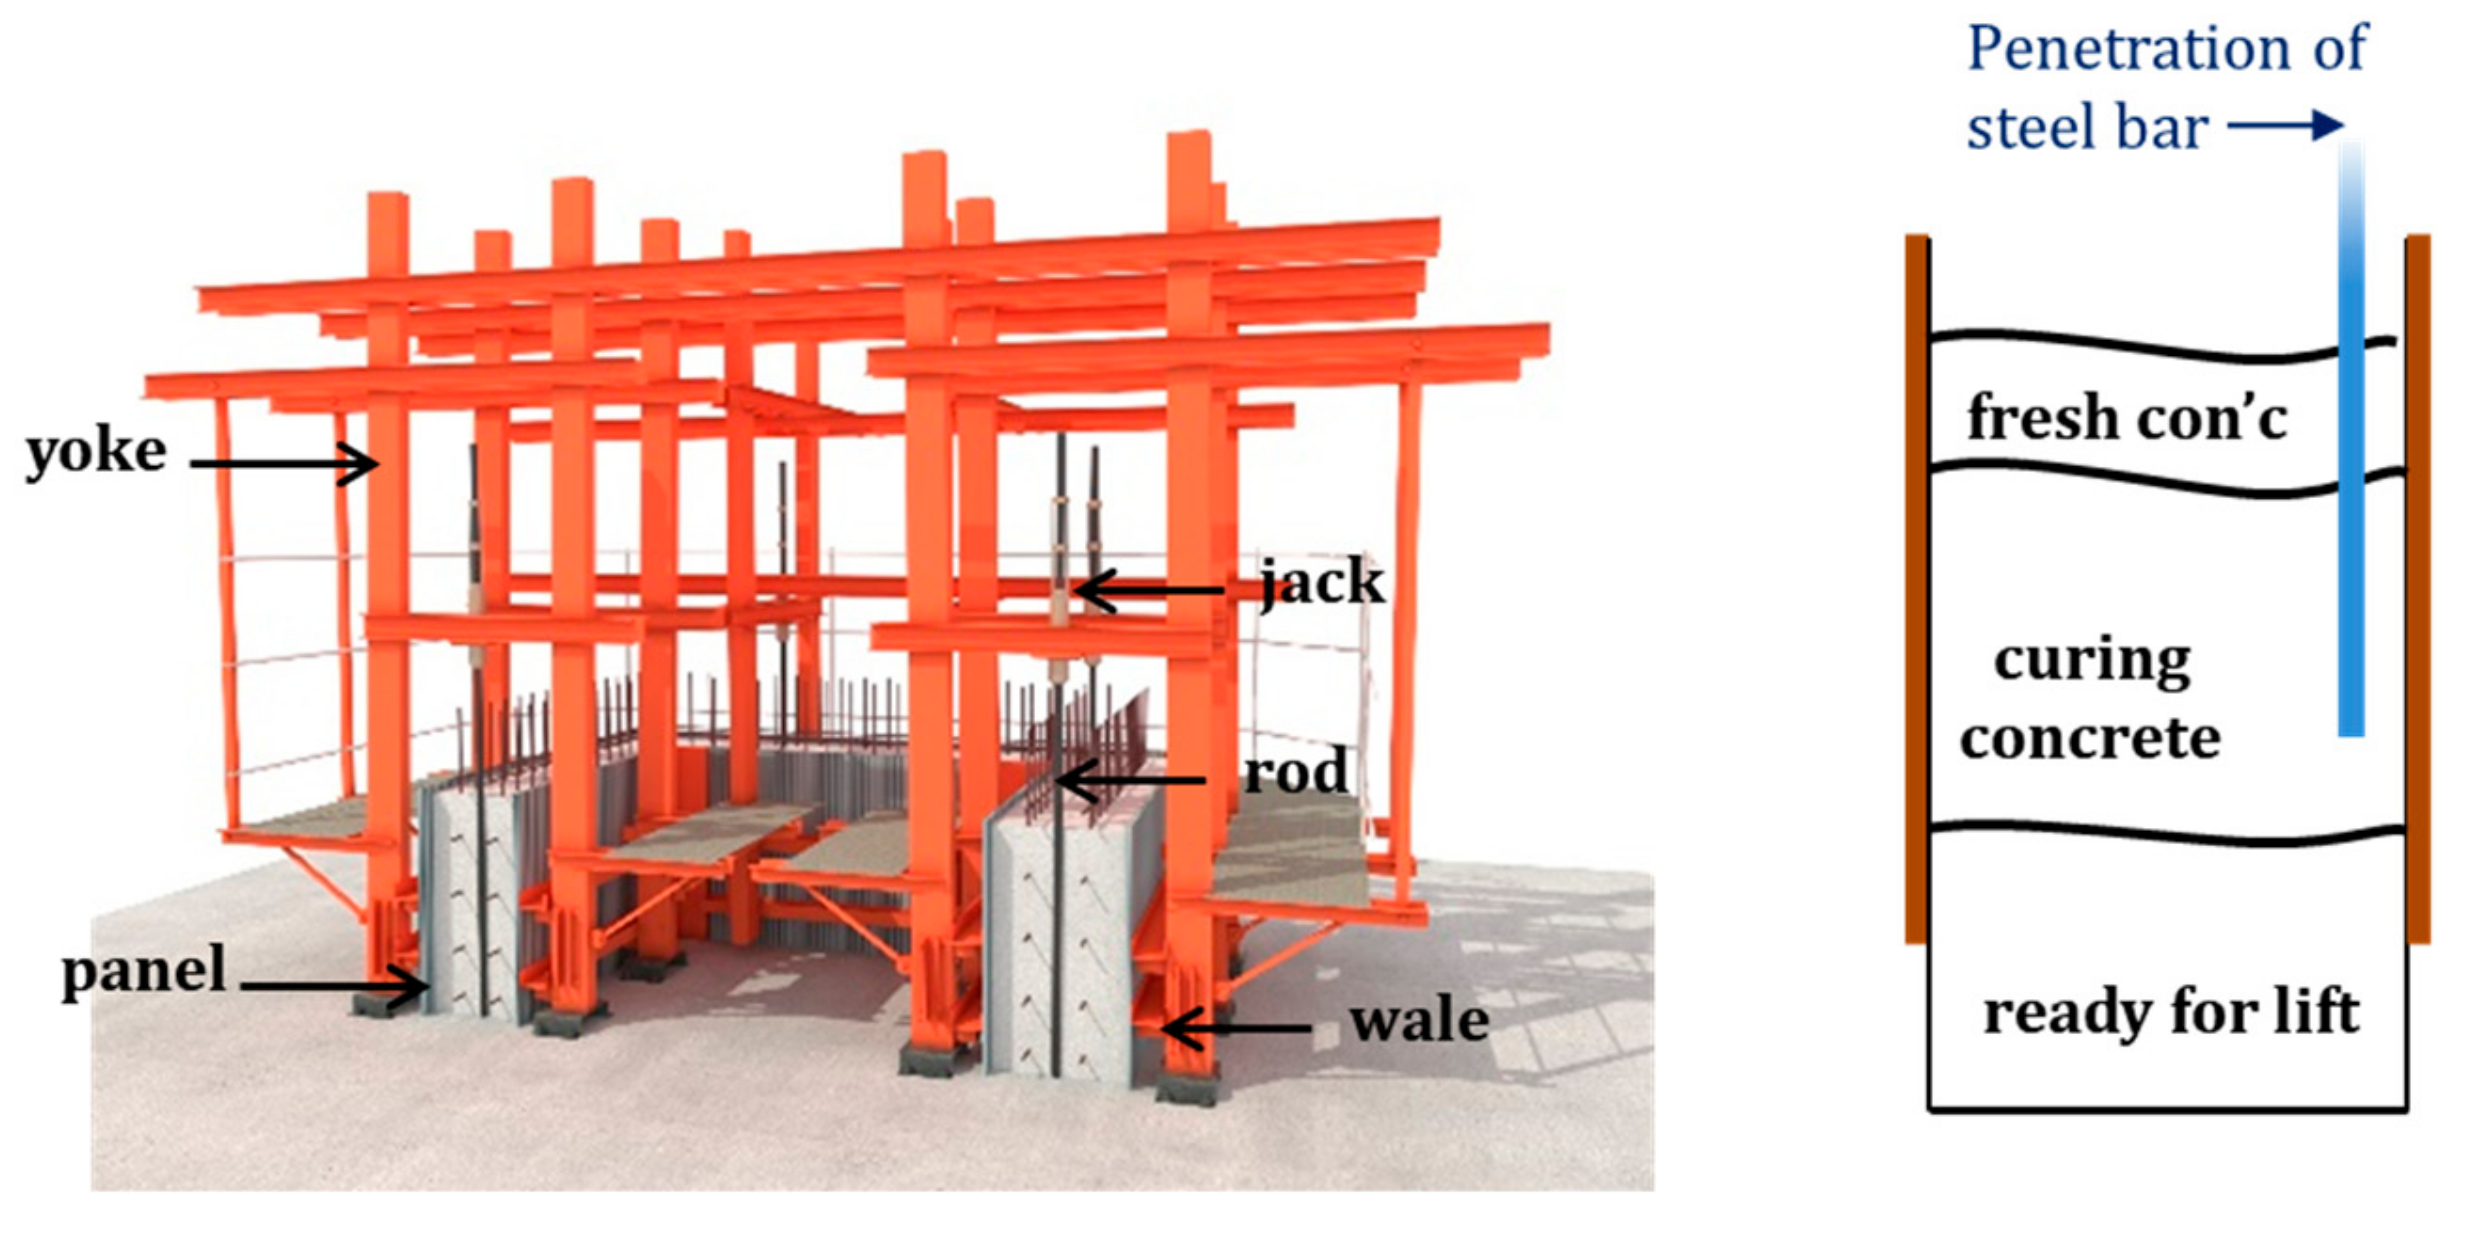
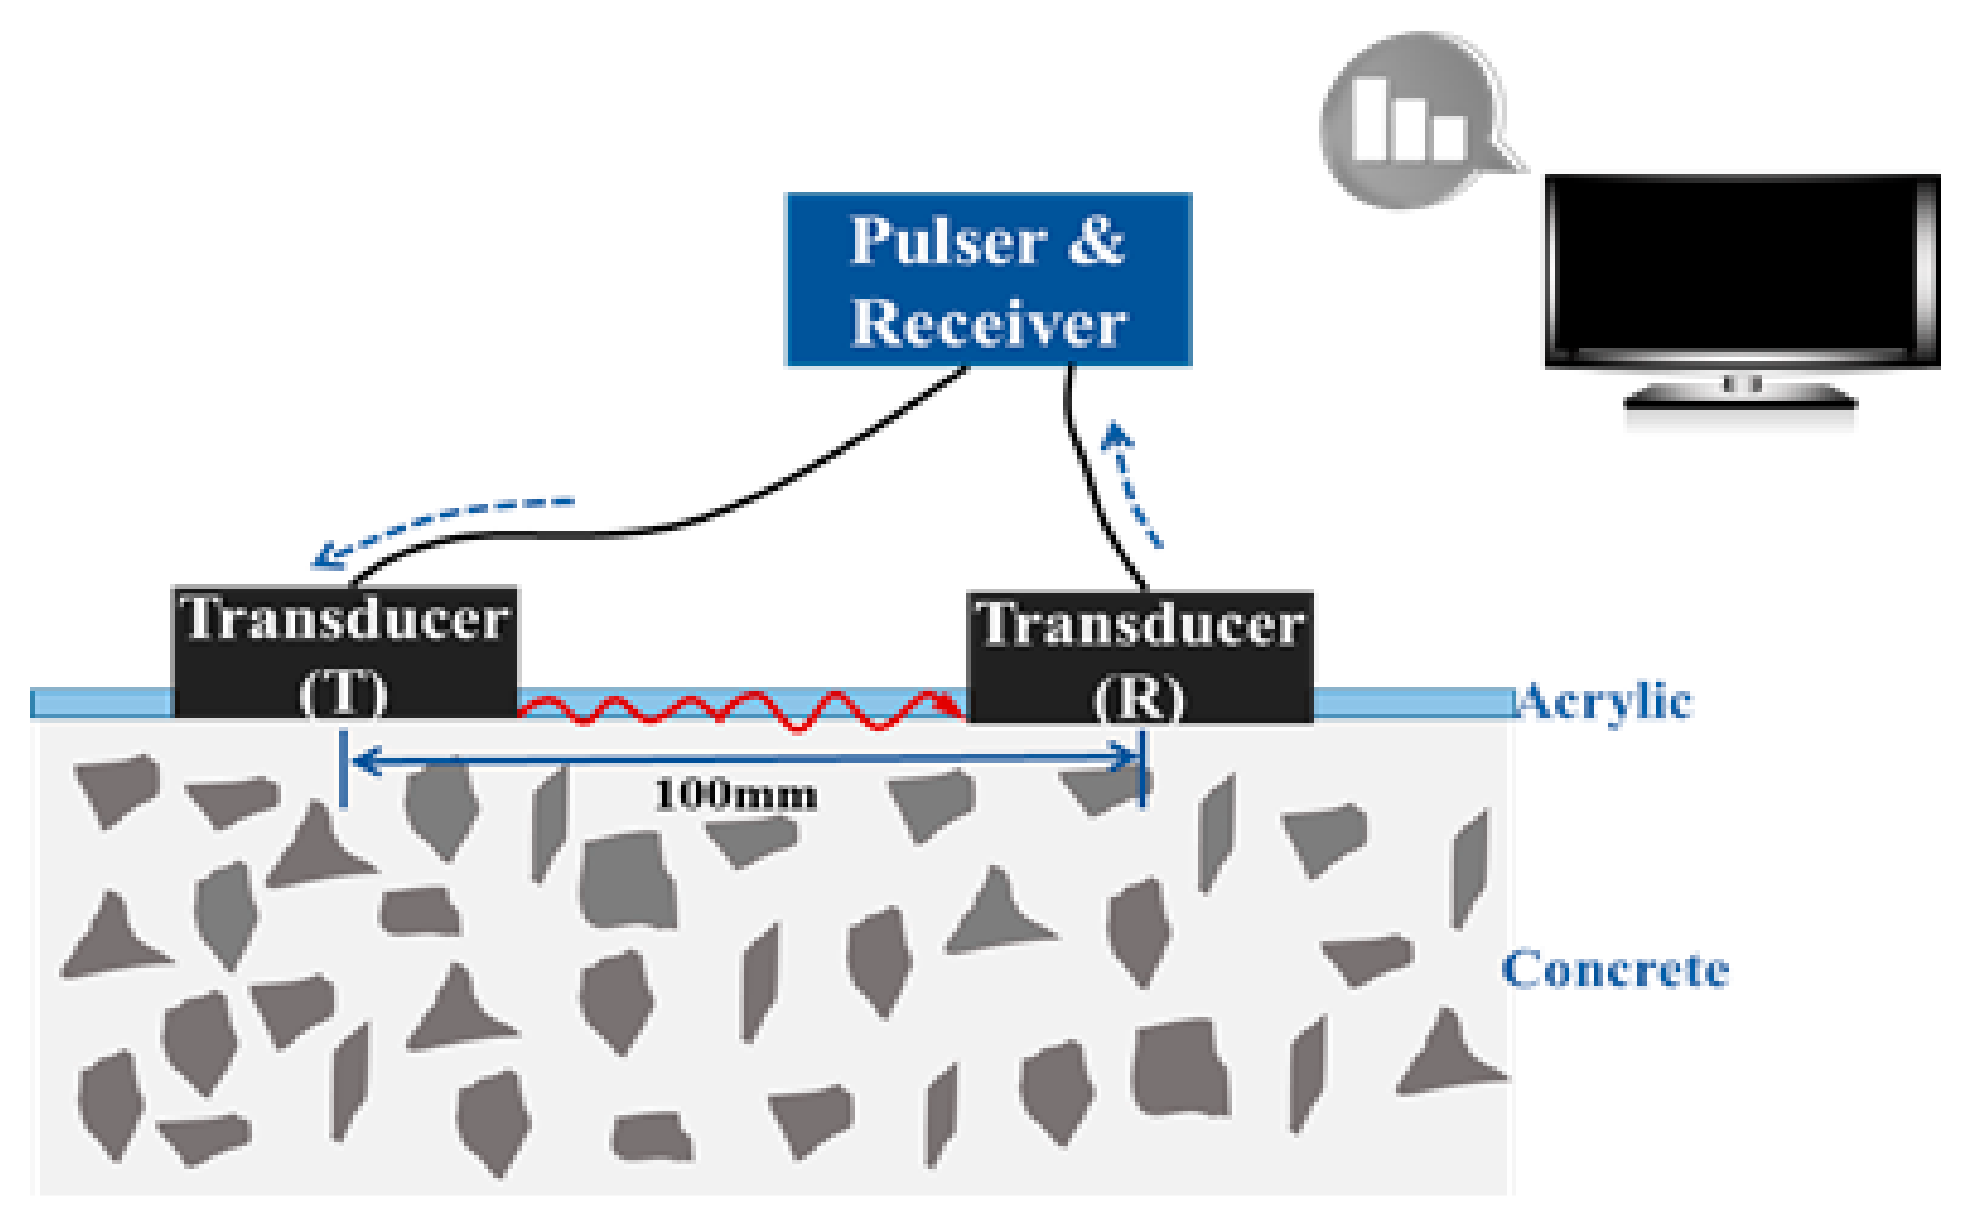
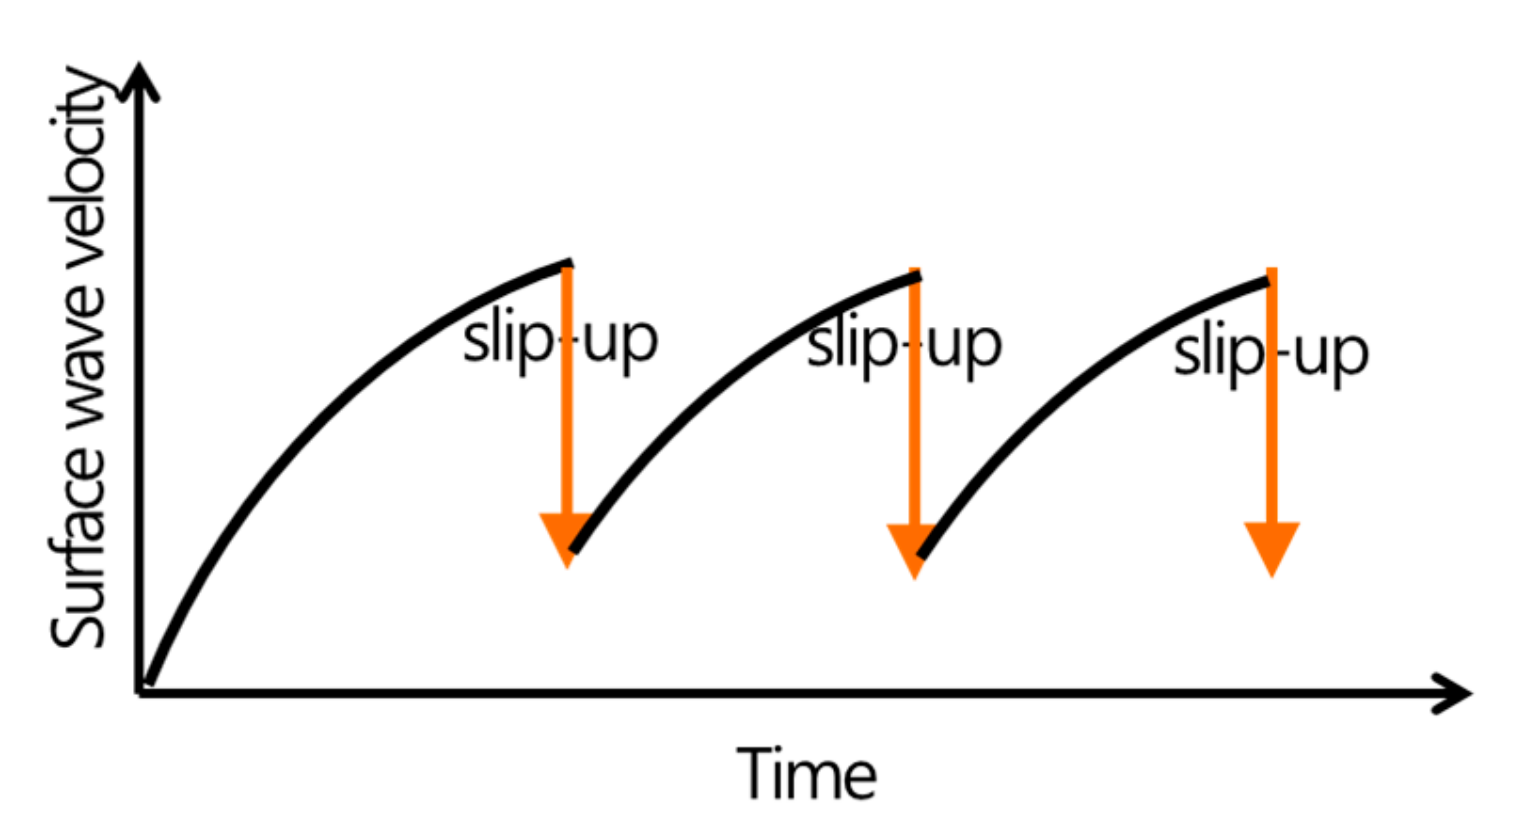
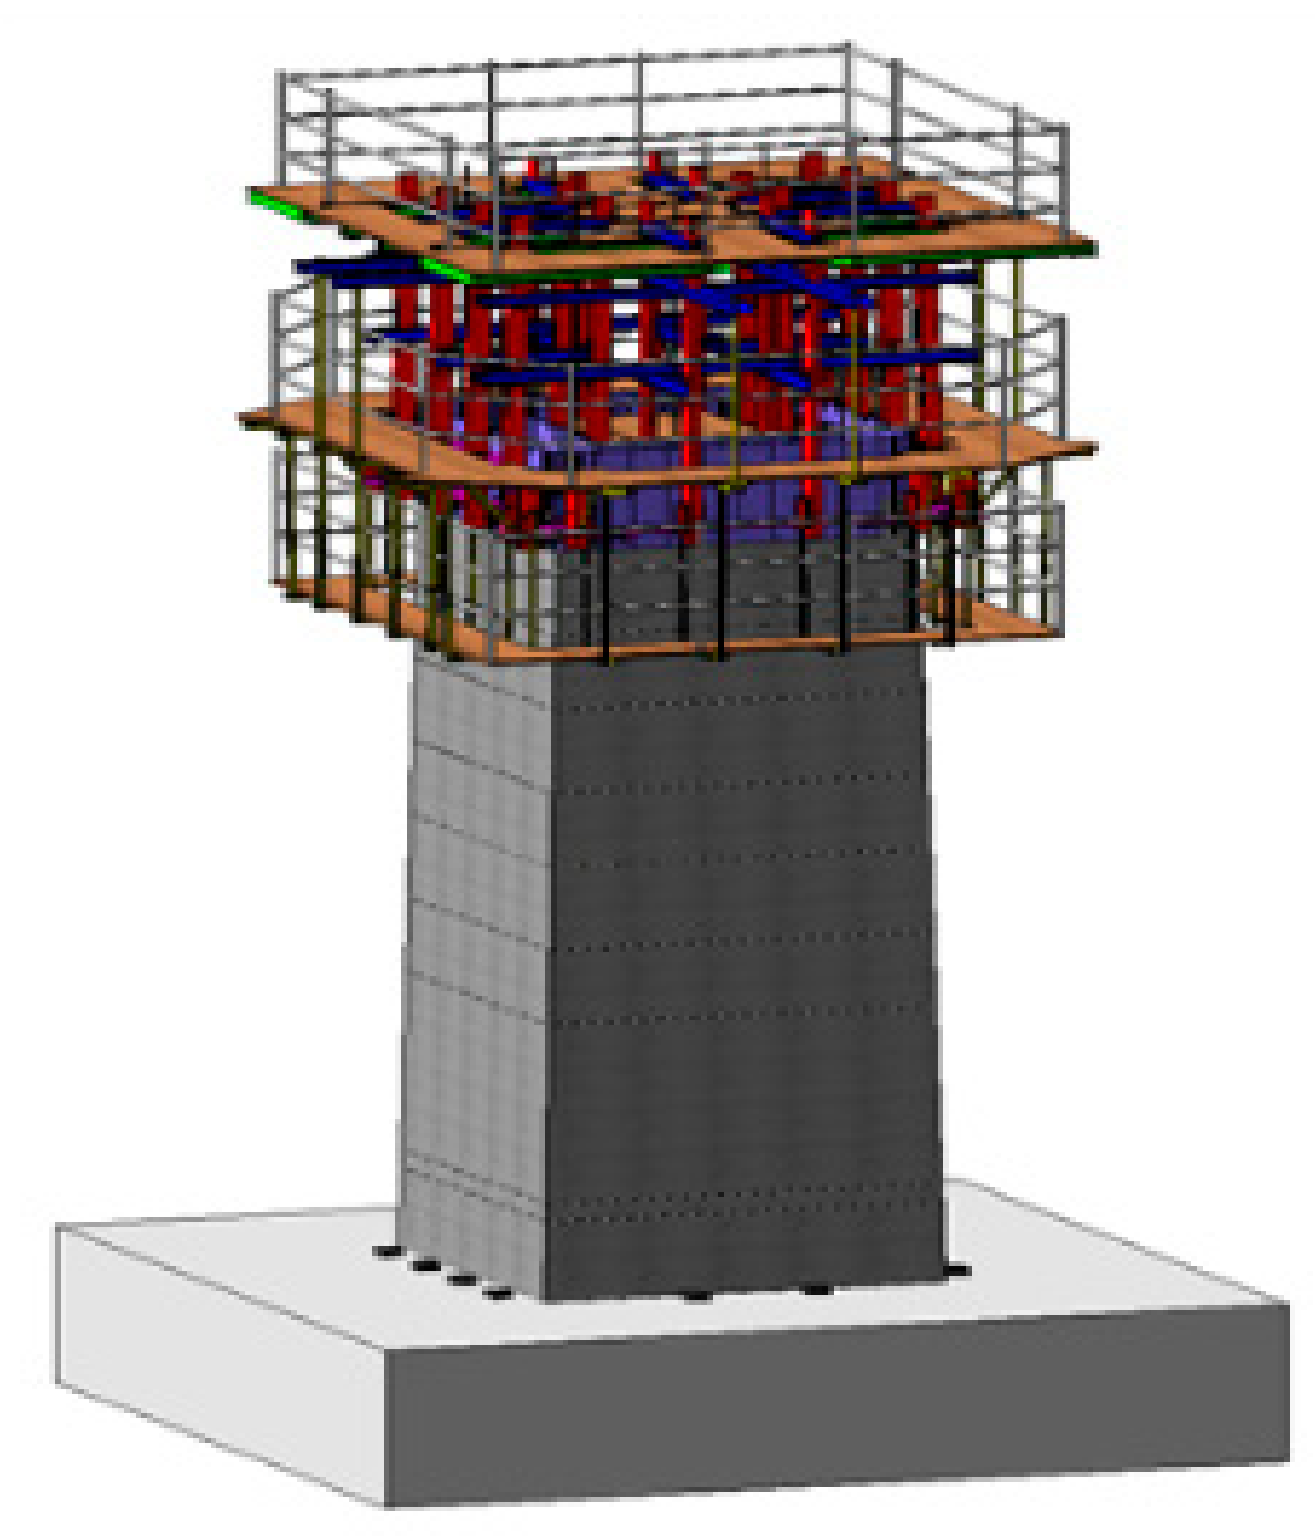
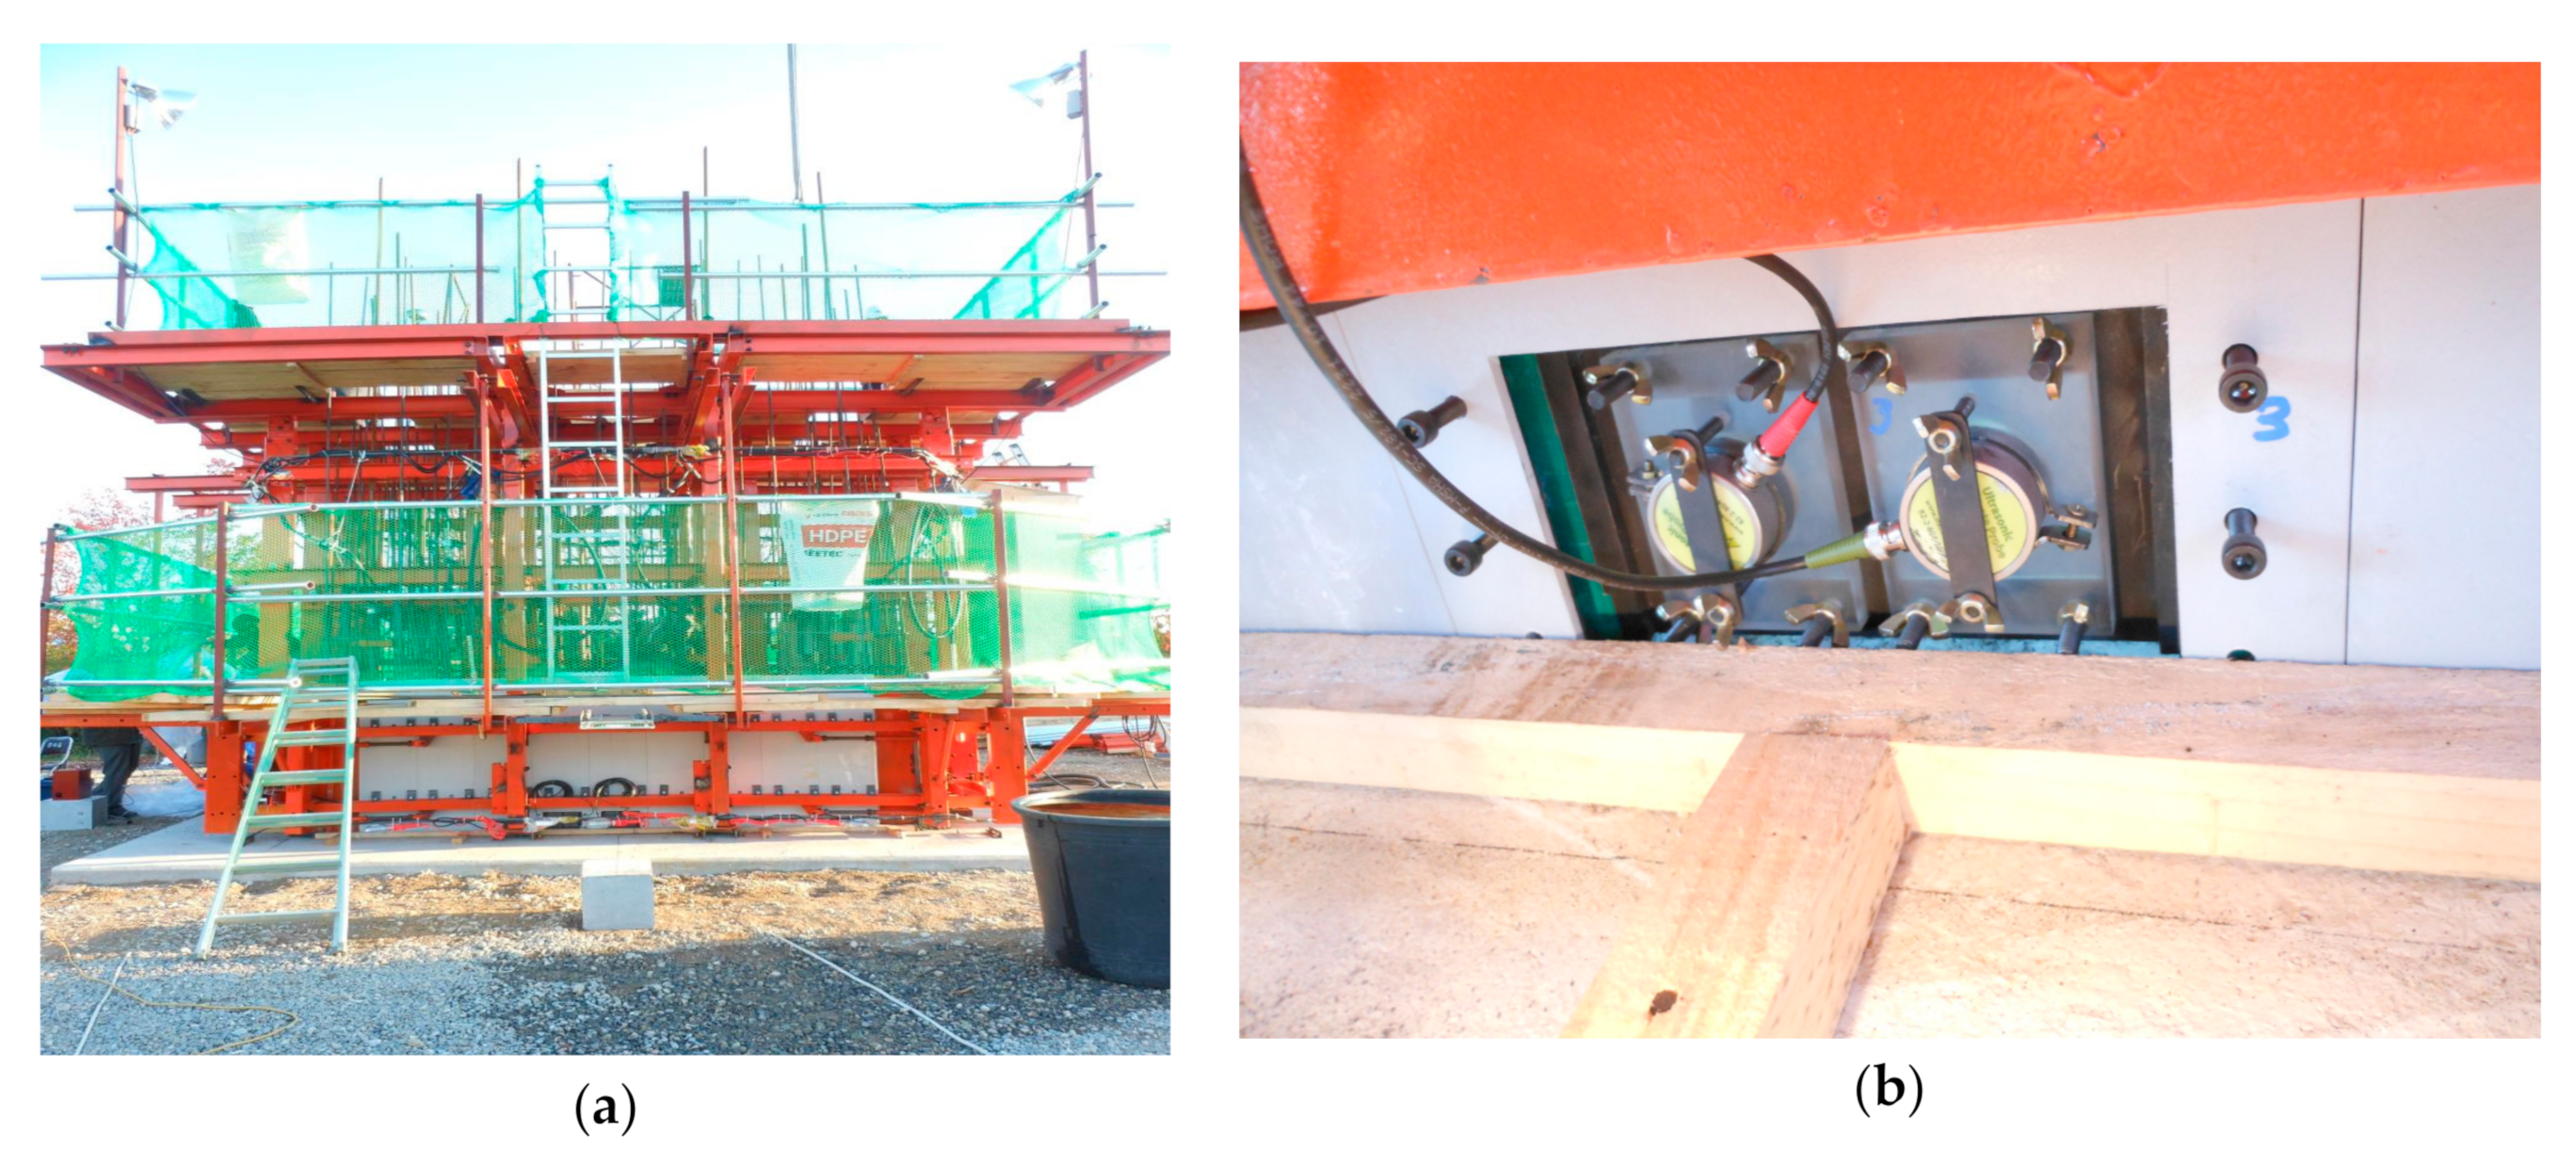
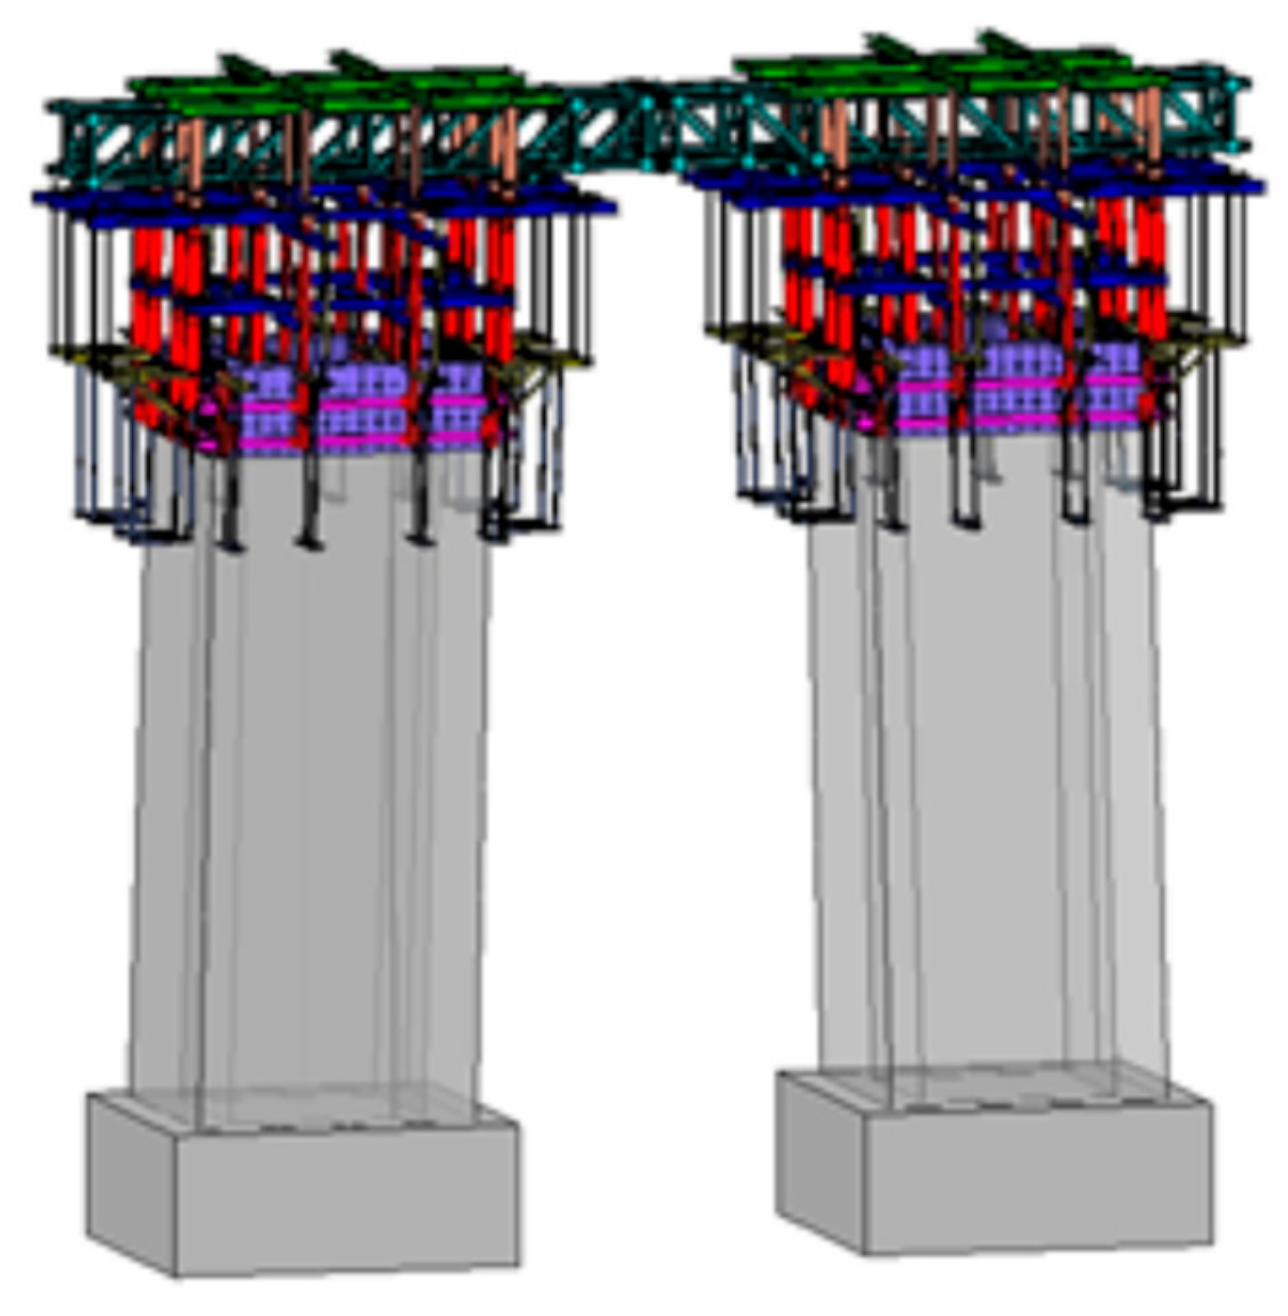
3. Slip-Forming with Ultrasonic Sensors
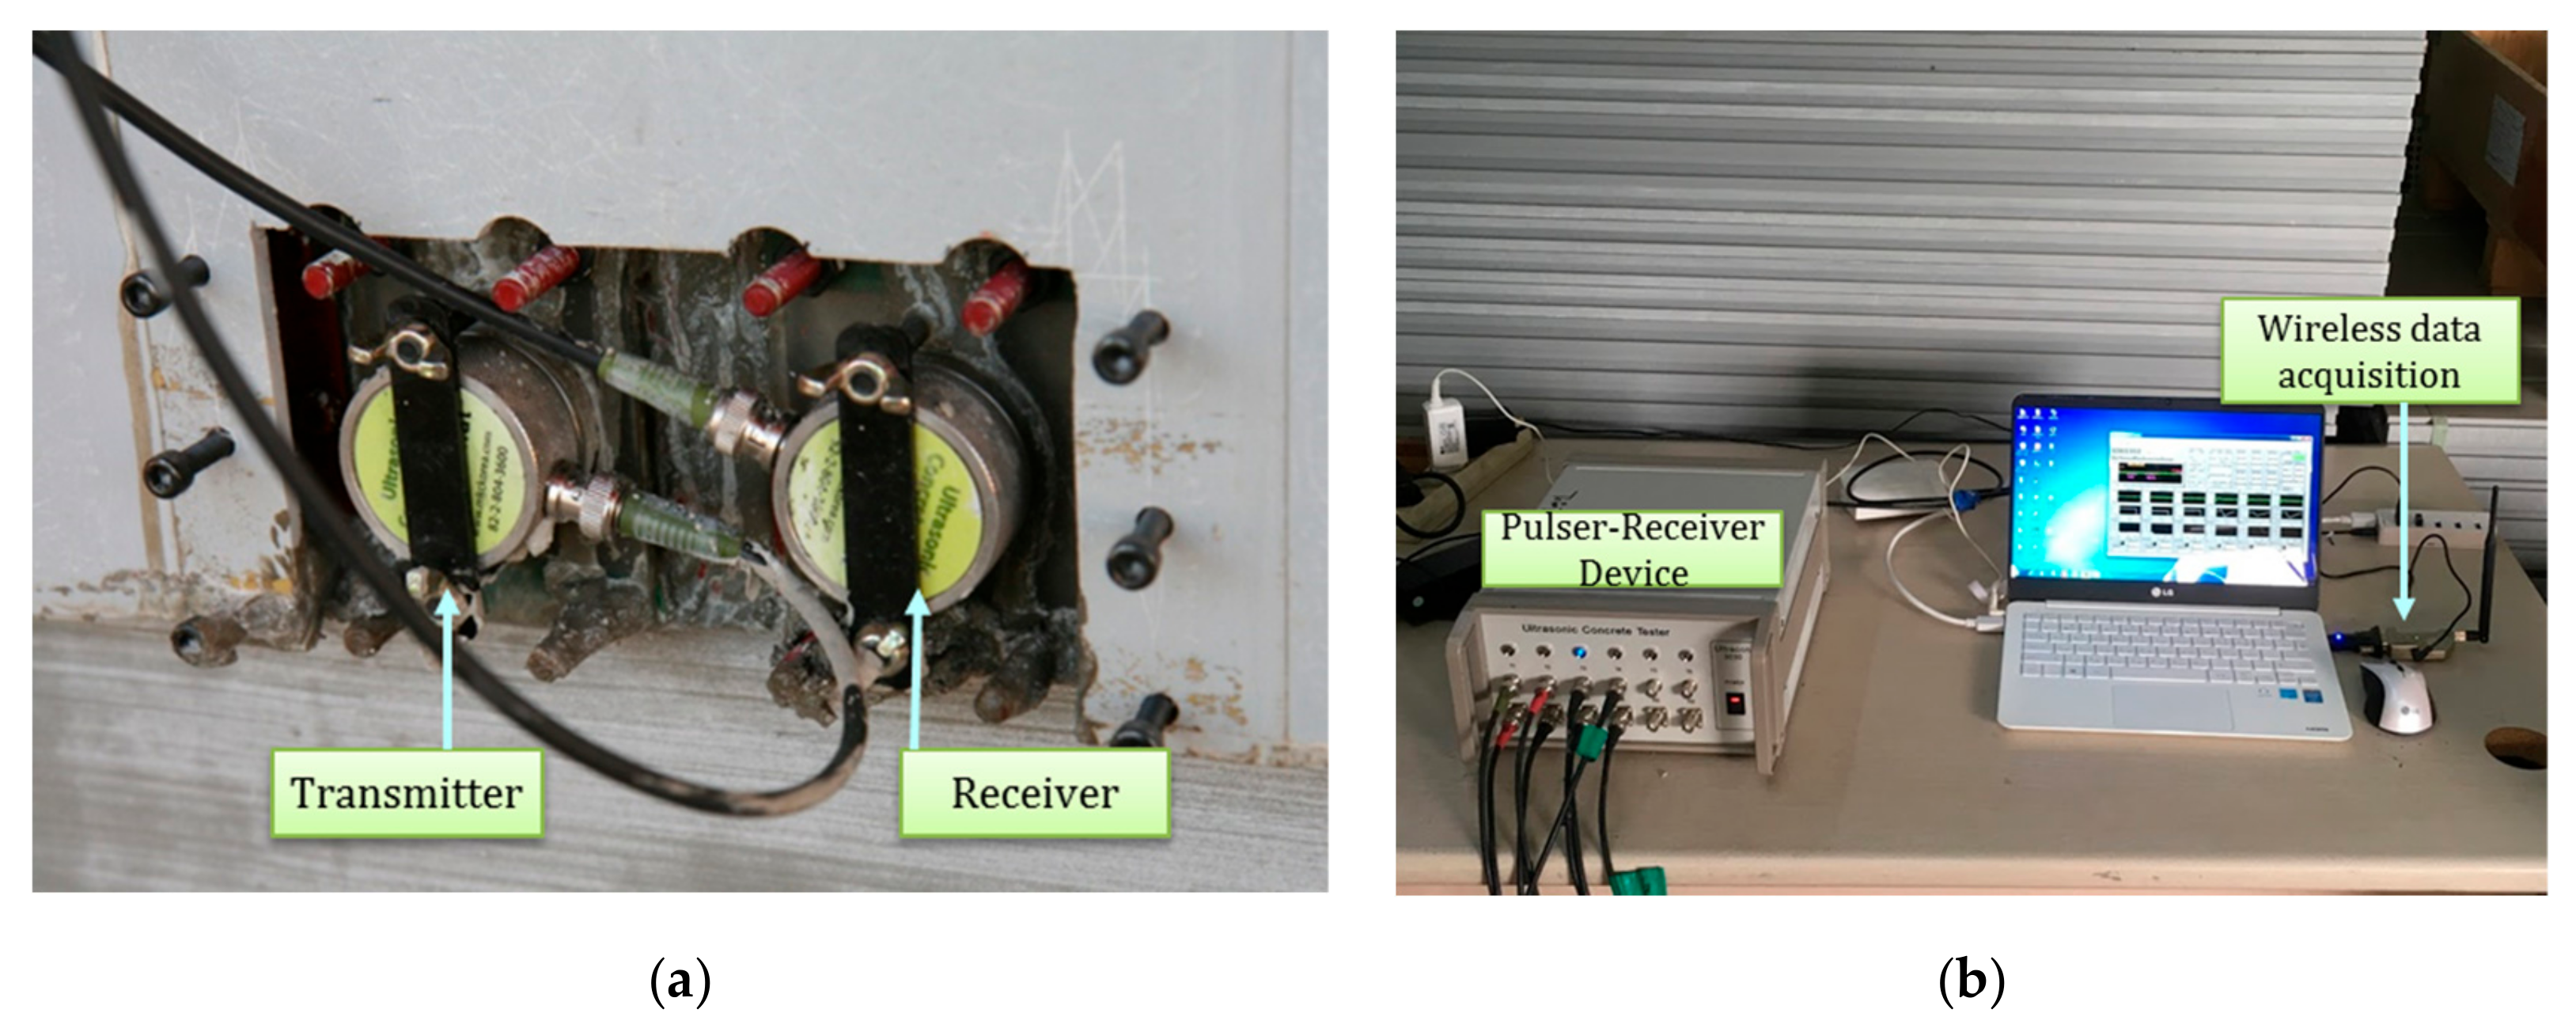
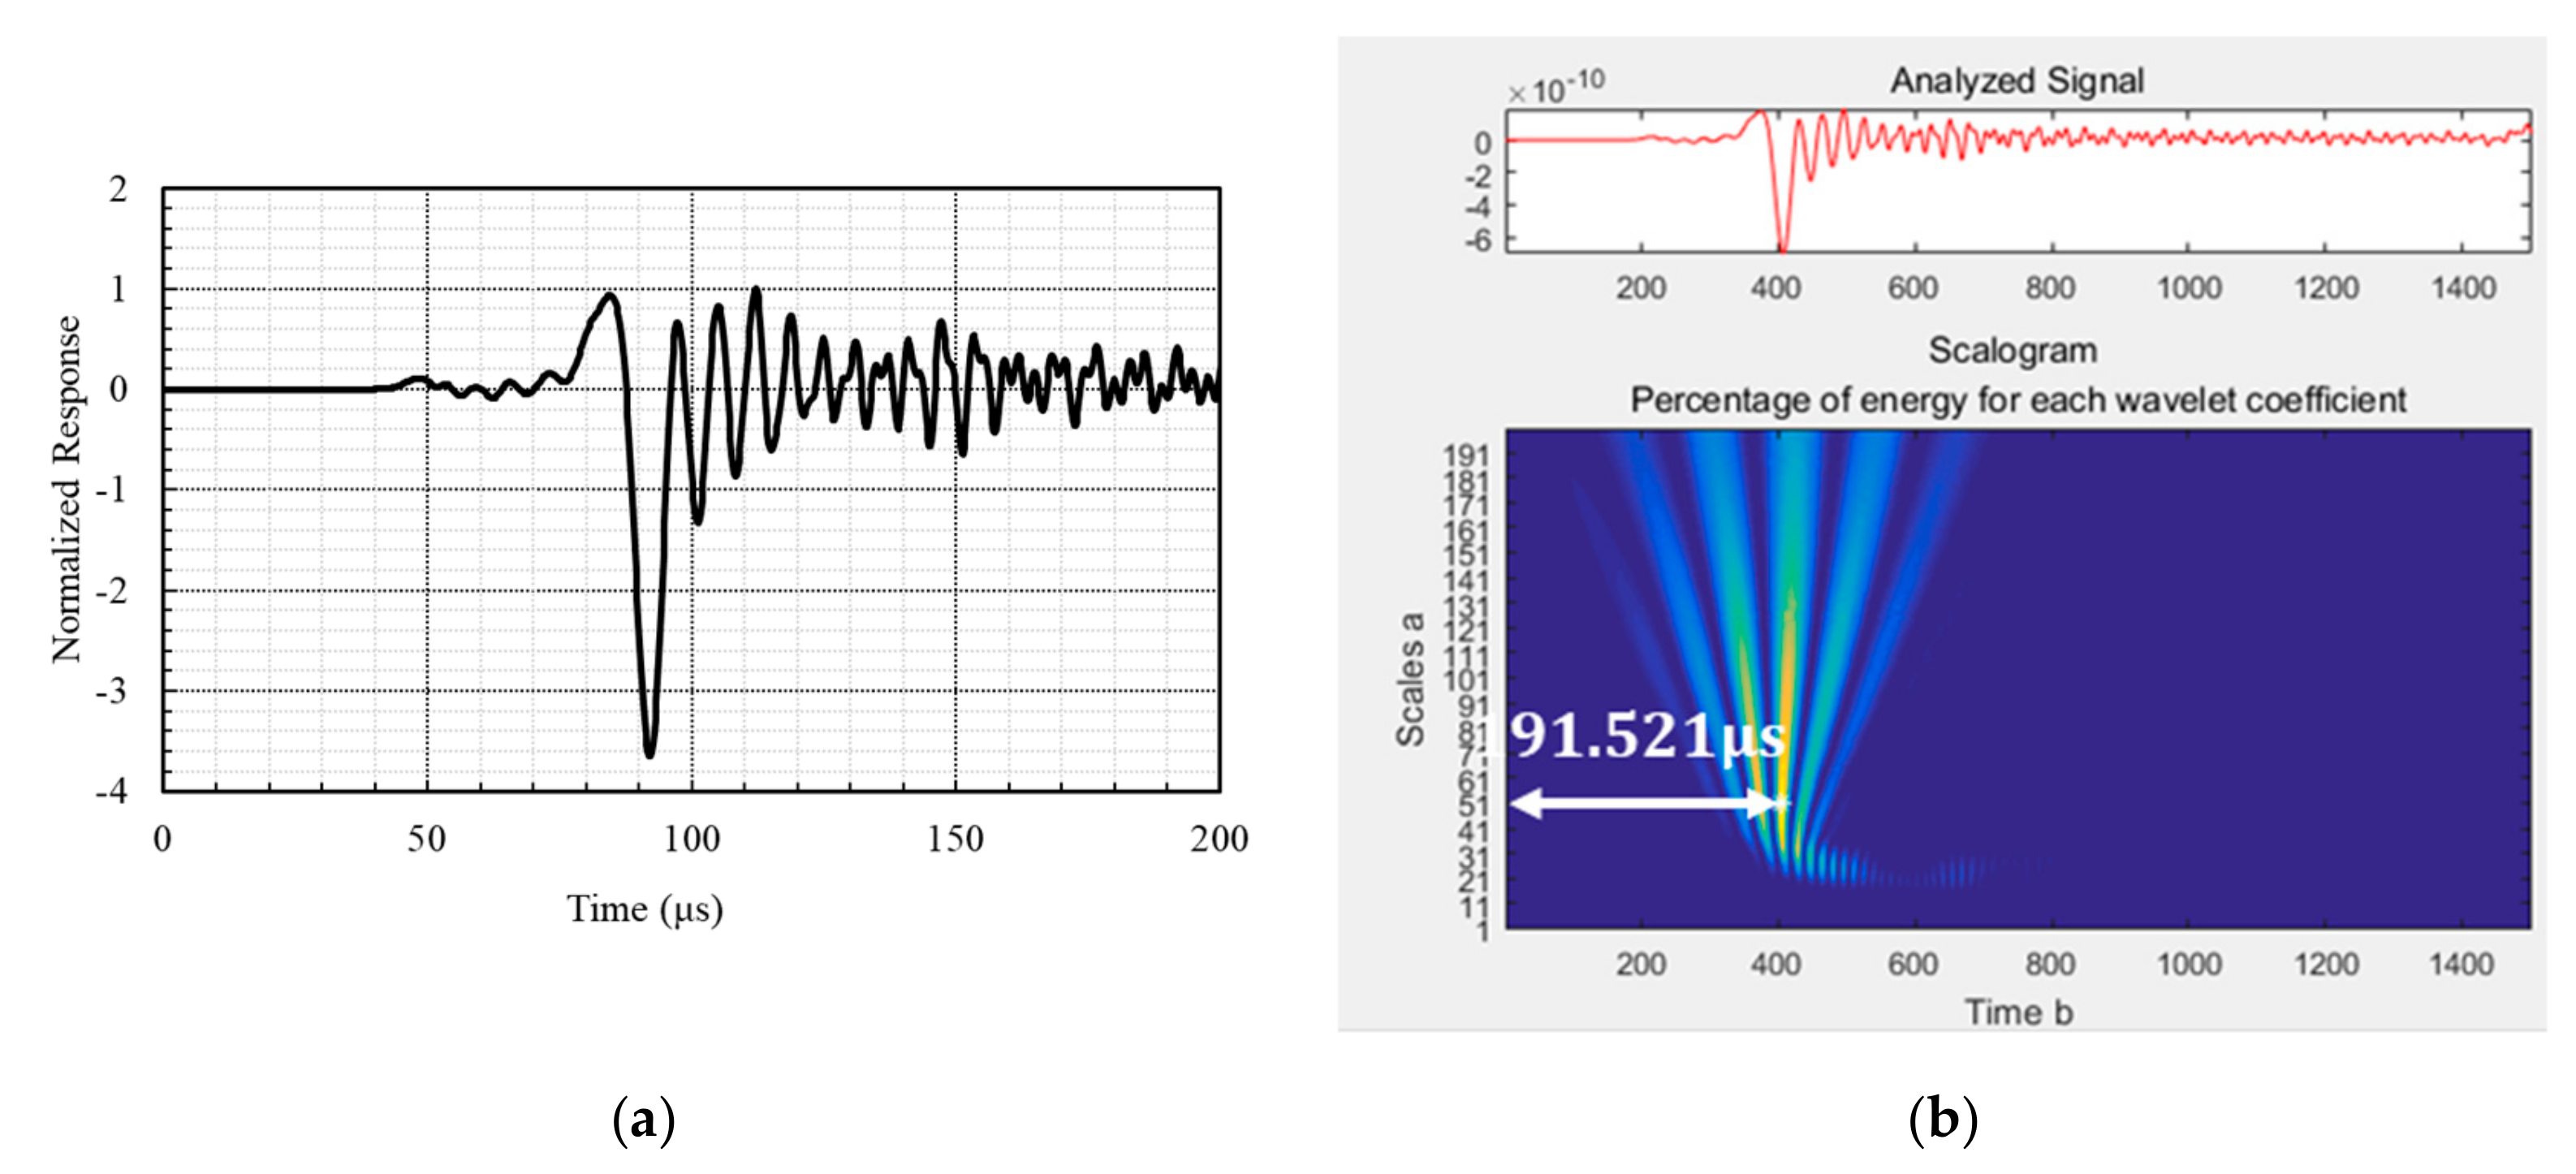
4. Validation of Slip-Forming Using Ultrasonic Sensors
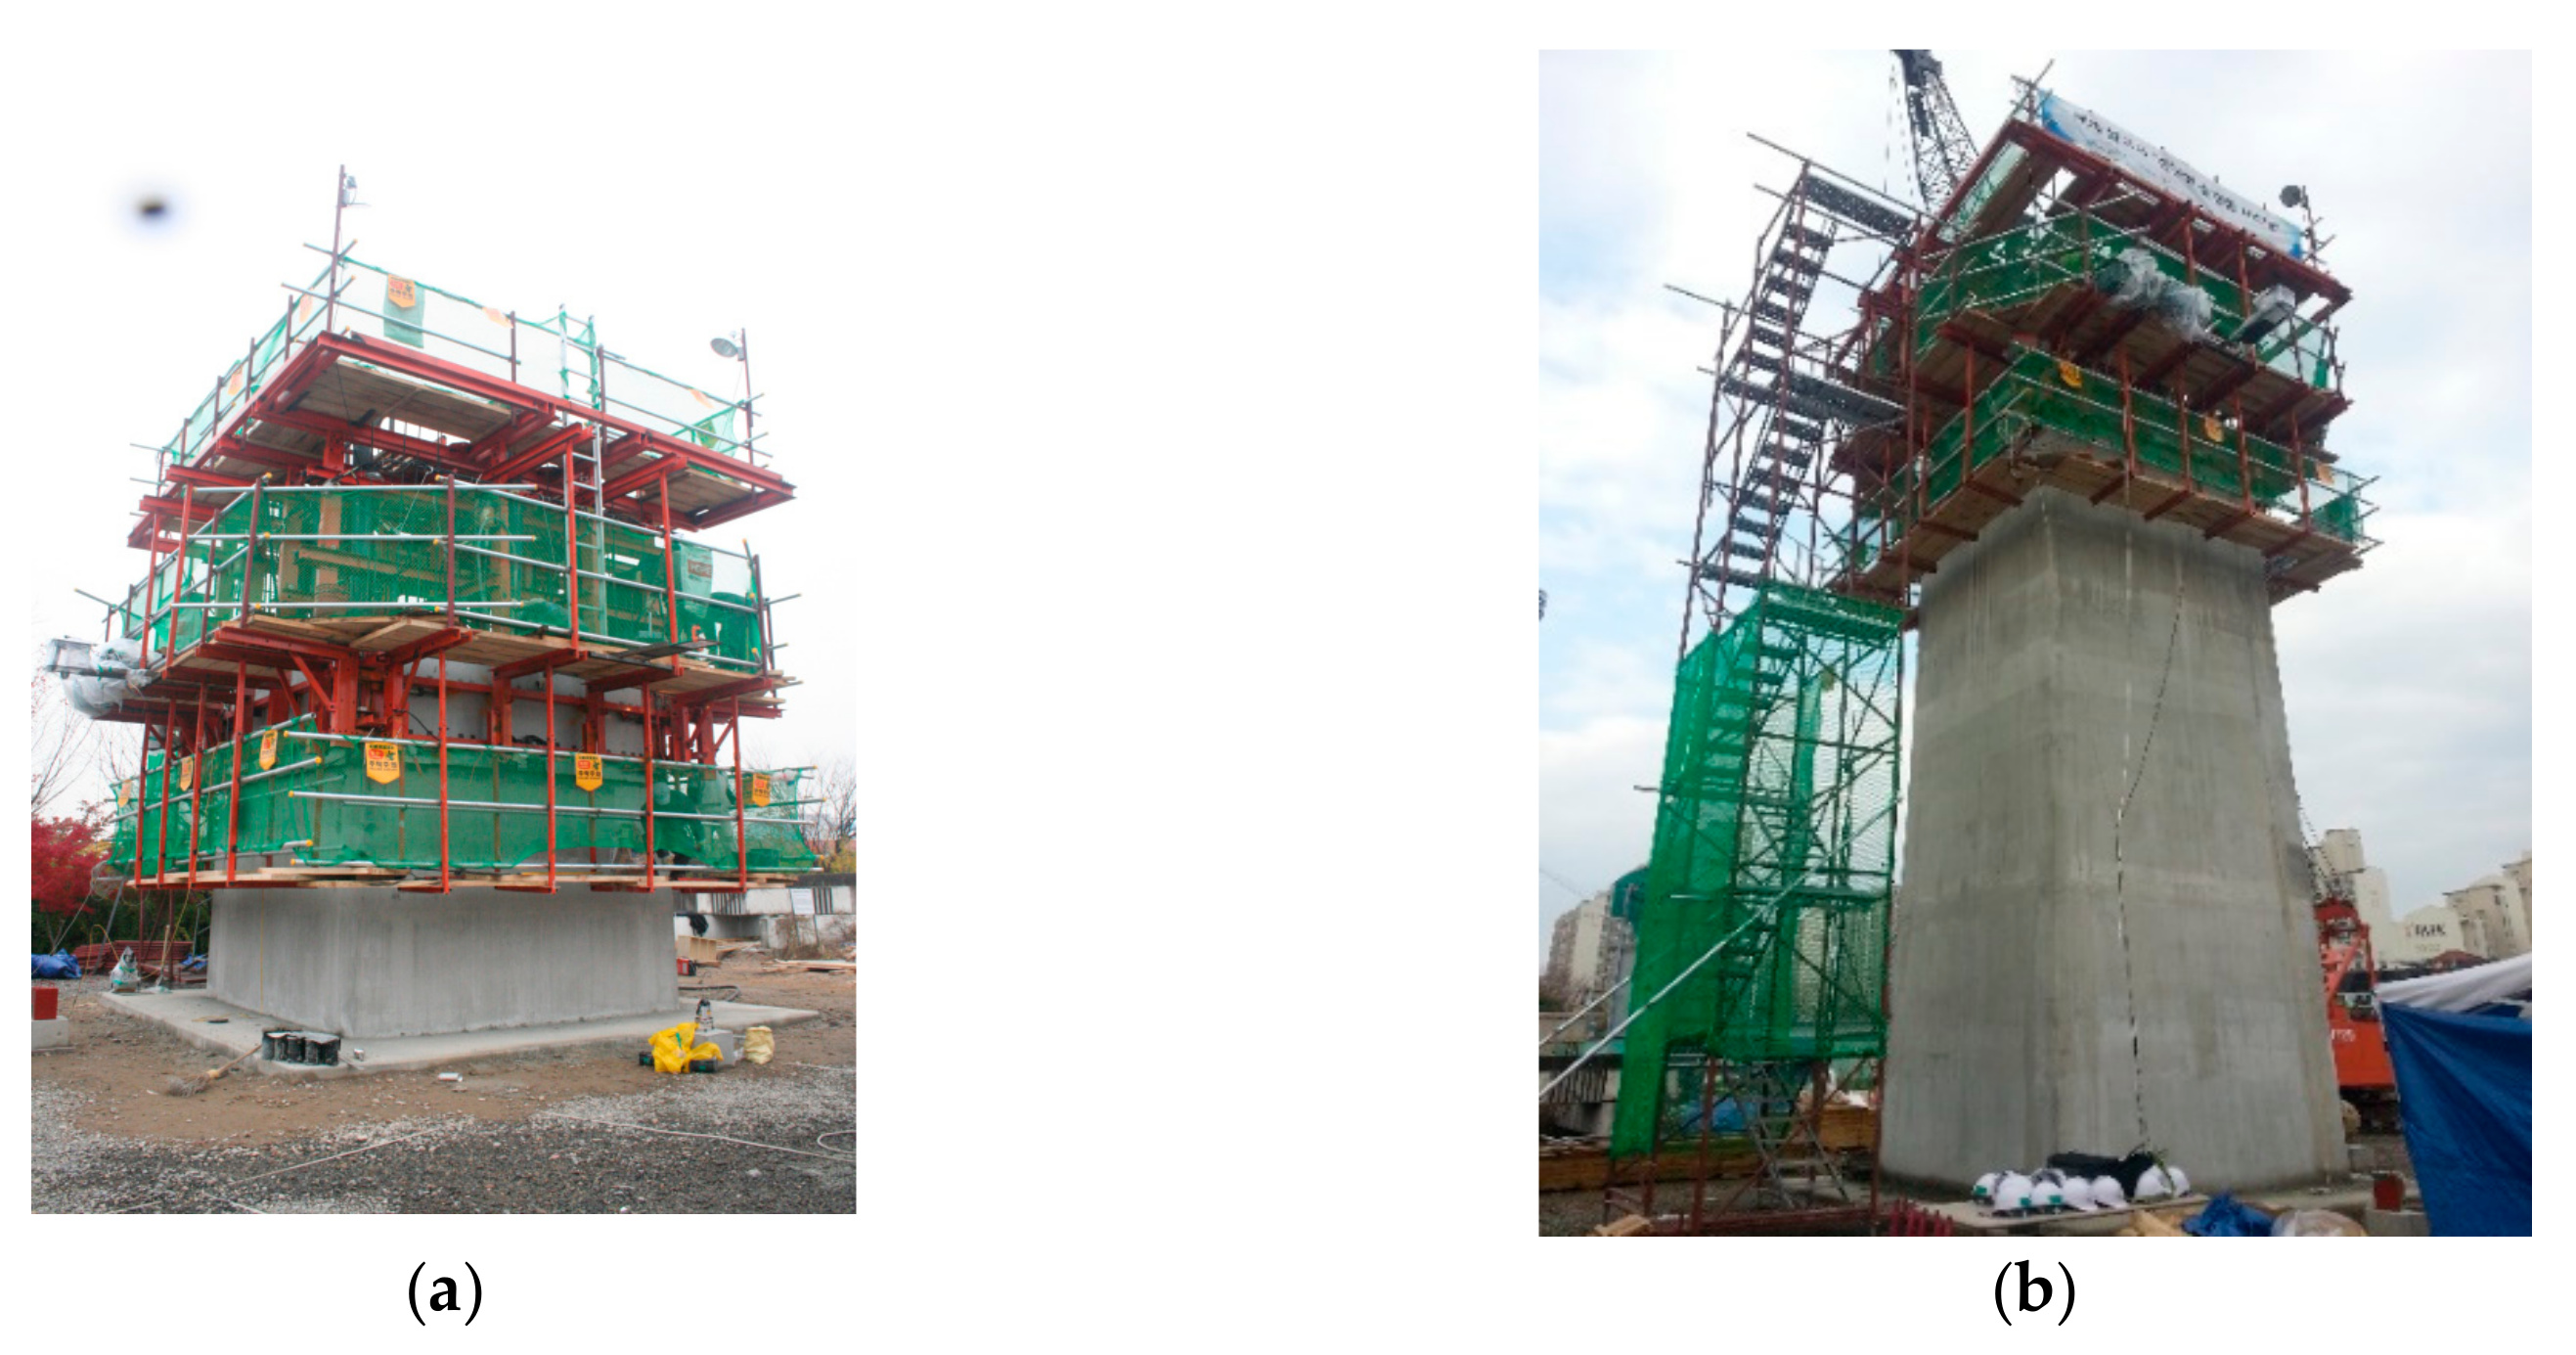
4.1. Application of the Slip-Forming System at Moderate Temperature
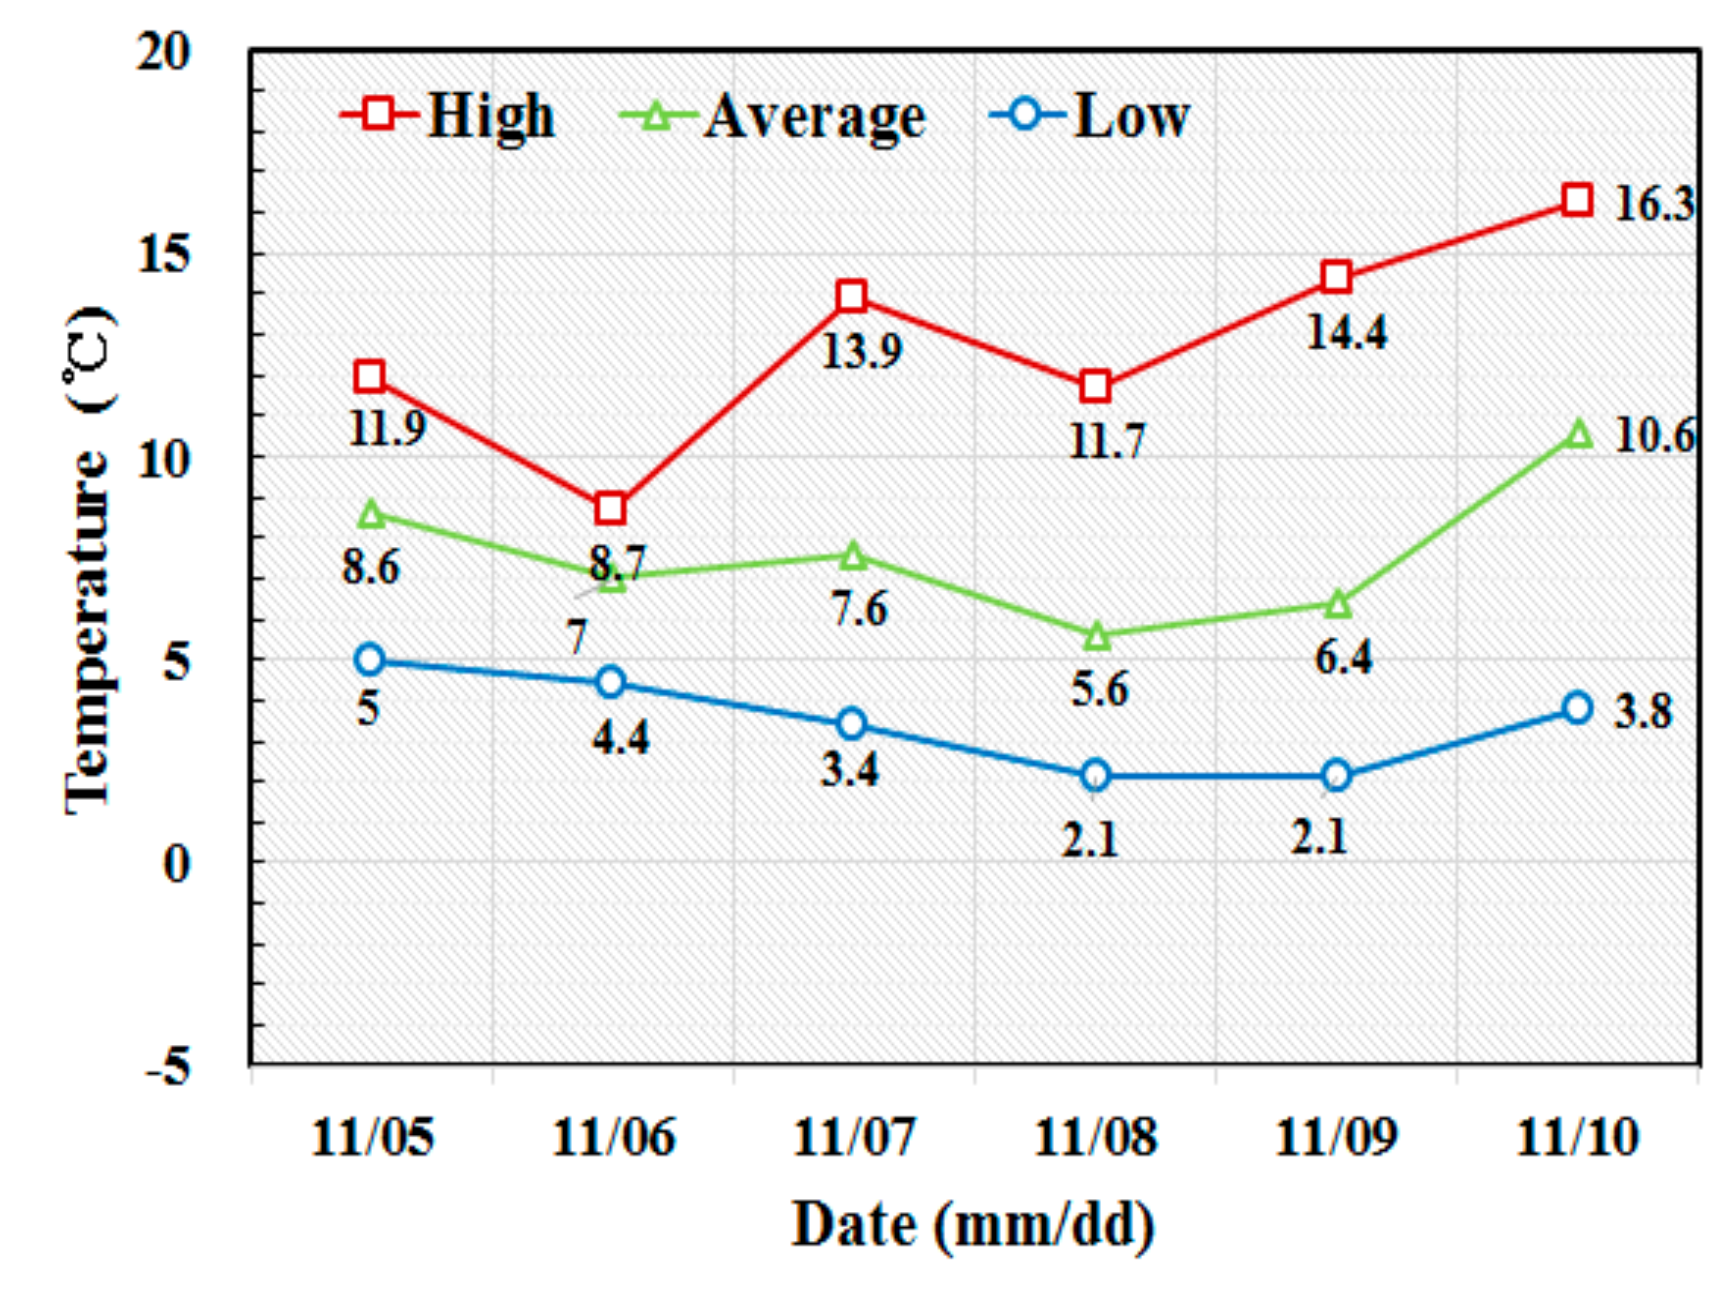
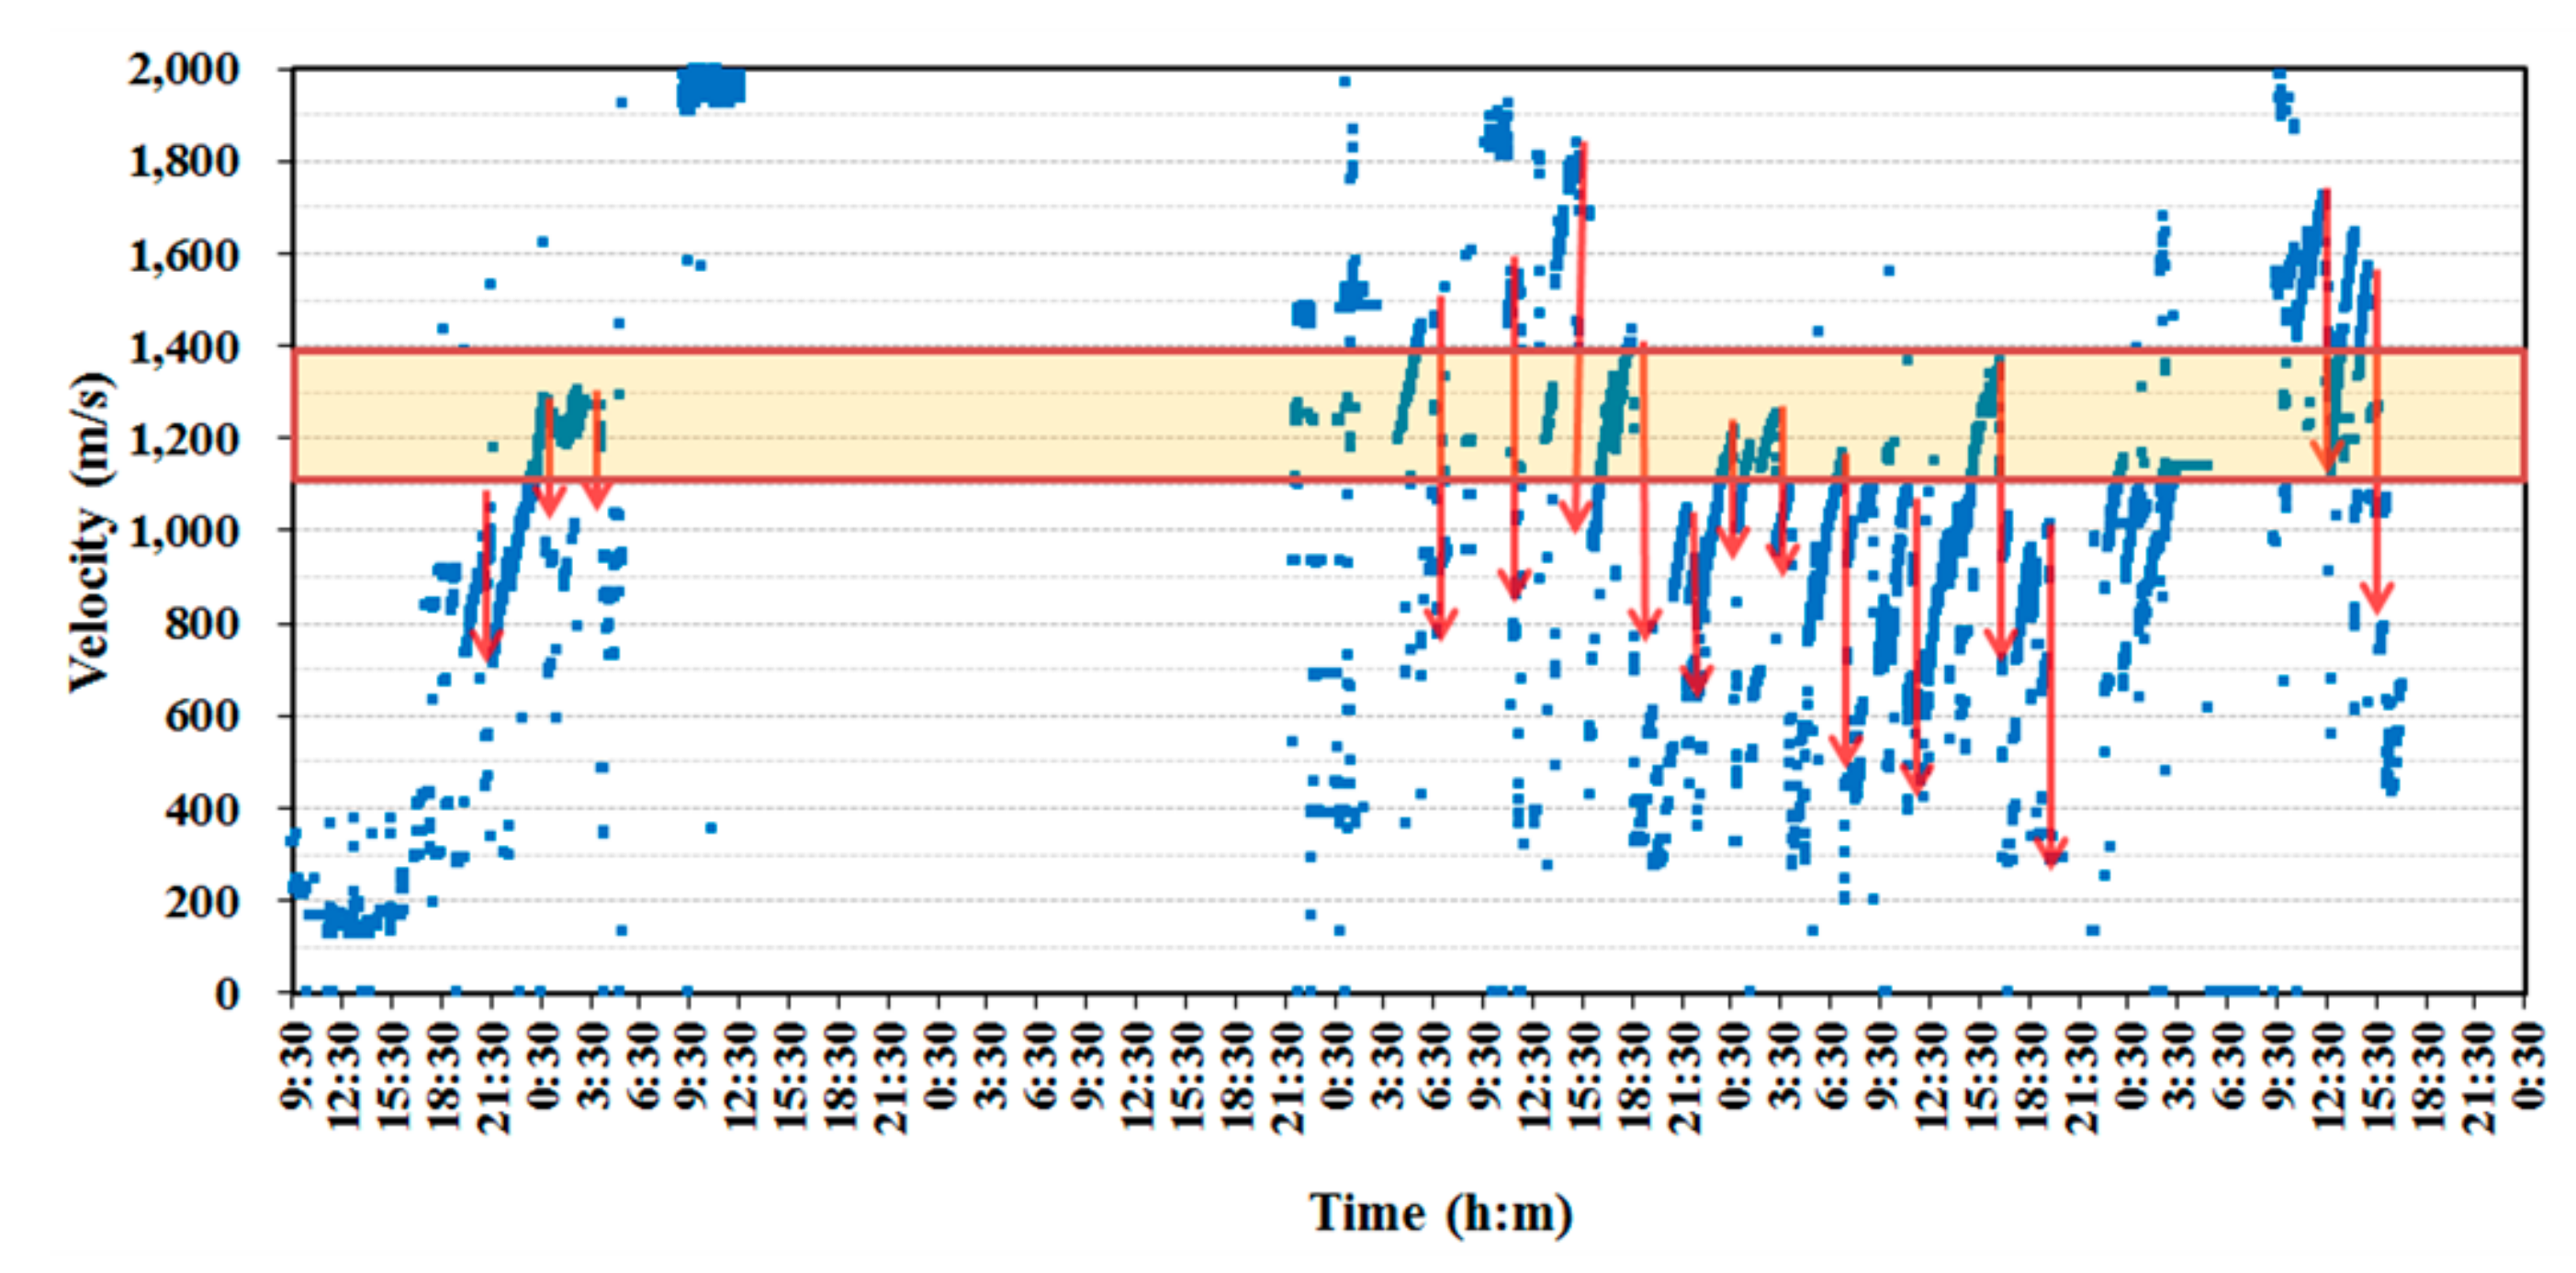
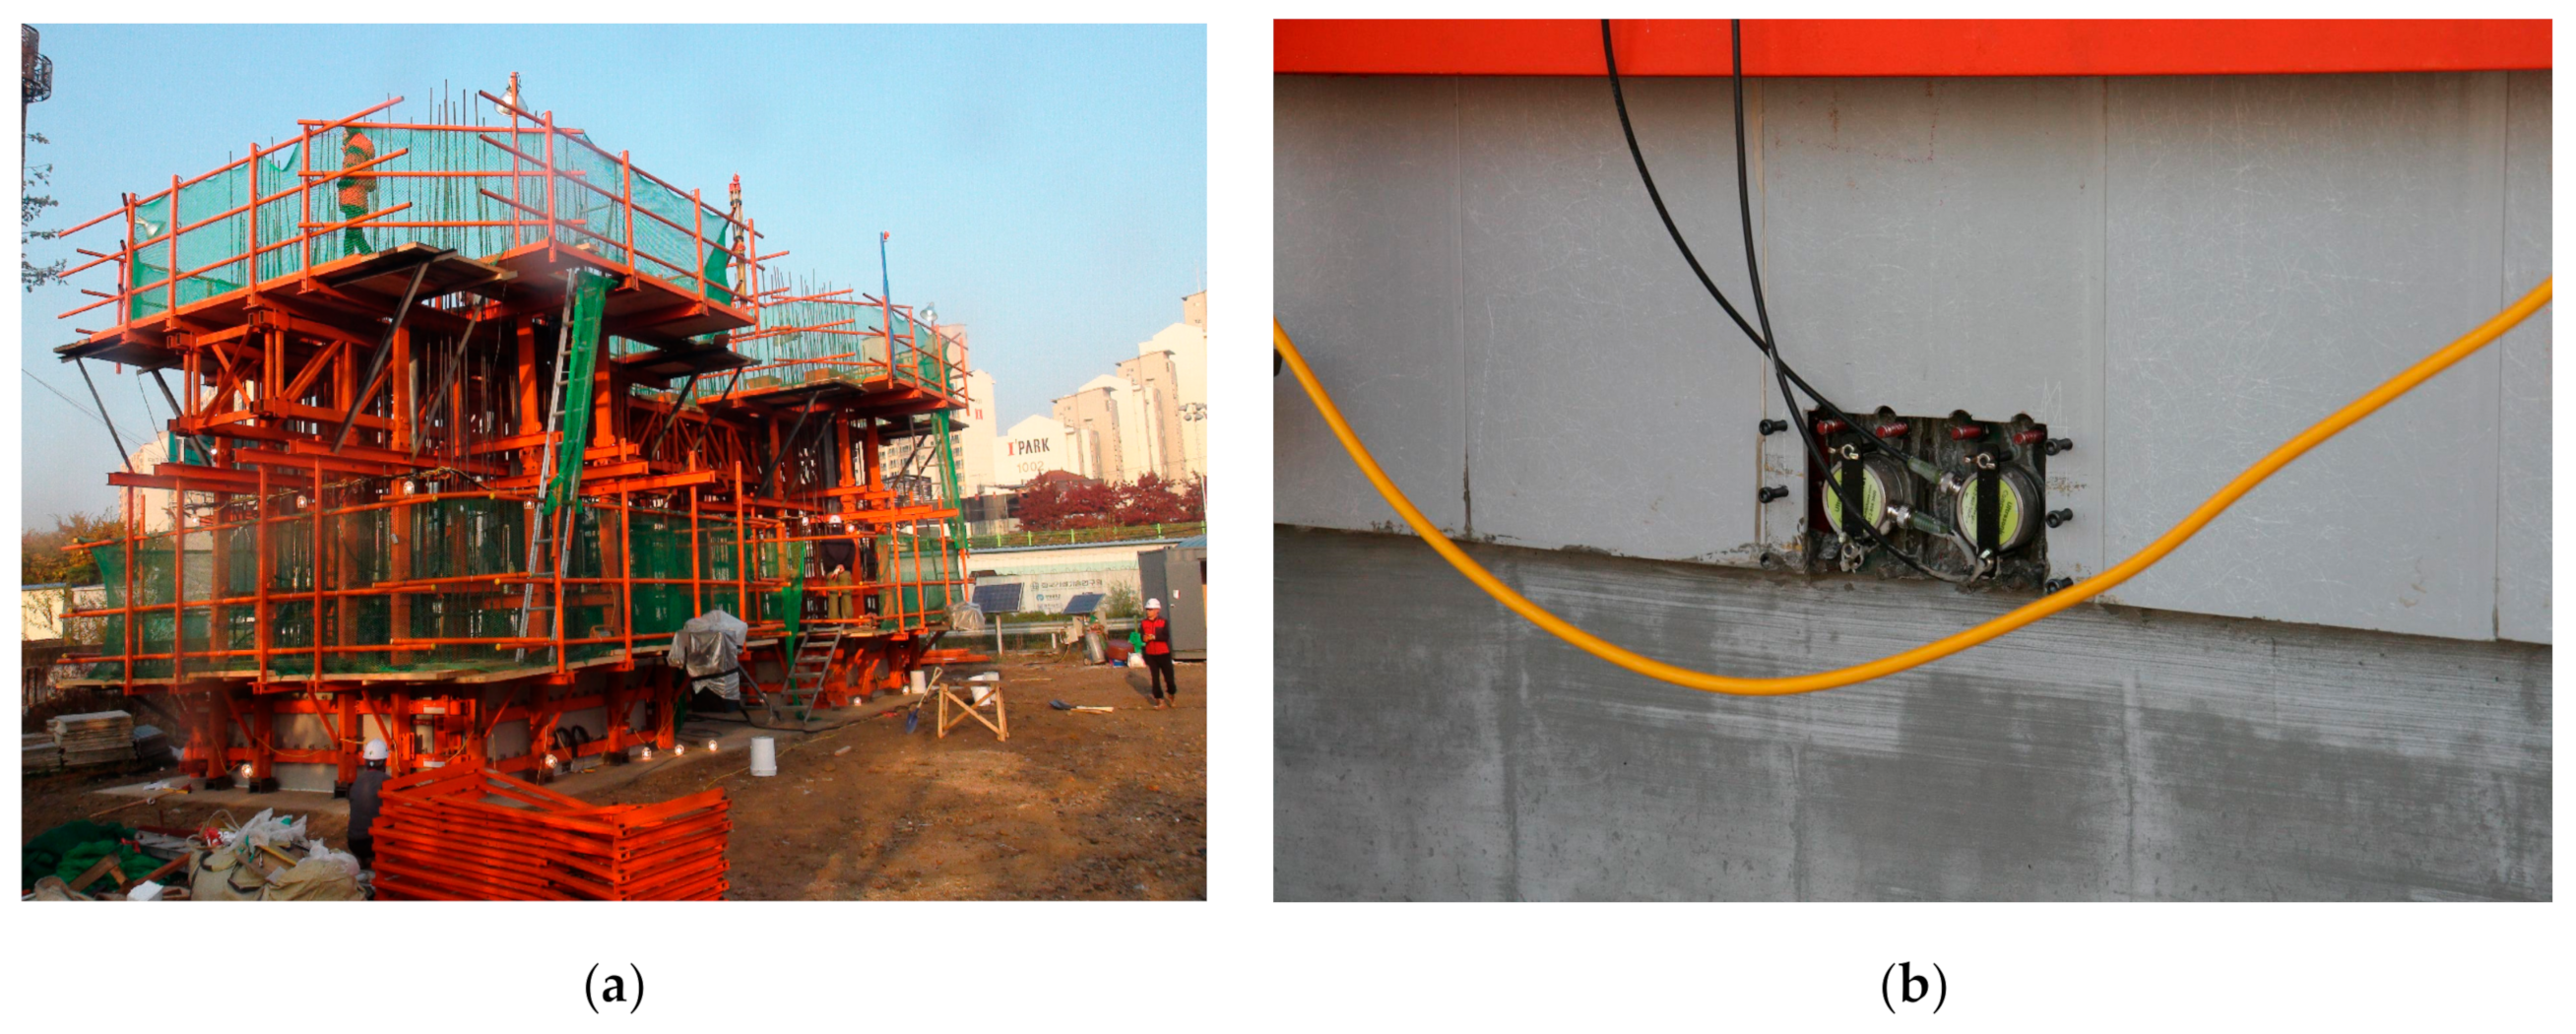
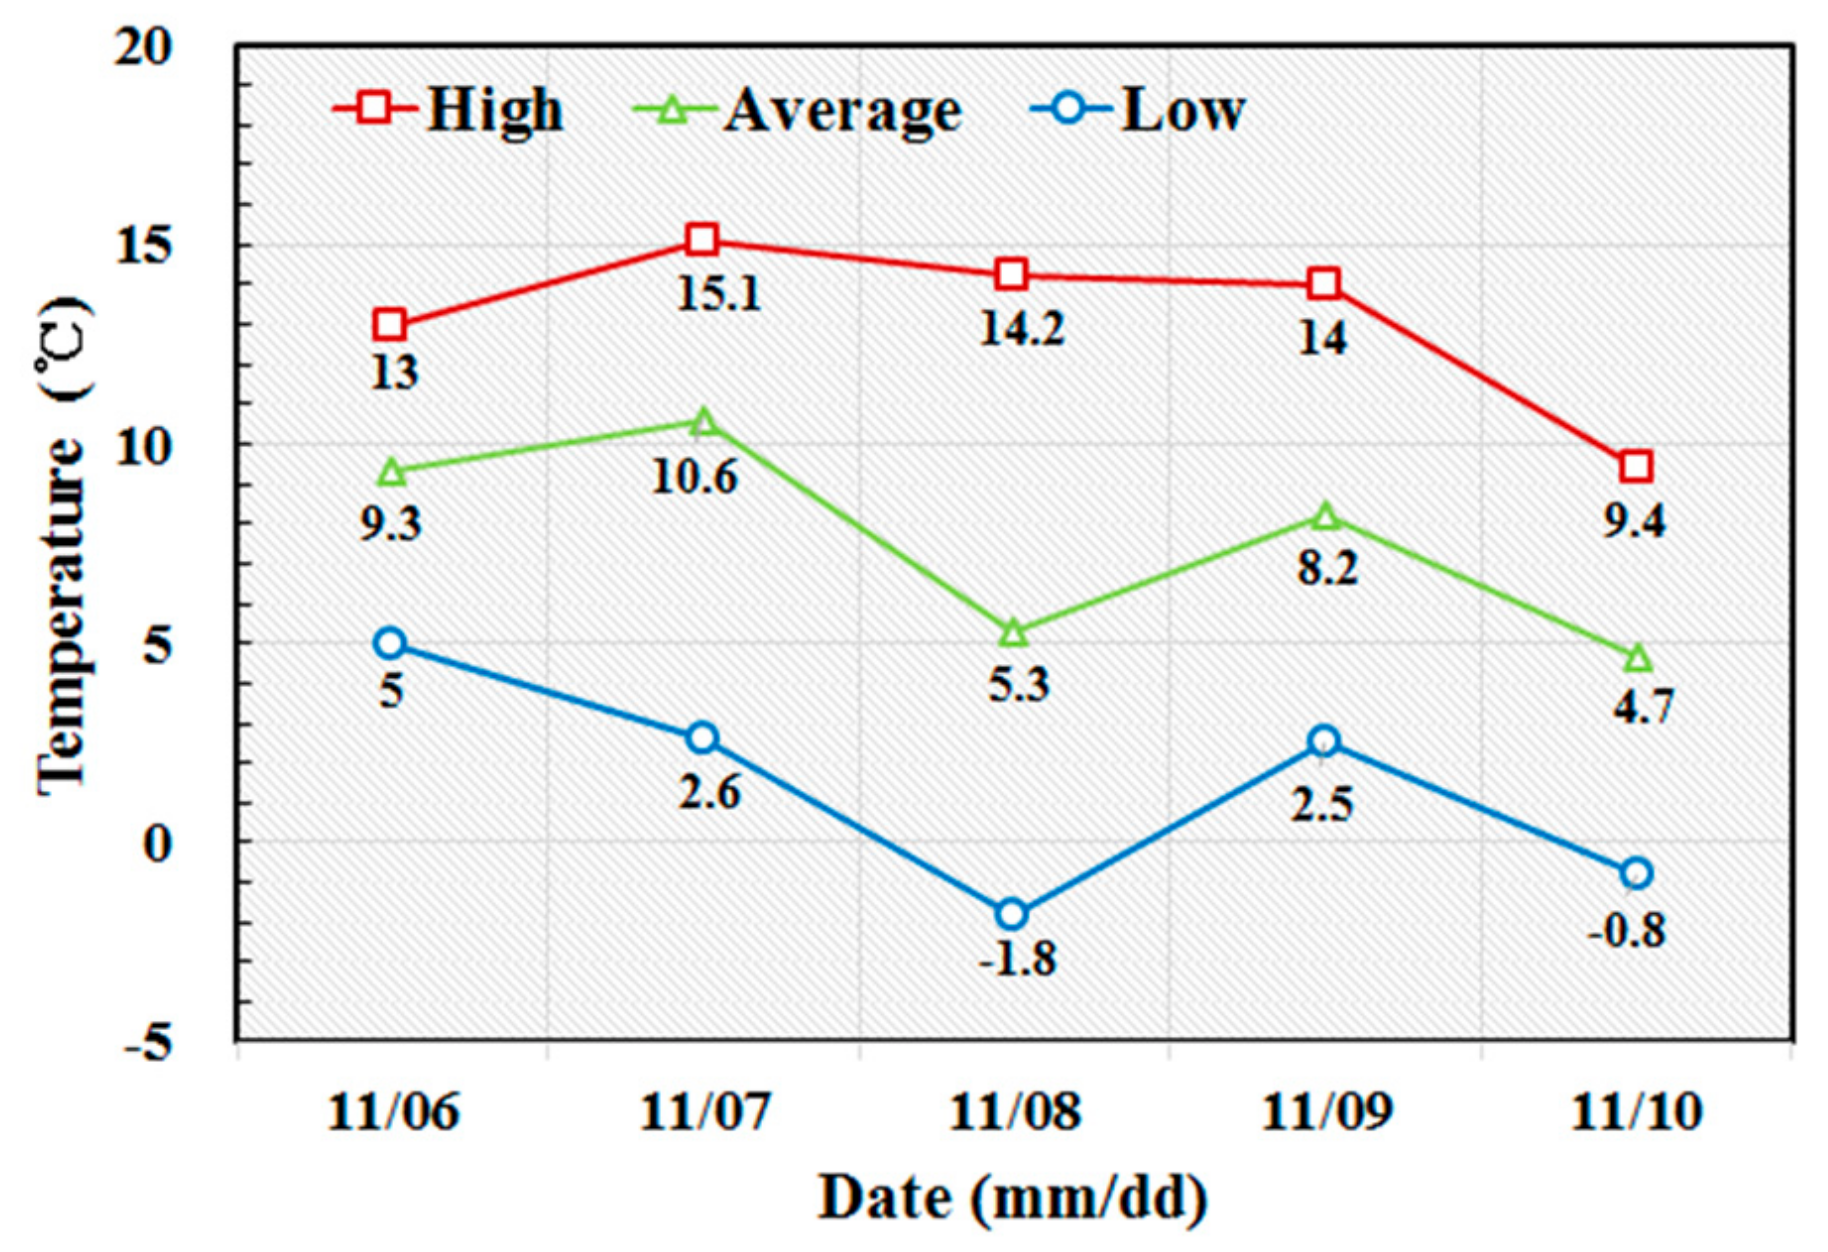
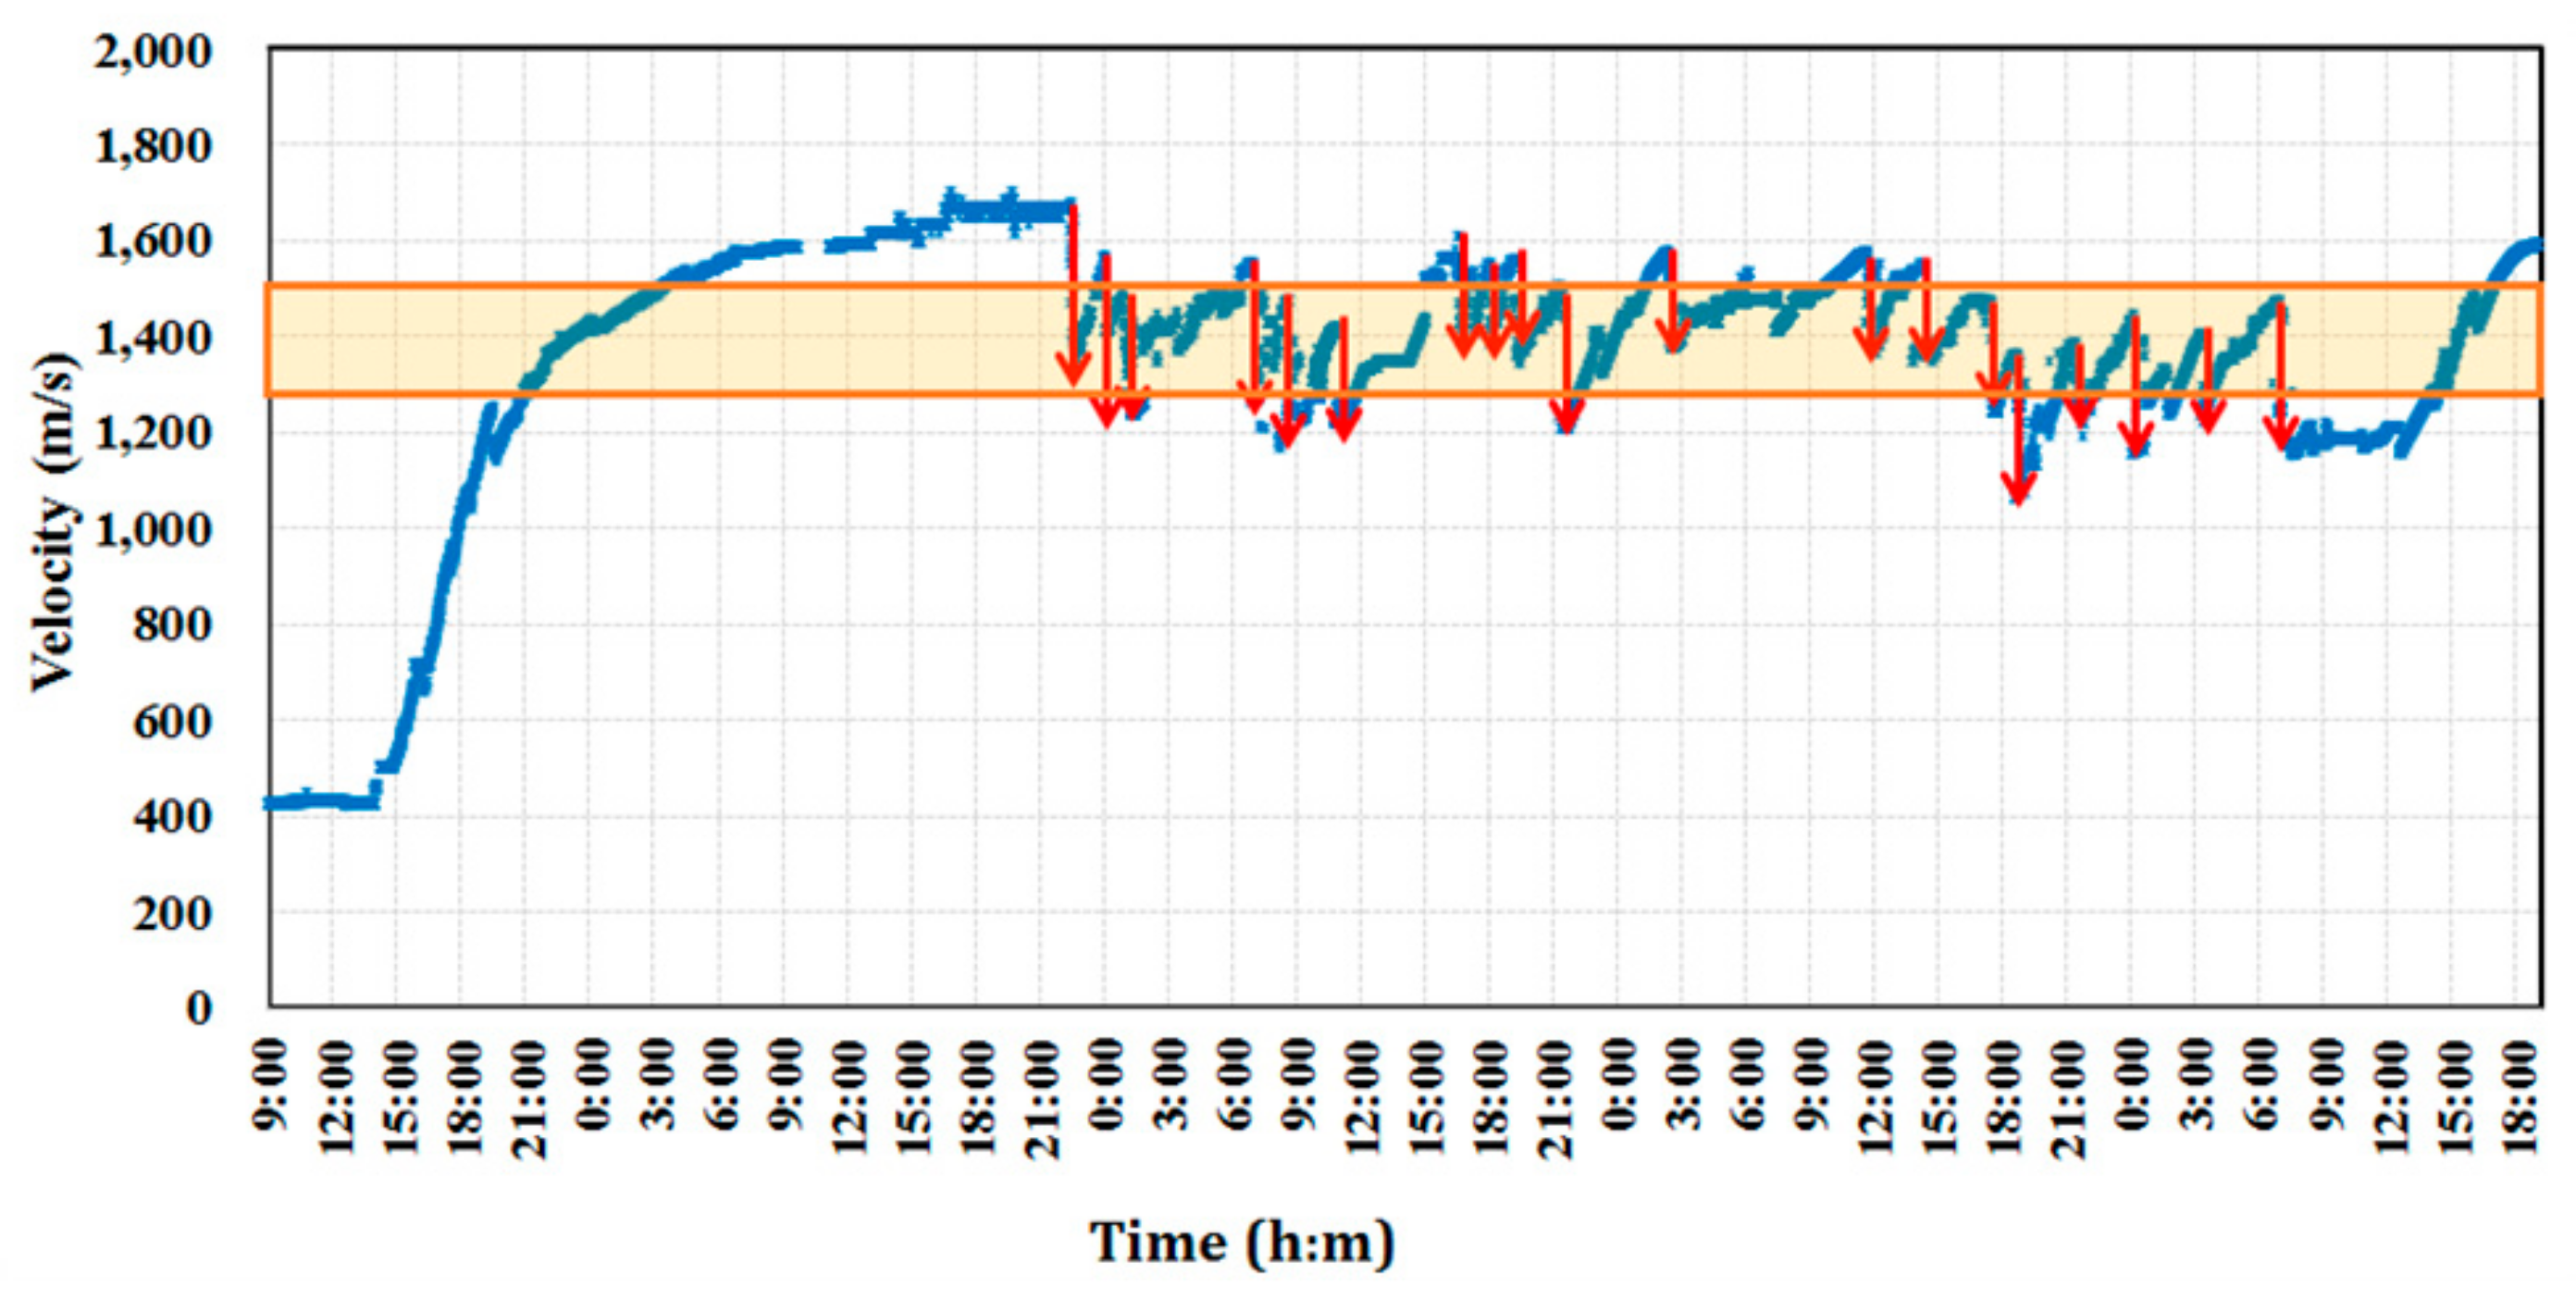
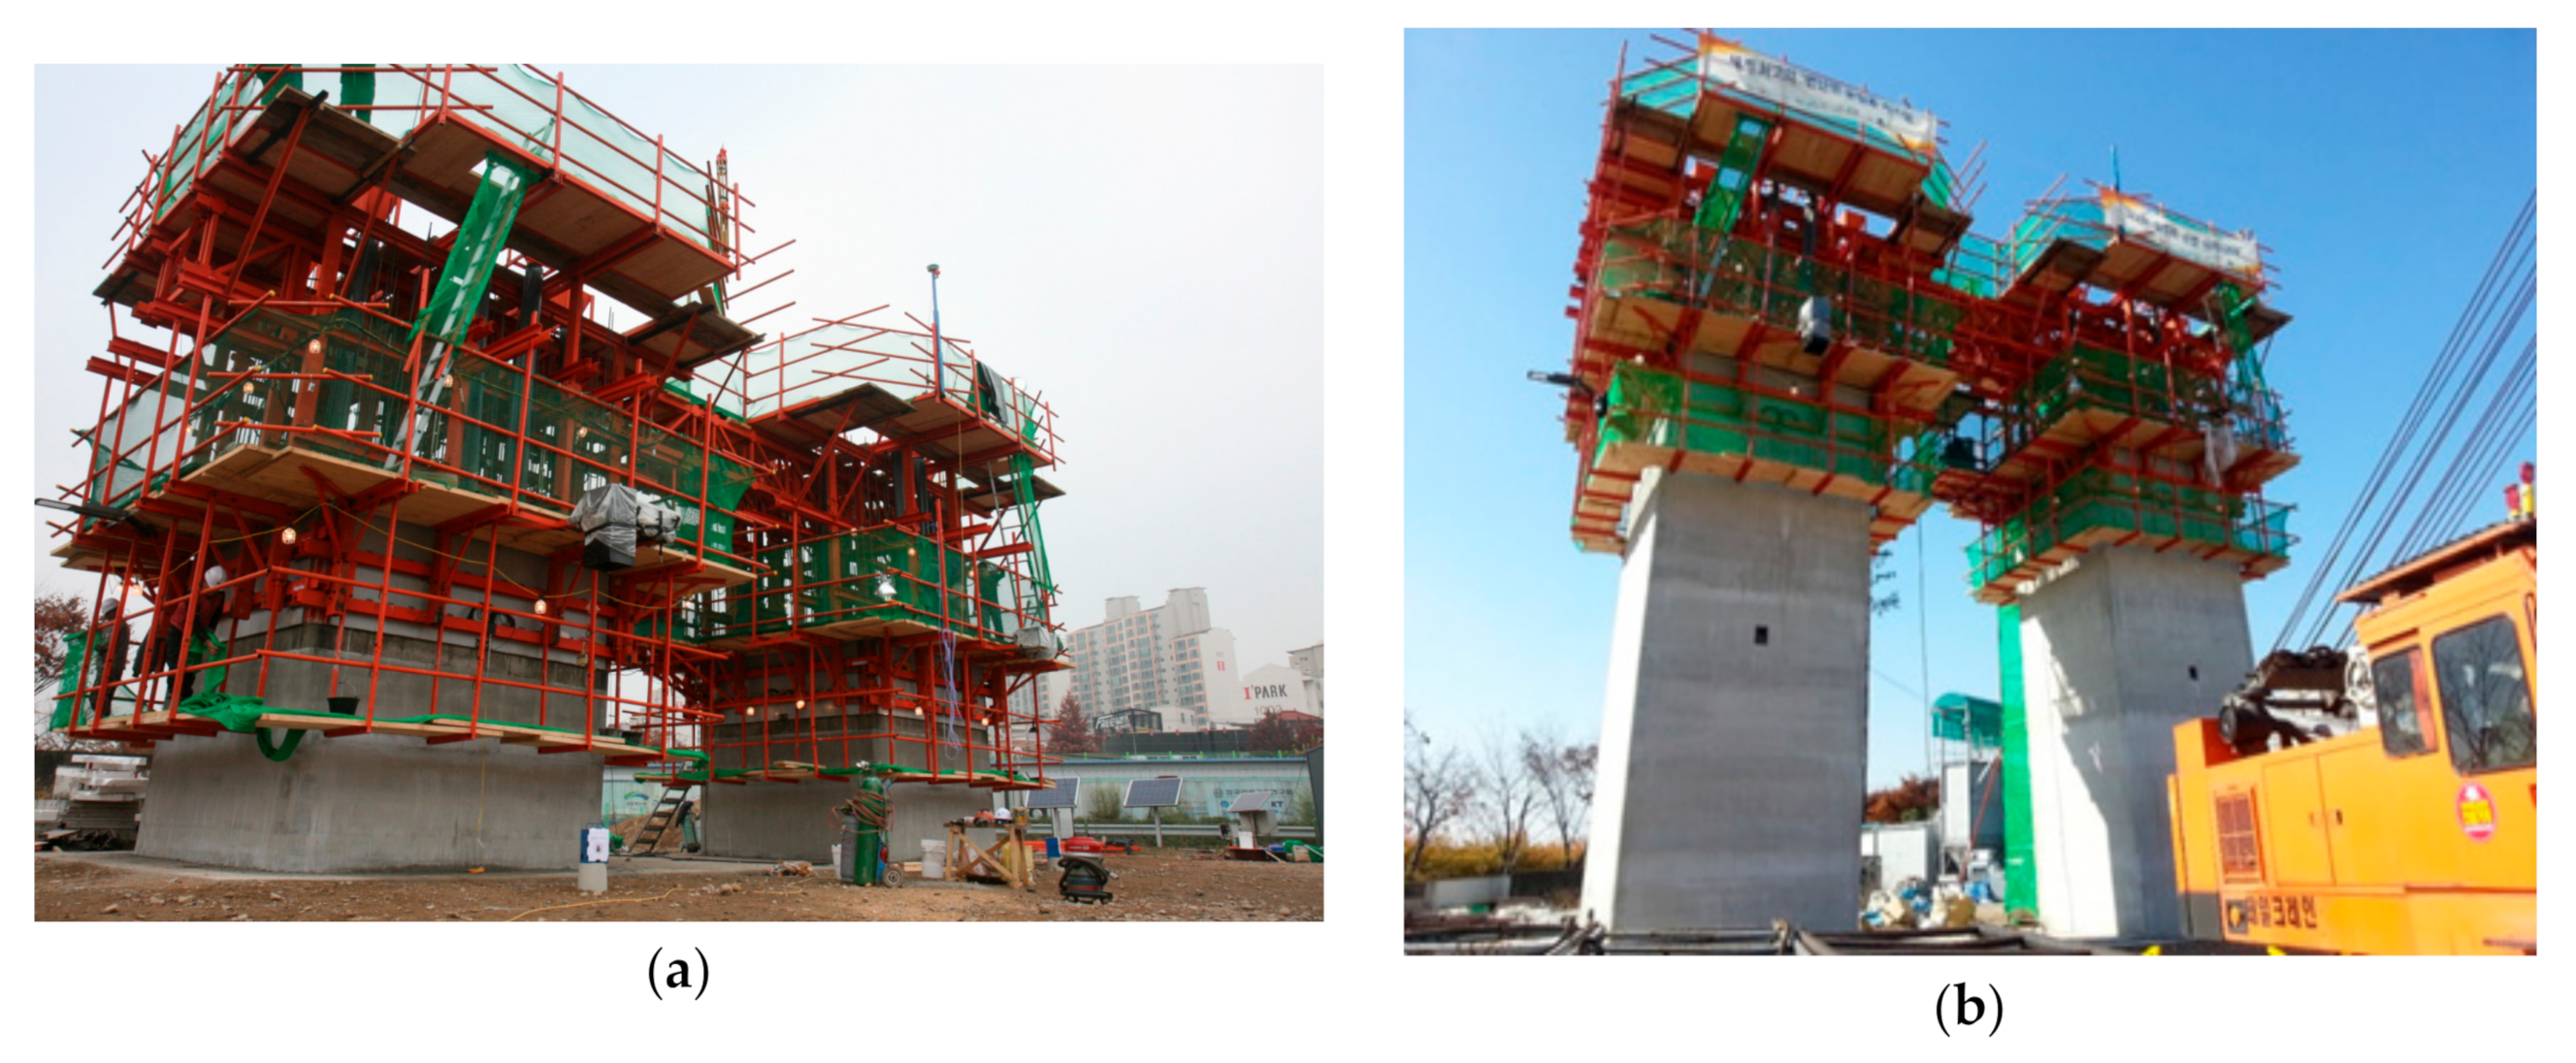
4.2. Application of the Slip-Forming System at Low Temperature
5. Conclusions
Author Contributions
Funding
Conflicts of Interest
References
- Chang, K.C.; Kim, C.W. A Study of Actual Application of Slip-Forming Method; Daewoo Engineering Technical Report; Daewoo Engineering: Seoul, Korea, 1997; pp. 23–44. [Google Scholar]
- Reichverger, Z. Regulation of setting time for improving casting conditions in slip-form concreting. Mater. Struct. 1987, 20, 190–195. [Google Scholar] [CrossRef]
- American Concrete Institute. Guide to Formwork for Concrete; ACI Committee 347; American Concrete Institute: Farmington Hills, MI, USA, 2014. [Google Scholar]
- Reichverger, Z.; Jaegermann, C. Optimal regime in slip form concreting. Mater. Struct. 1980, 13, 109–113. [Google Scholar] [CrossRef]
- Yoon, H. Evaluation of Early-Age Concrete Strength Using Surface Wave Velocity for Slipform Operation. Ph.D. Thesis, Seoul National University, Seoul, Korea, 2017. [Google Scholar]
- Gu, H.; Song, G.; Dhonde, H.; Mo, Y.L.; Yan, S. Concrete early-age strength monitoring using embedded piezoelectric transducers. Smart Mater. Struct. 2006, 15, 1837–1845. [Google Scholar] [CrossRef]
- Dumoulin, C.; Karaiskos, G.; Carette, J.; Staquet, S.; Deraemaeker, A. Monitoring of the ultrasonic P-wave velocity in early-age concrete with embedded piezoelectric transducers. Smart Mater. Struct. 2012, 21, 47001. [Google Scholar] [CrossRef]
- Kong, Q.; Hou, S.; Ji, Q.; Mo, Y.L.; Song, G. Very early age concrete hydration characterization monitoring using piezoceramic based smart aggregates. Smart Mater. Struct. 2013, 22, 85025. [Google Scholar] [CrossRef]
- Shin, S.W.; Qureshi, A.R.; Lee, J.-Y.; Yun, C.B. Piezoelectric sensor based nondestructive active monitoring of strength gain in concrete. Smart Mater. Struct. 2008, 17, 55002. [Google Scholar] [CrossRef]
- Shin, S.W.; Oh, T.K. Application of electro-mechanical impedance sensing technique for online monitoring of strength development in concrete using smart PZT patches. Constr. Build. Mater. 2009, 23, 1185–1188. [Google Scholar] [CrossRef]
- Tawie, R.; Lee, H.K. Monitoring the strength development in concrete by EMI sensing technique. Constr. Build. Mater. 2010, 24, 1746–1753. [Google Scholar] [CrossRef]
- Shin, S.W.; Yun, C.B.; Popovics, J.S.; Kim, J.H. Improved Rayleigh Wave Velocity Measurement for Nondestructive Early-Age Concrete Monitoring. Res. Nondestr. Eval. 2007, 18, 45–68. [Google Scholar] [CrossRef]
- Popovics, J.S.; Song, W.; Achenbach, J.D.; Lee, J.H.; Andre, R.F. One-Sided Stress Wave Velocity Measurement in Concrete. J. Eng. Mech. 1998, 124, 1346–1353. [Google Scholar] [CrossRef]
- Gallo, G.E.; Popovics, J.S. The Use of Surface Waves to Estimate In-Place Strength of Concrete. J. Adv. Concr. Technol. 2005, 3, 355–362. [Google Scholar] [CrossRef]
- Lim, Y.Y.; Kwong, K.Z.; Liew, W.Y.H.; Soh, C.K. Non-destructive concrete strength evaluation using smart piezoelectric transducer—A comparative study. Smart Mater. Struct. 2016, 25, 85021. [Google Scholar] [CrossRef]
- Kim, H.; Kim, Y.J.; Chin, W.J.; Yoon, H. A Study on the Determination of Slip-up Time for Slip-Form System Using Surface Wave Velocity. J. Korean Soc. Civ. Eng. 2012, 32, 483–492. [Google Scholar] [CrossRef]
- Yoon, H.; Kim, Y.J.; Kim, H.S.; Kang, J.W.; Koh, H.-M. Evaluation of Early-Age Concrete Compressive Strength with Ultrasonic Sensors. Sensors 2017, 17, 1817. [Google Scholar] [CrossRef] [PubMed]
- Viktorov, I.A. Rayleigh and Lamb Waves: Physical Theory and Applications, 1st ed.; Springer: New York, NY, USA, 2013. [Google Scholar]
- Neville, A.M. Properties of Concrete, 4th ed.; Pearson: London, UK, 1995. [Google Scholar]
- Popovics, J.S. A Study of Static and Dynamic Modulus of Elasticity of Concrete; ACI-CRC Final Report; University of Illinois at Urbana Champaign: Urbana, IL, USA, 2008. [Google Scholar]
- American Concrete Institute. ACI Committee 318-14: Building Code Requirements for Structural Concrete and Commentary; American Concrete Institute: Farmington Hills, MI, USA, 2014. [Google Scholar]
- Ministry of Land, Infrastructure and Transport. Korean Highway Bridge Design Code (Limit State Design); Ministry of Land, Infrastructure and Transport: Sejong City, Korea, 2016. (In Korean)
- Pessiki, S.P.; Carino, N.J. SettingTime and Strength of Concrete Using the Impact-Echo Method. ACI Mater. J. 1988, 85, 389–399. [Google Scholar]
- Popovics, S.; Rose, J.L.; Popovics, J.S. The behaviour of ultrasonic pulses in concrete. Cem. Concr. Res. 1990, 20, 259–270. [Google Scholar] [CrossRef]
- Kheder, G.F. A two stage procedure for assessment of in situ concrete strength using combined non-destructive testing. Mater. Struct. 1999, 32, 410–417. [Google Scholar] [CrossRef]
- Lee, H.K.; Yim, H.; Lee, K.M. Velocity-Strength Relationship of Concrete by Impact-Echo Method. ACI Mater. J. 2003, 100, 49–54. [Google Scholar]
- Trtnik, G.; Kavčič, F.; Turk, G. Prediction of concrete strength using ultrasonic pulse velocity and artificial neural networks. Ultrasonics 2009, 49, 53–60. [Google Scholar] [CrossRef]
- Miller, G.; Pursey, H.; Neumann, B.H.; Taylor, T. On the partition of energy between elastic waves in a semi-infinite solid. Proc. R. Soc. Lond. Ser. A Math. Phys. Sci. 1955, 233, 55–69. [Google Scholar]
- Kishimoto, K.; Inoue, H.; Hamada, M.; Shibuya, T. Time Frequency Analysis of Dispersive Waves by Means of Wavelet Transform. J. Appl. Mech. 1995, 62, 841–846. [Google Scholar] [CrossRef]
- Inoue, H.; Kishimoto, K.; Shibuya, T. Experimental wavelet analysis of flexural waves in beams. Exp. Mech. 1996, 36, 212–217. [Google Scholar] [CrossRef]
- Kim, H.-J.; Sim, J. Mechanical Properties of GFRP Slip-Form for In-Situ Application. KSCE J. Civ. Eng. 2015, 20, 1842–1851. [Google Scholar] [CrossRef]
- Kim, H.-J.; Kim, Y.; Sim, J. Experimental Verification of GFRP Slip-Form for In-Situ Application. KSCE J. Civ. Eng. 2016, 20, 2134–2142. [Google Scholar] [CrossRef]
- Laureti, S.; Ricci, M.; Mohamed, M.N.I.B.; Senni, L.; Davis, L.A.J.; Hutchins, D.A. Detection of rebars in concrete using advanced ultrasonic pulse compression techniques. Ultrasonics 2018, 85, 31–38. [Google Scholar] [CrossRef]
- Mohamed, I.; Hutchins, D.; Davis, L.; Laureti, S.; Ricci, M. Ultrasonic NDE of thick polyurethane flexible riser stiffener material. Nondestr. Test. Eval. 2017, 32, 343–362. [Google Scholar] [CrossRef] [Green Version]


| Temperature (°C) | k | Velocity, VR (km/s) | |
|---|---|---|---|
| fc = 0.2 MPa | fc = 0.3 MPa | ||
| 30~35 (Group A) | 0.579 | 1.044 | 1.163 |
| 15~20 (Group B) | 0.458 | 1.113 | 1.232 |
| 5 (Group C) | 0.259 | 1.280 | 1.399 |
| W/C * (%) | 35.4 | |
| S/A ** (%) | 46 | |
| Unit weight (kg/m3) | Fly ash | − |
| Super-plasticizer | 4.75 | |
| Cement | 475 | |
| Sand | 760 | |
| Gravel | 935 | |
| Design strength (MPa) | 40 | |
| W/C * (%) | 35.4 | |
| S/A ** (%) | 46 | |
| Unit weight (kg/m3) | Fly ash | − |
| Super-plasticizer | 4.75 | |
| Cement | 475 | |
| Sand | 760 | |
| Gravel | 935 | |
| Design strength (MPa) | 40 | |
© 2019 by the authors. Licensee MDPI, Basel, Switzerland. This article is an open access article distributed under the terms and conditions of the Creative Commons Attribution (CC BY) license (http://creativecommons.org/licenses/by/4.0/).
Share and Cite
Yoon, H.; Kim, Y.J.; Chin, W.J.; Kang, J.W.; Koh, H.-M. Experimental Validation of Slip-Forming Using Ultrasonic Sensors. Sensors 2019, 19, 5053. https://doi.org/10.3390/s19225053
Yoon H, Kim YJ, Chin WJ, Kang JW, Koh H-M. Experimental Validation of Slip-Forming Using Ultrasonic Sensors. Sensors. 2019; 19(22):5053. https://doi.org/10.3390/s19225053
Chicago/Turabian StyleYoon, Hyejin, Young Jin Kim, Won Jong Chin, Jun Won Kang, and Hyun-Moo Koh. 2019. "Experimental Validation of Slip-Forming Using Ultrasonic Sensors" Sensors 19, no. 22: 5053. https://doi.org/10.3390/s19225053