Design and CFD Analysis of the Fluid Dynamic Sampling System of the “MicroMED” Optical Particle Counter †

 ,
,  , and
, and 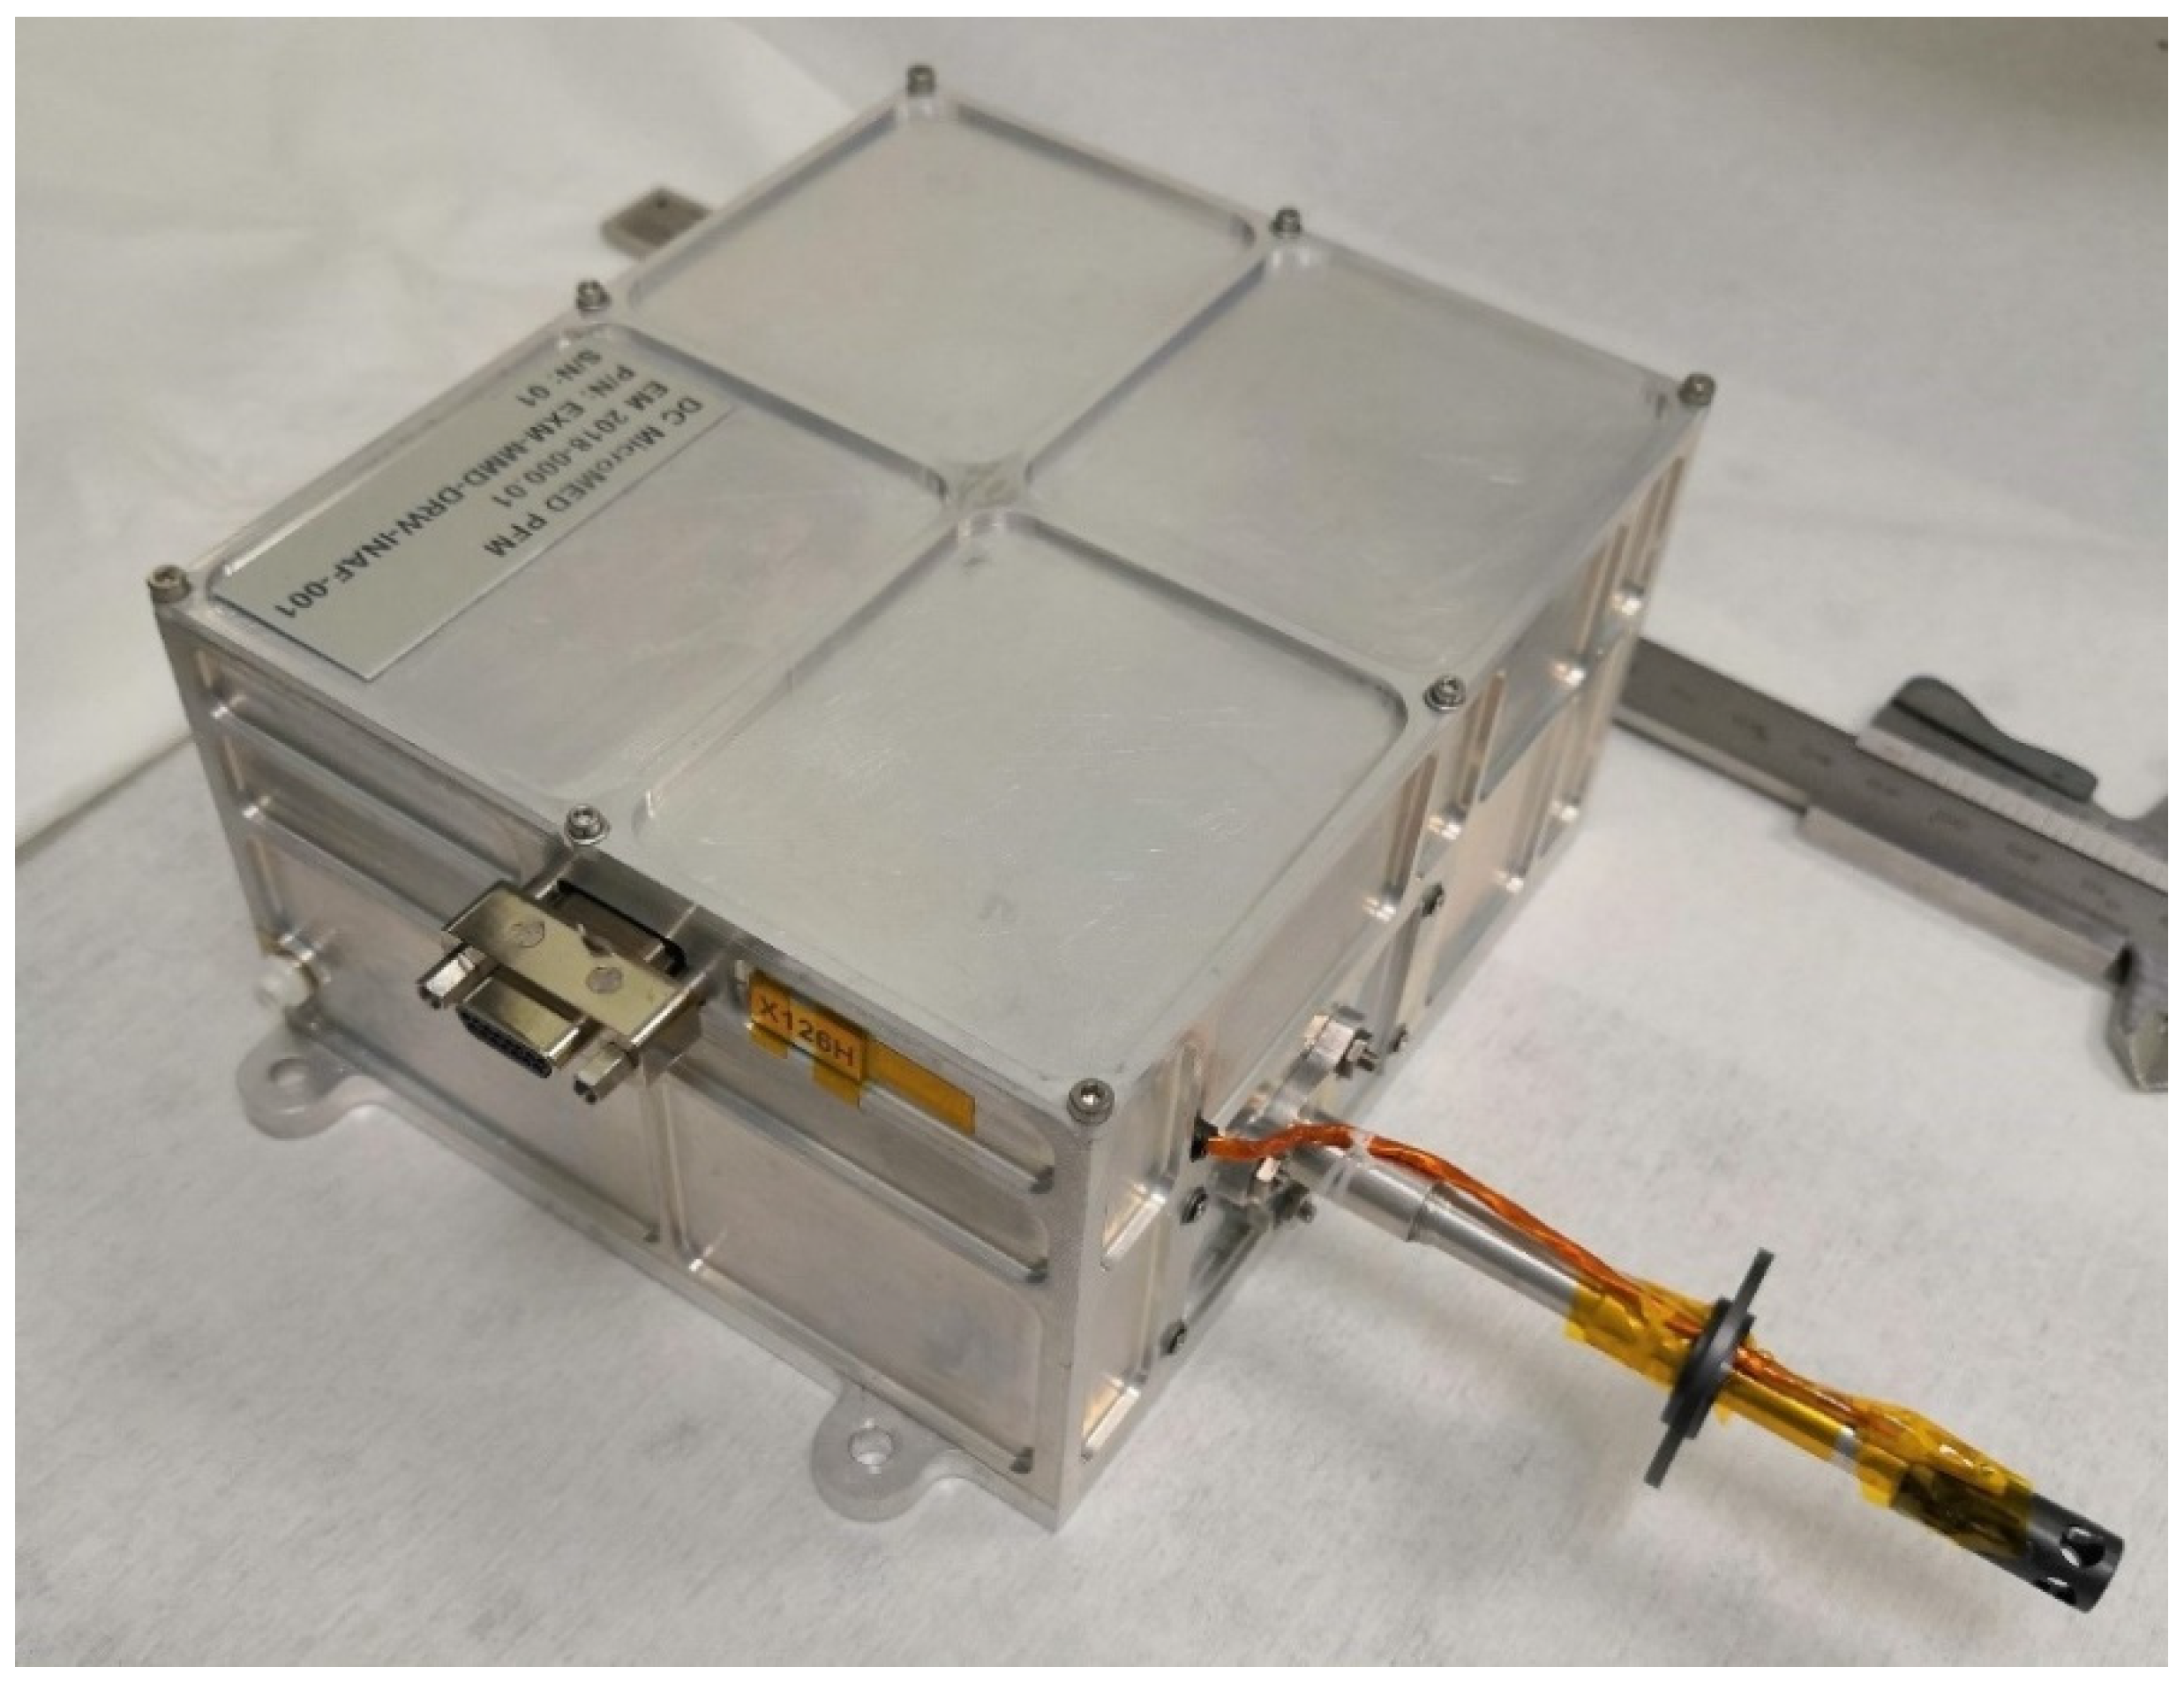
Abstract
:1. Introduction
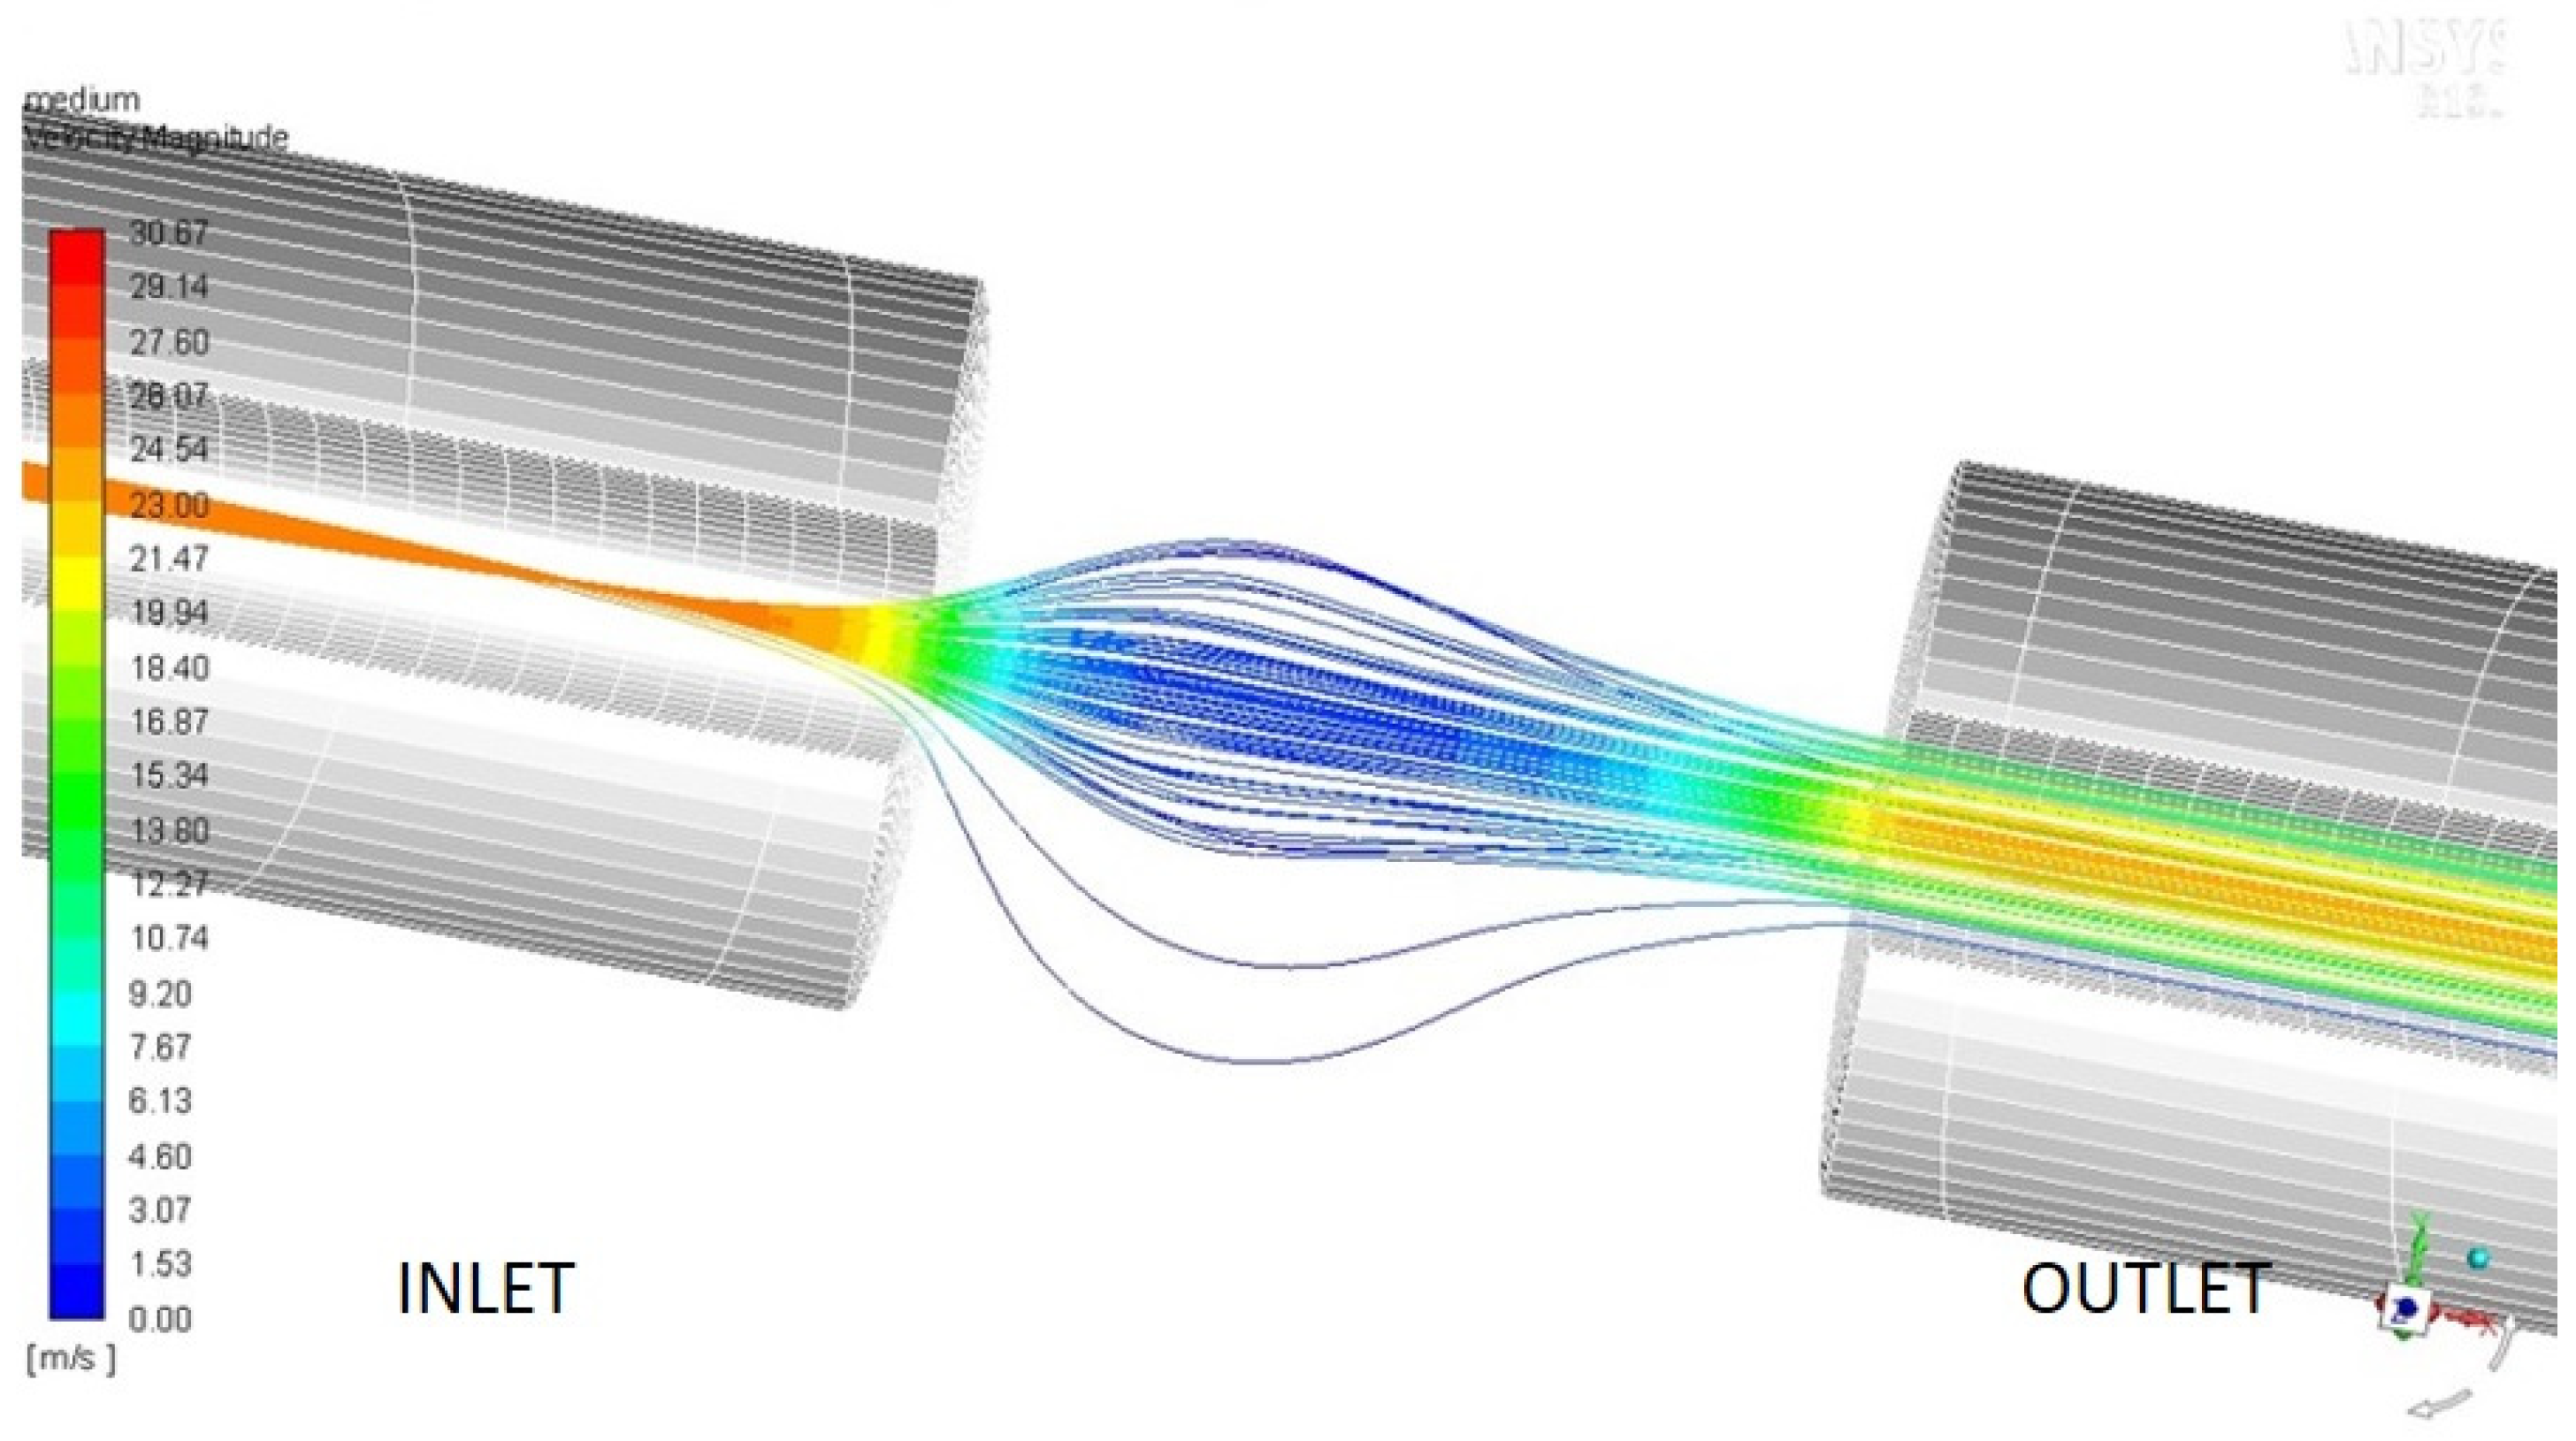
2. Methods
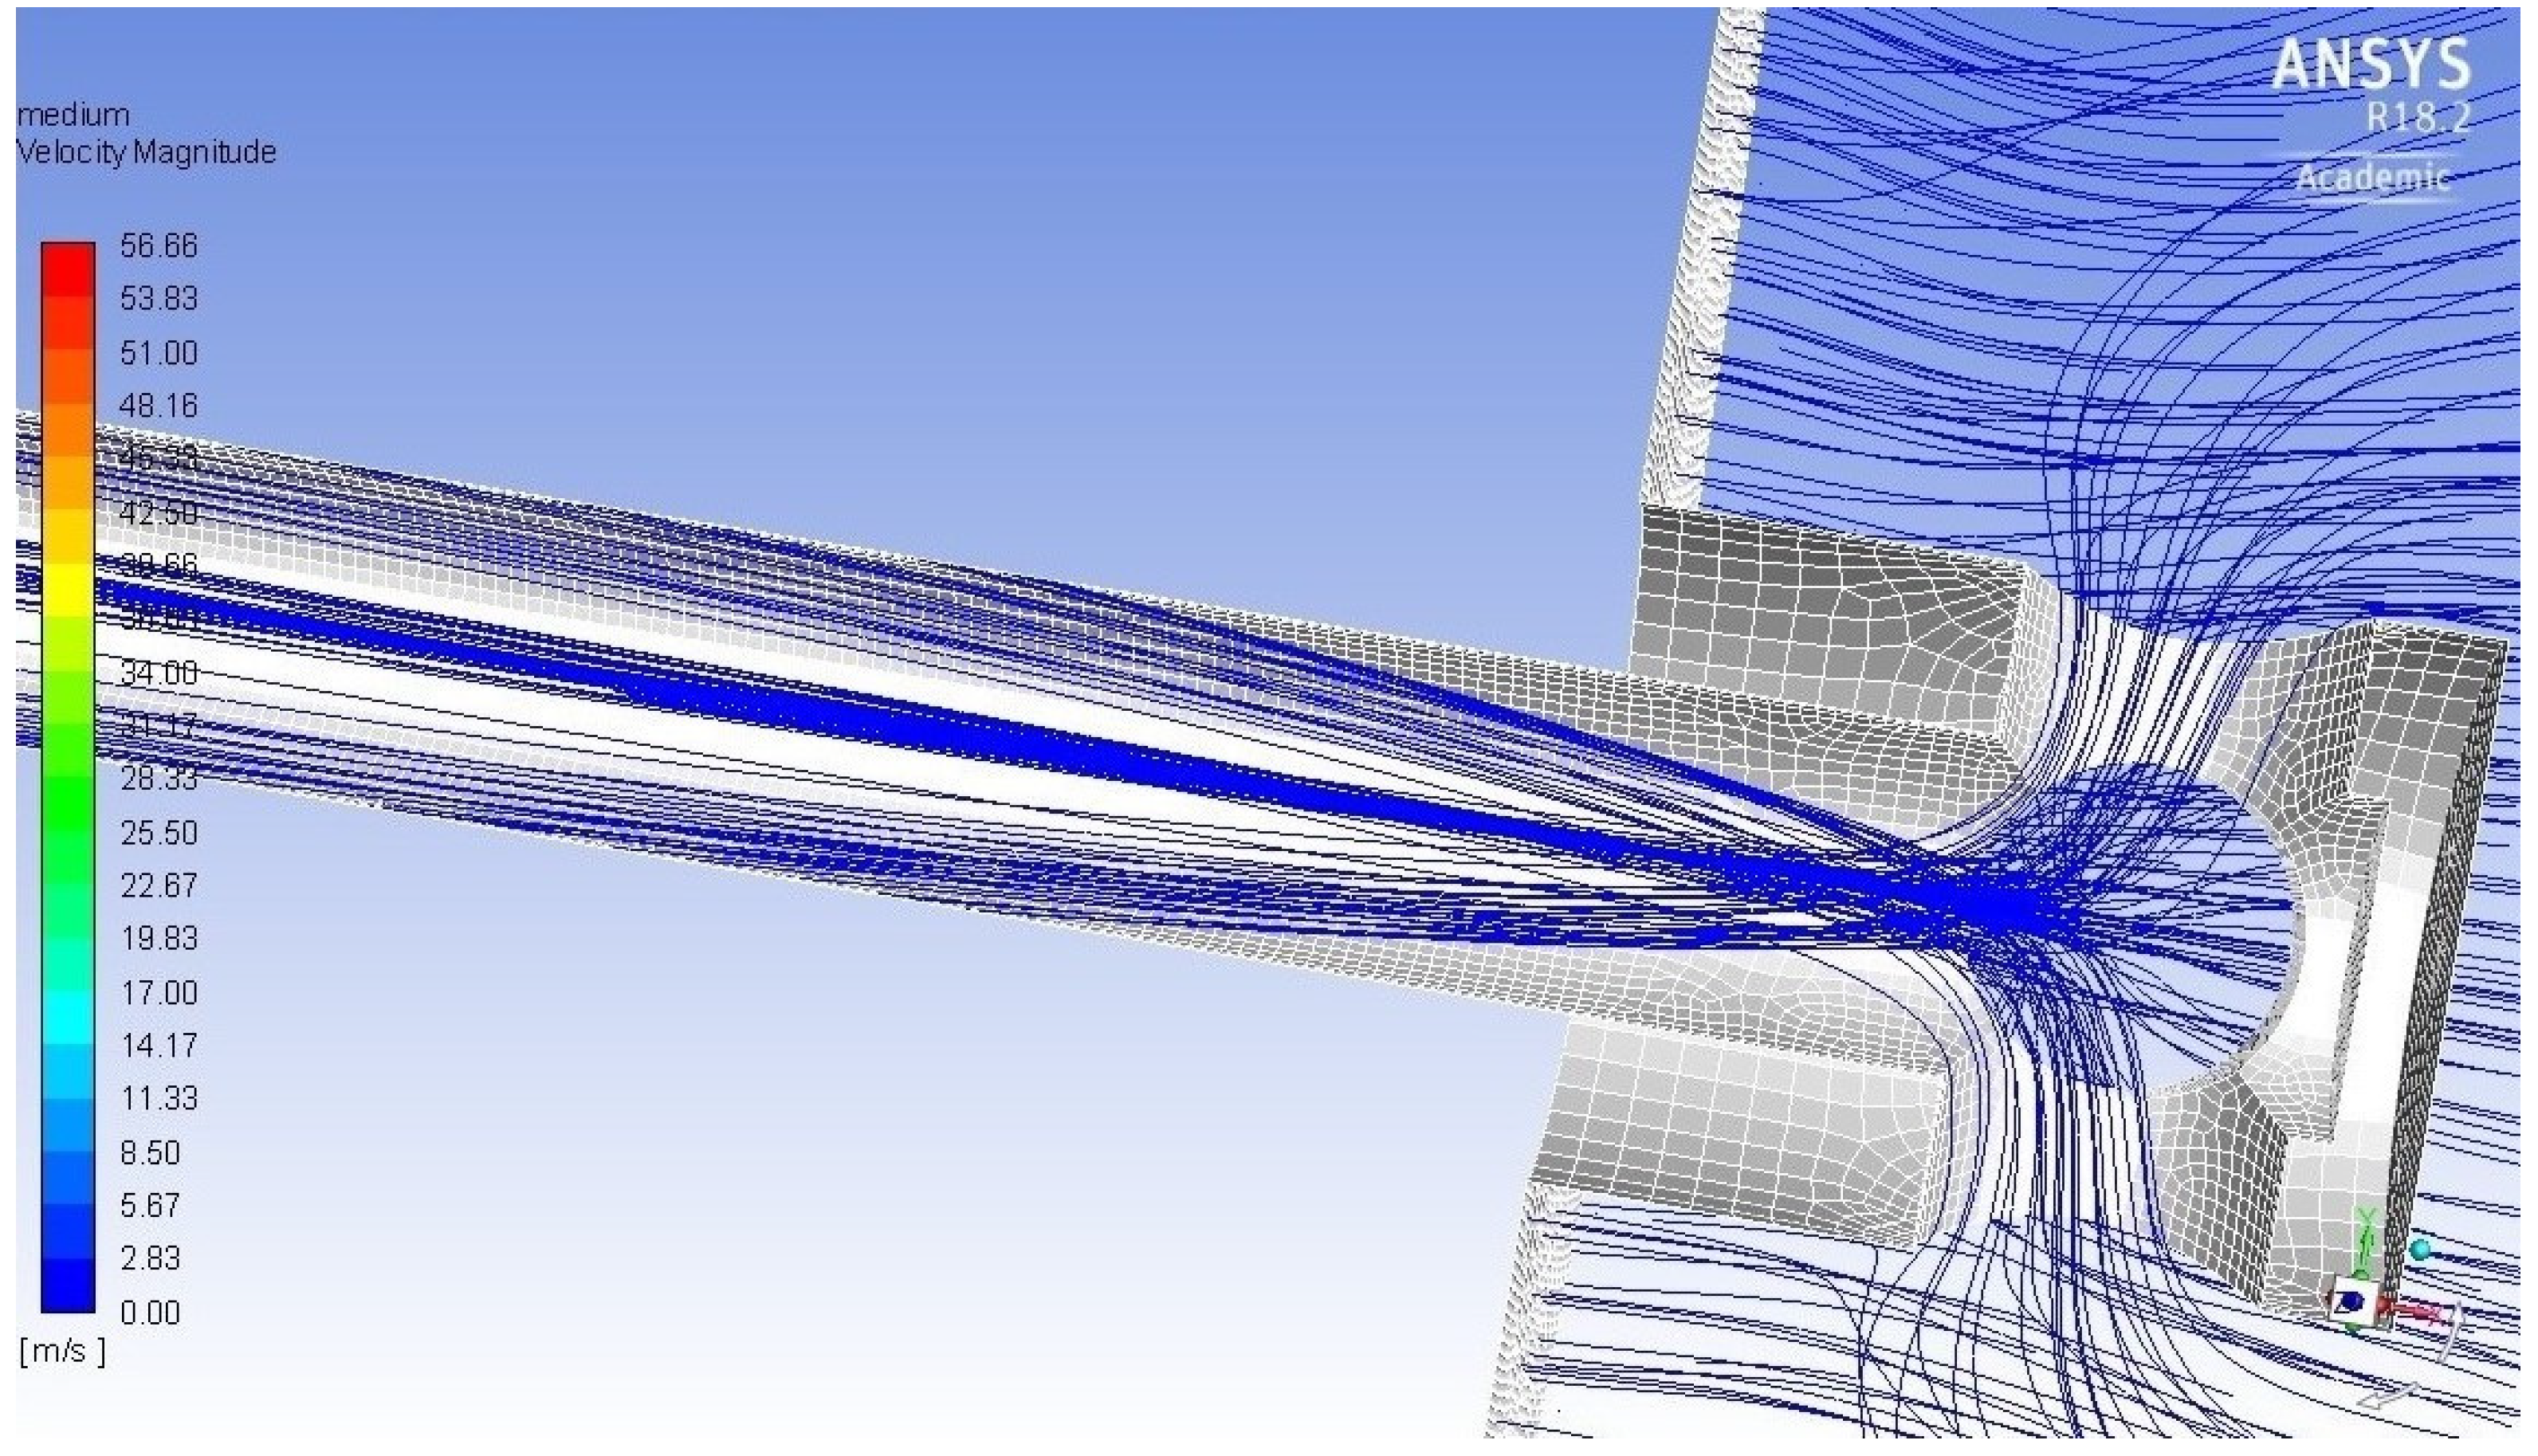
3. Undesired Phenomena
3.1. Collisions on the Inlet Walls
3.2. Deflection of Dust Grains’ Trajectories
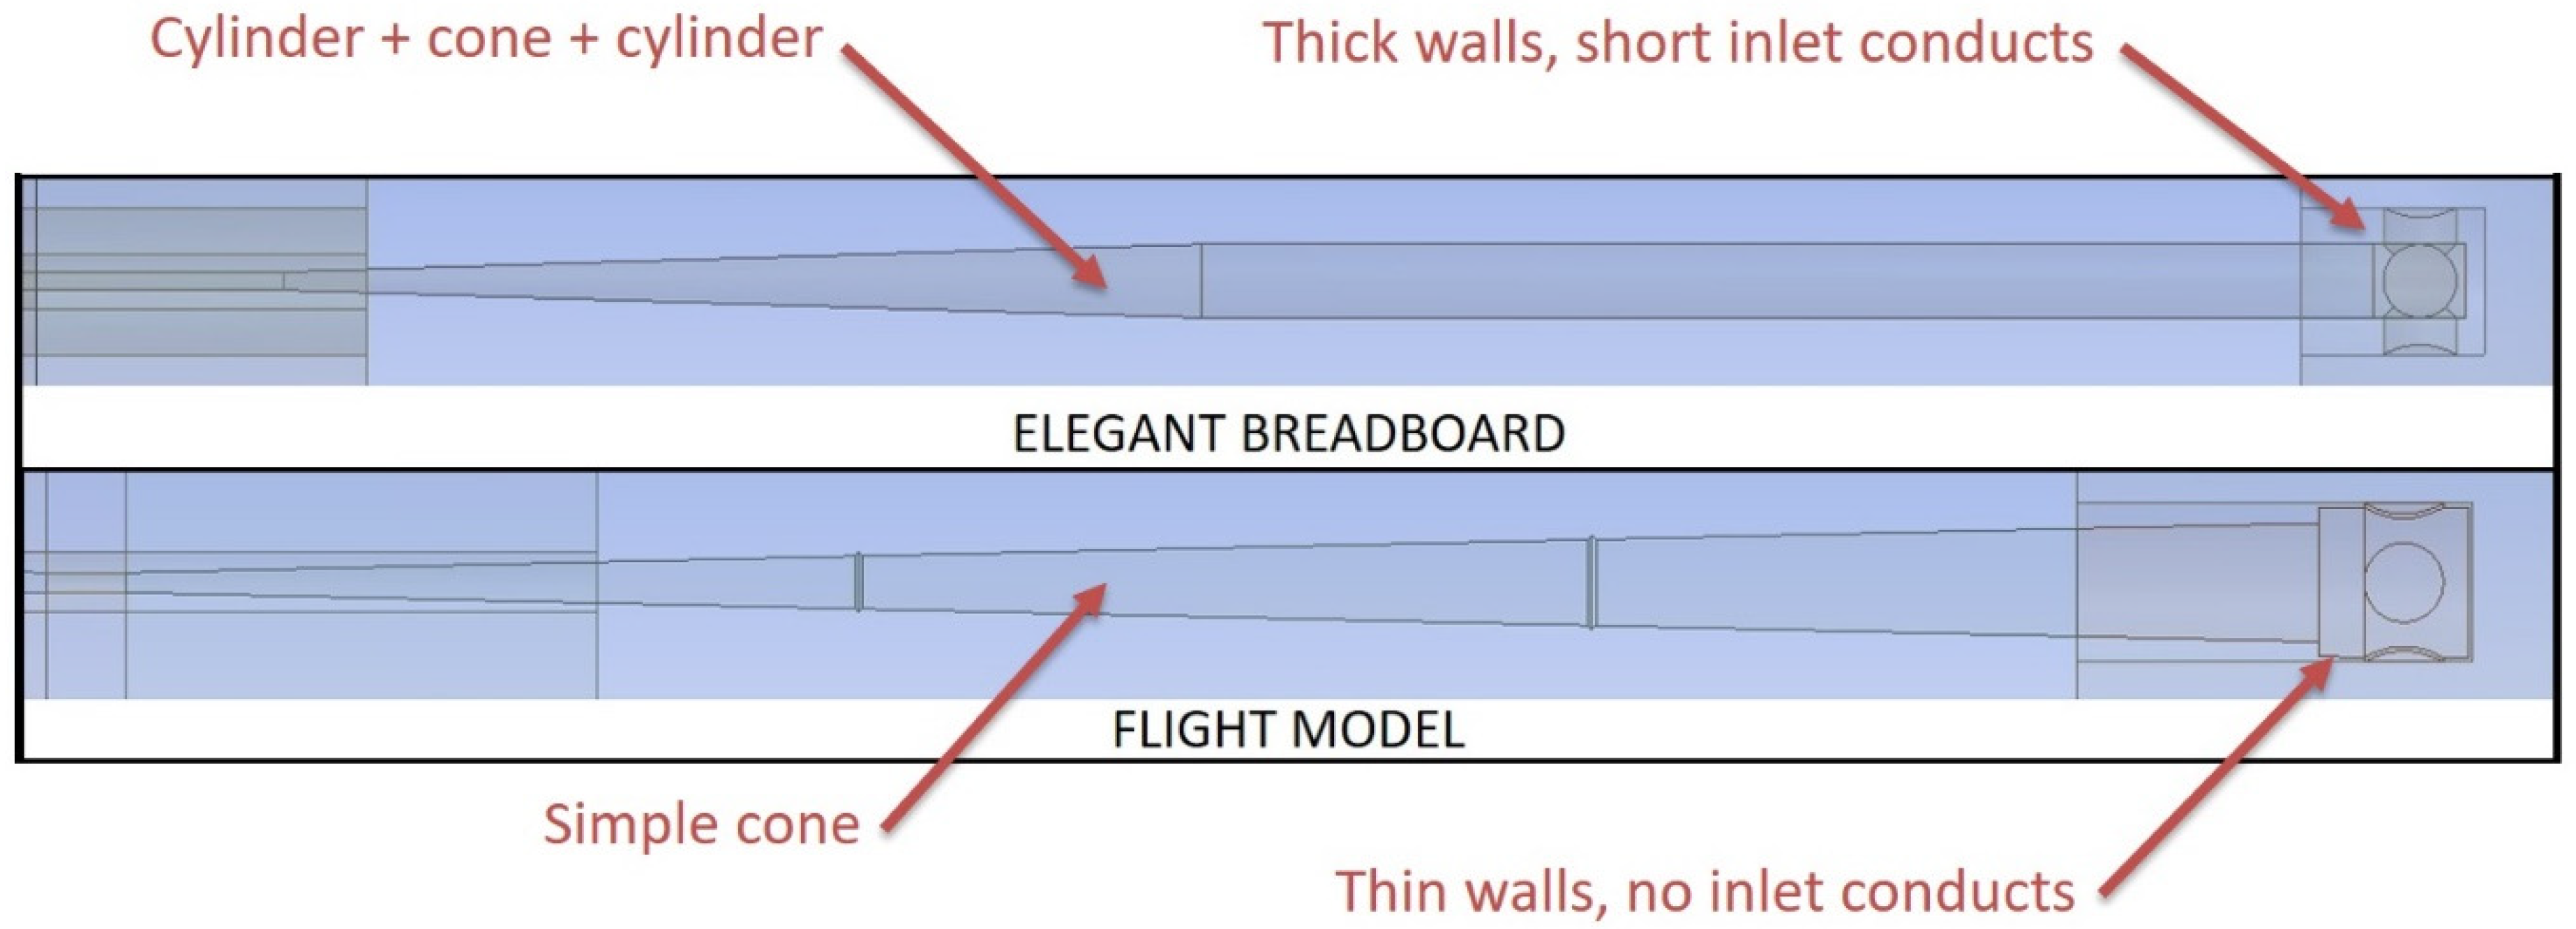
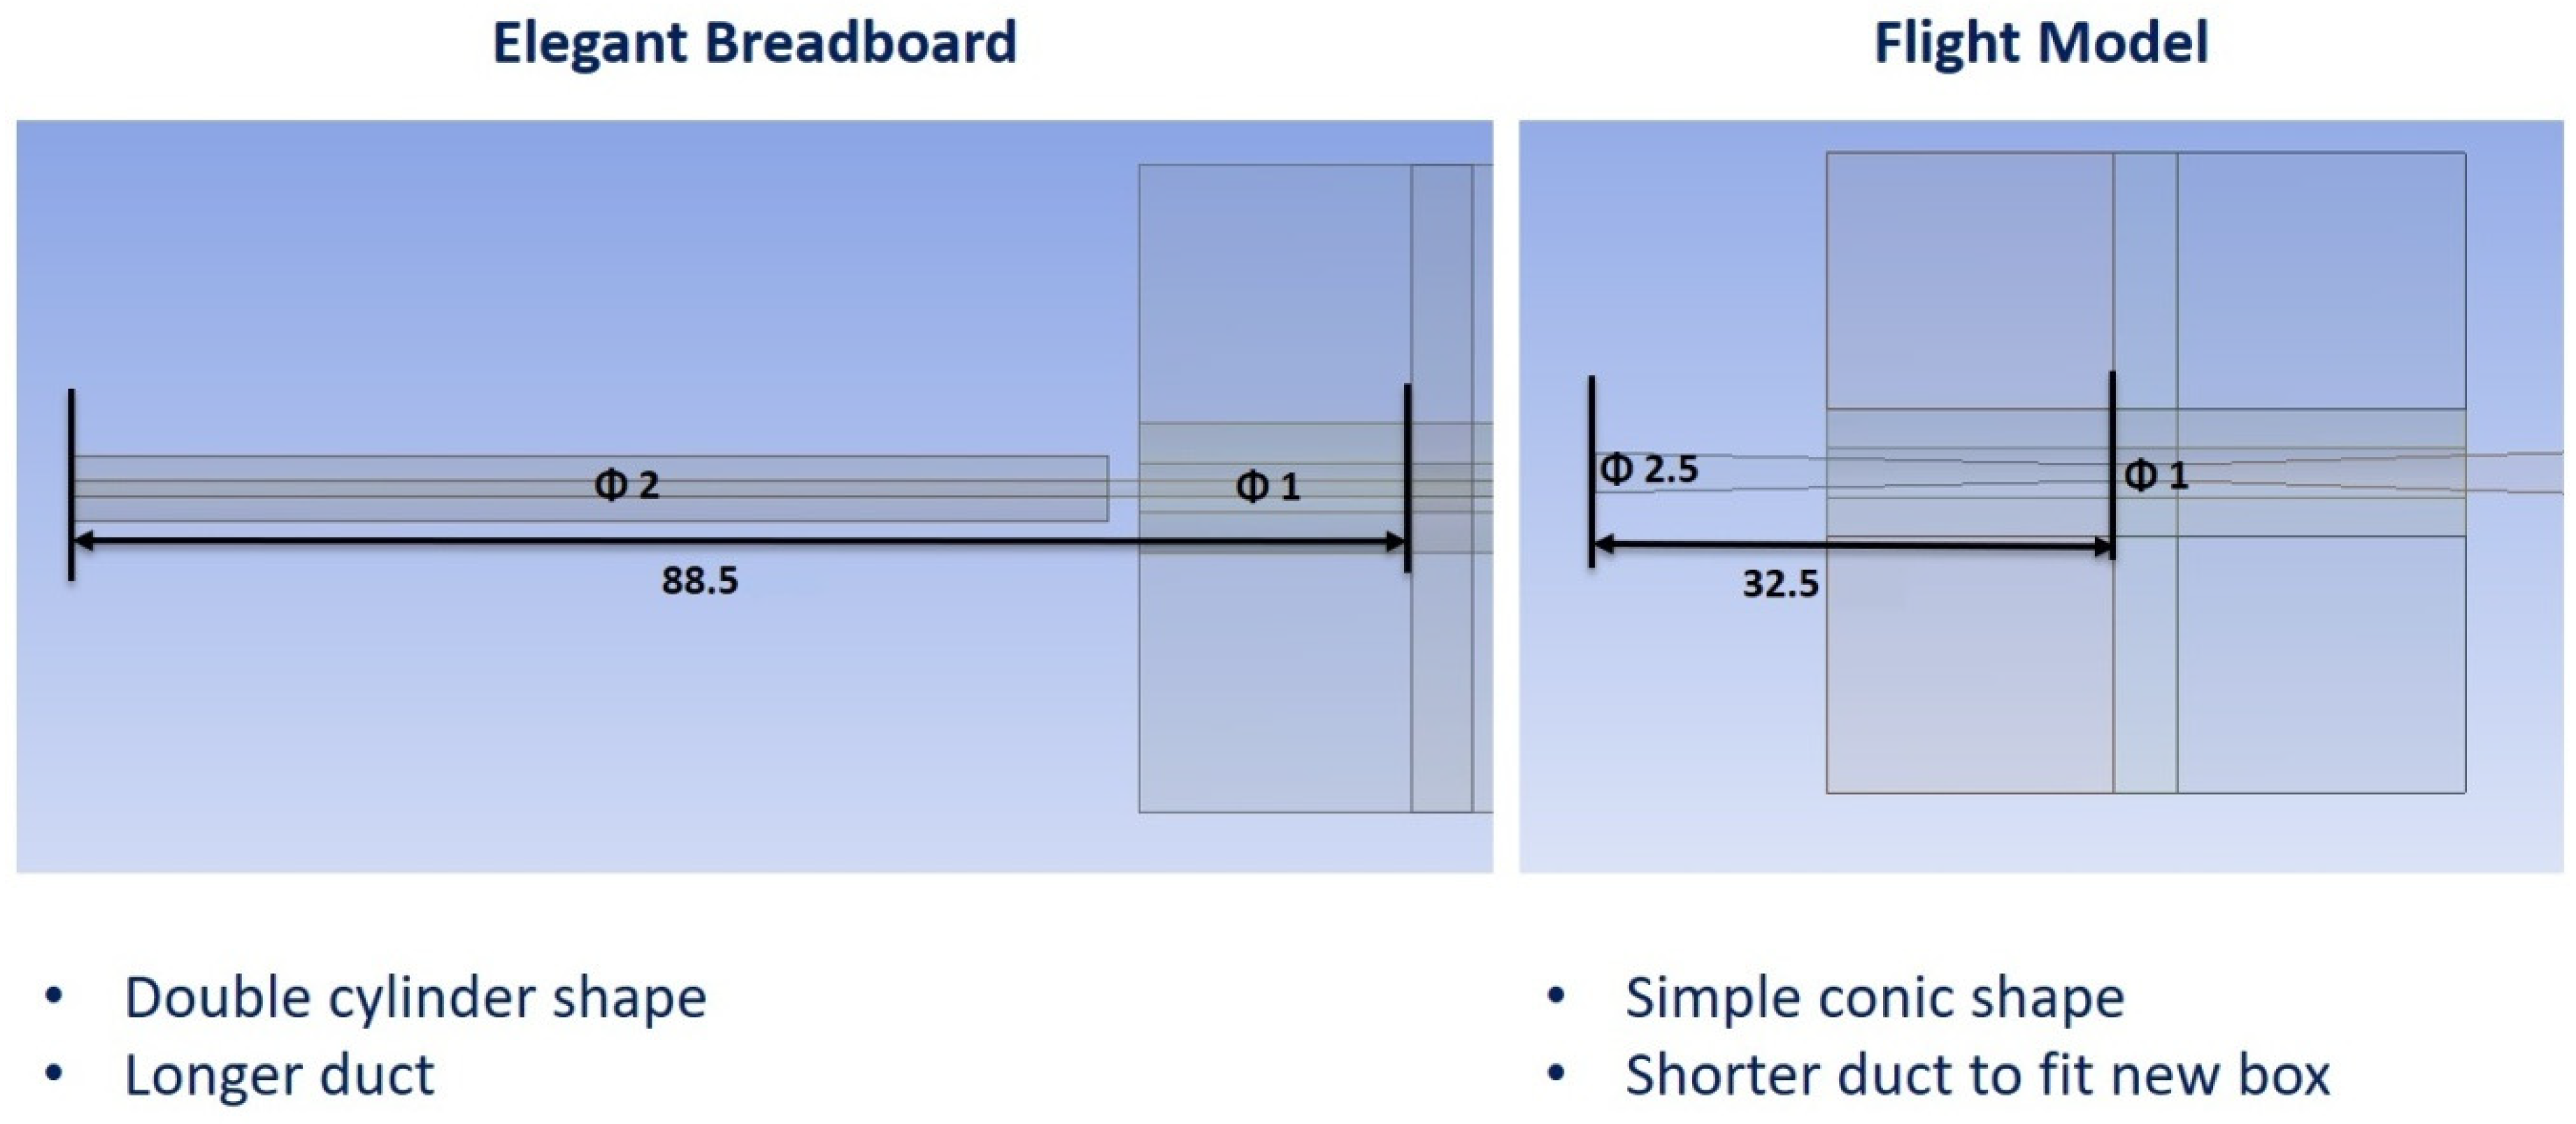
4. Geometry Update
5. Results
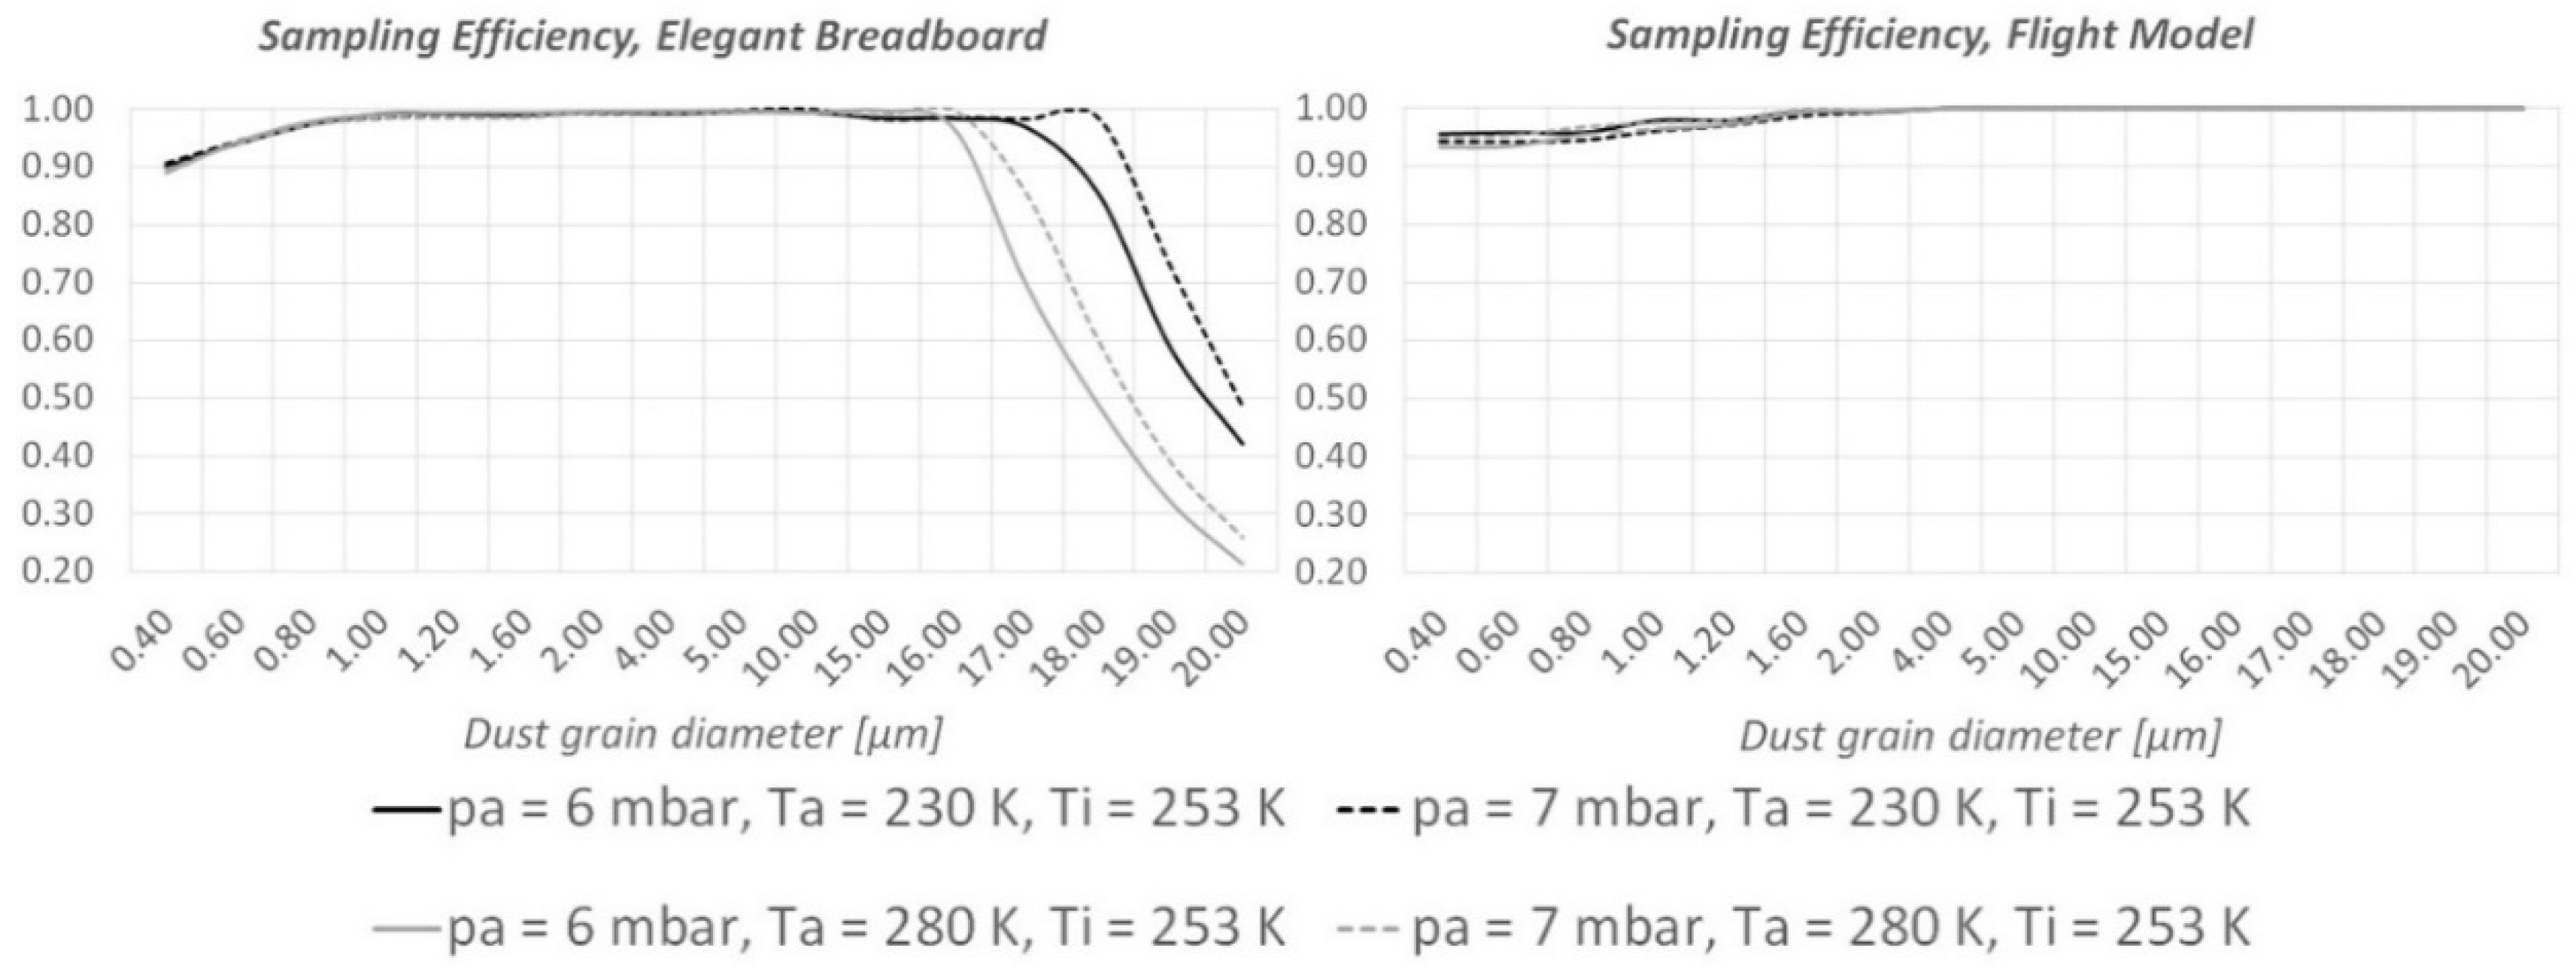
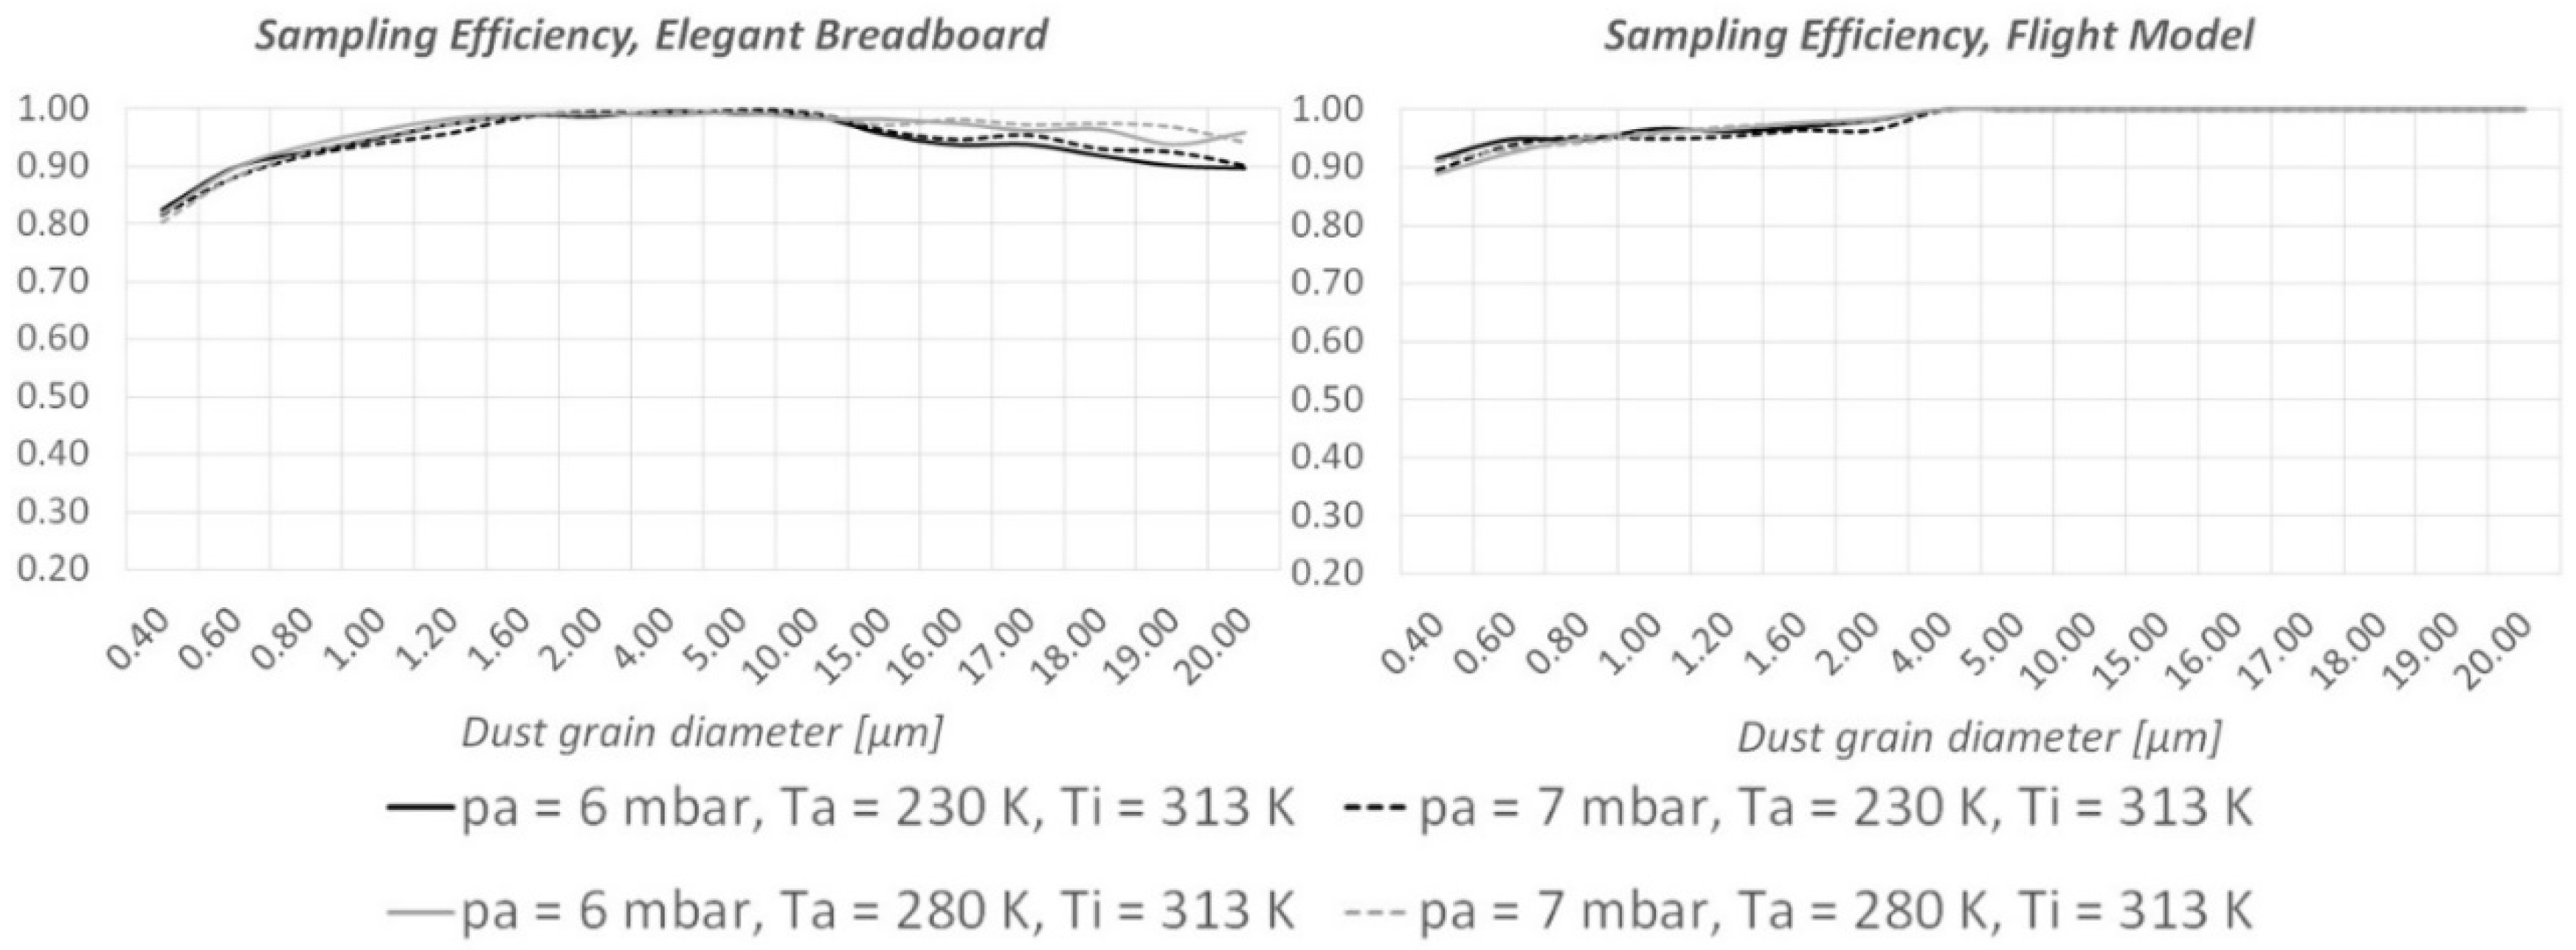
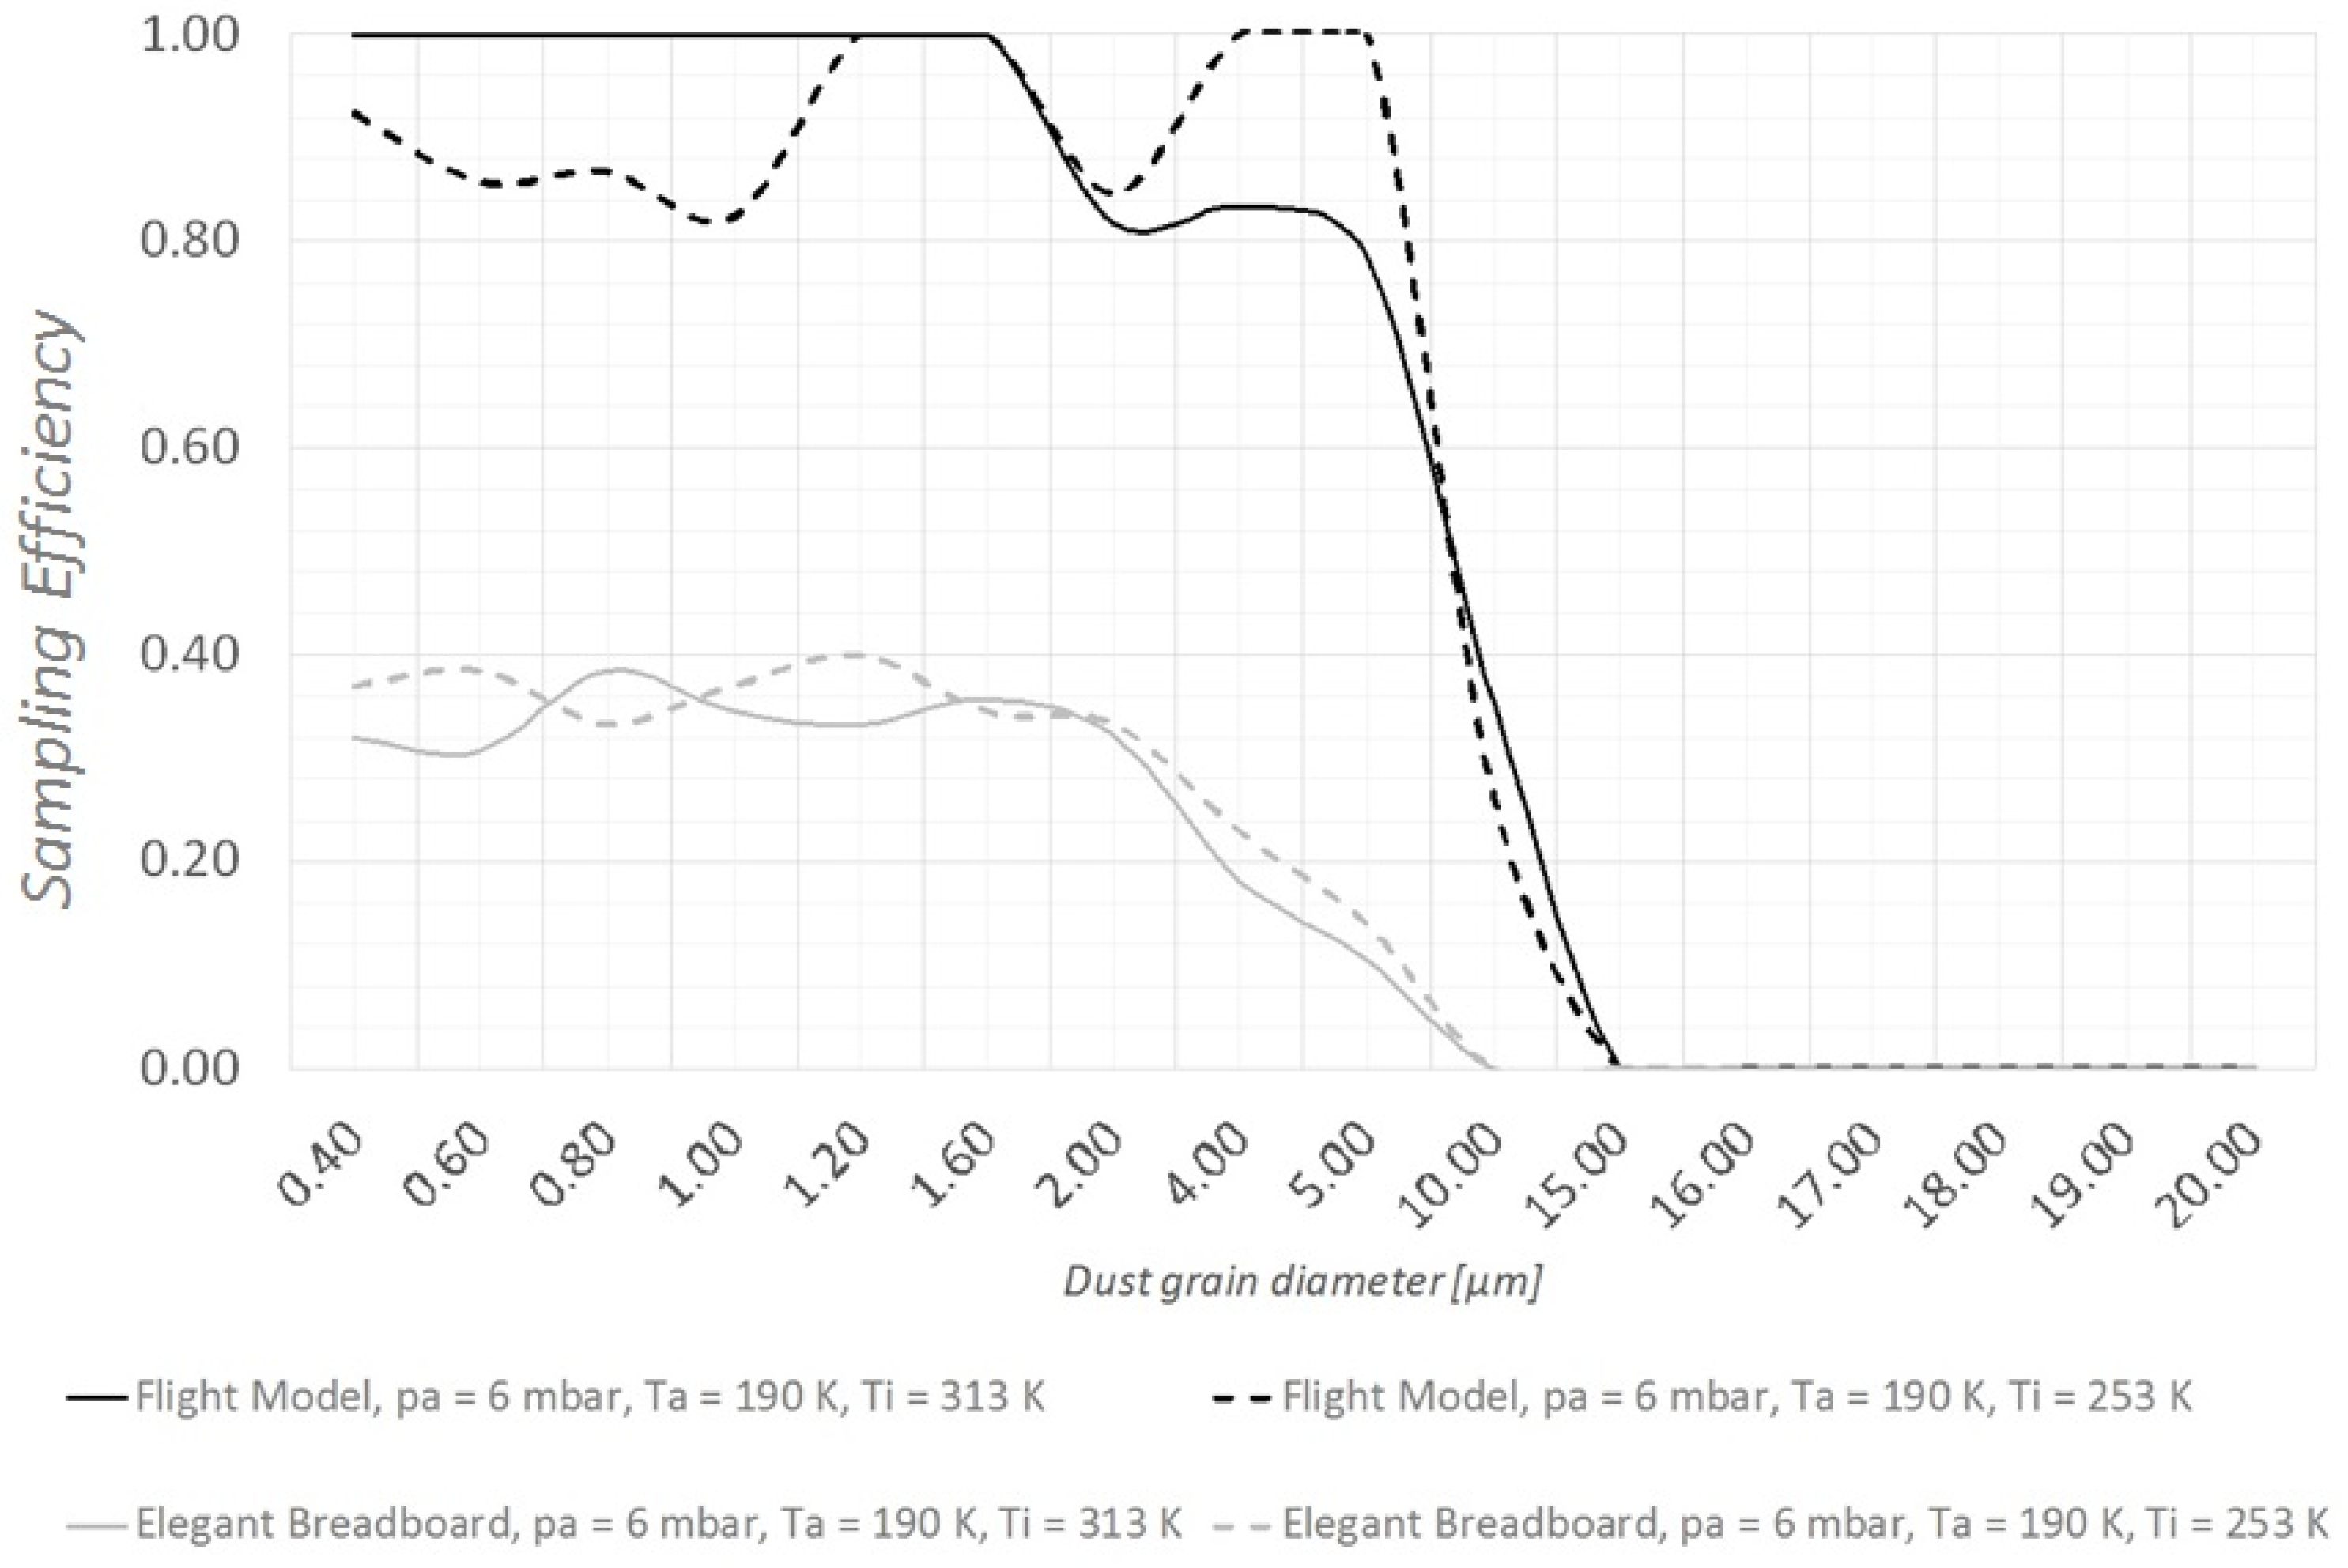
5.1. Sampling Efficiency of Large Dust Grains
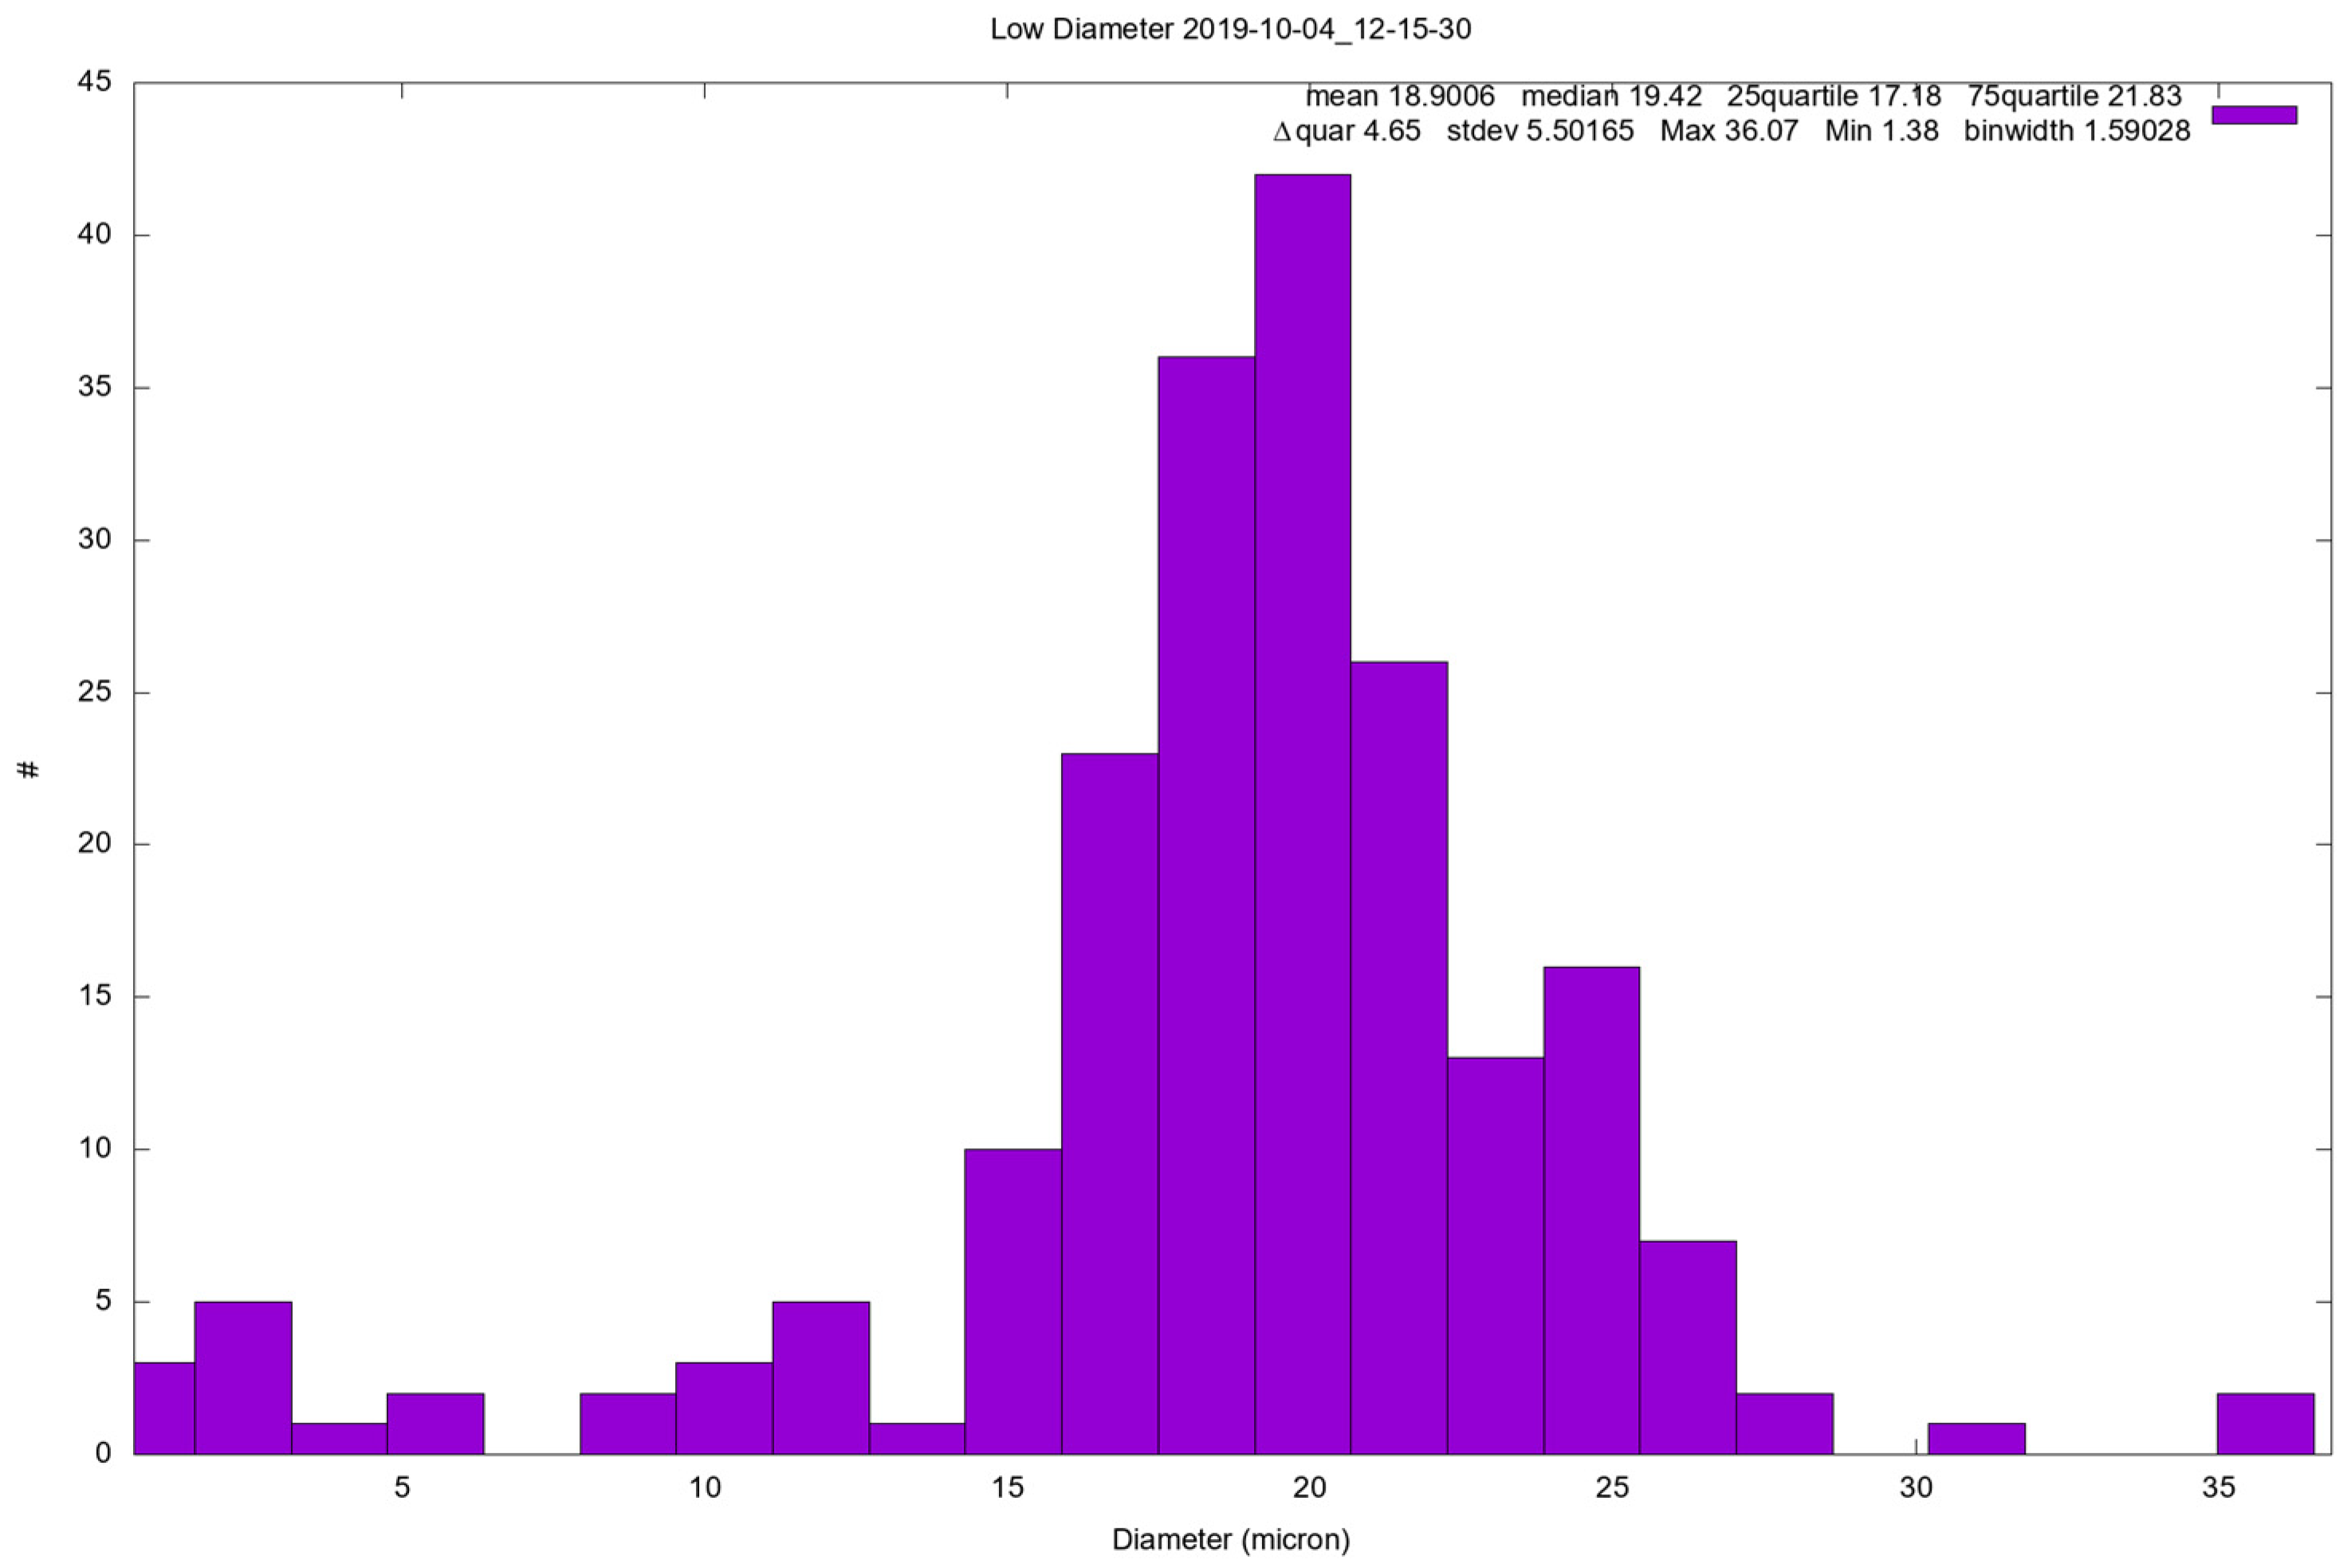
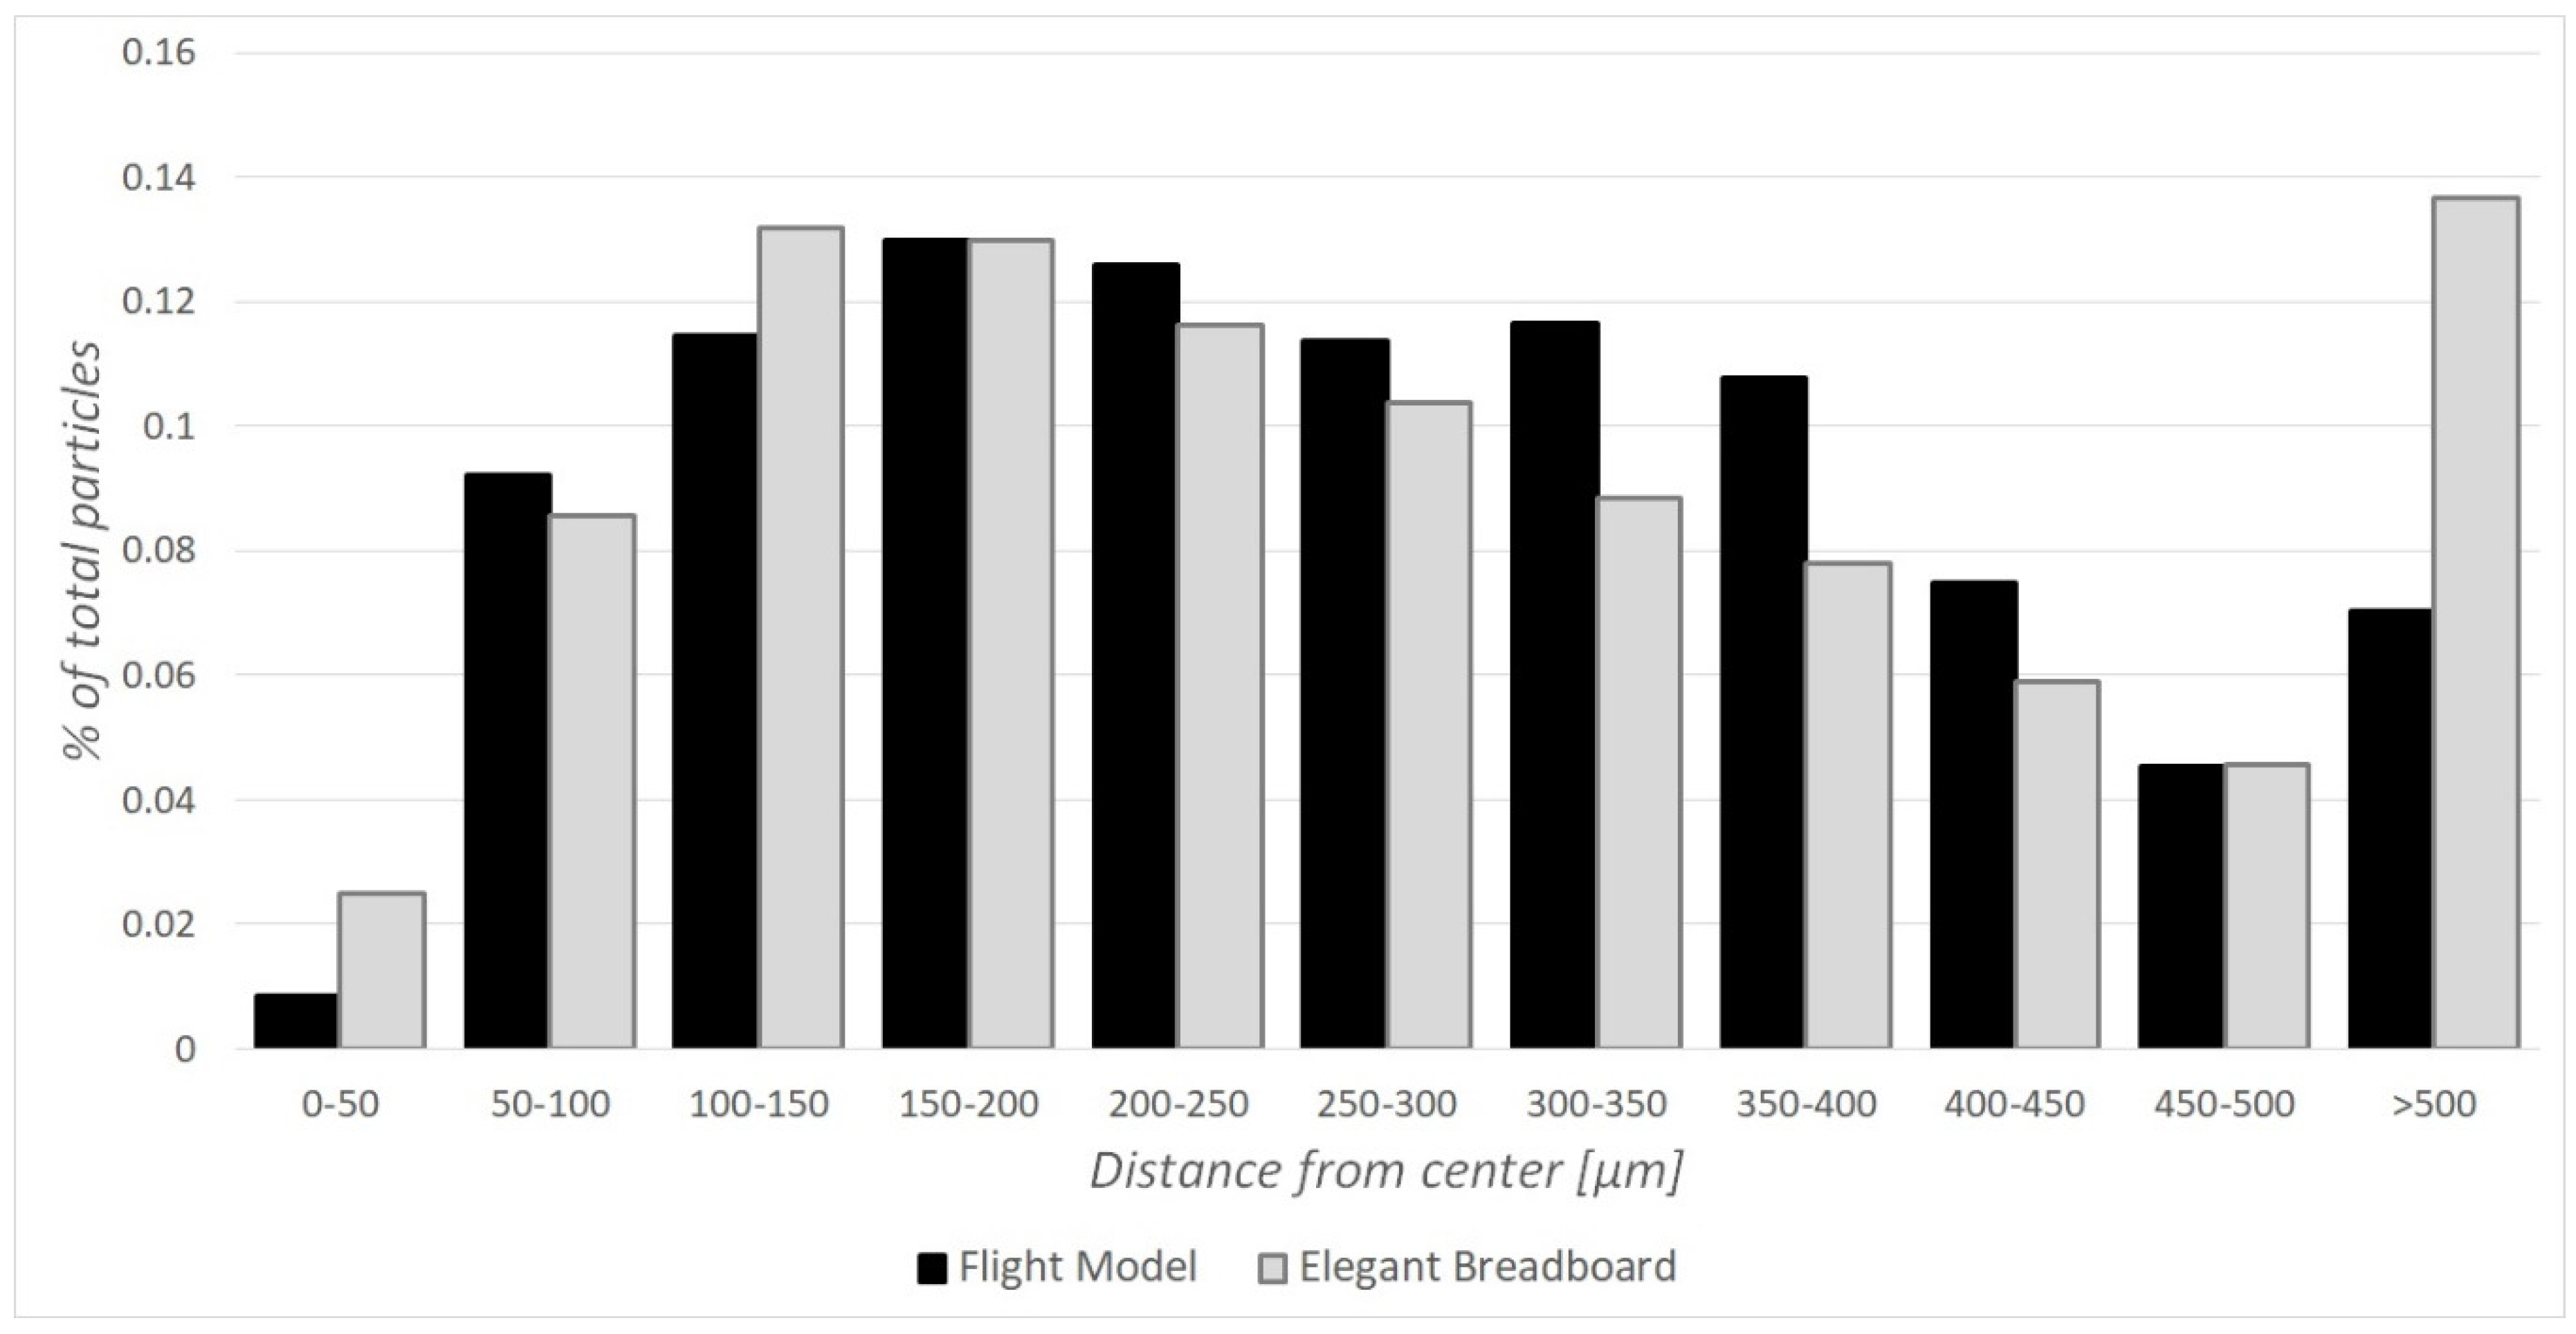
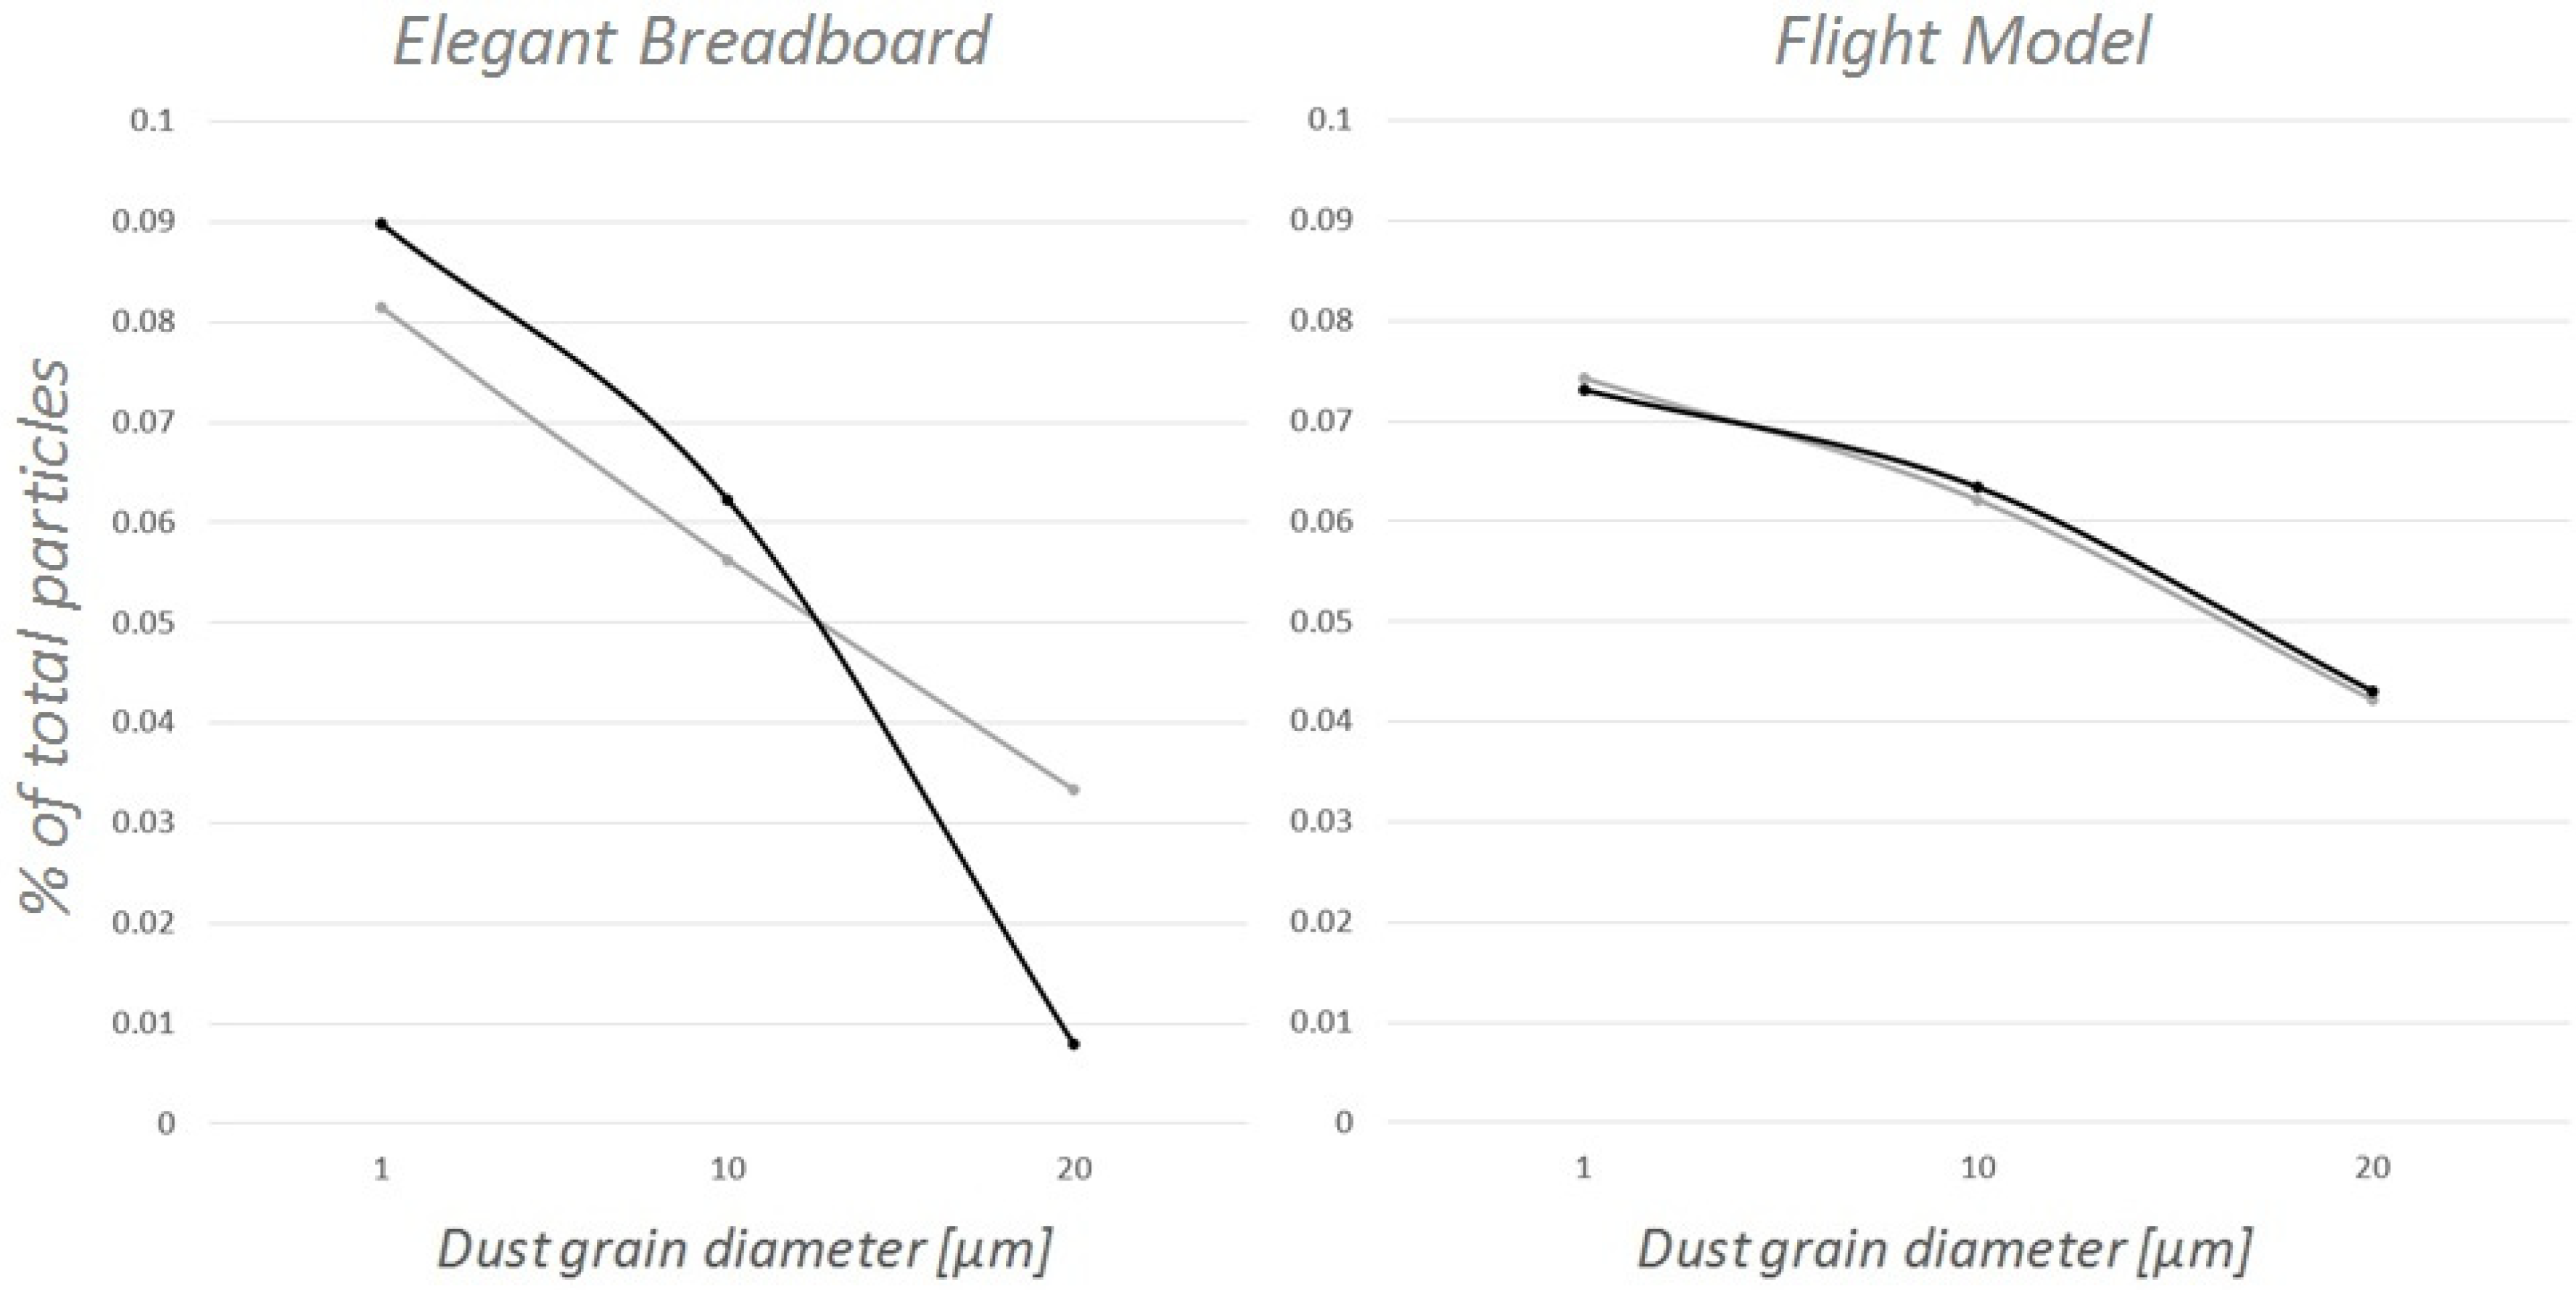
5.2. Dust Grains’ Position in the Sensing Plane and Evaluation of Dust Grain Size Distribution
5.3. Results in Presence of Wind
6. Conclusions
Author Contributions
Funding
Acknowledgments
Conflicts of Interest
Appendix A
Appendix B
Appendix C
References
- Mongelluzzo, G.; Esposito, F.; Cozzolino, F.; Molfese, C.; Silvestro, S.; Franzese, G.; Popa, C.I.; Lubieniecki, M.; Cortecchia, F.; Saggin, B.; et al. CFD analysis and optimization of the sensor “MicroMED” for the ExoMars 2020 mission. Measurement 2019, 147, 106824. [Google Scholar] [CrossRef]
- Mongelluzzo, G.; Esposito, F.; Cozzolino, F.; Molfese, C.; Silvestro, S.; Popa, C.I.; Dall’Ora, M.; Lubieniecki, M.; Cortecchia, F.; Saggin, B.; et al. Optimization of the fluid dynamic design of the Dust Suite-MicroMED sensor for the ExoMars 2020 mission. In Proceedings of the IEEE Metrology for Aerospace (MetroAeroSpace), Rome, Italy, 20–22 June 2018; pp. 134–139. [Google Scholar] [CrossRef]
- Mongelluzzo, G.; Esposito, F.; Cozzolino, F.; Saccabarozzi, D.; Saggin, B. Optimization of the sensor “MicroMED” for the ExoMars 2020 mission: The Flight Model design. In Proceedings of the IEEE Metrology for Aerospace (MetroAeroSpace), Turin, Italy, 19–21 June 2019; pp. 749–753. [Google Scholar] [CrossRef]
- Scaccabarozzi, D.; Saggin, B.; Pagliara, C.; Magni, M.; Tarabini, M.; Esposito, F.; Molfese, C.; Cozzolino, F.; Cortecchia, F.; Dolnikov, G.; et al. MicroMED, design of a particle analyzer for Mars. Measurement 2018, 122, 466–472. [Google Scholar] [CrossRef]
- Scaccabarozzi, D.; Saggin, B.; Somaschini, R.; Magni, M.; Valnegri, P.; Valiesfahani, A.; Tarabini, M.; Esposito, F.; Molfese, C.; Molfese, C.; et al. Design validation of MicroMED, a particle analyzer for ExoMars 2020. In Proceedings of the IEEE Metrology for Aerospace (MetroAerospace), Turin, Italy, 19–21 June 2019. [Google Scholar] [CrossRef]
- Esposito, F.; Colangeli, L.; della Corte, V.; Molfese, C.; Palumbo, P.J.; Ventura, S.; Merrison, J.P. MEDUSA: Observation of atmospheric dust and water vapor close to the surface of Mars. Int. J. Mars Sci. Explor. 2011, 6, 1–12. [Google Scholar]
- Colangeli, L.; Lopez-Moreno, J.J.; Nørnberg, P.; della Corte, V.; Esposito, F.; Epifani, E.M.; Merrison, J.; Molfese, C.; Palumbo, P.; Rodriguez-Gomez, J.F.; et al. MEDUSA: The ExoMars experiment for in-situ monitoring of dust and water vapour. Planet. Space Sci. 2009, 57, 1043–1049. [Google Scholar] [CrossRef]
- Esposito, F.; Debei, S.; Bettanini, C.; Molfese, C.; Rodríguez, I.A.; Colombatti, G.; Harri, A.-M.; Montmessin, F.; Wilson, C.; Aboudan, A.; et al. The DREAMS Experiment Onboard the Schiaparelli Module of the ExoMars 2016 Mission: Design, Performances and Expected Results. Space Sci. Rev. 2018, 214, 103. [Google Scholar] [CrossRef]
- Bettanini, C.; Esposito, F.; Debei, S.; Molfese, C.; Rodríguez, I.A.; Colombatti, G.; Harri, A.; Montmessin, F.; Wilson, C.; Aboudan, A.; et al. The DREAMS experiment on the ExoMars 2016 mission for the study of Martian environment during the dust storm season. In Proceedings of the IEEE Metrology for Aerospace (MetroAeroSpace), Benevento, Italy, 29–30 May 2014; pp. 167–173. [Google Scholar]
- Bettanini, C.; Esposito, F.; Debei, S.; Molfese, C.; Colombatti, G.; Aboudan, A.; Brucato, J.R.; Cortecchia, F.; di Achille, G.; Guizzo, G.P.; et al. The DREAMS experiment flown on the ExoMars 2016 mission for the study of Martian environment during the dust storm season. Measurement 2018, 122, 484–493. [Google Scholar] [CrossRef]
- Colangeli, L.; Moreno, J.J.L.; Palumbo, P.; Rodriguez, J.; Bussoletti, E.; della Corte, V.; Esposito, F.; Herranz, M.; Jerónimo, J.M.; Lopez-Jimenez, A.; et al. GIADA: The Grain Impact Analyzer and Dust Accumulator for the Rosetta space mission. Adv. Space Res. 2007, 39, 446–450. [Google Scholar] [CrossRef]
- Rotundi, A.; Sierks, H.; Della Corte, V.; Fulle, M.; Gutierrez, P.J.; Lara, L.; Barbieri, C.; Lamy, P.L.; Rodrigo, R.; Koschny, D.; et al. Dust measurements in the coma of comet 67P/Churyumov-Gerasimenko inbound to the sun. Science 2015, 347, aaa3905. [Google Scholar] [CrossRef] [PubMed]
- Della Corte, V.; Rotundi, A.; Fulle, M.; Ivanovski, S.; Green, S.F.; Rietmeijer, F.J.M.; Colangeli, L.; Palumbo, P.; Sordini, R.; Ferrari, M.; et al. 67P/C-G inner coma dust properties from 2.2 au inbound to 2.0 au outbound to the Sun. Mon. Not. R. Astron. Soc. 2016, 462 (Suppl. S1), S210–S219. [Google Scholar] [CrossRef]
- Esposito, F.; Colangeli, L.; della Corte, V.; Palumbo, P. Physical aspect of an “impact sensor” for the detection of cometary dust momentum onboard the “Rosetta” space mission. Adv. Space Res. 2002, 29, 1159–1163. [Google Scholar] [CrossRef]
- Wolff, M.J.; Smith, M.D.; Clancy, R.T.; Spanovich, N.; Whitney, B.A.; Lemmon, M.T.; Bandfield, J.L.; Banfield, D.; Ghosh, A.; Landis, G.; et al. Constraints on dust aerosols from the Mars Exploration Rovers using MGS overflights and Mini-TES. J. Geophys. Res. 2006, 112. [Google Scholar] [CrossRef]
- Kok, J.F.; Parteli, E.J.R.; Michaels, T.I.; Karam, D.B. The physics of wind-blown sand and dust. Rep. Prog. Phys. 2012, 75, 1–72. [Google Scholar] [CrossRef] [PubMed]
- Iversen, J.D.; Greeley, R.; Pollack, J.B. Windblown dust on earth, Mars and Venus. J. Atmos. Sci. 1976, 33, 2425–2429. [Google Scholar] [CrossRef]
- Doronzo, D.M.; de Tullio, M.D.; Dellino, P.; Pascazio, G. Numerical simulation of pyroclastic density currents using locally refined Cartesian grids. Comput. Fluids 2011, 44, 56–67. [Google Scholar] [CrossRef]
- Doronzo, D.M.; Khalaf, E.A.; Dellino, P.; de Tullio, M.D.; Dioguardi, F.; Gurioli, L.; Mele, D.; Pascazio, G.; Sulpizio, R. Local impact of dust storms around a suburban building in arid and semi-arid regions: Numerical simulation examples from Dubai and Riyadh, Arabian Peninsula. Arab. J. Geosci. 2014. [Google Scholar] [CrossRef]
- Almeida, M.P.; Andrade, J.S., Jr.; Herrmann, H.J. Aeolian transport layer. Phys. Rev. Lett. 2006, 96, 018001. [Google Scholar] [CrossRef] [PubMed]
- Cunningham, E. On the Velocity of Steady Fall of Spherical Particles through Fluid Medium. Proc. R. Soc. Lond. Ser. A Contain. Pap. Math. Phys. Character 1910, 83, 357–365. [Google Scholar] [CrossRef]
- Holstein-Rathlou, C.; Merrison, J.; Iversen, J.J.; Jakobsen, A.B.; Nicolajsen, R.; Nørnberg, P.; Rasmussen, K.; Merlone, A.; Lopardo, G.; Hudson, T.; et al. An Environmental Wind Tunnel Facility for Testing Meteorological Sensor Systems. J. Atmos. Ocean. Technol. 2014, 31, 447–457. [Google Scholar] [CrossRef]


© 2019 by the authors. Licensee MDPI, Basel, Switzerland. This article is an open access article distributed under the terms and conditions of the Creative Commons Attribution (CC BY) license (http://creativecommons.org/licenses/by/4.0/).
Share and Cite
Mongelluzzo, G.; Esposito, F.; Cozzolino, F.; Franzese, G.; Ruggeri, A.C.; Porto, C.; Molfese, C.; Scaccabarozzi, D.; Saggin, B. Design and CFD Analysis of the Fluid Dynamic Sampling System of the “MicroMED” Optical Particle Counter. Sensors 2019, 19, 5037. https://doi.org/10.3390/s19225037
Mongelluzzo G, Esposito F, Cozzolino F, Franzese G, Ruggeri AC, Porto C, Molfese C, Scaccabarozzi D, Saggin B. Design and CFD Analysis of the Fluid Dynamic Sampling System of the “MicroMED” Optical Particle Counter. Sensors. 2019; 19(22):5037. https://doi.org/10.3390/s19225037
Chicago/Turabian StyleMongelluzzo, Giuseppe, Francesca Esposito, Fabio Cozzolino, Gabriele Franzese, Alan Cosimo Ruggeri, Carmen Porto, Cesare Molfese, Diego Scaccabarozzi, and Bortolino Saggin. 2019. "Design and CFD Analysis of the Fluid Dynamic Sampling System of the “MicroMED” Optical Particle Counter" Sensors 19, no. 22: 5037. https://doi.org/10.3390/s19225037