Review

Carbon-Based Nanomaterials for Plasmonic Sensors: A Review

Department of Physics, Indian Institute of Technology Delhi, New Delhi 110016, India
*
Author to whom correspondence should be addressed.
Sensors 2019, 19(16), 3536; https://doi.org/10.3390/s19163536
Submission received: 15 July 2019 / Revised: 10 August 2019 / Accepted: 11 August 2019 / Published: 13 August 2019
(This article belongs to the Special Issue Advances in Plasmonic Sensing)

Abstract

:
The surface plasmon resonance (SPR) technique is a remarkable tool, with applications in almost every area of science and technology. Sensing is the foremost and majorly explored application of SPR technique. The last few decades have seen a surge in SPR sensor research related to sensitivity enhancement and innovative target materials for specificity. Nanotechnological advances have augmented the SPR sensor research tremendously by employing nanomaterials in the design of SPR-based sensors, owing to their manifold properties. Carbon-based nanomaterials, like graphene and its derivatives (graphene oxide (GO)), (reduced graphene oxide (rGO)), carbon nanotubes (CNTs), and their nanocomposites, have revolutionized the field of sensing due to their extraordinary properties, such as large surface area, easy synthesis, tunable optical properties, and strong compatible adsorption of biomolecules. In SPR based sensors carbon-based nanomaterials have been used to act as a plasmonic layer, as the sensitivity enhancement material, and to provide the large surface area and compatibility for immobilizing various biomolecules, such as enzymes, DNA, antibodies, and antigens, in the design of the sensing layer. In this review, we report the role of carbon-based nanomaterials in SPR-based sensors, their current developments, and challenges.

1. Introduction

Sensors find applications in the monitoring of the environment, health, and food quality, in addition to testing and optimization of the best performance of any technique. Various spectroscopic, piezoelectric, optical, electrical, and chemical techniques have been reported in the literature for the fabrication of sensors. For example, a modified broadband dielectric spectroscopic tool, along with interdigitated electrodes, have been reported for the sensing of organic aerosols for environmental applications [1]. Similarly, a biological sensor has been reported for the sensing of dopamine (a neurotransmitter) using a photo-electrochemical method utilizing a TiO2 nanotube array deposited with a CdSe semiconductor [2]. In recent years, a tremendous amount of work has been reported on plasmonic sensors for the measurements of various physical, chemical, and biological parameters. Plasmonic sensors are the most powerful tools to probe and quantify low molecular analytes at low concentration levels due to their label free detection methodology, ease of operation, and high sensitivity. They have detection applications in various areas, ranging from security, environmental monitoring, food safety, pharmaceutics, and biosensing [3,4,5,6,7]. The growing research field of these sensors is now concentrated on the improvement of sensitivity and detection limit, pertaining, especially, to low concentration analytes in biological systems. The use of nanomaterials has brought considerable improvement in the order of sensitivity of plasmonic sensors [8,9]. To realize these plasmonic sensors, different types of materials have been used for their fabrication. The choice of material decides the performance of the sensor. In recent years, carbon-based nanomaterials have attracted the attention of the scientific community for the fabrication of plasmonic-based sensors. This is because of their unique electrical, mechanical, chemical, thermal, and optical properties. The present review is focused on carbon-based nanomaterials (CBNs) for their applications in plasmonic sensors.

1.1. Plasmonics

It is known that the phenomenon of oscillations plays a crucial role in the universe and is found in almost every object. The oscillations of electrons are responsible for all the interesting phenomenon in electromagnetic theory. In the 19th century, Maxwell theoretically predicted the existence of electromagnetic (EM) waves, which was later experimentally demonstrated by Hertz. In 1902, Woods reported the uneven distribution of light in a diffraction grating spectrum, known as Wood’s anomalies [10]. In 1928, Langmuir studied oscillations in ionized gas [11]. Later, Pines and Bohm stated that the energy losses experienced by fast electrons in passing through foils are due to the excitation of plasmons with the resonance frequency in bulk plasma, as [12,13,14,15]:
ω 0 = n e 2 m ε 0
where n, e, and m are the density, charge, and mass of the electron, respectively, while ε0 is the permittivity of the vacuum. In 1957, Ritchie found that anomalous energy loss occurs in a metal thin film [16]. Later, Stern and Ferrell studied plasma oscillations and for the first time, in 1960, introduced the name surface plasmons [17]. Thus, surface plasmons are the coherent oscillations of charges at the surface of plasmonic materials. After a lot of research, it was found that the plasmons can be excited by various quantized energies, such as photons, phonons, and electrons. The coupling between the surface plasmons and photons is named surface plasmon polaritons. The solution of Maxwell’s equations for a metal/dielectric interface under appropriate boundary conditions gives the following dispersion relationship of surface plasmons [18,19,20]:
k s p = k 0 ε m ε d ε m + ε d
where εm and εd are the dielectric constants of metal and dielectric and k0 is the wave vector of light in free space. Figure 1 shows the dispersion plots of surface plasmons and direct light. It may be noted from these plots that the surface plasmons dispersion curve never intersects the dispersion curve of direct light. This implies that no phase matching or momentum matching is possible between these two wave vectors and, therefore, the surface plasmons cannot be excited by direct light. For the excitation of surface plasmons an extra momentum is required. This can be achieved by using some special structures, like prism or grating.
In 1968, Otto gave a prism-based configuration where the excitation of the surface plasmons was achieved by means of an evanescent wave. In this configuration, a high index prism is kept near a metal surface, as shown in Figure 2a. The air gap between the prism base and metal surface is maintained in nanometer range. When the light incident on the base of the prism is at an angle higher than the critical angle, the total internal reflection takes place and an evanescent wave is generated at the interface of prism and air. The evanescent wave excites the surface plasmons at the interface of air and metal. In Figure 1, it can be seen that the dispersion curve of the evanescent wave intersects the dispersion curve of the surface plasmons and, at the point of intersection, the wave vector of the evanescent wave matches with the wave vector of the surface plasmon wave, resulting in the excitation of the surface plasmons. This is called surface plasmon resonance. The resonance occurs at a particular angle, called the resonance angle. At the resonance angle the reflected light intensity shows a minimum value. The maintenance of the finite gap between the base of the prism and metal layer requires a sophisticated and bulky setup. To avoid this, Kretschman and Reather modified the Otto configuration. In this configuration, a thin metal film is coated over the base of the prism and placed in contact with the dielectric medium, as shown in Figure 2b [21].
The resonance condition of surface plasmons is highly susceptible to change in the dielectric constant of the medium adjacent to the metal layer. This fact has been extensively utilised for the design of highly sensitive plasmonic sensors. They are broadly classified as propagating surface plasmon resonance (SPR) sensors or localized SPR sensors, depending on the utilization of thin film or nanomaterials of metals [18,19].

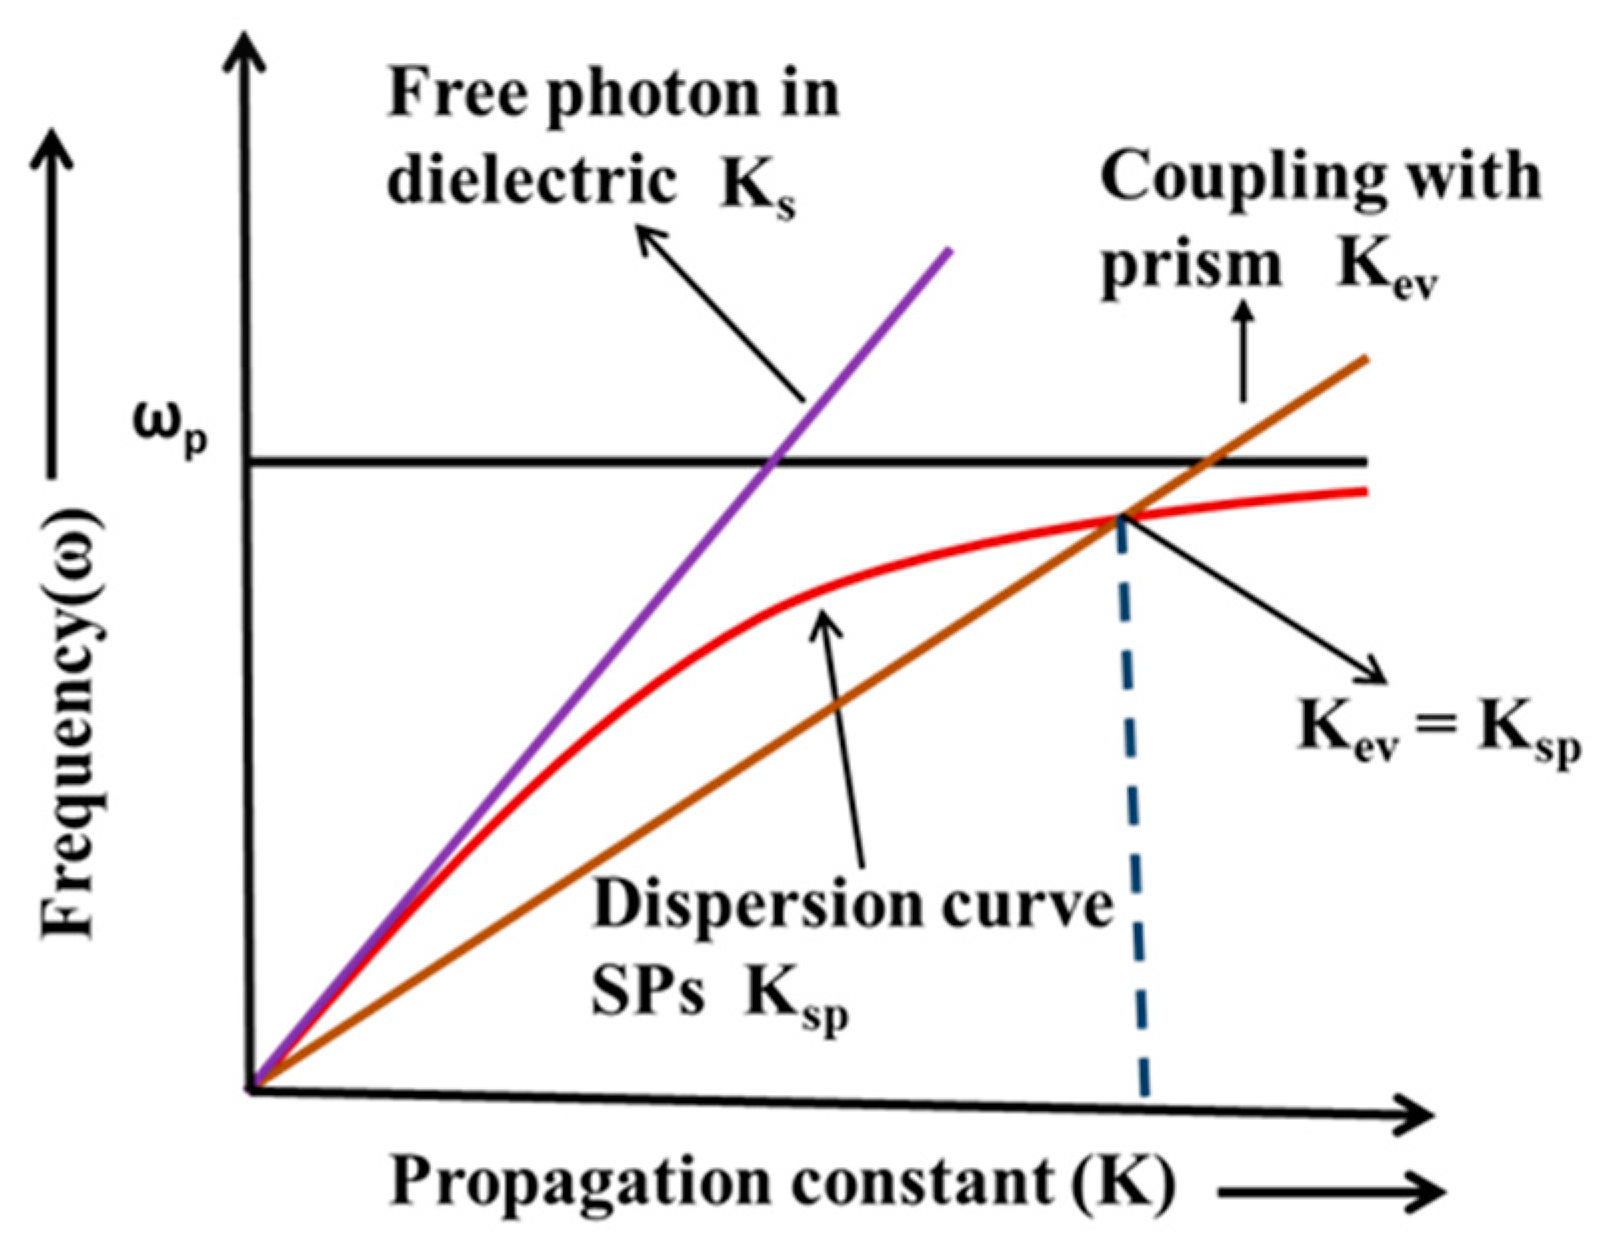
Kretschmann–Reather Configuration in Optical Fiber

The prism-based Kretschmann configuration requires some sophisticated instrumentation and is also bulky in size. For the compact design, the prism is replaced by the core of an optical fiber. The light inside the optical fiber is guided through the total internal reflection and the field of the evanescent wave generated decays exponentially in the cladding region. The principle for the excitation of surface plasmons is the same as in the prism-based configuration. In the case of optical fiber, cladding is removed from a small part of the fiber and the unclad core is coated with a thin metal layer. The incident light from the polychromatic source is launched from one end of the fiber and the transmitted spectrum is recorded at the other end of the fiber. A sharp dip in the spectrum is obtained at a particular wavelength, called the resonance wavelength, depending on the refractive index of the dielectric medium in contact of the metal layer [18].

1.2. Carbon Nanomaterials for Plasmonic Sensors

The advancement in nanotechnology during the last decade has renewed interest in every area of science and technology. The nanotechnology-enabled restructuring of existing materials at the nano-dimension has been exploited for the development of new novel materials. As mentioned in the beginning, amongst various types of nanomaterials, carbon-based nanomaterials (CBNs) have attracted significant attention from the scientific community due to their unique electrical, mechanical, chemical, thermal, and optical properties [22,23,24,25]. Carbon, with the atomic number 6, can be hybridized in sp, sp2, and sp3 states, providing various allotropes such as graphite, amorphous carbon, and diamonds, along with the newly developed superior materials like graphene, carbon nanotubes, fullerenes, and quantum dots. Graphite is the oldest and most widely available form of carbon materials, which can be given various forms with the continuously developing field of nanoscience and technology. The structural confirmation and hybridization state of carbon determine its various chemical, physical, and electronic properties in different carbonaceous materials. The basic structure in the newly developed forms of carbon is the sp2 bonded carbon atoms layer, i.e., each carbon atom is bonded to three other carbon atoms in same plane and a weakly delocalized π e- cloud in the perpendicular plane. This configuration is responsible for the exceptional electrical conductivity, enhanced charge transfer capability, and π-plasmon resonances in these materials. The exceptional properties of these materials have embraced the technological developments in various areas, like high tensile strength materials, catalysis, electronics and communications, biomedical applications, and sensing. The biomedical field extensively utilizes CBNs for drug delivery, therapeutics and biosensing due to their inherently favorable properties [26].
Amongst various carbonaceous materials, graphene and carbon nanotubes are the most widely utilized CBNs for general sensing applications. Their unique optical properties, high conductivity, which facilitates fast charge transfer reactions, high surface to volume ratio, enabling an enhancement in sensitivity, the ease of functionalization with various biomolecules and polymers for ensuring selectivity in different scenarios, chemical stability, and biocompatibility make them ideal candidates for sensing applications. Various health or biomedical, environmental, and food testing systems are reported to have utilized CBNs over the years [27,28]. There are numerous reports where graphene has been used as/for biosensing material, environmental analysis, and food quality assurance [29,30,31,32,33]. Similarly, carbon nanotubes have been extensively reviewed as an excellent material for biomedical diagnosis, the detection of many harmful environmental gases, and checking of food adulteration [34,35,36,37]. Many other carbon allotropes, such as carbon nanoparticles, carbon nanofibers, and quantum dots, are also utilized, based on various operational parameters as per the sensing application [28,29,38]. Substantial literature is available on the operational characteristics of other carbon allotropes, and therefore is not included in the present review. The present article will be focusing on carbon nanotubes and graphene-based plasmonic sensors.
CBNs, such as graphene and carbon nanotubes, are extensively used, particularly for plasmonic sensors. Thus, this review focuses on the exploitation of properties of carbon-based nanomaterials in plasmonic-based sensors [39,40,41]. Conventional noble metals, such as gold (Au), silver (Ag), copper (Cu), chromium (Cr), and aluminium (Al), are extensively used, and have for a long time been regarded as the best plasmonic materials in the fields of nanophotonics, metamaterials, and sensing. However, these materials have some shortcomings, such as large energy losses (e.g., Ohmic loss and radiative loss) and limited tunability [42,43]. Due to these shortcomings, there is a continuous surge of new materials for plasmonic applications, which have low loss, good tunability, and provide improvement in sensitivity for sensing. CBNs have emerged as the new choice of plasmonic materials, with the fulfilment of all the above properties along, with remarkable sensing properties in all types of sensor applications. In this review, the focus is mainly on graphene (and its derivatives) and carbon nanotubes for their applications in plasmonic sensors [44,45,46].
Graphene is a one carbon atom thick layer with a hexagonal honeycomb structure. Recently, graphene has emerged as an alternate plasmonic material in the terahertz (THz) to the mid-infrared range. The area of graphene plasmonics is very interesting, but there is a large mismatch between the graphene plasmons wavevector and free space light wavevector, therefore, the detection of graphene plasmons remains a challenge [47,48]. The first study of graphene plasmon resonance was based on electron spectroscopies. The electron in graphene behaves like a massless Dirac fermions, due to which it shows extraordinary properties, such as ultra-high-mobility carriers, gate-tunable carrier densities, fine structure constant defined optical transmission, long mean free path, and quantum Hall effect [49]. The confinement of the surface plasmons in the graphene is much stronger than in conventional noble metals [50]. Therefore, graphene plasmons have been used in biosensor, terahertz detector, terahertz emitter, plasmonic metamaterial, and terahertz optoelectronics. The advantages of graphene plasmons over conventional noble metals plasmons are that they have relatively low loss, high confinement, and tunability. All these advantages make graphene plasmons promising materials for the future [51,52,53,54].
Another interesting carbon nanomaterial is the 1D form of rolled graphene sheets, i.e., carbon nanotubes. Carbon nanotubes (CNTs) were discovered by Iijima in 1991, and since then they have emerged as the most extensively utilized nanomaterials in various research areas due to their unique properties. CNTs are graphene sheets rolled into a cylindrical structure, which are classified as single walled carbon nanotubes (SWCNTs) and multi-walled carbon nanotubes (MWCNTs), depending on the number of rolled graphene sheets. Their properties are highly influenced by their atomic structure (chirality), size, and morphological arrangement. They have remarkable mechanical strength, extremely high electrical and thermal conductivity, exceptional physical and chemical properties, ultrafast charge transfer properties, and distinct optical response in the whole EM spectrum [55]. The intrinsic relationship between their electrical, mechanical, and optical properties make them ideal for future nanoscale sensors [56]. The ultrafast charge transfer reactions and the possibility of their surface functionalization in numerous ways have made CNTs an ideal candidate for the designing of specific sensors for a plethora of applications, along with the plasmonic properties endowed by the graphitic structure [40,45,57,58]. There are numerous reports on the study of optical and plasmonic properties of carbon nanotubes, but their direct use as plasmonic material for sensing is limited due to the excitation regime in the UV or IR region.
In plasmonic sensors, either the surface plasmon phenomenon itself is employed for sensing, or it contributes towards the enhancement of other spectroscopic methods, like surface enhanced Raman spectroscopy (SERS) and surface plasmon enhanced fluorescence [52,59,60,61,62,63,64]. Carbon nanomaterials have long been known for the enhancement of surface plasmons in several of these phenomena, however, in this review the attention is on SPR-based sensors. The role played by CBNs is basically divided in three categories for SPR sensors—plasmonic materials, sensitivity enhancement material of plasmonic sensors, and as a sensing matrix for such sensors. They are used as plasmonic materials because they are a superior substitute for noble metals, which suffer from some shortcomings, such as high ohmic losses, less tunability, and chemical instability in harsh environments. CBNs fulfill these limitations of noble metals, along with their high refractive index, which renders them with highly sensitive plasmonic properties. Due to their high refractive index, conductivity, and high surface to volume ratio, they are also utilised with noble metals for sensitivity enhancement tags in plasmonic sensors. Furthermore, their ability of numerous surface functionalization with various biomolecules, polymers, and other nanomaterials make them ideal candidates for sensing matrix in plasmonic sensors.

2. Synthesis of Carbon Nanomaterials

2.1. Graphene and Its Derivatives

Although few-layer graphite was synthesized around 1958, the first graphene monolayer film was prepared by Novoselov, Geim, and co-workers in 2004 by mechanical exfoliation of the highly oriented pyrolytic graphite. In this technique, graphite crystal is repeatedly peeled with adhesive tape until the monolayer is found [51]. Now, many techniques and methods, like chemical vapor deposition (CVD), thermal reduction, and chemical, have been developed for this. The most popular method for the preparation of the graphene oxide (GO) and reduced graphene oxide (rGO) was reported in 1958 by Hummers, in which graphite was oxidized by KMnO4 and NaNO3 in the presence of concentrated H2SO4. Later, various modifications were made by the researchers of the Hummers method, and now it is known as the modified Hummers method. GO nanosheets are the oxidized form of graphene and can be reduced by various methods [65,66].
In the CVD method, the substrate is exposed to one or more precursors, with certain conditions, such as temperature and pressure, and the precursor reacts with the substrate and deposits the desired film over the substrate. Various transition-metal substrates, like Ni, Cu, Pd, and Ru, have been used for the preparation of graphene by the CVD process [67,68,69,70]. In most of the CVD growth of graphene, Ni and Cu substrates have been used. Methane gas at 900 °C exposed over Ni forms thin graphite [71]. In 2006, the first experiment to prepare graphene via the CVD method was performed, in which the precursor camphor was used on Ni foil [72]. Nowadays, various hydrocarbons, such as methane, benzene, ethylene, and acetylene, are decomposed on various transition metals substrates, such as Ni, Cu, Au, Co, and Ru, for the preparation of graphene [69].

2.2. Carbon Nanotubes

Three main commercially recognized production techniques for CNTs are arc discharge, laser ablation, and chemical vapor deposition (CVD) [55,73]. The arc discharge method takes place at low pressure (30–150 torr), where two high purity graphite electrodes (diameter 6–12 mm) separated by 1–2 mm are utilized as carbon sources in a chamber generally filled with helium (hydrogen and methane atmospheres are also used). The anode is sometimes mixed with metals such as Fe, Y, Mo, Co, and Ni to produce variable nature CNTs, such as graphitic, SWCNTs, metal filled CNTs, and metal nanoparticles decorated CNTs. A direct current is passed through the chamber to produce arching, where the temperature reaches up to 4000 K. Under these conditions, carbon sublimes from the anode solidify on the cathode, where a soot is formed at a typical rate of 1 mm/min. The cathode soot, chamber soot, and inner core generally consist of single and multi-walled carbon nanotubes, depending on the use of a catalyst in the anode or pure anode. Various parameters, such as reaction environment, gas pressure inside the chamber, and the type of arc discharge, control the properties of synthesized tubes. The arc discharge method is good for the large-scale production of CNTs, however it provides a very little control over its chirality [55]. The second method employed for the synthesis of CNTs is laser ablation, which can be divided into classical laser ablation and ultrafast laser ablation. Here, a metal-graphite composite rod is placed in a high temperature furnace and scanned through a high-power laser. The soot produced due to target vaporization by the laser is swept by Ar gas in the chamber and is deposited on a cooled copper target outside the furnace. The properties of the produced tubes are governed by target compositional ratio, furnace temperature, the nature of ambient gas in the furnace, and laser parameters. Laser ablation produces high purity and better graphitized CNTs than the arc discharge method, however, the mass production is limited in this technique [55]. The most important and standard method for the large-scale production of high purity carbon nanotubes is the chemical vapor deposition (CVD) method. Various modifications have been made in the standard CVD technique to produce CNTs with desired properties, such as catalytic CVD (CCVD), plasma enhanced CVD, microwave plasma assisted CVD, water assisted CVD, and radio frequency CVD. CCVD is the most extensively utilized method for the production of CNTs. Here, a catalyst is placed in a quartz boat, typically, in a horizontal flow furnace at atmospheric pressure. The reaction mixture, consisting of a hydrocarbon and an inert gas, is passed over the bed of the catalyst at temperatures ranging from 500–1100 °C. The CNT growth in such a procedure involves the dissociation of hydrocarbon in the presence of transition metal catalysts and the saturation of carbon atoms in metal particles in an sp2 structure in a tubular carbon state. The properties depend on various parameters, like temperature, pressure, type and concentration of hydrocarbons and metal catalysts, and the reaction time [73]. Some other less popular methods also employed for the production of CNTs involve the hydrothermal method and electrolysis.

3. Carbon Nanomaterials-Based Plasmonic Sensors

In plasmonic sensors, carbon nanomaterials have been used (i) to act as a plasmonic material, (ii) as the sensitivity enhancement material, and (iii) as a sensing matrix. We shall discuss, below, all the three major roles one by one.

3.1. Carbon Nanomaterial as Plasmonic Material

3.1.1. Graphene

Recently, a graphene-based plasmonic refractive index sensor has been theoretically investigated. The sensor works in the mid-infrared region at room temperature and graphene plasmon frequency shifts for a small change in the refractive index around the graphene sheet have been observed. The resonance wavelength was found to increase with an increasing refractive index of the medium around the graphene [74]. The sensor possesses a sensitivity of 2.5 µm/RIU, which means the resonance wavelength shifts by 2.5 µm for every unit change in refractive index. Here, RIU means refractive index unit. The figure of merit (FOM) of the sensor was reported to be around 10.7. Similar to this, various graphene-based plasmonic sensors have been reported in the literature for different applications [5,74].

3.1.2. Carbon Nanotubes

Carbon nanotubes have also been explored as plasmonic materials for sensing in numerous applications. In a localized surface plasmon resonance (LSPR)based gas sensor, CNTs are utilized as plasmons, as well as an affinity material for the detection of carbon dioxide (CO2) gas [75]. CNTs are believed to show a change in their electrical properties, which alters their optical properties upon chemical interaction with CO2. This property is exploited to fabricate an optical fiber Bragg grating-based LSPR sensor. The authors successfully showed a sensitive response with the observation of a direct change in optical response of CNTs upon chemical interaction with a molecule. A refractive index sensitivity (Δλ/Δn) of 6200 nm/RIU in the gaseous regime was observed, which contributes to a detection limit of 150 ppm at atmospheric pressure, making the approach highly suitable for practical CO2 sensor application. The response of the probe was tested for other similar hydrocarbon gases, such as methane and ethane, for the specificity of the approach and the results were found to be highly satisfactory, with a change in SPR response only in the case of CO2 [75].
In another approach, the π plasmon absorption of carbon-based nanomaterials in the UV-region was utilized for SWCNTs for a sensitive and selective binding of ions [76]. It was observed that the strong π plasmon absorption of SWCNTs in the UV region is far more sensitive to plasmonic properties in visible and NIR regimes. The method, based on UV-Vis absorption, was found to be simple and effective as compared to previously reported field effect transistor (FETs) and fluorescence-based methods, which require complex device fabrication, NIR source, and the separation of semiconducting and metallic CNTs. It was also found to be highly specific for the detection of metal ions by tailoring the surface modification of CNTs through molecular legends specific to ion attachment. The model was tested to detect Fe3+ ions in an approach based on the surface modification of SWCNTs by a natural bacterial siderophore, Deferoxamine (DFO), for the specific attachment.
The CNT surfaces were first modified with carboxyl terminated phospholipid-polyethylene glycol (PL-PEG-COOHs) for stable aqueous dispersions and further attachment of siderophore. These PL-PEG-COOHs modified CNTs show two absorption peaks in the UV region, at 246 and 275 nm, due to the π-plasmon absorption by the graphitic structure, as shown in Figure 3. The detection limit reaches the pM range, with the sensing mechanism based on the charge transfer between Fe-DFO complex and SWNTs, as obtained from resonant Raman scattering study. The UV-Vis sensing results are shown in Figure 4. The testing was performed in aqueous and rain water samples, with a specific response towards Fe3+ ions, as tested in an interfering environment from other ions, such as Al3+, Zn2+, Ni2+, and Cu2+ (Figure 4D).

3.2. As Sensitivity Enhancement Material

Carbon-based nanomaterials, specifically graphene and carbon nanotubes, are widely known to be sensitivity enhancement materials for plasmonic sensors [77,78]. Therefore, they are extensively reported in SERS signal enhancement substrates due to plasmon coupling with metal nanoparticles [61,63]. However, we have constrained ourselves here to discussing only the SPR-based biosensors for sensitivity enhancement due to these carbonaceous materials.

3.2.1. Graphene and Its derivatives

In recent years, a number of plasmonic sensors have been proposed using graphene and its derivatives, with plasmonic metal layers for the purpose of sensitivity enhancement. A theoretical study of surface plasmon resonance-based biomolecules sensors using a graphene layer has also been reported. In this study, the graphene layer was used over the gold and silicon layer to enhance the sensitivity of the sensor [77]. The schematic of a prism-based SPR sensor is shown in Figure 5. The sensor model consisted of coatings of gold, silicon, graphene, and biomolecule layers over the base of the prism. The gold was used as a plasmonic layer, while the silicon and graphene layers were used for sensitivity enhancement. Apart from sensitivity enhancement, the graphene layer also helps in the enhancement of the immobilization of the biomolecules. The thicknesses of gold, silicon, and graphene layers were optimized via simulation. The best sensitivity of the sensor was achieved for a 40 nm thick gold layer, 7 nm thick silicon layer, and two layers of graphene at 633 nm wavelength of the light source.
Another experimental and theoretical study utilizing graphene layer over the gold layer has been reported for the sensitivity enhancement of an SPR biosensor. In this study, the prism was coated with a 50 nm thick gold layer, followed by coatings of graphene and biomolecules (DNA) layers [79]. The layer configuration is shown in Figure 6a. For the simulation of a graphene-based SPR sensor, an N-layer model was used and the results were compared with the experiments. In the simulations, the complex refractive index of the graphene (n) was taken as:
n = 3 + i c 3 λ
where λ is the wavelength of light and c is a constant. The thickness of a single graphene was taken as 0.34 nm.
Figure 6b shows the percentage of transmitted light with the number of graphene layers. From this graph, it is clear that the light transmitted through the monolayer graphene is around 97.7% and the transmittance decreases with the increasing graphene thickness. The experimental data shows good agreement with simulated data. Figure 7a shows the surface plasmon resonance curve for the conventional biosensor and monolayer graphene biosensor. From the figure, it is clear that the SPR angle shifts more in the case of the monolayer graphene biosensor. Figure 7b shows the sensitivity enhancement with the number of graphene layers.
The improvement in sensitivity was due to two reasons. First, the graphene strongly absorbs the biomolecules with a carbon-based ring structure, which enhances the absorption efficiency of the biomolecules, and second, the optical properties of the graphene modify the SPR curves and provide a large shift for the refractive index change. In summary, this study shows that a graphene-based biosensor enhances the sensitivity 2.5 times in comparison to a conventional biosensor.
An experimental study on the enhancement of sensitivity of an SPR-based sensor using graphene oxide and biomolecules attachments has also been reported. In this study, the sensitivity of an SPR-based photonic crystal fiber (PCF) refractive index sensor was compared with an immunosensor with and without a graphene oxide layer. The probe was designed by splicing the PCF fiber between the two multimode fibers [80]. To fabricate the sensor, the 5 mm sensing length of the PCF fiber was first coated with a 5 nm thin chrome layer and then with a 50 nm thin film of gold. After this, an over-layer of graphene oxide was deposited over the gold layer through various steps, as shown in the Figure 8a–d. For the immunosensor, the staphylococcal protein A (SPA) was attached over the GO surface, as shown in Figure 8e–g.
The SPR spectra for the gold coated PCF fiber (Au-PCF) and gold and graphene oxide coated PCF fiber (Au/GO-PCF) are shown in Figure 9a,c, for the refractive index range from 1.33 to 1.37. The shift in the resonance wavelength corresponding to Au-PCF and Au/GO-PCF sensors for the change in the refractive index are shown in Figure 9b,d.
The change in the resonance wavelength for the Au-PCF and Au/GO-PCF sensors were reported to be 114 nm and 181 nm for the refractive index range from 1.33 to 1.37, respectively. For the case of the Au-PCF and Au/GO-PCF sensors, the values of sensitivity obtained were 2761.7 nm/RIU and 4649.8 nm/RIU, respectively. Here, the graphene oxide film enhances the interaction between the Au film and analyte which increases the refractive index sensitivity.
For the SPR immunosensor, the attachment steps of SPA are represented in Figure 10. Figure 10 shows the wavelength shift curve of anti-human IgG immobilized on the Au/GO-SPA and Au-SPA sensor. When the IgG sample comes in contact with the sensor surface, the refractive index changes and a red shift is observed. The change in the resonance wavelength for the Au-SPA sensor is around 7.4 nm, while for the Au/GO-SPA sensor it is 15.2 nm. This enhancement shows that due to the large surface area and biocompatibility, GO allows for more immobilization of the antibody than the gold surface, which leads to the larger resonance wavelength shift. This study shows that GO has a great potential in sensitivity enhancement for SPR-based refractive index sensors or biosensors.
In another study, an SPR-based fiber optic cholesterol sensor with three different approaches was discussed [81]. In this study, three different types of probes were fabricated, as shown in Figure 11. In probe I, the gel entrapment method was used for the detection of cholesterol, while in probe II, the enzyme cholesterol oxidase (Chox) was immobilized over the graphene oxide nanosheets, and in probe III, polyvinyl alcohol (PVA) embedded silver nanoparticles were decorated over the GO nanosheets. For the synthesis of GO, the modified Hummer’s method was used. In probe I, the probe was fabricated by coating a thin silver layer over the core of an optical fiber, followed by the enzyme entrapped hydrogel. Probe II consisted of a GO layer over the silver coated unclad core of the fiber, and a Chox enzyme was immobilized over it. Finally, probe III consisted of layers of silver and GO over the core of an optical fiber, followed by layers of PVA embedded silver nanoparticles and enzyme Chox. The SPR curves for probe I for a cholesterol concentration range of 0 to 10 mM shifted by around 18 nm, which gave 1.789 nm/mM as the sensitivity of the sensor. The reason behind the shift in resonance wavelength is that when the cholesterol sample interacts with the cholesterol oxidase, the enzymatic reaction takes place and it gets converted into Cholest-4en-3-one and hydrogen peroxide. Due to this enzymatic reaction, the effective refractive index of the sensing layer changes, which results in the shift in resonance wavelength. For probe II, the total shift in the resonance wavelength was around 32 nm, which was greater than that in the case of probe I. In probe II, GO provided a large surface area, and therefore the available surface area for the enzyme was increased and the shift in resonance wavelength was increased.
Apart from their large surface area, GO nanosheets have various oxygen functional groups, such as -OH, -COOH, which help to bind the enzyme. The total shift in resonance wavelength and sensitivity for probe III were around 50 nm and 5.06 nm/mM, respectively, which were the maximums among all three probes. In probe III, the shift was due to an enzymatic reaction, as well as the silver nanoparticles, which decompose the hydrogen peroxide, due to which the effective refractive index changes more in comparison to the probe I and II, which results in the maximum shift and sensitivity. From all three probe configurations, it was concluded that GO enhances the sensitivity of the biosensor.

3.2.2. Carbon Nanotubes

Carbon nanotubes have also been used to enhance the sensitivity of a biosensor. In a sensitivity enhancement approach, a CNT-antibody conjugate was employed to amplify the SPR signal for a biosensing platform [82]. Human erythropoietin (EPO) and human granulocyte macrophage colony-stimulating factor (GM–CSF) were tested as model systems to see the role of CNTs in the enhancement of SPR signal. Biocompatibility, fast electron transfer, and large molecular mass were reported to be key factors for sensitivity enhancement for the detection of very low levels of EPO and GM-CSF in real systems. All SPR measurements were performed on the commercially available BIAcore X SPR biosensor system (GE Healthcare, Sweden) at a flow rate of 5 µl/min, at 25 °C. Gold chips were modified with a self-assembled monolayer of 11-mercaptoundecanoic acid (MUA) and then activated by ethyl (dimethylaminopropyl) carbodiimide /N-hydroxysuccinimide (EDC/NHS) chemistry for the capture of respective antibodies. A schematic of the detailed mechanisms of CNT assisted and without CNTs SPR detection is shown in Figure 12.
The enhancement in SPR signal with the CNT assisted approach can be seen in Figure 13, through the real-time SPR response and the SPR angle shift in the case of direct and CNT assisted detection. The CNT-based amplification method was reported to be sensitive for a wide dynamic range, from 0.1 to 1000 ng/mL, with the detection limit reaching 0.1 ng/mL, enabling its application in real scenarios.
In a similar approach, a photonic crystal fiber (PCF)-based SPR sensor was reported with enhanced refractive index sensitivity, due to CNTs deposited on the Au and Ag film as compared to a bare Ag/Au thin film [83]. The sensitivity of the CNT-Au film PCF SPR sensor was reported to increase by 1016 nm/RIU as compared to the conventional Au film PCF SPR sensor, whereas the sensitivity of the CNT-Ag film PCF SPR sensor increased by 709 nm/RIU compared to the Ag film SPR sensors. The experimental results were found to be in accordance with simulated data for such sensors, clarifying the role of CNTs in the sensitivity enhancement of SPR sensors. The results are shown in Figure 14.
A gold nanoparticle-decorated CNTs platform was developed recently for the LSPR based sensing of bovine growth hormone [84]. Due to the high surface to volume ratio and favorable electron transfer reactions, CNTs were augmented with Au nanoparticles to provide synergistic effects to LSPR sensing. The properties of the unique nanocomposite were explored to absorb and sense the biomolecular interaction with increased sensitivity, as compared to individual material. A concentration as low as 1 ng/mL of rbST was detected with the composite based LSPR platform, providing a new window for ultrasensitive plasmonic detection of polypeptides and proteins.

3.3. As sensing Matrix Material

3.3.1. Graphene and Its Derivatives

In recent years graphene, GO, reduced graphene oxide (rGO), and their nanocomposites have been extensively exploited for various biosensors, gas sensors, and chemical sensors. Graphene and its nanocomposites act as a sensing layer in various sensors, including plasmonic sensors. Since the plasmonic sensors are very sensitive to the change in the refractive index of the surrounding medium, if there is a possibility of an interaction between graphene and analyte there will be a possibility of its sensing. In such a case, one can develop a sensor using graphene and its nanocomposites. Based on this approach, a pH sensor was reported utilizing rGO and polyaniline (PANI) as sensing layers [85]. As is known, pH is a very important parameter and it plays a vital role in biological processes, drinking water, environment, food quality control, biochemistry, and chemical reactions. The study has utilized surface plasmon resonance on optical fibers. The rGO-Pani nanocomposite was prepared by an in situ method. Figure 15a shows the scanning electron microscope (SEM) image of Pani, in which the chain-like porous structure of Pani can be seen. Figure 15b represents the transmission electron microscope (TEM) image of rGO which depicts a very thin sheet of rGO. Figure 15c shows the SEM image of the rGO-Pani nanocomposite and Figure 15d shows the TEM image of the rGO-Pani nanocomposite. In this figure, the lighter portion in the image represents the rGO nanosheets and the darker part represents Pani.
The design of the sensor probe is shown in Figure 16. The unclad core of an optical fiber, in the middle, was coated with a thin silver film by the thermal evaporation method, over which another coating of rGO-Pani was done by the dip coating method.
Figure 17a shows the SPR spectra for the acidic region from pH 7 to pH 2.4. As one moves towards the acidic region from pH 7, a red shift is observed in resonance wavelength. The reason behind the red shift is the chemical interaction between the rGO-Pani nanocomposite with the acidic pH samples. When an acidic sample comes into contact with polyaniline, the emeraldine form of Pani changes to pernigraniline base through an oxidation process, which changes the refractive index of Pani. Since an acidic sample has an excess of H+ ions, when it comes in contact with rGO nanosheets, the rGO nanosheets get converted to the n-doped material, which alters the band gap of the rGO nanosheets. Thus, both the materials in the nanocomposite are sensitive to the acidic sample and, therefore, the change in the effective refractive index of the nanocomposite is the result of change in both the materials, and hence one obtains a cumulative effect on the red shift in resonance wavelength. The sensitivity of the sensor is defined as the change in resonance wavelength per unit of change in the pH of the sample. For the acidic range, the maximum sensitivity of the sensor was found to be 24.93 nm/pH, which means the resonance wavelength shifts around 24.93 nm, when the pH of the sample is changed by unity. As reported, the exponential nature of the sensitivity plot is due to the H+ ions, which increase exponentially with the decrease in pH of the sample.
Figure 17b shows the SPR curves corresponding to the basic region from 7 pH to 11.35, and in this case also a red shift in the resonance wavelength was observed with the increase in pH of the sample (increase in alkanity). Again, the reason for the red shift is the interaction between the pH sample and rGO-Pani nanocompoite. The emeraldine form of Pani changes to a leucoemeraldine base after the interaction with the basic sample through the reduction process. The samples with pH from 7 to 11 have an excess of OH ions. The rGO nanosheets get converted to p-doped material via OH ions. Therefore, the overall band gap of the nanocomposite changes, which results in a change in the effective refractive index of the sensing layer. The maximum sensitivity was found to be around 75.09 nm/pH at the pH value 11.35. In this study, the behavior of rGO nanosheets changed when they came in contact with acidic/basic samples, resulting in a change in the effective refractive index. Thus, rGO nanosheets act as a sensing matrix for the measurement of the pH.

3.3.2. Carbon Nanotubes

The last way of utilizing CNTs in plasmonic sensors is as sensing material. The ease and variety of possible functionalization on CNTs side walls and edges make them suitable for the sensing of various species [86,87,88,89]. A 2,4,6-trinitrotoluene (TNT) SPR sensor was reported, with peptide modified SWCNTs as sensing material over Au-coated SPR chips. The standard gold coated chips were firstly modified with APTES (3-aminopropyltriethoxysilane) to generate amine groups for the attachment of carboxyl terminated CNTs [90]. After this, TNTHCDR3 peptide was immobilized non-covalently on CNTs through a π-π interaction. The SPR measurements were carried out on a standard Biacore system. TNT samples were tested for a wide dynamic concentration range, from 0.8 ppm to 100 ppm. The real-time SPR response of peptide modified SWCNTs based SPR sensors for various concentrations of TNTs is shown in Figure 18a. The response was compared with a conventional dextran chip (CM7) and it was revealed that CNTs offer promising properties for the detection of low molecular weight analytes at low concentration levels in SPR sensors, with a significantly improved response (Figure 18b,c). The response of the CNT modified chip is shown in Figure 18d for various concentrations of TNT. The specificity of the chip was tested for various analytes, which can interfere or are analogous to TNTs, such as DNP-glycine, 2,6-DNT, RDX, and 4-nitrobenzoyl-glycyl-glycine, showing a negligible response from all the other analytes (Figure 18e). The stability and reversibility of surface reactions on CNTs and the chemical stability of the gold chip are visible through the stable response of the sensor over 20–30 days (Figure 18f).
In another study, an optical fiber-based SPR sensor was reported, where MWCNTs were utilized as sensing material for the detection of sulfamethaxazole (SMX), opening the potential sensing applications of CNTs in pharmaceuticals [91]. The response of the sensor was compared with a similar approach based on enzyme entrapped gel as a sensing layer for a 0 to 200 µM concentration range of SMX. The CNT-based platform offers an improved sensitivity over the desired concentration range, along with long time stability and cost effectiveness as compared to the enzymatic approach. The CNT-based probes were prepared by depositing Ag thin film on the fiber core surface, functionalizing the Ag surface with APTES, and then attaching carboxylic acid functionalized CNTs on amino group-modified fiber substrate. The other enzyme-based probes were also prepared by the coating of polyacrylamide gel entrapped with tyrosinase enzyme for the sensing of SMX. The interaction mechanism governing the SPR response due to physicochemical interaction of SMX with CNTs and tyrosinase is shown in Figure 19.
The detection limit improved from 1.137 μM in the case of the enzyme entrapped gel as a sensing layer to 0.8918 μM in the non-enzymatic CNT-based approach. The corresponding response in the two cases, with sensitivity variation along with the desired concentration range, is shown in Figure 20. The maximum sensitivity at the lowest concentration also increased from 0.29 nm/μM for the enzyme-based platform to 0.37 nm/μM for CNTs as sensing material.
In another biosensor development, CNTs are employed as a matrix for the molecular imprinting (MIP) of dopamine (DA), providing a generic platform for the sensing of neurotransmitters [92]. The MIP on the surface of CNTs encompasses the advantages of high sensitivity and selectivity due to the easy removal and uptake of the analyte during sensing, large surface to volume ratio providing increased sensing hotspots, and a stable composite with imprinting conducting polymer (polypyrrole; PPy) due to binding in a de-localized π-electron cloud of CNTs and PPy. Polypyrrole/CNTs composites were used in the development of several SPR-based sensors due to their unique conductivity, making them favorable for sensitivity enhancement of SPR sensors [86,87]. A permselective nafion membrane was also employed over an MIP layer to minimize the cross-signaling from interfering anions, such as ascorbic acid and uric acid. The morphological characterization of the nanocomposite was confirmed through SEM and TEM images, as shown in Figure 21a–d. The removal of DA for the formation of imprinted sites in MIP layer over MWCNTs was confirmed by UV-Vis spectroscopy, as shown in Figure 21e.
The SPR response was recorded after optimizing various probe parameters for 0 to 10−5 M DA concentration in artificial cerebrospinal fluid, as shown in Figure 22a. A red shift of 69 nm was observed for the whole concentration range, with a non-linear response of the resonance wavelength with DA concentration (Figure 22b).
A similar MIP and SPR-based platform was also reported for the sensing of complex structures, like proteins (BSA). The surface imprinting on CNTs provides an improved platform as compared to bulk imprinting methodologies, where the removal of such complex molecules is cumbersome [93]. Moreover, the catalytic properties of MWCNTs/Cu nanoparticles have been employed in a fiber optic SPR sensor for the effective and fast detection of nitrates in real samples, like soil and river water analysis [94]. The sensing methodology was based on the reduction of nitrate ions to ammonium ions by the catalytic properties of copper nanoparticles and the adsorption of ammonium ions on the CNT surface, bringing a change in SPR response for 10−6 M to 5 × 10⁻³ M nitrate concentration.

4. Summary

Carbon-based nanomaterials have attracted the attention of the scientific community for the fabrication of plasmonic-based sensors. This is because of their unique electrical, mechanical, chemical, thermal, and optical properties. The role of carbon-based nanomaterials in SPR-based sensors, their current developments, and challenges have been reviewed in this article. In plasmonic-based sensors, carbon-based nanomaterials play various types of roles, such as plasmonic layers, sensitivity enhancement material, and sensing matrix material. In this review, the roles of graphene and its derivatives and carbon nanotubes in sensors have been discussed.

Author Contributions

Equal contribution of all authors in writing of this article.

Funding

This research received no external funding.

Acknowledgments

Vivek Semwal is grateful to Department of Science and Technology (DST) (India) for research fellowship.

Conflicts of Interest

The authors declare no conflicts of interest.

References

  1. Zhang, Y.; Katira, S.; Lee, A.; Lambe, A.T.; Onasch, T.B.; Xu, W.; Brooks, W.A.; Canagaratna, M.R.; Freedman, A.; Jayne, J.T.; et al. Kinetically controlled glass transition measurement of organic aerosol thin films using broadband dielectric spectroscopy. Atmos. Meas. Tech. 2018, 11, 3479–3490. [Google Scholar] [CrossRef] [Green Version]
  2. Qin, C.; Bai, X.; Zhang, Y.; Gao, K. Photoelectrochemical CdSe/TiO2 nanotube array microsensor for high-resolution in-situ detection of dopamine. Microchim. Acta 2018, 185, 278. [Google Scholar] [CrossRef] [PubMed]
  3. Stewart, M.E.; Anderton, C.R.; Thompson, L.B.; Maria, J.; Gray, S.K.; Rogers, J.A.; Nuzzo, R.G. Nanostructured Plasmonic Sensors. Chem. Rev. 2008, 108, 494–521. [Google Scholar] [CrossRef] [PubMed]
  4. Semwal, V.; Shrivastav, A.M.; Verma, R.; Gupta, B.D. Surface plasmon resonance based fiber optic ethanol sensor using layers of silver/silicon/hydrogel entrapped with ADH/NAD. Sens. Actuators B Chem. 2016, 230, 485–492. [Google Scholar] [CrossRef]
  5. Farmer, D.B.; Avouris, P.; Li, Y.; Heinz, T.F.; Han, S.J. Ultrasensitive plasmonic detection of molecules with graphene. ACS Photonics 2016, 3, 553–557. [Google Scholar] [CrossRef]
  6. Otsuji, T.; Popov, V.; Ryzhii, V. Active graphene plasmonics for terahertz device applications. J. Phys. D Appl. Phys. 2014, 47, 094006. [Google Scholar] [CrossRef]
  7. Wenger, T.; Viola, G.; Kinaret, J.; Fogelström, M.; Tassin, P. High-sensitivity plasmonic refractive index sensing using graphene. 2D Mater. 2017, 4, 025103. [Google Scholar] [CrossRef] [Green Version]
  8. Zeng, S.; Baillargeat, D.; Hod, H.P.; Yong, K.T. Nanomaterials enhanced surface plasmon resonance for biological and chemical sensing applications. Chem. Soc. Rev. 2014, 43, 3426–3452. [Google Scholar] [CrossRef] [PubMed]
  9. BelBruno, J.J. Nanomaterials in Sensors. Nanomaterials 2013, 3, 572–573. [Google Scholar] [CrossRef] [PubMed]
  10. Wood, R.W. On a remarkable case of uneven distribution of light in a diffraction grating spectrum. Philos. Mag. J. Sci. 1902, 4, 396–402. [Google Scholar] [CrossRef]
  11. Langmuir, I. Oscillations in Ionized Gases. Proc. Natl. Acad. Sci. USA 1928, 14, 627–637. [Google Scholar] [CrossRef] [PubMed] [Green Version]
  12. Bohm, D.; Pines, D. A collective description of electron interactions. I. magnetic interactions. Phys. Rev. 1951, 82, 625–634. [Google Scholar] [CrossRef]
  13. Pines, D.; Bohm, D. A collective description of electron interactions: II. Collective vs individual particle aspects of the interactions. Phys. Rev. 1952, 85, 338–353. [Google Scholar] [CrossRef]
  14. Bohm, D.; Pines, D. A collective description of electron interactions: III. Coulomb interactions in a degenerate electron gas. Phys. Rev. 1953, 92, 609–625. [Google Scholar] [CrossRef]
  15. Pines, D. A Collective Description of Electron Interactions: IV. Electron Interaction in Metals. Phys. Rev. 1953, 92, 626–636. [Google Scholar] [CrossRef]
  16. Ritchie, R.H. Plasma losses by fast electrons in thin films. Phys. Rev. 1957, 106, 874–881. [Google Scholar] [CrossRef]
  17. Stern, E.A.; Ferrell, R.A. Surface plasma oscillations of a degenerate electron gas. Phys. Rev. 1960, 120, 130–136. [Google Scholar] [CrossRef]
  18. Sharma, A.K.; Jha, R.; Gupta, B.D. Fiber-optic sensors based on surface plasmon resonance: A comprehensive review. IEEE Sens. J. 2007, 7, 1118–1128. [Google Scholar] [CrossRef]
  19. Gupta, B.D.; Verma, R.K. Surface plasmon resonance-based fiber optic sensors: Principle, probe designs, and some applications. J. Sens. 2009, 2009, 979761. [Google Scholar] [CrossRef]
  20. Raether, H. Surface Plasmons on Smooth Surfaces; Springer: Berlin, Germany, 1988. [Google Scholar]
  21. Maier, S.A. Plasmonics: Fundamentals and Applications; Springer Science & Business Media: New York, NY, USA, 2007. [Google Scholar]
  22. Cha, C.; Shin, S.R.; Annabi, N.; Dokmeci, M.R.; Khademhosseini, A. Carbon-based nanomaterials: Multifunctional materials for biomedical engineering. ACS Nano 2013, 7, 2891–2897. [Google Scholar] [CrossRef]
  23. Schroeder, V.; Savagatrup, S.; He, M.; Lin, S.; Swager, T.M. Carbon Nanotube Chemical Sensors. Chem. Rev. 2019, 119, 599–663. [Google Scholar] [CrossRef]
  24. Mauter, M.S.; Elimelech, M. Environmental Applications of Carbon-Based Nanomaterials. Environ. Sci. Technol. 2008, 42, 5843–5859. [Google Scholar] [CrossRef]
  25. Scida, K.; Stege, P.W.; Haby, G.; Messina, G.A.; García, C.D. Recent applications of carbon-based nanomaterials in analytical chemistry: Critical review. Anal. Chim. Acta 2011, 691, 6–17. [Google Scholar] [CrossRef] [Green Version]
  26. Maiti, D.; Tong, X.; Mou, X.; Yang, K. Carbon-Based Nanomaterials for Biomedical Applications: A Recent Study. Front. Pharmacol. 2019, 9, 1401. [Google Scholar] [CrossRef]
  27. Llobet, E. Gas sensors using carbon nanomaterials: A review. Sens. Actuators B Chem. 2013, 179, 32–45. [Google Scholar] [CrossRef]
  28. Wang, J.; Lin, Y. Functionalized carbon nanotubes and nanofibers for biosensing applications. TrAC Trends Anal. Chem. 2008, 27, 619–626. [Google Scholar] [CrossRef] [Green Version]
  29. Yang, W.; Ratinac, K.R.; Ringer, S.P.; Thordarson, P.; Gooding, J.J.; Braet, F. Carbon Nanomaterials in Biosensors: Should You Use Nanotubes or Graphene? Angew. Chem. Int. Ed. 2010, 49, 2114–2138. [Google Scholar] [CrossRef]
  30. Pumera, M. Graphene in Biosensing. Materialstoday 2011, 14, 308–315. [Google Scholar] [CrossRef]
  31. Georgakilas, V.; Tiwari, J.N.; Kemp, K.C.; Perman, J.A.; Bourlinos, A.B.; Kim, K.S.; Zboril, R. Noncovalent Functionalization of Graphene and Graphene Oxide for Energy Materials, Biosensing, Catalytic, and Biomedical Applications. Chem. Rev. 2016, 116, 5464–5519. [Google Scholar] [CrossRef] [Green Version]
  32. Chang, H.; Wu, H. Graphene-based nanocomposites: Preparation, functionalization, and energy and environmental applications. Energy Environ. Sci. 2013, 6, 3483–3507. [Google Scholar] [CrossRef]
  33. Sundramoorthy, A.K.; Gunasekaran, S. Applications of graphene in quality assurance and safety of food. TrAC Trends Anal. Chem. 2014, 60, 36–53. [Google Scholar] [CrossRef]
  34. Ping, J.; Wang, Y.; Wu, J.; Ying, Y.; Ji, F. Determination of ascorbic acid levels in food samples by using an ionic liquid–carbon nanotube composite electrode. Food Chem. 2012, 135, 362–367. [Google Scholar] [CrossRef]
  35. Ly, S.Y. Diagnosis of copper ions in vascular tracts using a fluorine-doped carbon nanotube sensor. Talanta 2008, 74, 1635–1641. [Google Scholar] [CrossRef]
  36. Rivasa, G.A.; Rubianes, M.D.; Rodríguez, M.C.; Ferreyra, N.F.; Luquea, G.L.; Pedano, M.L.; Miscoriaa, S.A.; Parrado, C. Carbon nanotubes for electrochemical biosensing. Talanta 2007, 74, 291–307. [Google Scholar] [CrossRef]
  37. Gao, M.; Dai, L.; Wallace, G.G. Biosensors Based on Aligned Carbon Nanotubes Coated with Inherently Conducting Polymers. Electroanalysis 2003, 15, 1089–1094. [Google Scholar] [CrossRef]
  38. Posthuma-Trumpie, G.A.; Wichers, J.H.; Koets, M.; Berendsen, L.B.J.M.; Amerongen, A.V. Amorphous carbon nanoparticles: A versatile label for rapid diagnostic immuno assays. Anal. Bioanal. Chem. 2012, 402, 593–600. [Google Scholar] [CrossRef]
  39. Abajo, F.J.G. Graphene Plasmonics: Challenges and Opportunities. ACS Photonics 2014, 1, 135–152. [Google Scholar] [CrossRef] [Green Version]
  40. Lin, M.F.; Shung, K.W.K. Plasmons and optical properties of carbon nanotubes. Phys. Rev. B 1994, 50, 17744–17747. [Google Scholar] [CrossRef]
  41. Balasubramanian, K.; Burghard, M. Biosensors based on carbon nanotubes. Anal. Bioanal. Chem. 2006, 385, 452–468. [Google Scholar] [CrossRef]
  42. Krasavina, A.V.; Zayats, A.V. Passive photonic elements based on dielectric-loaded surface plasmon polariton waveguides. Appl. Phys. Lett. 2007, 90, 211101. [Google Scholar] [CrossRef]
  43. Gupta, R.; Dyer, M.J.; Weimer, W.A. Preparation and characterization of surface plasmon resonance tunable gold and silver films. J. Appl. Phys. 2002, 92, 5264–5271. [Google Scholar] [CrossRef]
  44. Rance, G.A.; Marsh, D.H.; Nicholas, R.J.; Khlobystov, A.N. UV–Vis absorption spectroscopy of carbon nanotubes: Relationship between the p-electron plasmon and nanotube diameter. Chem. Phys. Lett. 2010, 493, 19–23. [Google Scholar] [CrossRef]
  45. Rahmani, M.; Fard, H.G.; Ahmadi, M.T.; Rahmani, K. An Analytical Approach to Model the Optical Properties of Carbon Nanotubes for Plasmonic Devices. J. Nanoelectron. Optoelectron. 2018, 13, 208–213. [Google Scholar] [CrossRef]
  46. Ni, G.X.; McLeod, A.S.; Sun, Z.; Wang, L.; Xiong, L.; Post, K.W.; Sunku, S.S.; Jiang, B.Y.; Hone, J.; Dean, C.R.; et al. Fundamental limits to graphene plasmonics. Nature 2018, 557, 530–533. [Google Scholar] [CrossRef] [Green Version]
  47. Papari, G.P.; Gargiulo, V.; Alfè, M.; Capua, R.D.; Pezzella, A.; Andreone, A. THz spectroscopy on graphene-like materials for bio-compatible devices. J. Appl. Phys. 2017, 121, 145107. [Google Scholar] [CrossRef]
  48. Tamagnone, M.; Gómez-Díaz, J.S.; Mosig, J.R.; Perruisseau-Carrier, J. Analysis and design of terahertz antennas based on plasmonic resonant graphene sheets. J. Appl. Phys. 2012, 112, 114915. [Google Scholar] [CrossRef] [Green Version]
  49. Novoselov, K.S.; Geim, A.K.; Morozov, S.V.; Jiang, D.; Katsnelson, M.I.; Grigorieva, I.V.; Dubonos, S.V.; Firsov, A.A. Two-dimensional gas of massless Dirac fermions in graphene. Nature 2005, 438, 197–200. [Google Scholar] [CrossRef]
  50. Castro Neto, A.H.; Guinea, F.; Peres, N.M.R.; Novoselov, K.S.; Geim, A.K. The electronic properties of graphene. Rev. Mod. Phys. 2009, 81, 109–162. [Google Scholar] [CrossRef] [Green Version]
  51. Novoselov, K.S.; Geim, A.K.; Morozov, S.V.; Jiang, D.; Zhang, Y.; Dubonos, S.V.; Grigorieva, I.V.; Firsov, A.A. Electric Field Effect in Atomically Thin Carbon Films. Science 2004, 306, 666–669. [Google Scholar] [CrossRef] [Green Version]
  52. Bonaccorso, F.; Sun, Z.; Hasan, T.; Ferrari, A.C. Graphene photonics and optoelectronics. Nat. Photonics. 2010, 4, 611–622. [Google Scholar] [CrossRef] [Green Version]
  53. Koppens, F.H.L.; Chang, D.E.; Javier Garcia de Abajo, F. Graphene plasmonics: A platform for strong light-matter interactions. Nano Lett. 2011, 11, 3370–3377. [Google Scholar] [CrossRef]
  54. Rodrigo, D.; Limaj, O.; Janner, D.; Etezadi, D.; Javier García de Abajo, F.; Pruneri, V.; Altug, H. Mid-infrared plasmonic biosensing with graphene. Science 2015, 349, 165–168. [Google Scholar] [CrossRef] [Green Version]
  55. Eatemadi, A.; Daraee1, H.; Karimkhanloo, H.; Kouhi, M.; Zarghami1, N.; Akbarzadeh, A.; Abasi1, M.; Hanifehpour, Y.; Joo, S.W. Carbon nanotubes: Properties, synthesis, purification, and medical applications. Nanosci. Res. Lett. 2014, 9, 393. [Google Scholar] [CrossRef]
  56. Li, C.; Thostenson, E.T.; Chou, T.W. Sensors and actuators based on carbon nanotubes and their composites: A review. Compos. Sci. Technol. 2008, 68, 1227–1249. [Google Scholar] [CrossRef]
  57. Heller, D.A.; Baik, S.; Eurell, T.E.; Strano, M.S. Single-Walled Carbon Nanotube Spectroscopy in Live Cells: Towards Long-Term Labels and Optical Sensors. Adv. Mater. 2005, 17, 2793–2799. [Google Scholar] [CrossRef]
  58. Huang, H.; Wang, F.; Liu, Y.; Wang, S.; Peng, L.M. Plasmonic Enhanced Performance of an Infrared Detector Based on Carbon Nanotube Films. ACS Appl. Mater. Interfaces 2017, 9, 12743–12749. [Google Scholar] [CrossRef]
  59. Zhang, J.; Zhang, X.; Chen, S.; Gong, T.; Zhu, Y. Surface-enhanced Raman scattering properties of multi-walled carbon nanotubes arrays-Ag nanoparticles. Carbon 2016, 100, 395–407. [Google Scholar] [CrossRef]
  60. Qu, L.L.; Liu, Y.Y.; Liu, M.K.; Yang, G.H.; Li, D.W.; Li, H.T. Highly reproducible Ag NPs/CNT-intercalated GO membranes for enrichment and sers detection of antibiotics. ACS Appl. Mater. Interfaces 2016, 8, 28180–28186. [Google Scholar] [CrossRef]
  61. Zhang, K.; Ji, J.; Fang, X.; Yan, L.; Liu, B. Carbon nanotube/gold nanoparticle compositecoated membrane as a facile plasmon-enhanced interface for sensitive SERS sensing. Analyst 2015, 140, 134–139. [Google Scholar] [CrossRef]
  62. Ashiba, H.; Iizumi, Y.; Okazaki, T.; Wang, X.; Fujimaki, M. Carbon Nanotubes as Fluorescent Labels for Surface Plasmon Resonance-Assisted Fluoroimmunoassay. Sensors 2017, 17, 2569. [Google Scholar] [CrossRef]
  63. Dinh, N.X.; Huy, T.Q.; Vu, L.V.; Tam, L.T.; Le, A.T. Multiwalled carbon nanotubes/silver nanocomposite as effective SERS platform for detection of methylene blue dye in water. J. Sci. Adv. Mater. Devices 2016, 1, 84–89. [Google Scholar] [CrossRef] [Green Version]
  64. Zhang, X.; Zhang, J.; Quan, J.; Wang, N.; Zhu, Y. Surface-enhanced Raman scattering activities of carbon nanotubes decorated with silver nanoparticles. Analyst 2016, 141, 5527–5534. [Google Scholar] [CrossRef]
  65. Hummers, W.S.; Offeman, R.E. Preparation of graphitic oxide. J. Am. Chem. Soc. 1958, 80, 1339. [Google Scholar] [CrossRef]
  66. Marcano, D.C.; Kosynkin, D.V.; Berlin, J.M.; Sinitskii, A.; Sun, Z.; Slesarev, A.; Alemany, L.B.; Lu, W.; Tour, J.M. Improved synthesis of graphene oxide. ACS Nano 2010, 4, 4806–4814. [Google Scholar] [CrossRef]
  67. Choucair, M.; Thordarson, P.; Stride, J.A. Gram-scaleproduction of graphene based on solvothermal synthesis andsonication. Nat. Nanotechnol. 2009, 4, 30–33. [Google Scholar] [CrossRef]
  68. Kim, K.S.; Zhao, Y.; Jang, H.; Lee, S.Y.; Kim, J.M.; Kim, K.S.; Ahn, J.H.; Kim, P.; Choi, J.Y.; Hong, B.H. Large-scale pattern growth of graphene films for stretchable transparent electrodes. Nature 2009, 457, 706–710. [Google Scholar] [CrossRef]
  69. Reina, A.; Jia, X.T.; Ho, J.; Nezich, D.; Son, H.; Bulovic, V.; Mildred Dresselhaus, S.; Kong, J. Large area, few-layer graphene films on arbitrary substrates by chemical vapor deposition. Nano Lett. 2009, 9, 30–35. [Google Scholar] [CrossRef]
  70. Sutter, P.W.; Flege, J.I.; Sutter, E.A. Epitaxial graphene on ruthenium. Nat. Mater. 2008, 7, 406–411. [Google Scholar] [CrossRef]
  71. Karu, A.E.; Beer, M. Pyrolytic formation of highly crystalline graphite films. J. Appl. Phys. 1966, 37, 2179. [Google Scholar] [CrossRef]
  72. Somani, P.R.; Somani, S.P.; Umeno, M. Planar nano-graphenes from camphor by CVD. Chem. Phys. Lett. 2006, 430, 56–59. [Google Scholar] [CrossRef]
  73. Szabó, A.; Perri, C.; Csató, A.; Giordano, G.; Vuono, D.; Nagy, J.B. Synthesis Methods of Carbon Nanotubes and Related Materials. Materials 2010, 3, 3092–3140. [Google Scholar] [CrossRef]
  74. Li, Y.; Yan, H.; Farmer, D.B.; Meng, X.; Zhu, W.; Osgood, R.M.; Heinz, T.F.; Avouris, P. Graphene plasmon enhanced vibrational sensing of surface-adsorbed layers. Nano Lett. 2014, 14, 1573–1577. [Google Scholar] [CrossRef]
  75. Allsop, T.; Arif, R.; Neal, R.; Kalli, K.; Kundrat, V.; Rozhin, A.; Culverhouse, P.; Webb, D.J. Photonic gas sensors exploiting directly the optical properties of hybrid carbon nanotube localized surface plasmon structures. Light Sci. Appl. 2016, 5, 16036. [Google Scholar] [CrossRef]
  76. Cheung, W.; Patel, M.; Ma, Y.; Chen, Y.; Xie, Q.; Lockard, J.V.; Gaob, Y.; He, H. Plasmon absorption of carbon nanotubes for the selective and sensitive detection of Fe3+ ions. Chem. Sci. 2016, 7, 5192–5199. [Google Scholar] [CrossRef]
  77. Verma, R.; Jha, R.; Gupta, B.D. Sensitivity enhancement of a surface plasmon resonance based biomolecules sensor using graphene and silicon layers. Sens. Actuators B Chem. 2011, 160, 623–631. [Google Scholar] [CrossRef]
  78. Angiola, M.; Rutherglen, C.; Galatsis, K.; Martucci, A. Transparent carbon nanotube film as sensitive material for surface plasmon resonance based optical sensors. Sens. Actuators B Chem. 2016, 236, 1098–1103. [Google Scholar] [CrossRef]
  79. Wu, L.; Chu, H.S.; Koh, W.S.; Li, E.P. Highly sensitive graphene biosensors based on surface plasmon resonance. Opt. Express 2010, 18, 14395–14400. [Google Scholar] [CrossRef]
  80. Wang, Q.; Wang, B. Sensitivity enhanced SPR immunosensor based on graphene oxide and SPA co-modified photonic crystal fiber. Opt. Laser Technol. 2018, 107, 210–215. [Google Scholar] [CrossRef]
  81. Semwal, V.; Gupta, B.D. LSPR-and SPR-based fiber-optic cholesterol sensor using immobilization of cholesterol oxidase over silver nanoparticles coated graphene oxide nanosheets. IEEE Sens. J. 2017, 18, 1039–1046. [Google Scholar] [CrossRef]
  82. Lee, E.G.; Park, K.M.; Jeong, J.Y.; Lee, S.H.; Baek, J.E.; Lee, H.W.; Jung, J.K.; Chung, B.H. Carbon nanotube-assisted enhancement of surface plasmon resonance signal. Anal. Biochem. 2011, 408, 206–211. [Google Scholar] [CrossRef]
  83. Bahrami, J.Y.; Wang, Q.; Wang, B.T. Refractive index sensing characteristics of carbon nanotube-deposited photonic crystal fiber SPR sensor. Opt. Fiber Technol. 2018, 43, 137–144. [Google Scholar]
  84. Ozhikandathil, J.; Badilescu, S.; Packirisamy, M. Plasmonic Gold Decorated MWCNT Nanocomposite for Localized Plasmon Resonance Sensing. Sci. Rep. 2015, 5, 13181. [Google Scholar] [CrossRef] [Green Version]
  85. Semwal, V.; Gupta, B.D. Highly sensitive surface plasmon resonance based fiber optic pH sensor utilizing rGO-Pani nanocomposite prepared by in situ method. Sens. Actuators B Chem. 2019, 283, 632–642. [Google Scholar] [CrossRef]
  86. Bahrami, A.; Sadrolhosseini, A.R.; Mamdoohi, G.; Bahzad, K.; Abdi, M.M. Surface plasmon sensor based on polypyrrole multiwalled carbon nanotube composite layer to detect Al (III) in aqueous solution. Dig. J. Nanomater. Biostruct. 2015, 10, 535–541. [Google Scholar]
  87. Sadrolhosseini, A.R.; Noor, A.S.M.; Bahrami, A.; Lim, H.N.; Talib, Z.A.; Mahdi, M.A. Application of Polypyrrole Multi-Walled Carbon Nanotube Composite Layer for Detection of Mercury, Lead and Iron Ions Using Surface Plasmon Resonance Technique. PLoS ONE 2014, 9, 93962. [Google Scholar] [CrossRef]
  88. Oh, J.; Chang, Y.W.; Kim, H.J.; Yoo, S.; Kim, D.J.; Im, S.; Park, Y.J.; Kim, D.; Yoo, K.H. Carbon Nanotube-Based Dual-Mode Biosensor for Electrical and Surface Plasmon Resonance Measurements. Nano Lett. 2010, 10, 2755–2760. [Google Scholar] [CrossRef]
  89. Zhu, Z.; Garcia-Gancedo, L.; Flewitt, A.J.; Xie, H.; Moussy, F.; Milne, W.I. A critical review of glucose biosensors based on carbon nanomaterials: Carbon nanotubes and grapheme. Sensors 2012, 12, 5996–6022. [Google Scholar] [CrossRef]
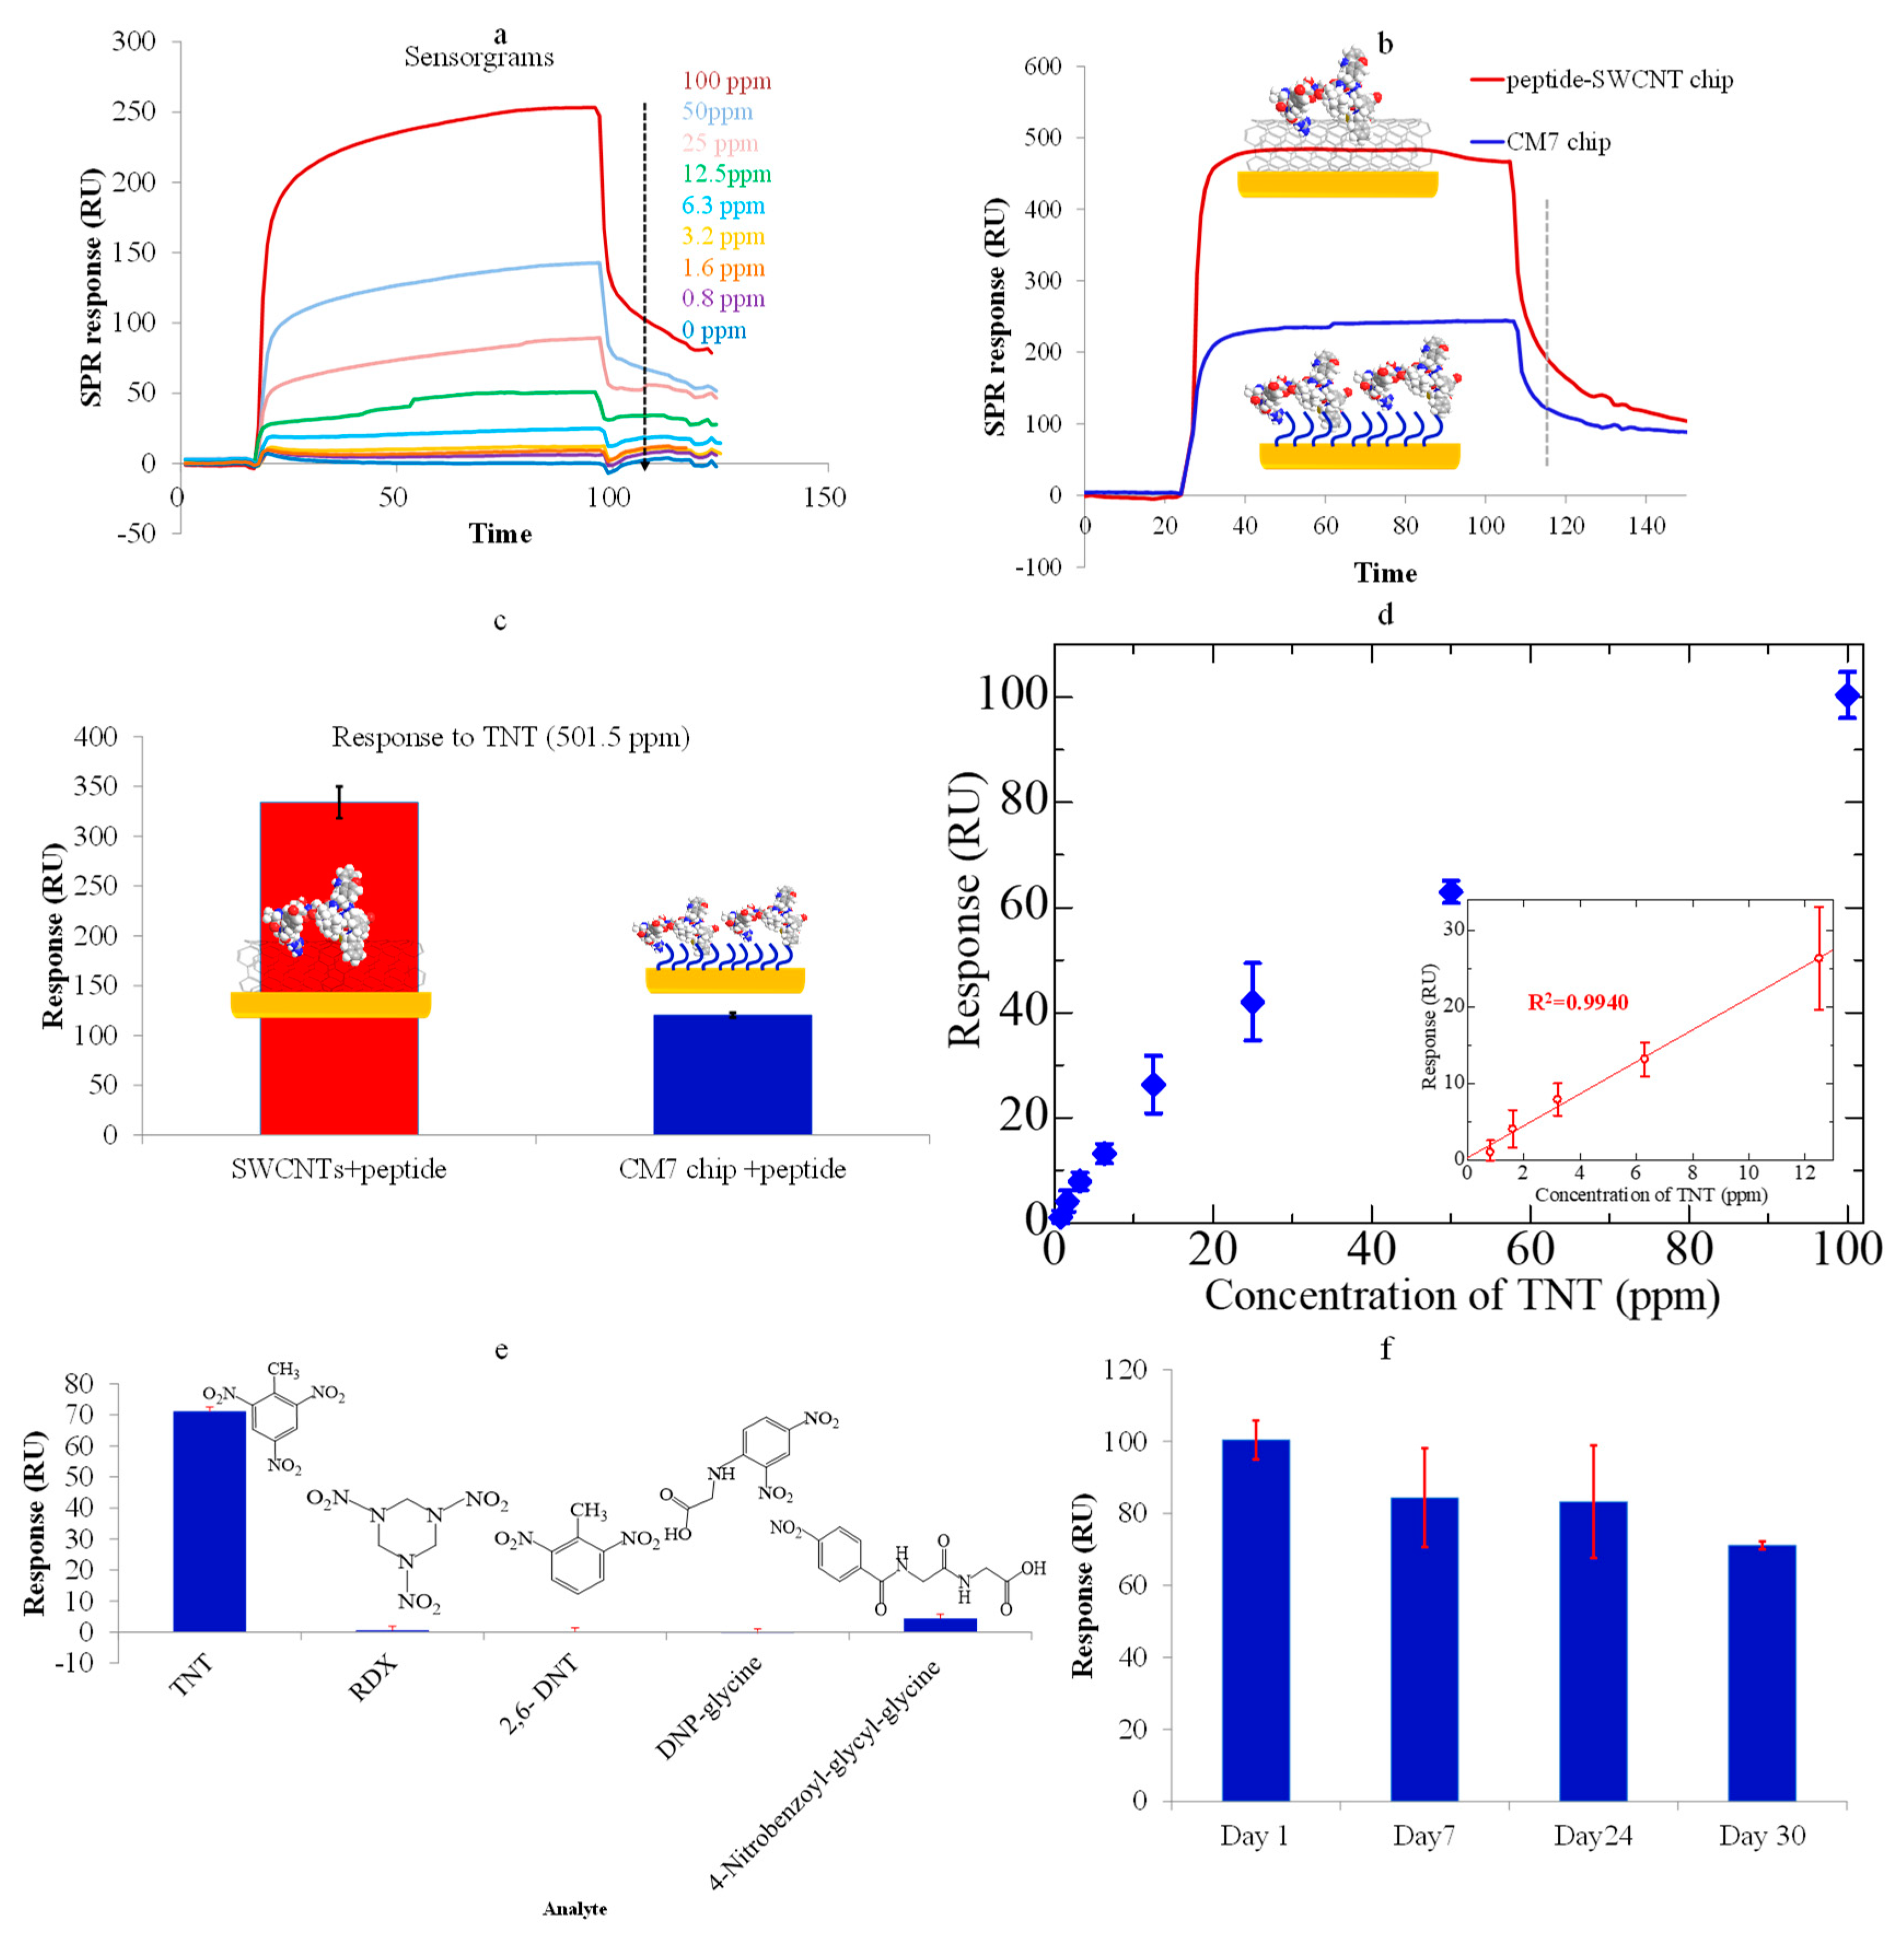
  90. Wang, J.; Du, S.; Onodera, T.; Yatabe, R.; Tanaka, M.; Okochi, M.; Toko, K. An SPR Sensor Chip Based on Peptide-Modified Single-Walled Carbon Nanotubes with Enhanced Sensitivity and Selectivity in the Detection of 2, 4, 6-Trinitrotoluene Explosives. Sensors 2018, 18, 4461. [Google Scholar] [CrossRef]
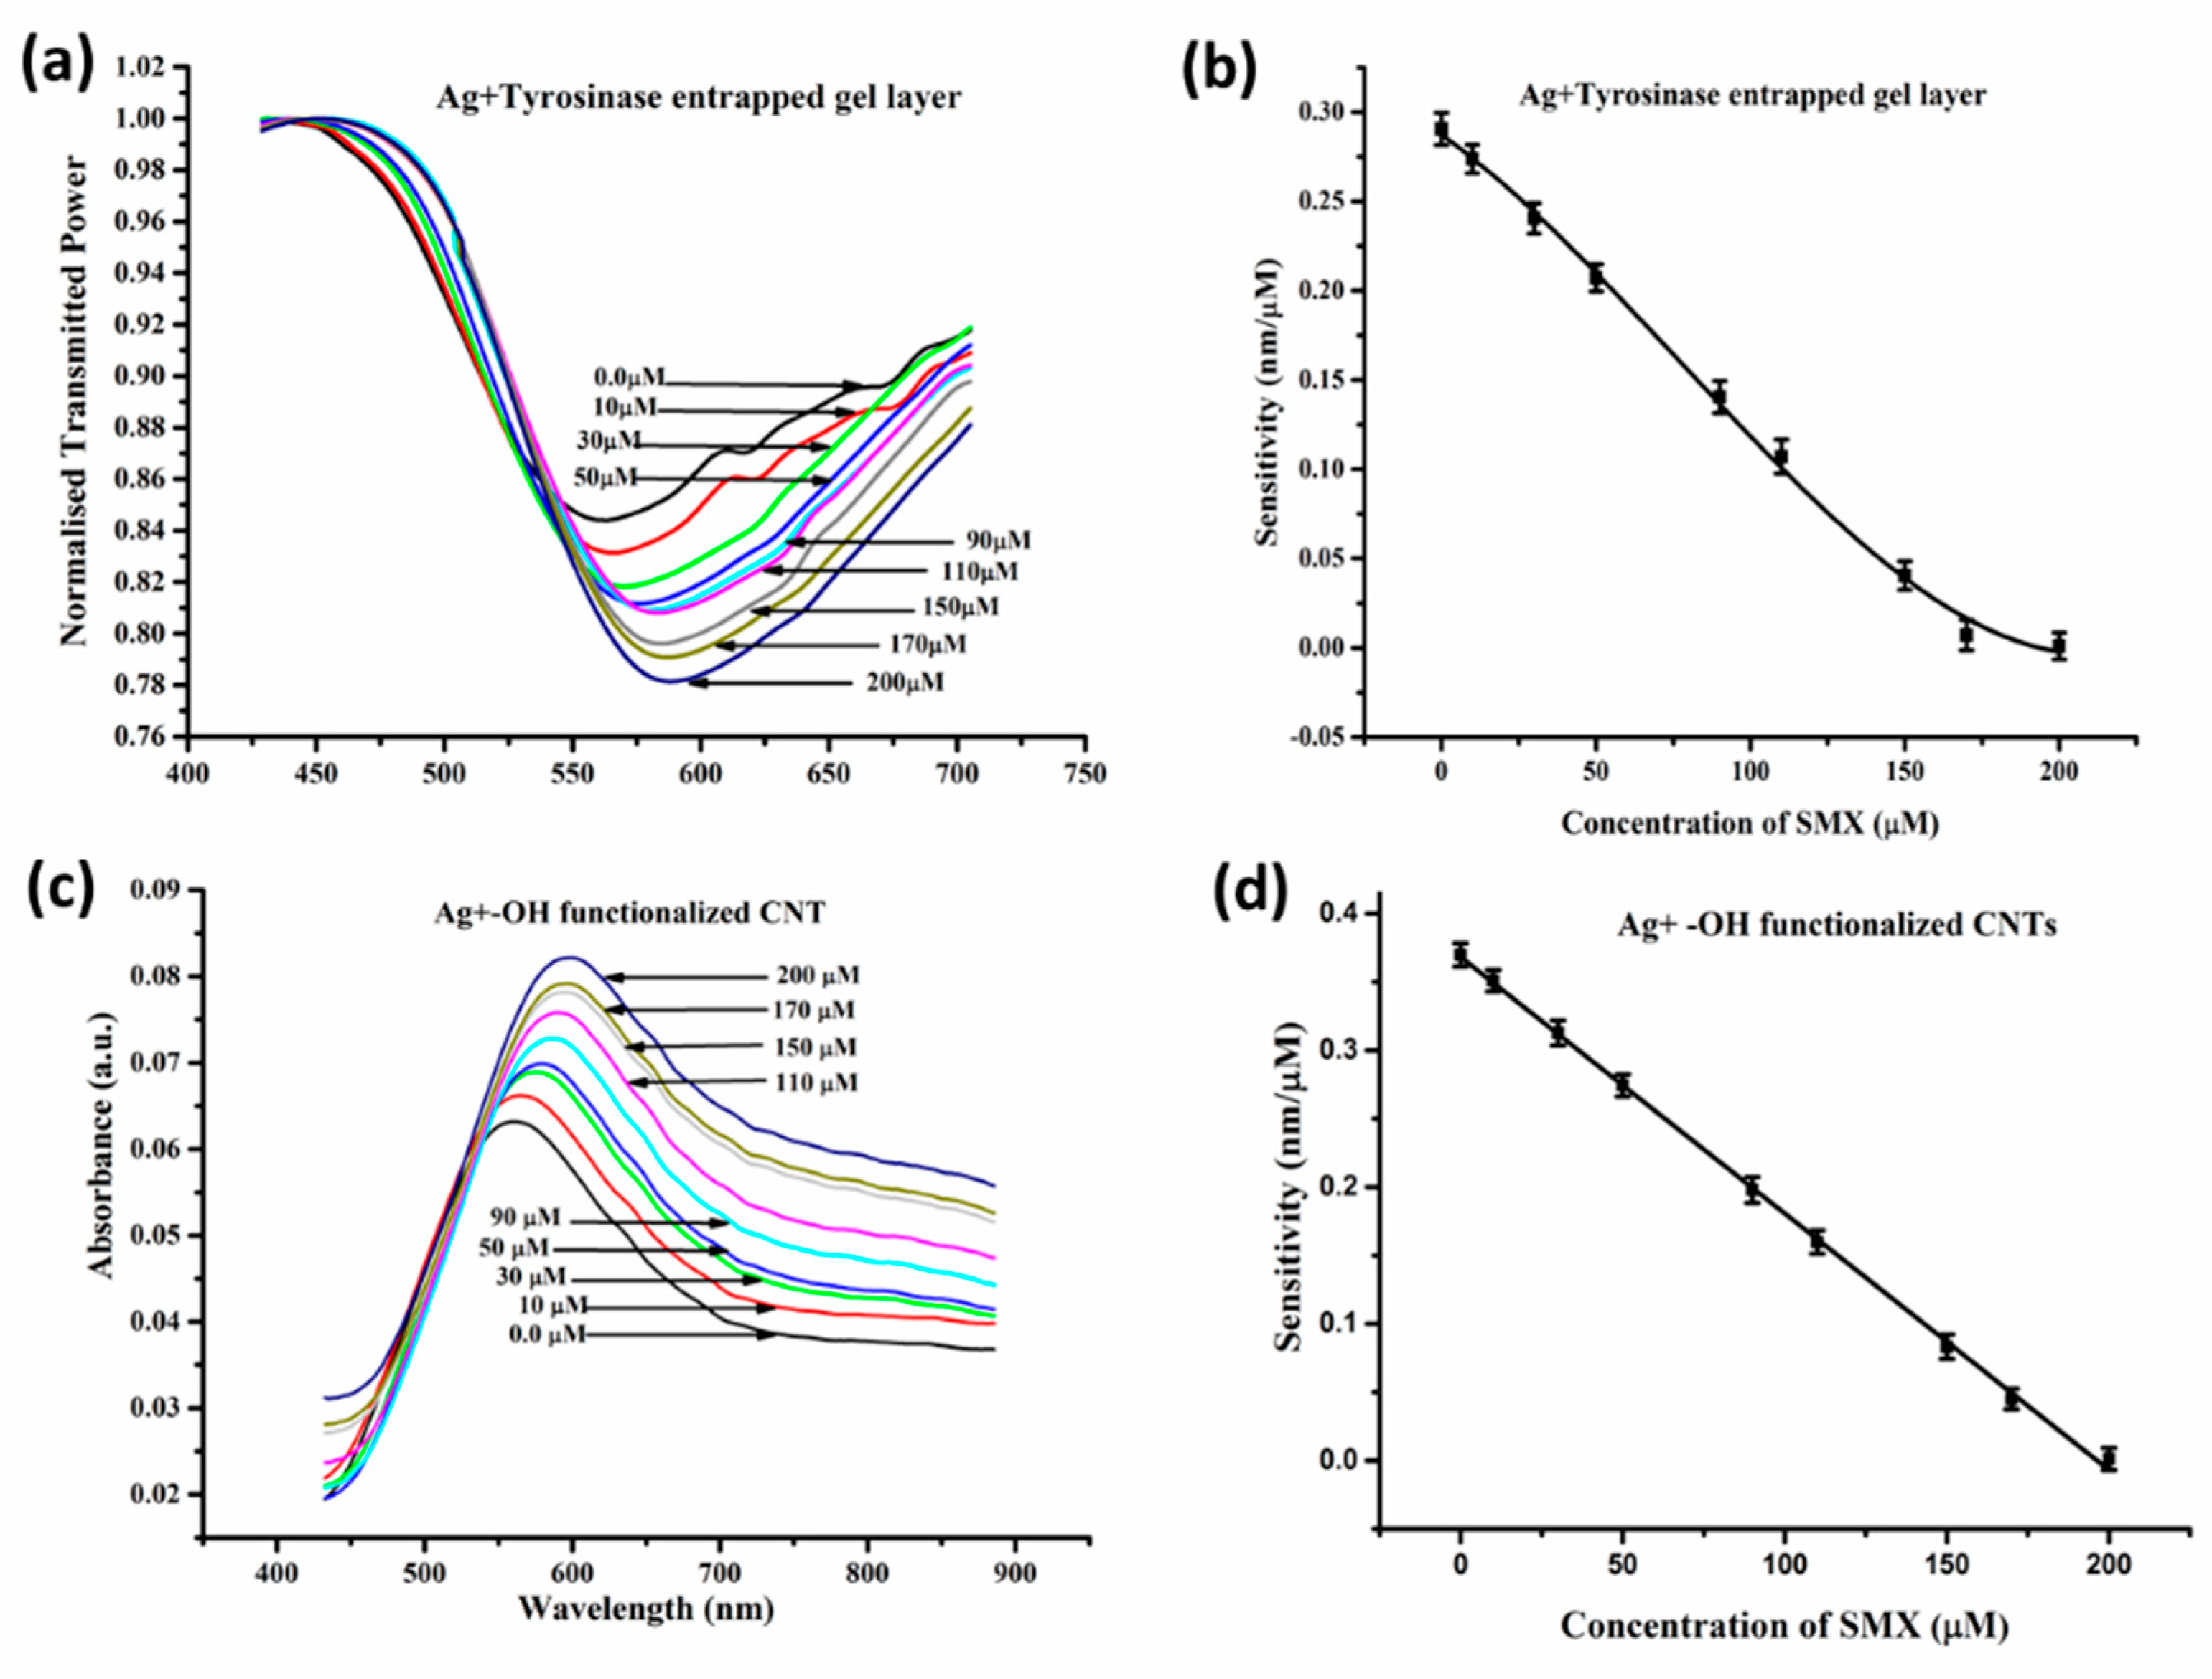
  91. Pathak, A.; Parveen, S.; Gupta, B.D. Fiber optic SPR sensor using functionalized CNTs for the detection of SMX: Comparison with enzymatic approach. Plasmonics 2018, 13, 189–202. [Google Scholar] [CrossRef]
  92. Pathak, A.; Gupta, B.D. Ultra-selective fiber optic SPR platform for the sensing of dopamine in synthetic cerebrospinal fluid incorporating permselective nafion membrane and surface imprinted MWCNTs-PPy matrix. Biosens. Bioelectr. 2019, 133, 205–214. [Google Scholar] [CrossRef]
  93. Pathak, A.; Parveen, S.; Gupta, B.D. Ultrasensitive, highly selective, and real-time detection of protein using functionalized CNTs as MIP platform for FOSPR-based biosensor. Nanotechnology 2017, 28, 355503. [Google Scholar] [CrossRef]
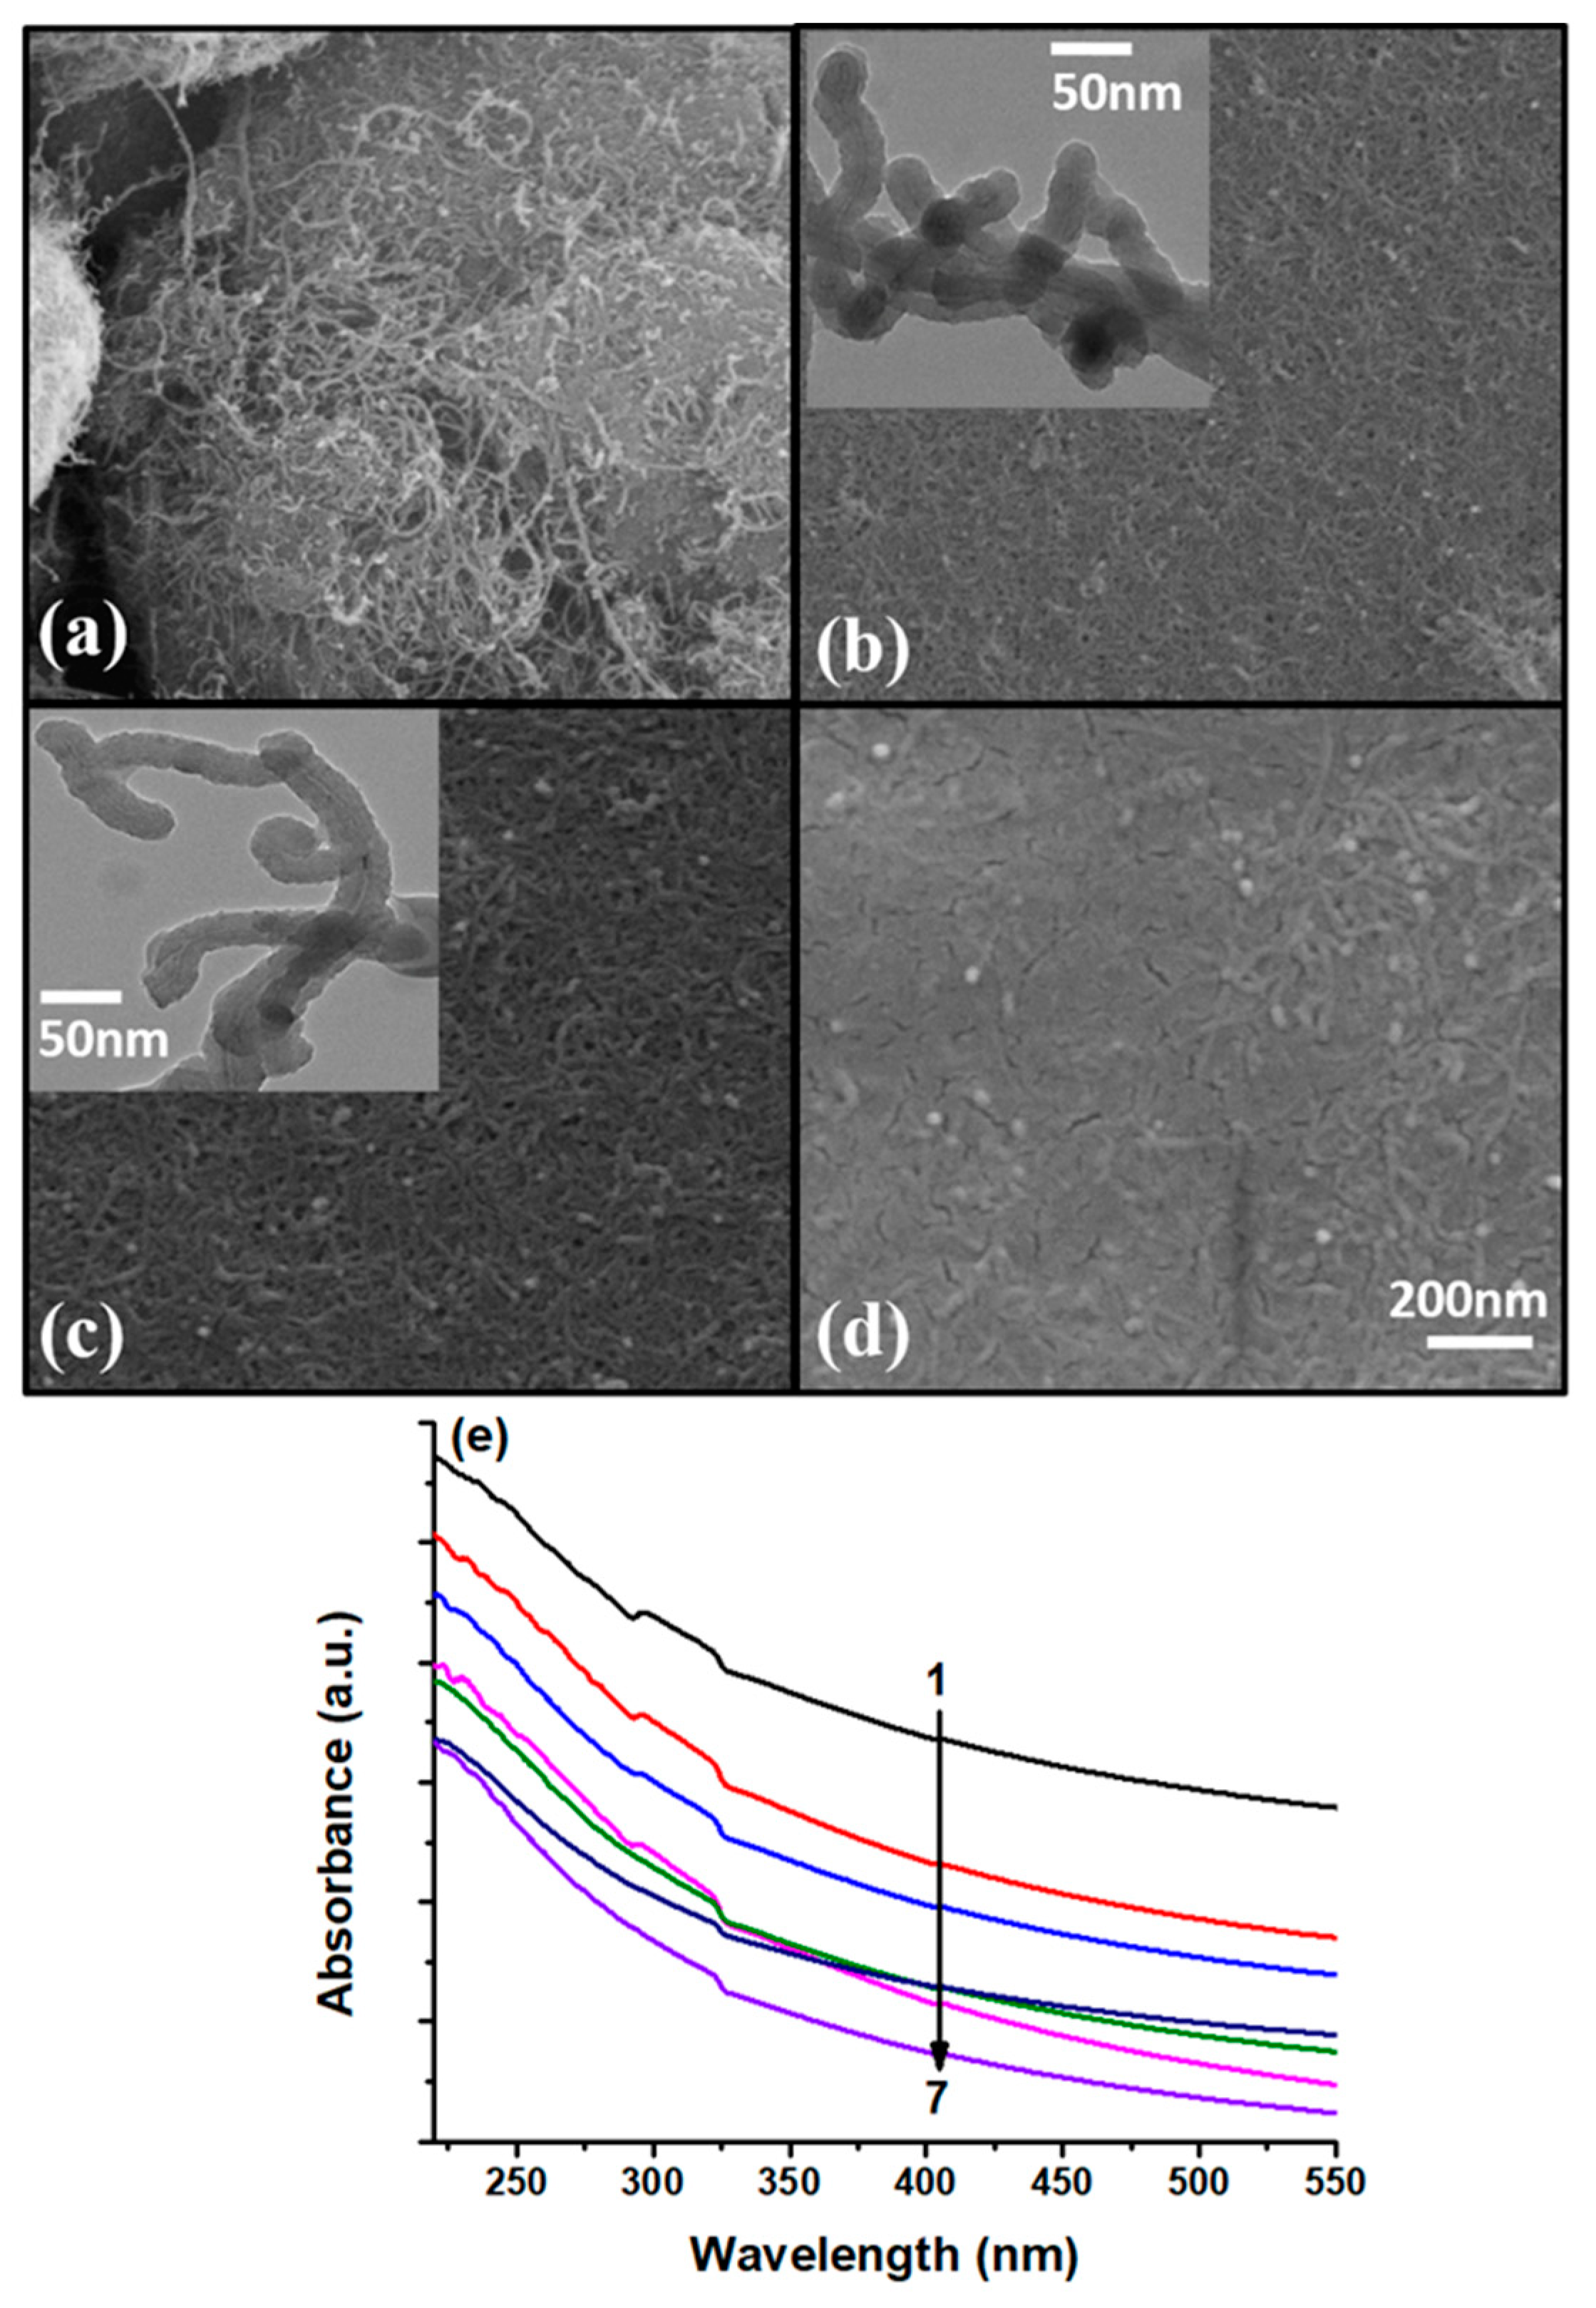
  94. Parveen, S.; Pathak, A.; Gupta, B.D. Fiber optic SPR nanosensor based on synergistic effects of CNT/Cu-nanoparticles composite for ultratrace sensing of nitrate. Sens. Actuators B Chem. 2017, 246, 910–919. [Google Scholar] [CrossRef]
Figure 1. Dispersion curve for surface plasmons and incident light.
Sensors 19 03536 g001
Figure 2. (a) Otto configuration, and (b) Kretschmann-Reather configuration.
Sensors 19 03536 g002
Figure 3. (A) UV-Vis-NIR spectrum of SWNT/PL-PEG-COOHs in aqueous solution. (BD) STEM, SEM and AFM images of SWNT/PL-PEG-COOHs, respectively. Reprinted with permission from [76]. Copyright 2016 Royal Society of Chemistry.
Sensors 19 03536 g003
Figure 4. (A) UV-Visible spectra of Deferoxamine (DFO) only, Fe3+ only, Al3+ only, DFO + Fe3+, and DFO + Al3+ solution in nitric acid (pH = 2). (B,C) UV-Vis spectra of SWNT/PL-PEG-DFO in the presence of (black) 0 pM, (red) 10 pM, (green) 30 pM, (blue) 50 pM, (cyan) 70 pM, and (magenta) 90 pM Fe3+ and Al3+ standard solutions, respectively. (D) The decrease in the absorption of SWNT/PL-PEG-DFOs at 270 nm as a function of the increase in the concentration of Fe3+ and Al3+. UV-Vis-NIR spectrum. Reprinted with permission from [76]. Copyright 2016 Royal Society of Chemistry.
Sensors 19 03536 g004
Figure 5. Schematic diagram of a prism based SPR probe. Reprinted with permission from [77]. Copyright 2011 Elsevier.
Sensors 19 03536 g005
Figure 6. (a) The N-Layer model for surface plasmon resonance (SPR) biosensor: prism|Au (50 nm)|graphene (L× 0.34 nm)|sensing medium, and (b) simulated transmittance of light at λo = 633 nm (crosses) and measured transmittance of white light (squares) as a function of the number of graphene layers. Reprinted with permission from [79]. Copyright 2010 The Optical Society.
Sensors 19 03536 g006
Figure 7. (a) The surface plasmon resonance curves for the conventional biosensor and the monolayer graphene biosensor for the He-Ne laser light, and (b) the sensitivity enhancement as a function of the number of graphene layers. Reprinted with permission from [79]. Copyright 2010 The Optical Society.
Sensors 19 03536 g007
Figure 8. Procedure of graphene oxide and staphylococcal protein A (SPA) modification for IgG immunoassay. Reprinted with permission from [80]. Copyright 2018 Elsevier.
Sensors 19 03536 g008
Figure 9. The resonance spectrum and linear fitting curve of Au-PCF (a,b) and Au/GO-PCF (c,d) sensor. The errors bars represent the standard deviations from three independent experiments. Reprinted with permission from [80]. Copyright 2018 Elsevier.
Sensors 19 03536 g009
Figure 10. Goat anti-human IgG immobilized on the sensor surface. Reprinted with permission from [80]. Copyright 2018 Elsevier.
Sensors 19 03536 g010
Figure 11. Schematic diagram of three different fiber optic probes, named (a) Probe I, (b) Probe II, and (c) Probe III.
Sensors 19 03536 g011
Figure 12. Schematic diagram of SPR immunoassay to enhance sensitivity with the CNT-antibody complex. Reprinted with permission from [82]. Copyright 2011 Elsevier.
Sensors 19 03536 g012
Figure 13. SPR sensorgrams of the (A) EPO (1 μg/mL) immunoassay with the antibody, (B) CNT–antibody complex, and (C) SPR signal shift by direct and CNT-mediated detections. Reprinted with permission from [82]. Copyright 2011 Elsevier.
Sensors 19 03536 g013
Figure 14. SPR resonance wavelength of (a) Au-PCF sensor and CNTs/Au-PCF sensor (b) Ag-PCF sensor and CNTs/Ag-PCF sensor with varied refractive indices of glucose solutions. Reprinted with permission from [83]. Copyright 2018 Elsevier.
Sensors 19 03536 g014
Figure 15. (a) SEM image of Pani, (b) TEM image of rGO, (c) SEM image of the rGO-Pani nanocomposite, and (d) HR TEM image of rGO-Pani nanocomposite. Reprinted with permission from [85]. Copyright 2019 Elsevier.
Sensors 19 03536 g015
Figure 16. Schematic representation of the probe fabrication. Reprinted with permission from [85]. Copyright 2019 Elsevier.
Sensors 19 03536 g016
Figure 17. SPR spectra of the probe for (a) pH range from 7.0 to 2.4, and (b) pH range from 7.0 to 11.35. Reprinted with permission from [85]. Copyright 2019 Elsevier.
Sensors 19 03536 g017
Figure 18. The real-time sensorgrams of (a) peptide-SWCNT hybrids corresponding to TNT concentrations; (b) two kinds of sensor chips corresponding to TNT explosives at a concentration of 501.5 ppm; (c) a comparison of the responses of two kinds of sensor chips; (d) the responses of the SWCNT–peptide chip and CM7 chip to TNT; (e) the response of the TNTHCDR3-anchored SWCNT sensor chip to 100 ppm solutions of TNT, RDX, 2,6-DNT, 4-nitrobenzoyl-glycyl-glycine, and DNP-glycine. (f) The stability of the sensor chip over a duration of one month. Reprinted with permission from [90]. Copyright 2018 MDPI.
Sensors 19 03536 g018
Figure 19. Interaction mechanism of (a) Tyrosinase and SMX, (b) functionalized CNTs and SMX. Reprinted with permission from [91]. Copyright 2018 Springer.
Sensors 19 03536 g019
Figure 20. (a) SPR spectra, (b) sensitivity of the tyrosinase enzyme-based probe, and (c) SPR spectra, (d) sensitivity of the functionalized CNT-based probe for different concentrations of SMX. Reprinted with permission from [91]. Copyright 2018 Springer.
Sensors 19 03536 g020
Figure 21. SEM images of (a) as obtained MWCNTs, (b) DA embedded MWCNTs-PPy matrix, (c) DA imprinted MWCNTs-PPy matrix, (d) Nafion/MWCNTs-PPy MIP nanocomposite, and (e) UV-vis spectra of the MWCNTs-PPy MIP nanocomposite during seven elution steps. Reprinted with permission from [92]. Copyright 2019 Elsevier.
Sensors 19 03536 g021
Figure 22. (a) SPR plots for various DA concentrations, and (b) calibration curve of the sensor. Reprinted with permission from [92]. Copyright 2019 Elsevier.
Sensors 19 03536 g022

