Birefringent Bragg Grating in C-Shaped Optical Fiber as a Temperature-Insensitive Refractometer †

 ,
,  and
and 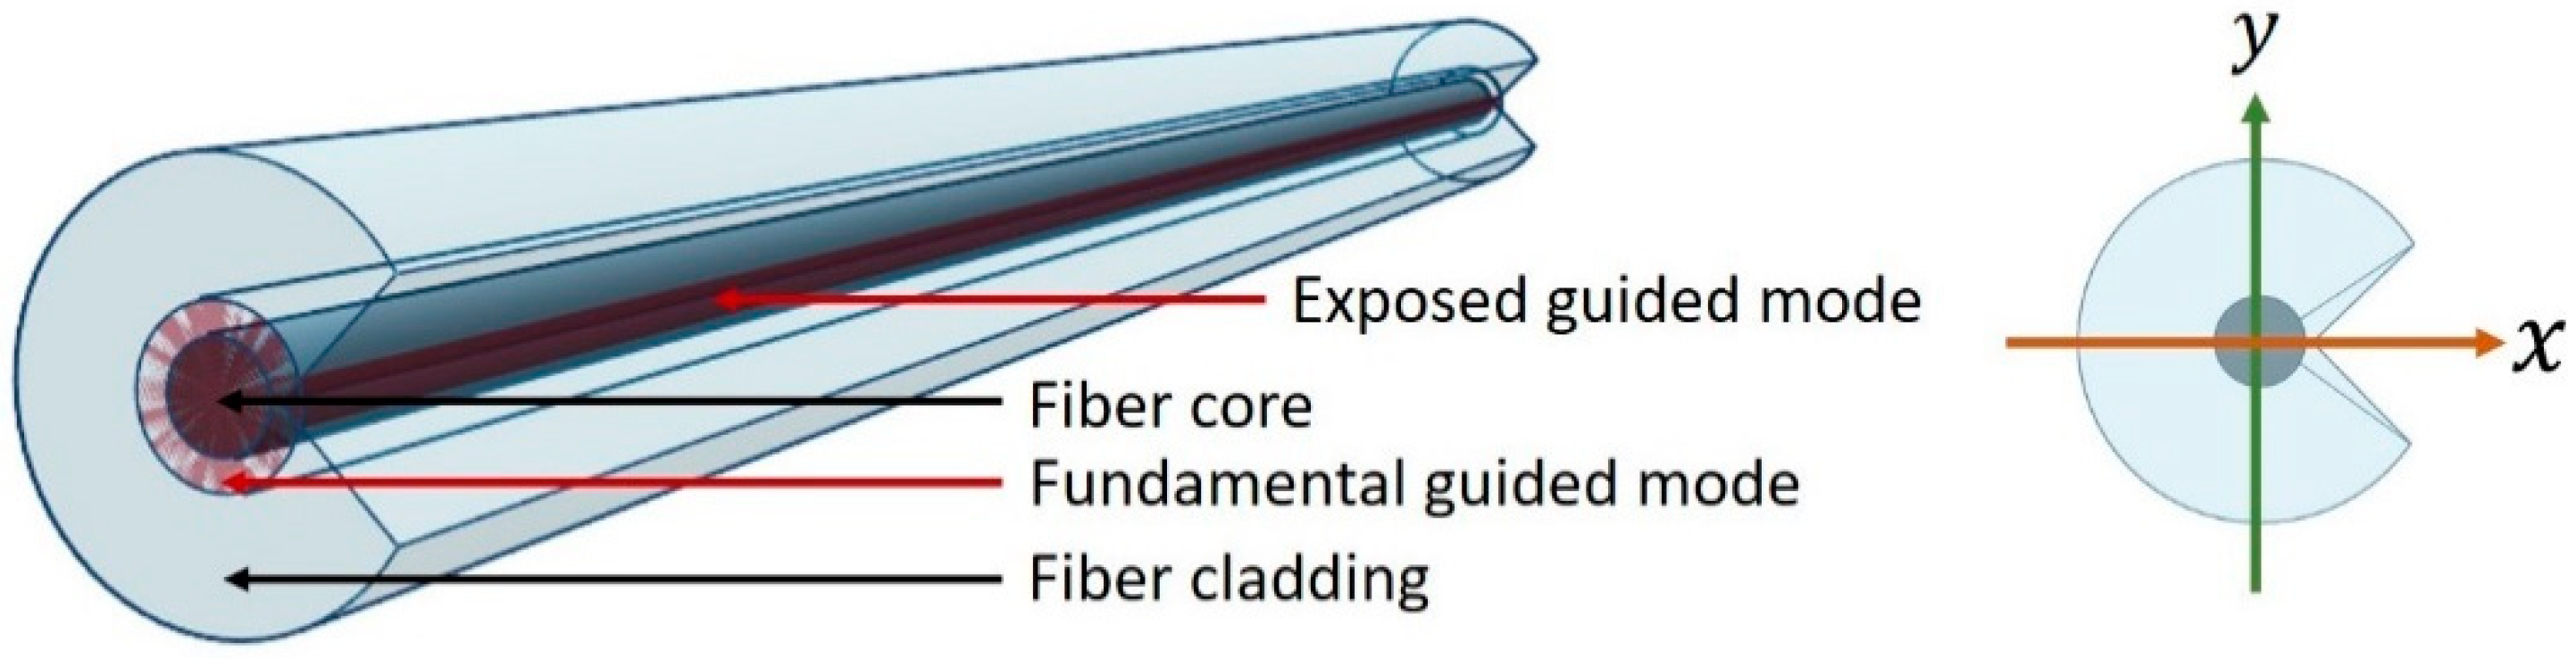
Abstract
:1. Introduction
2. Theory
2.1. FBG Reflections in Birefringent Waveguides
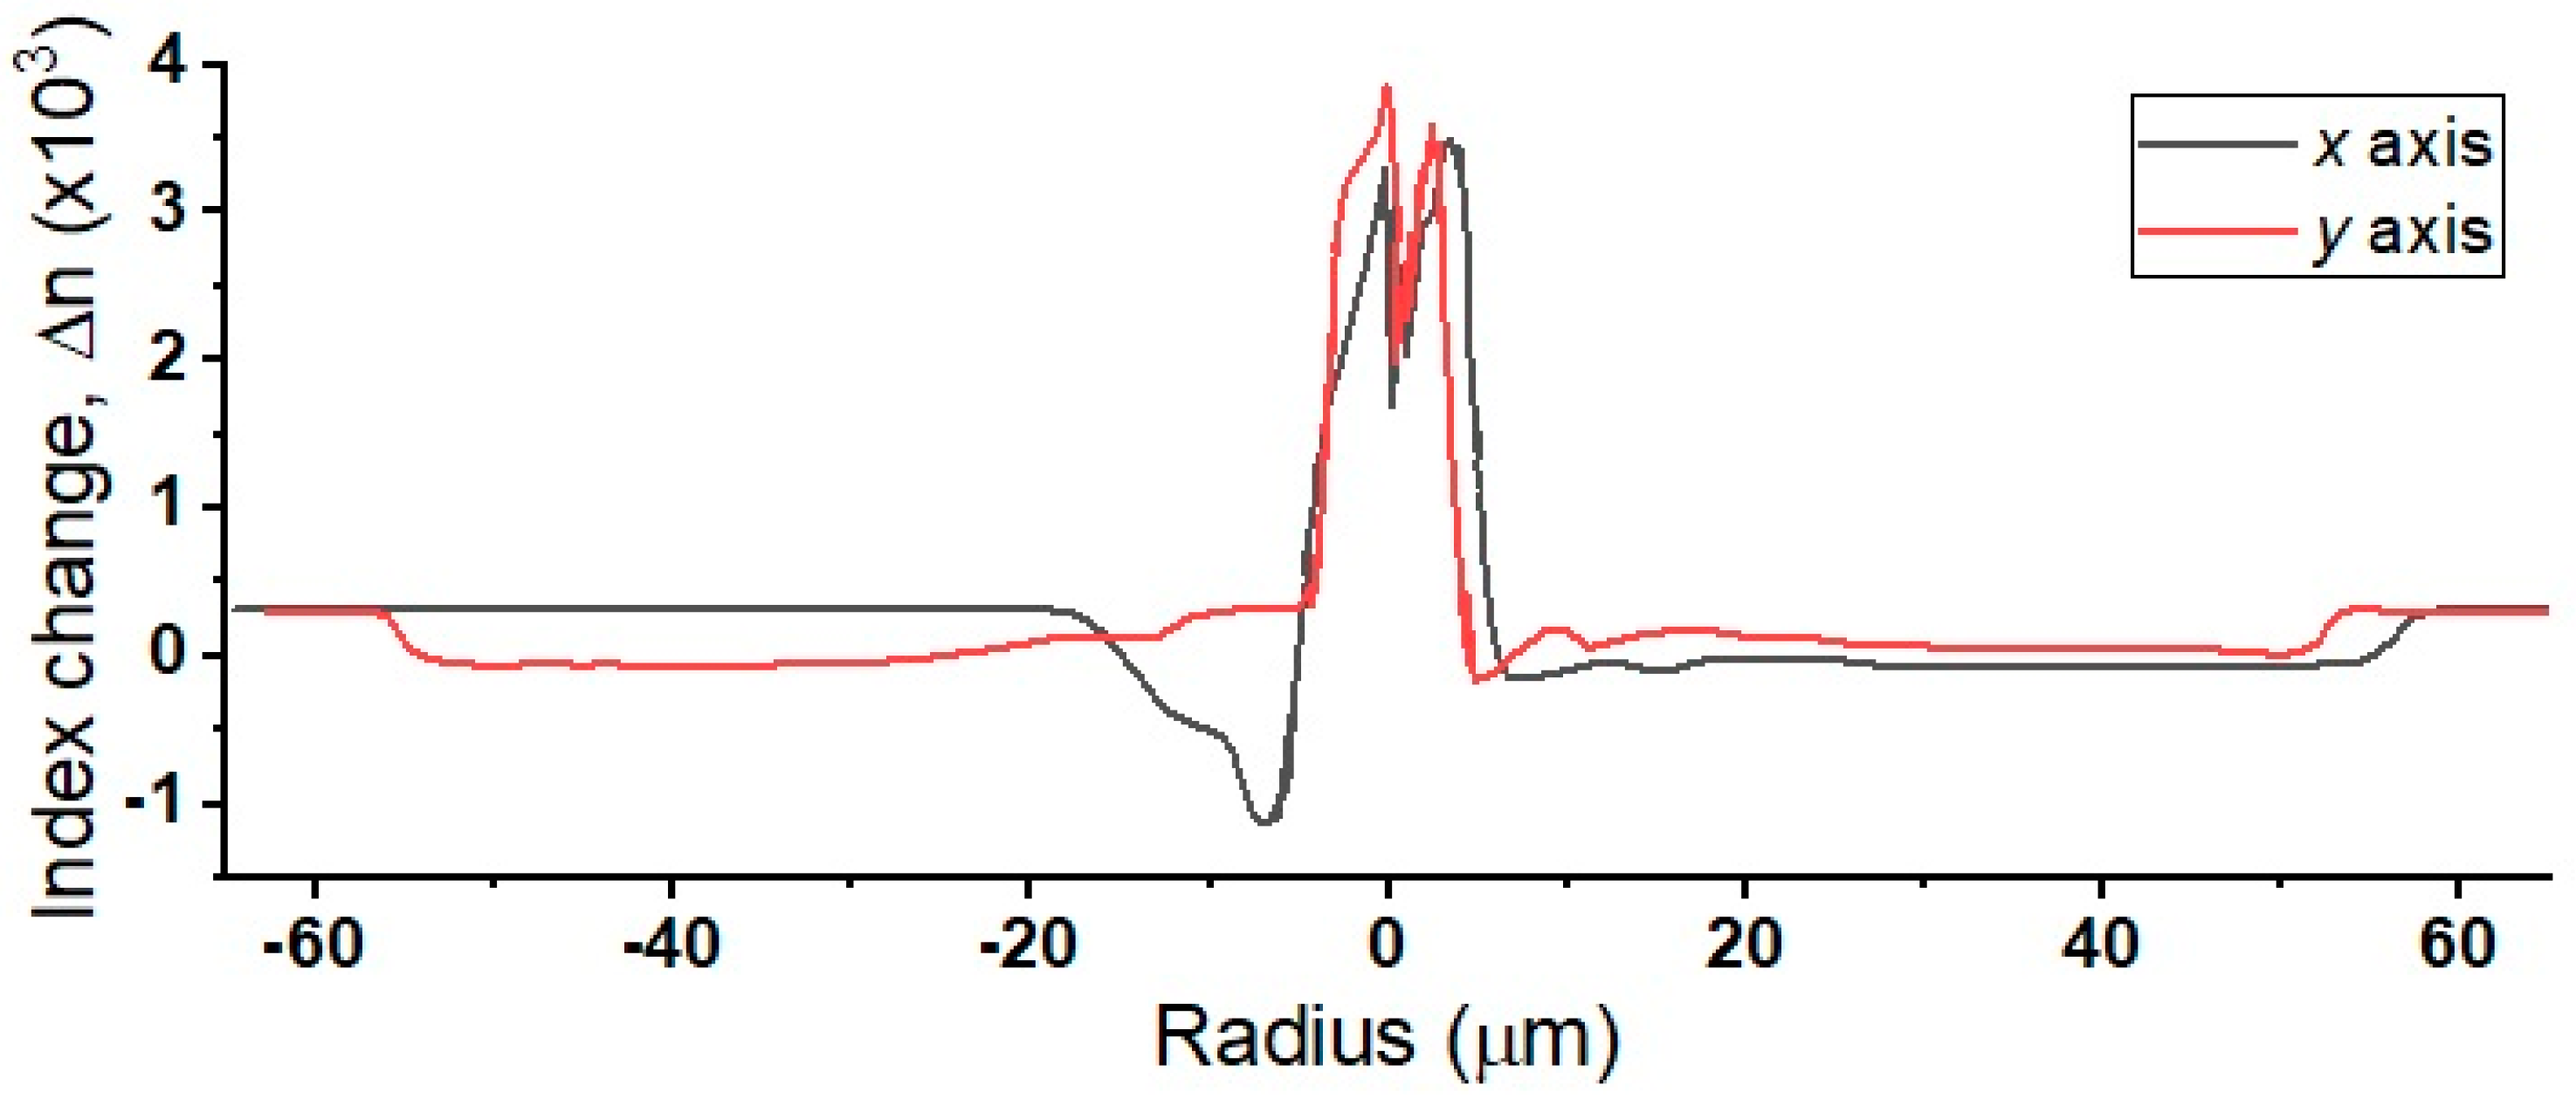
2.2. Side-Exposed Single-Mode Fiber
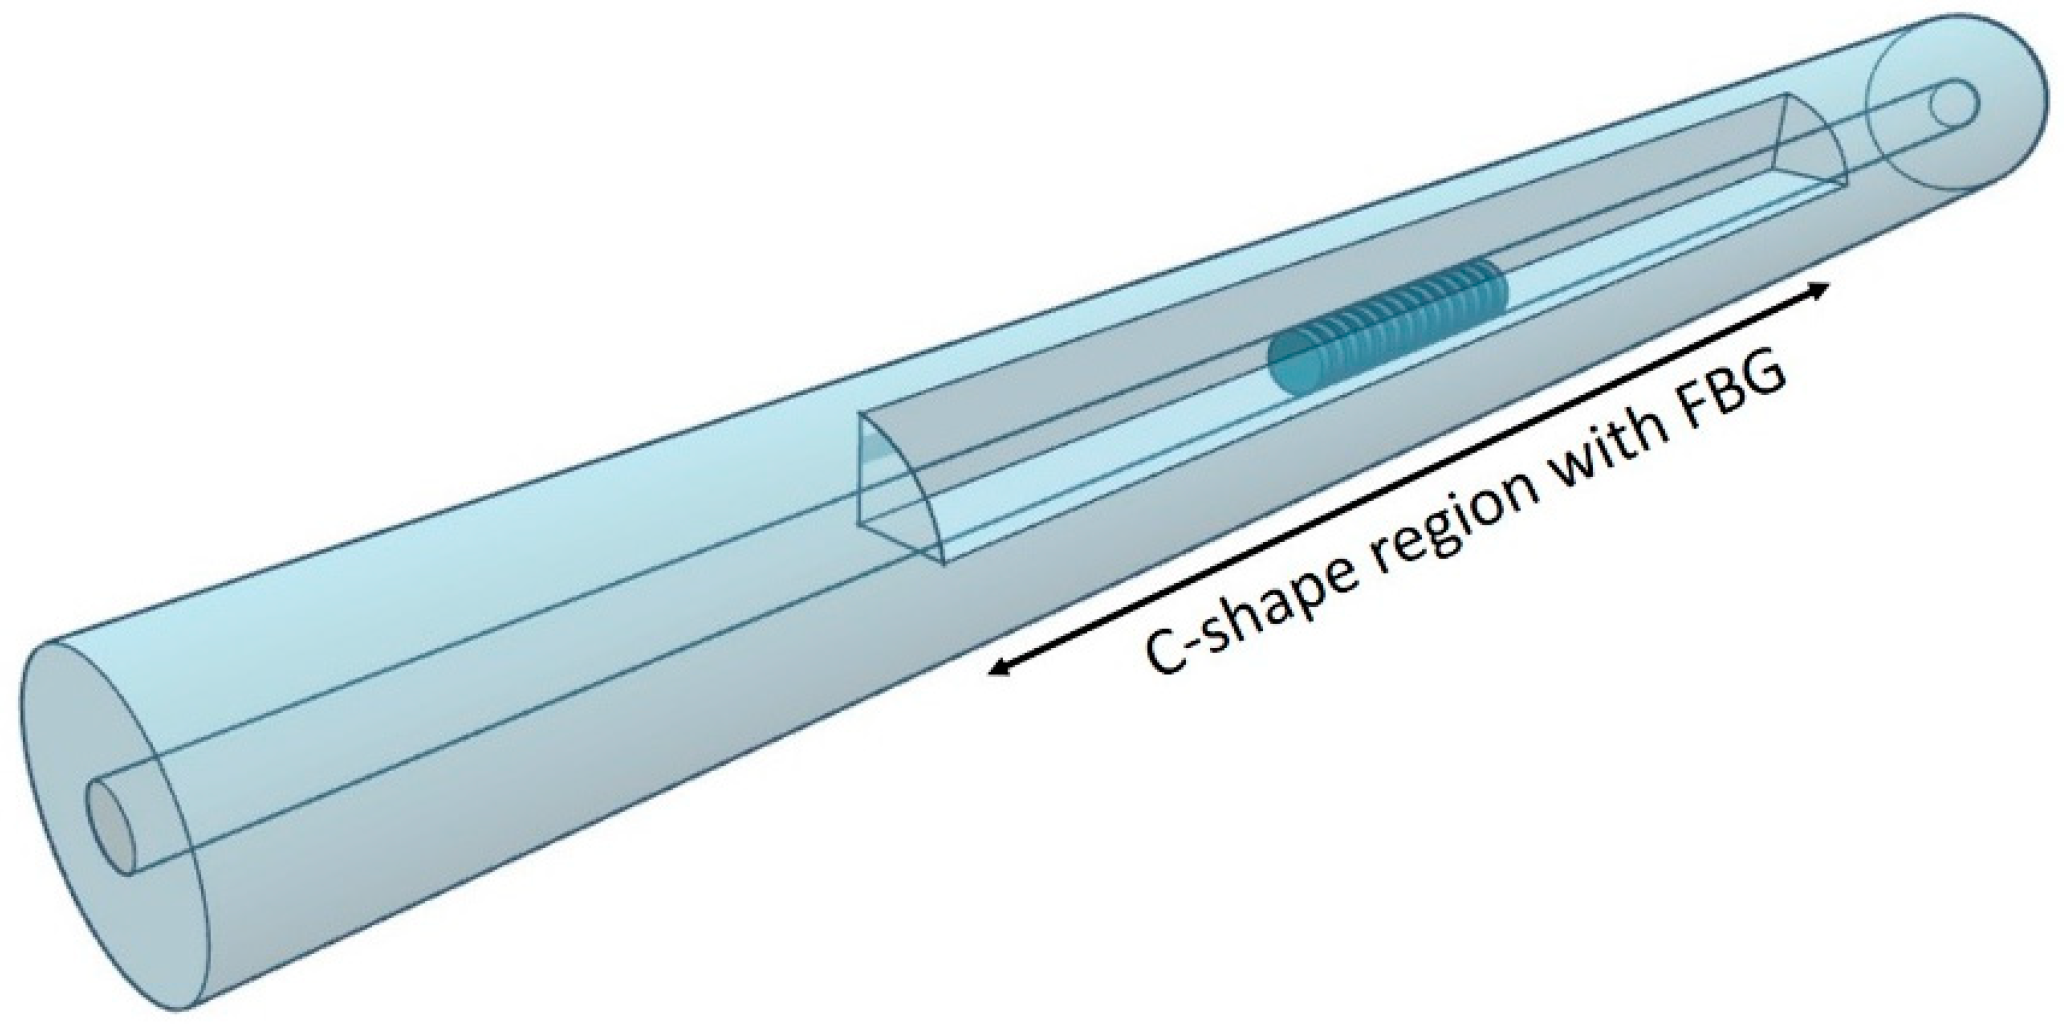
2.3. Fiber Bragg Grating in a C-Fiber
2.4. Temperature Fluctuation Insensitivity
3. Sensor Fabrication and Experiment
3.1. Sensor Fabrication
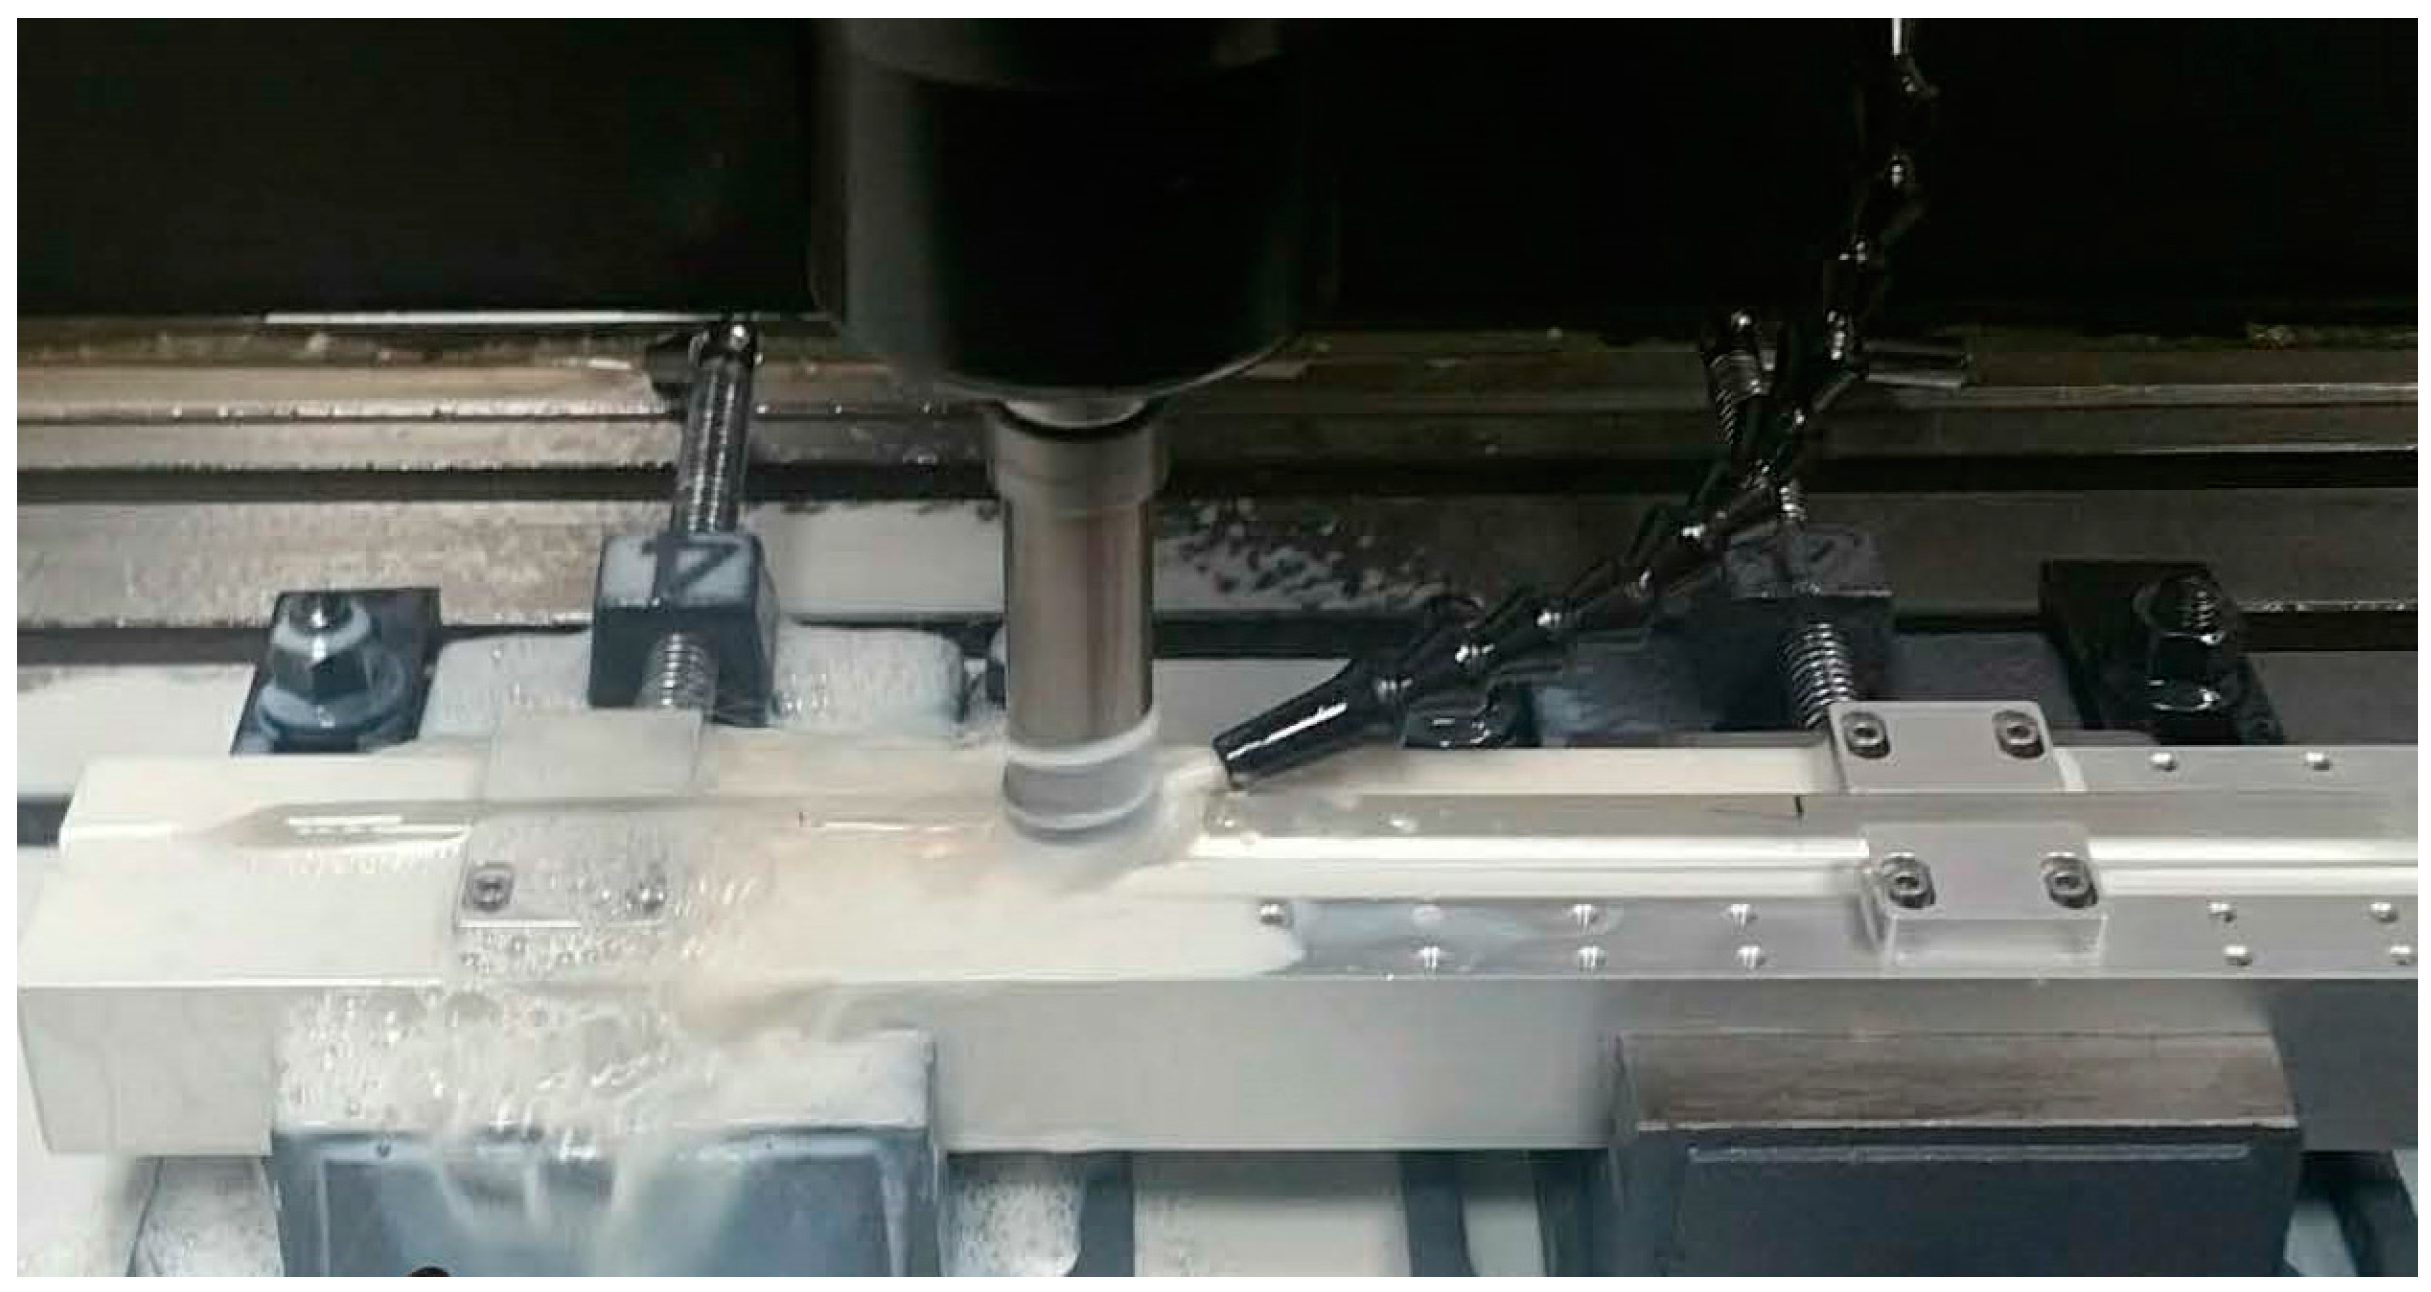
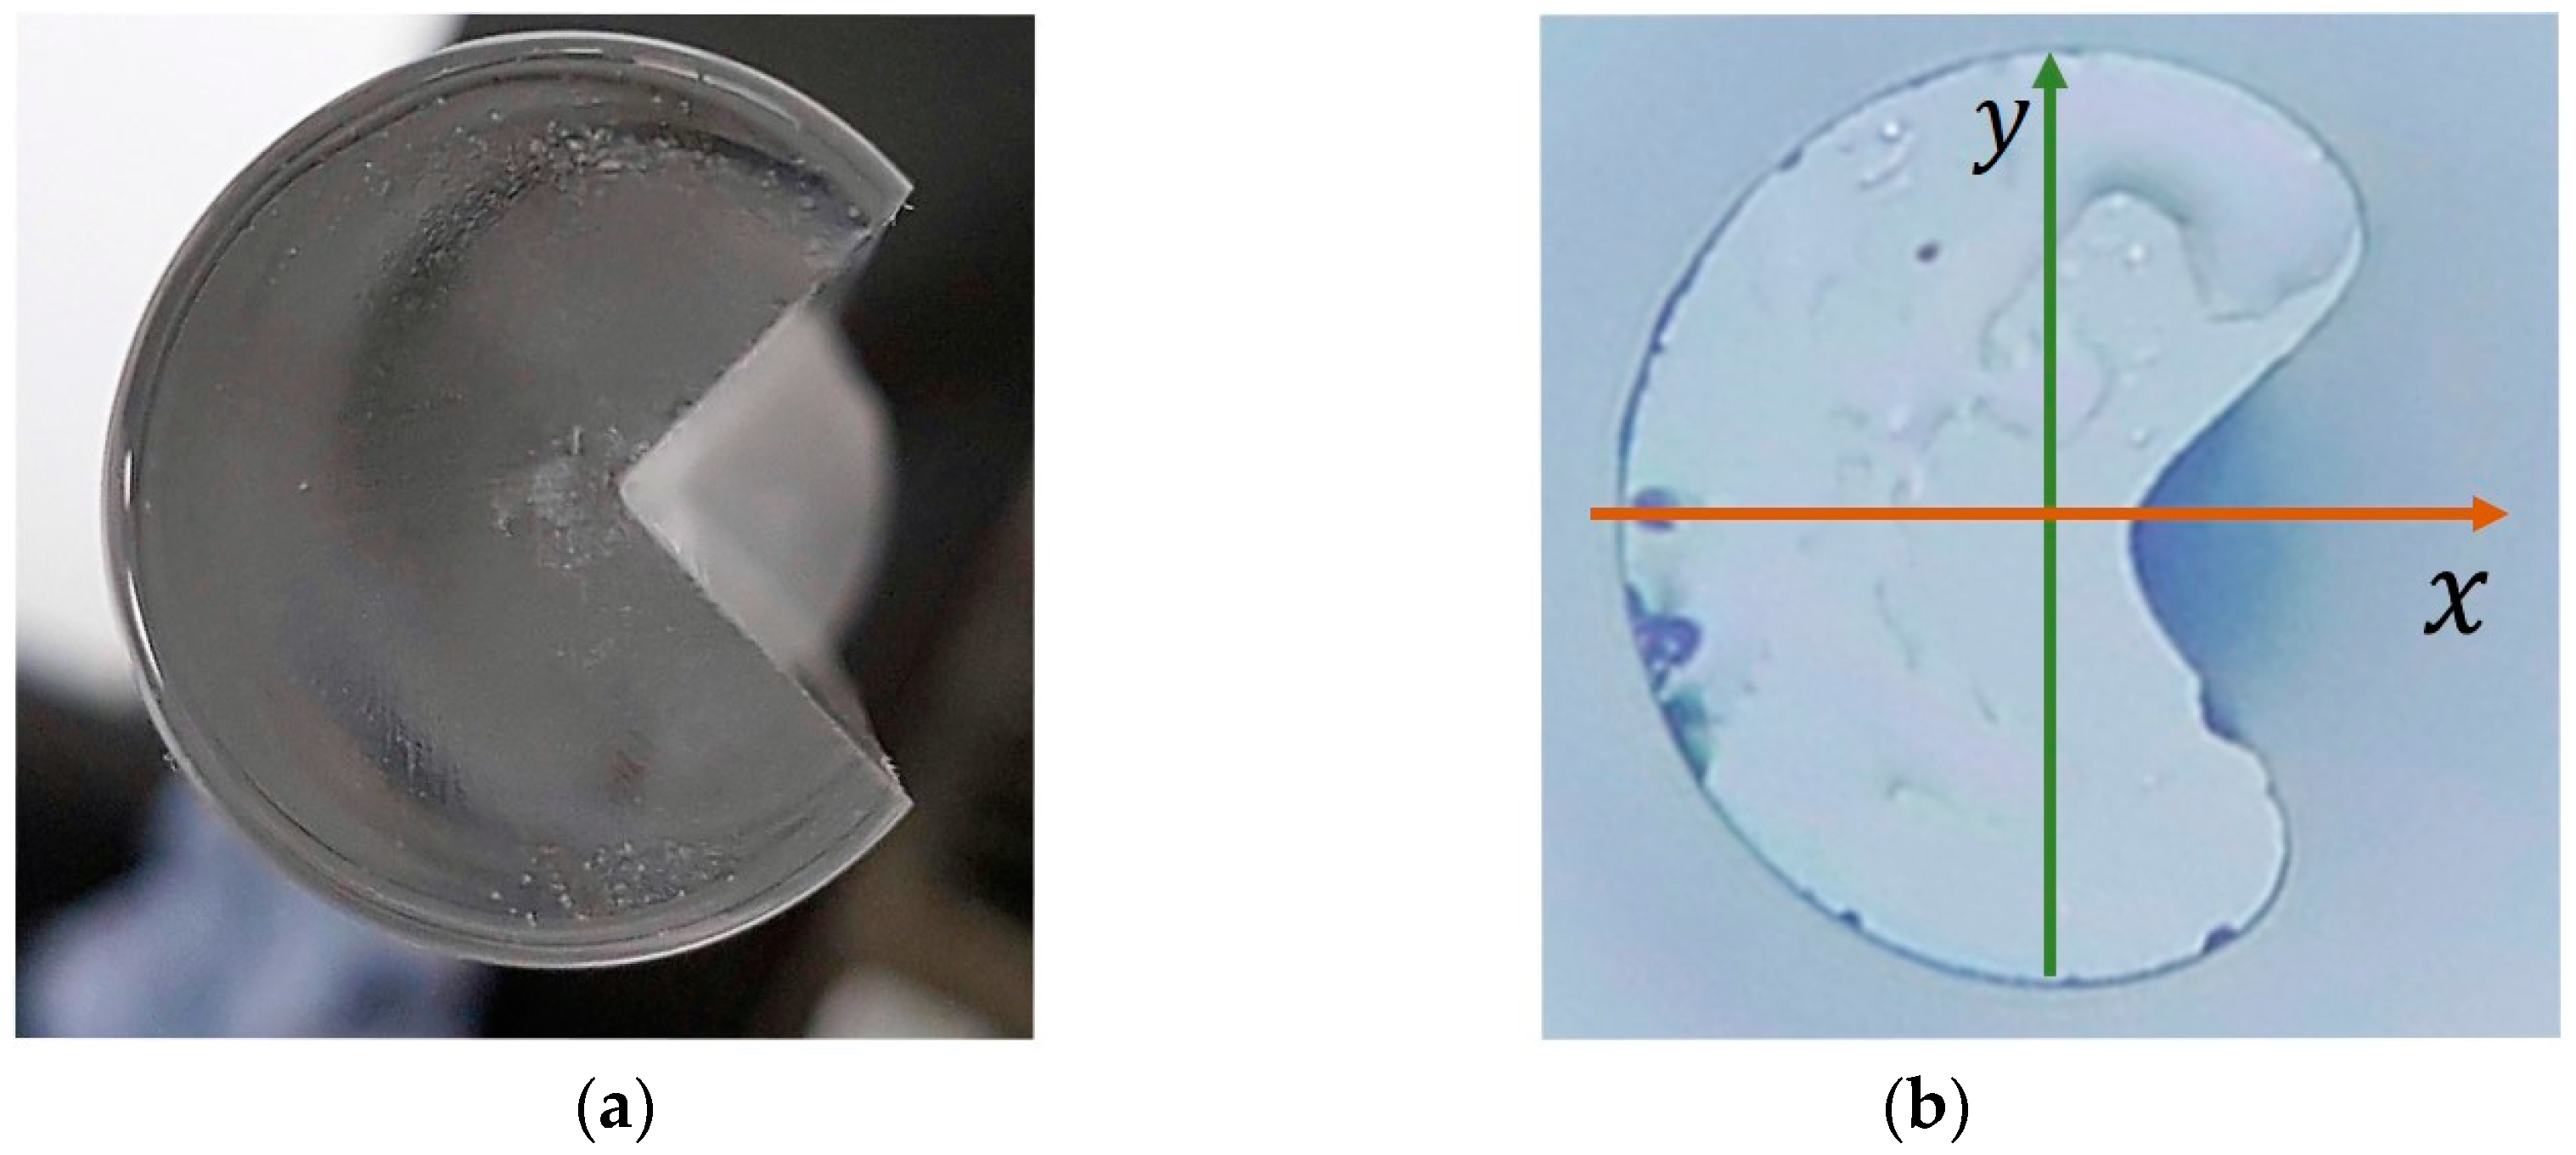
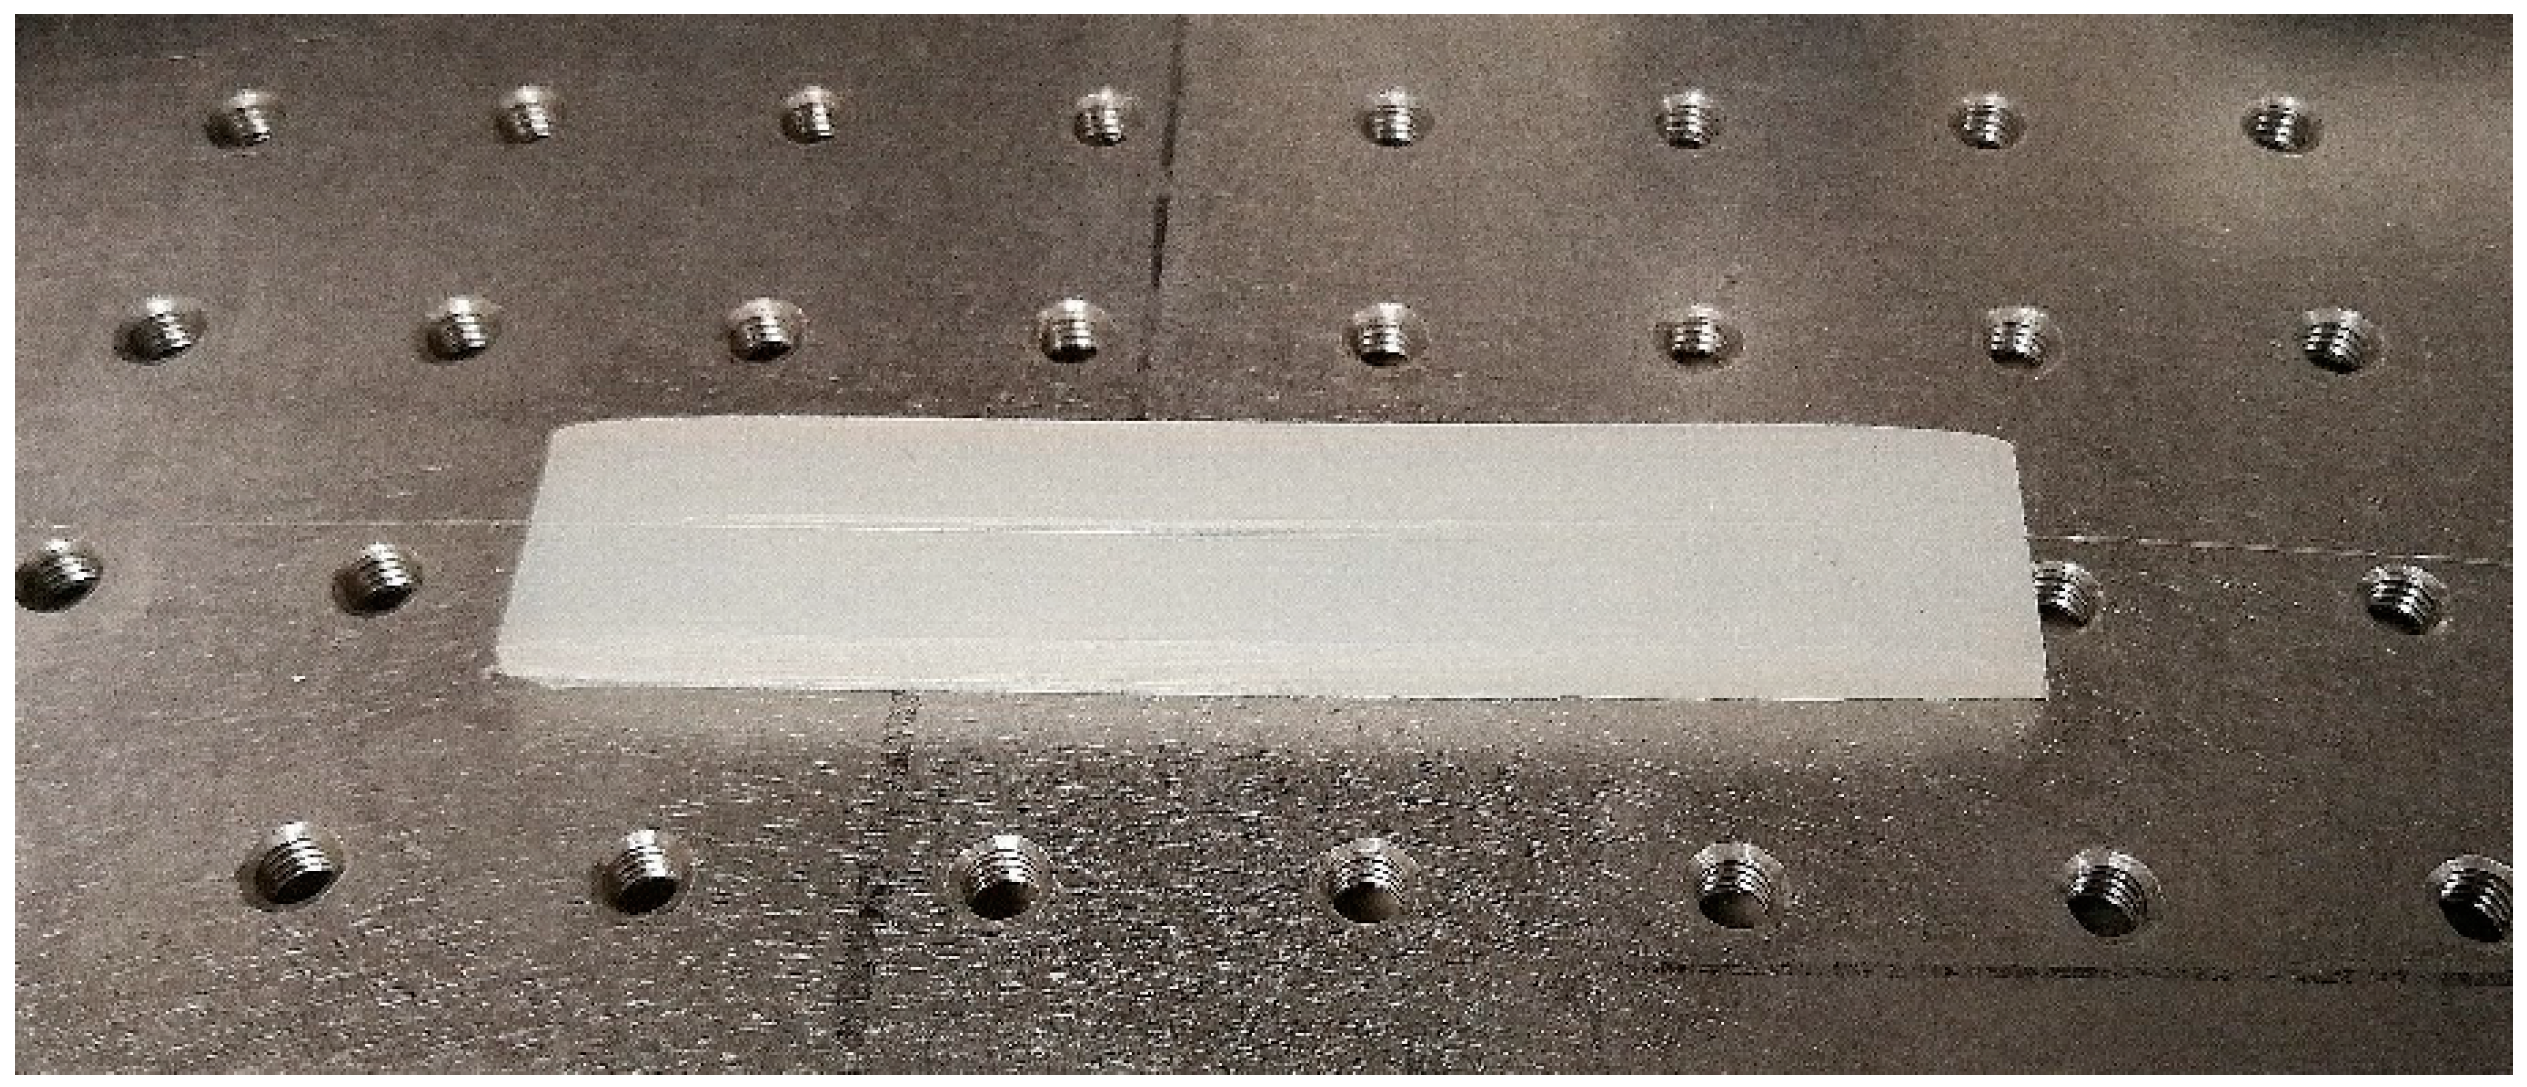
3.1.1. C-Fiber Fabrication
3.1.2. FBG Inscription
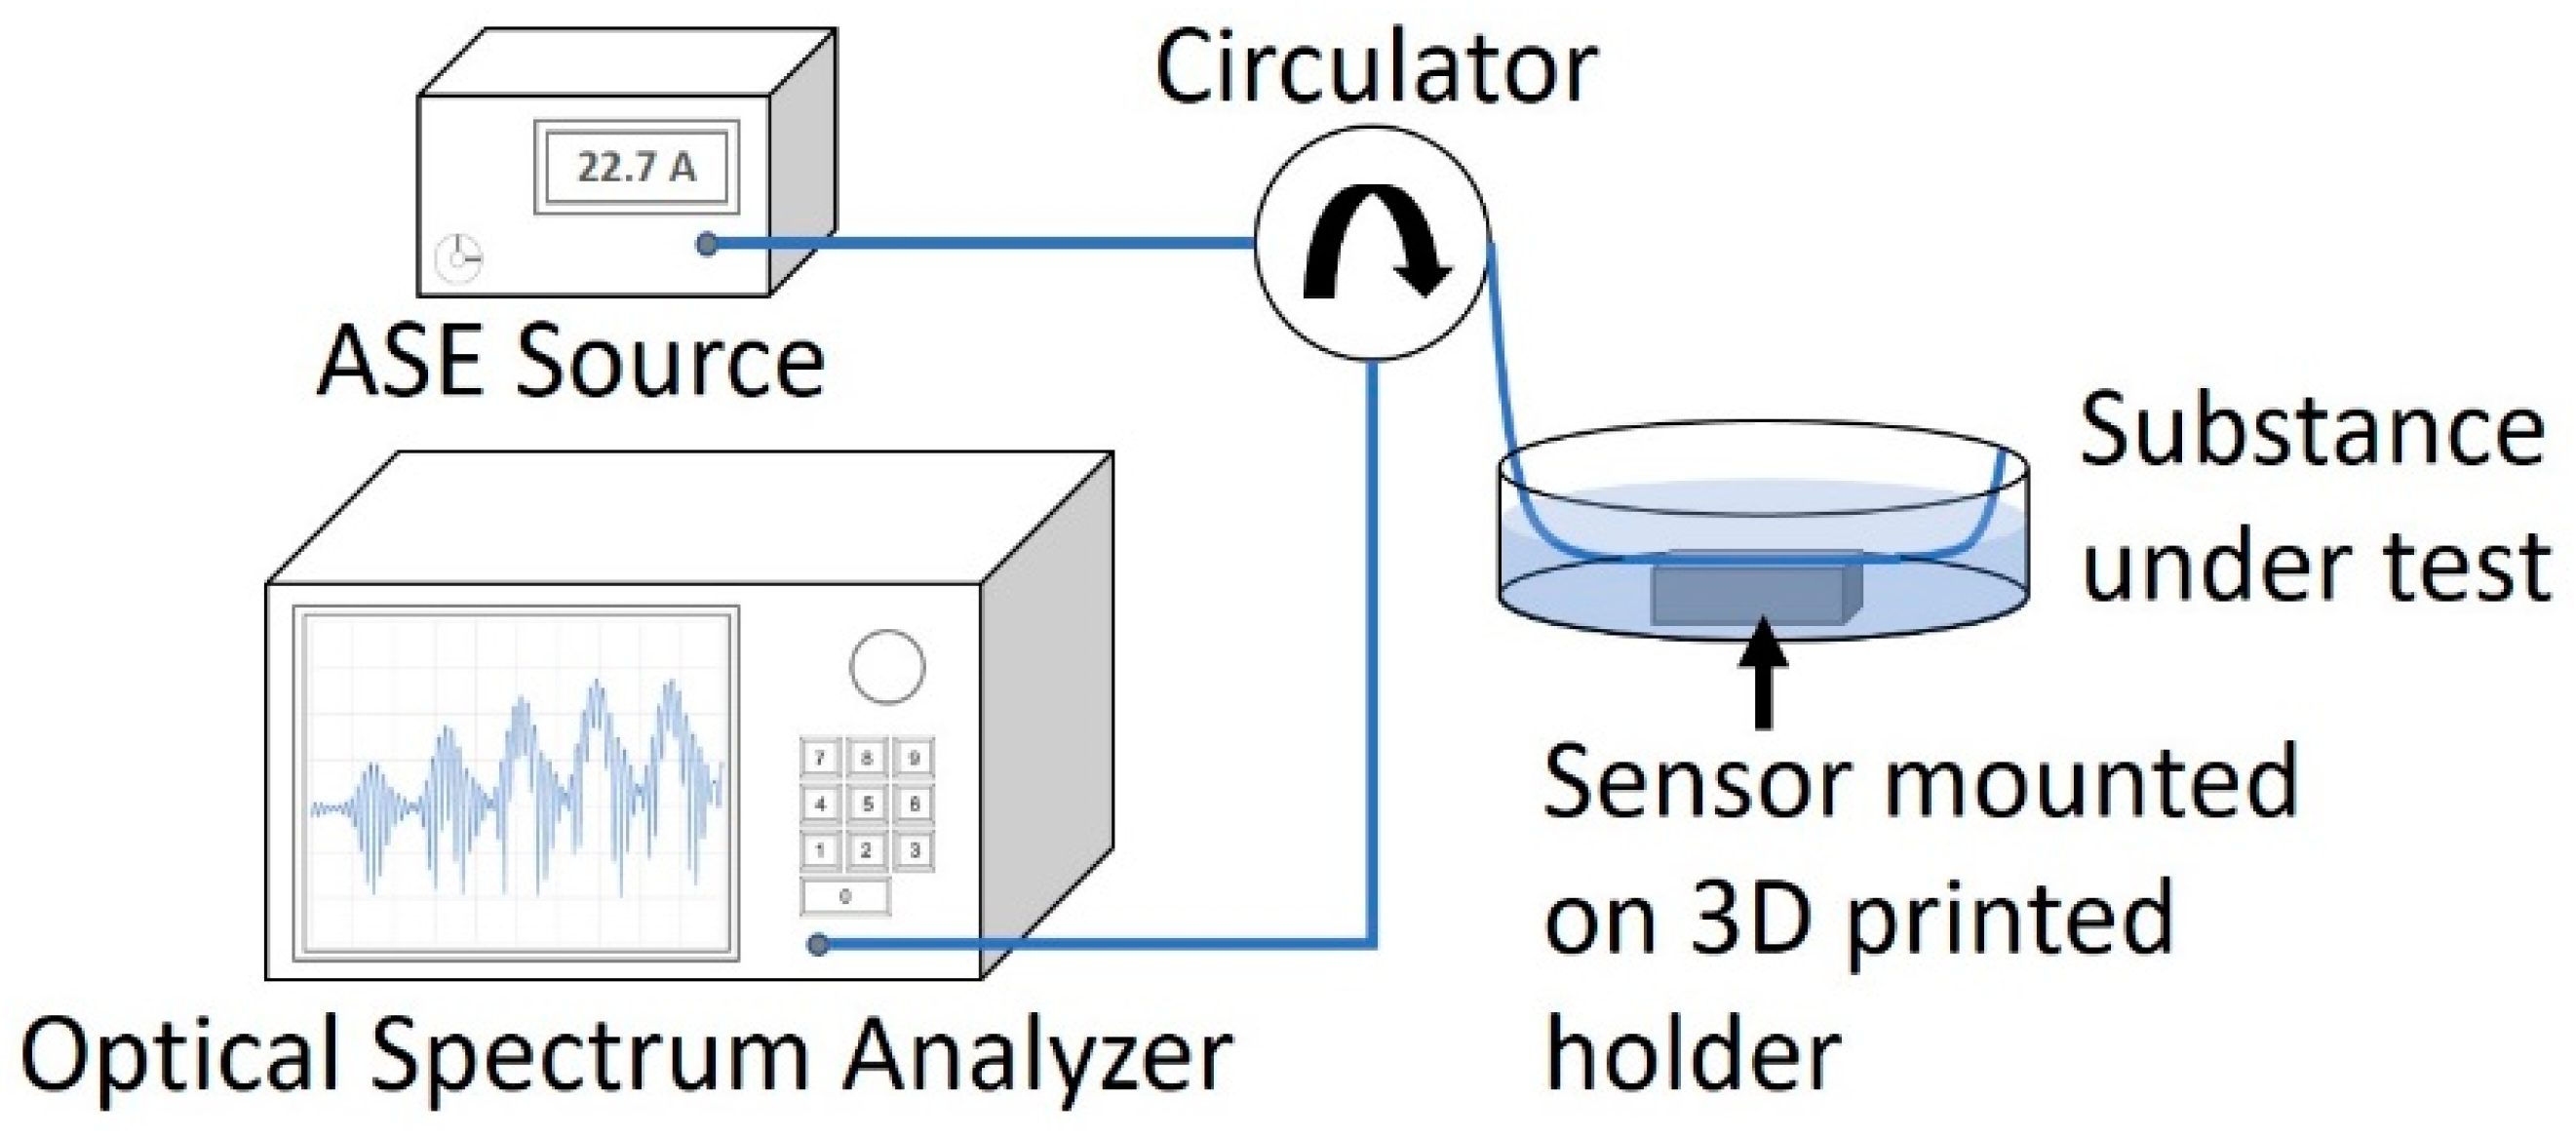
3.2. Experiment
4. Results and Discussions
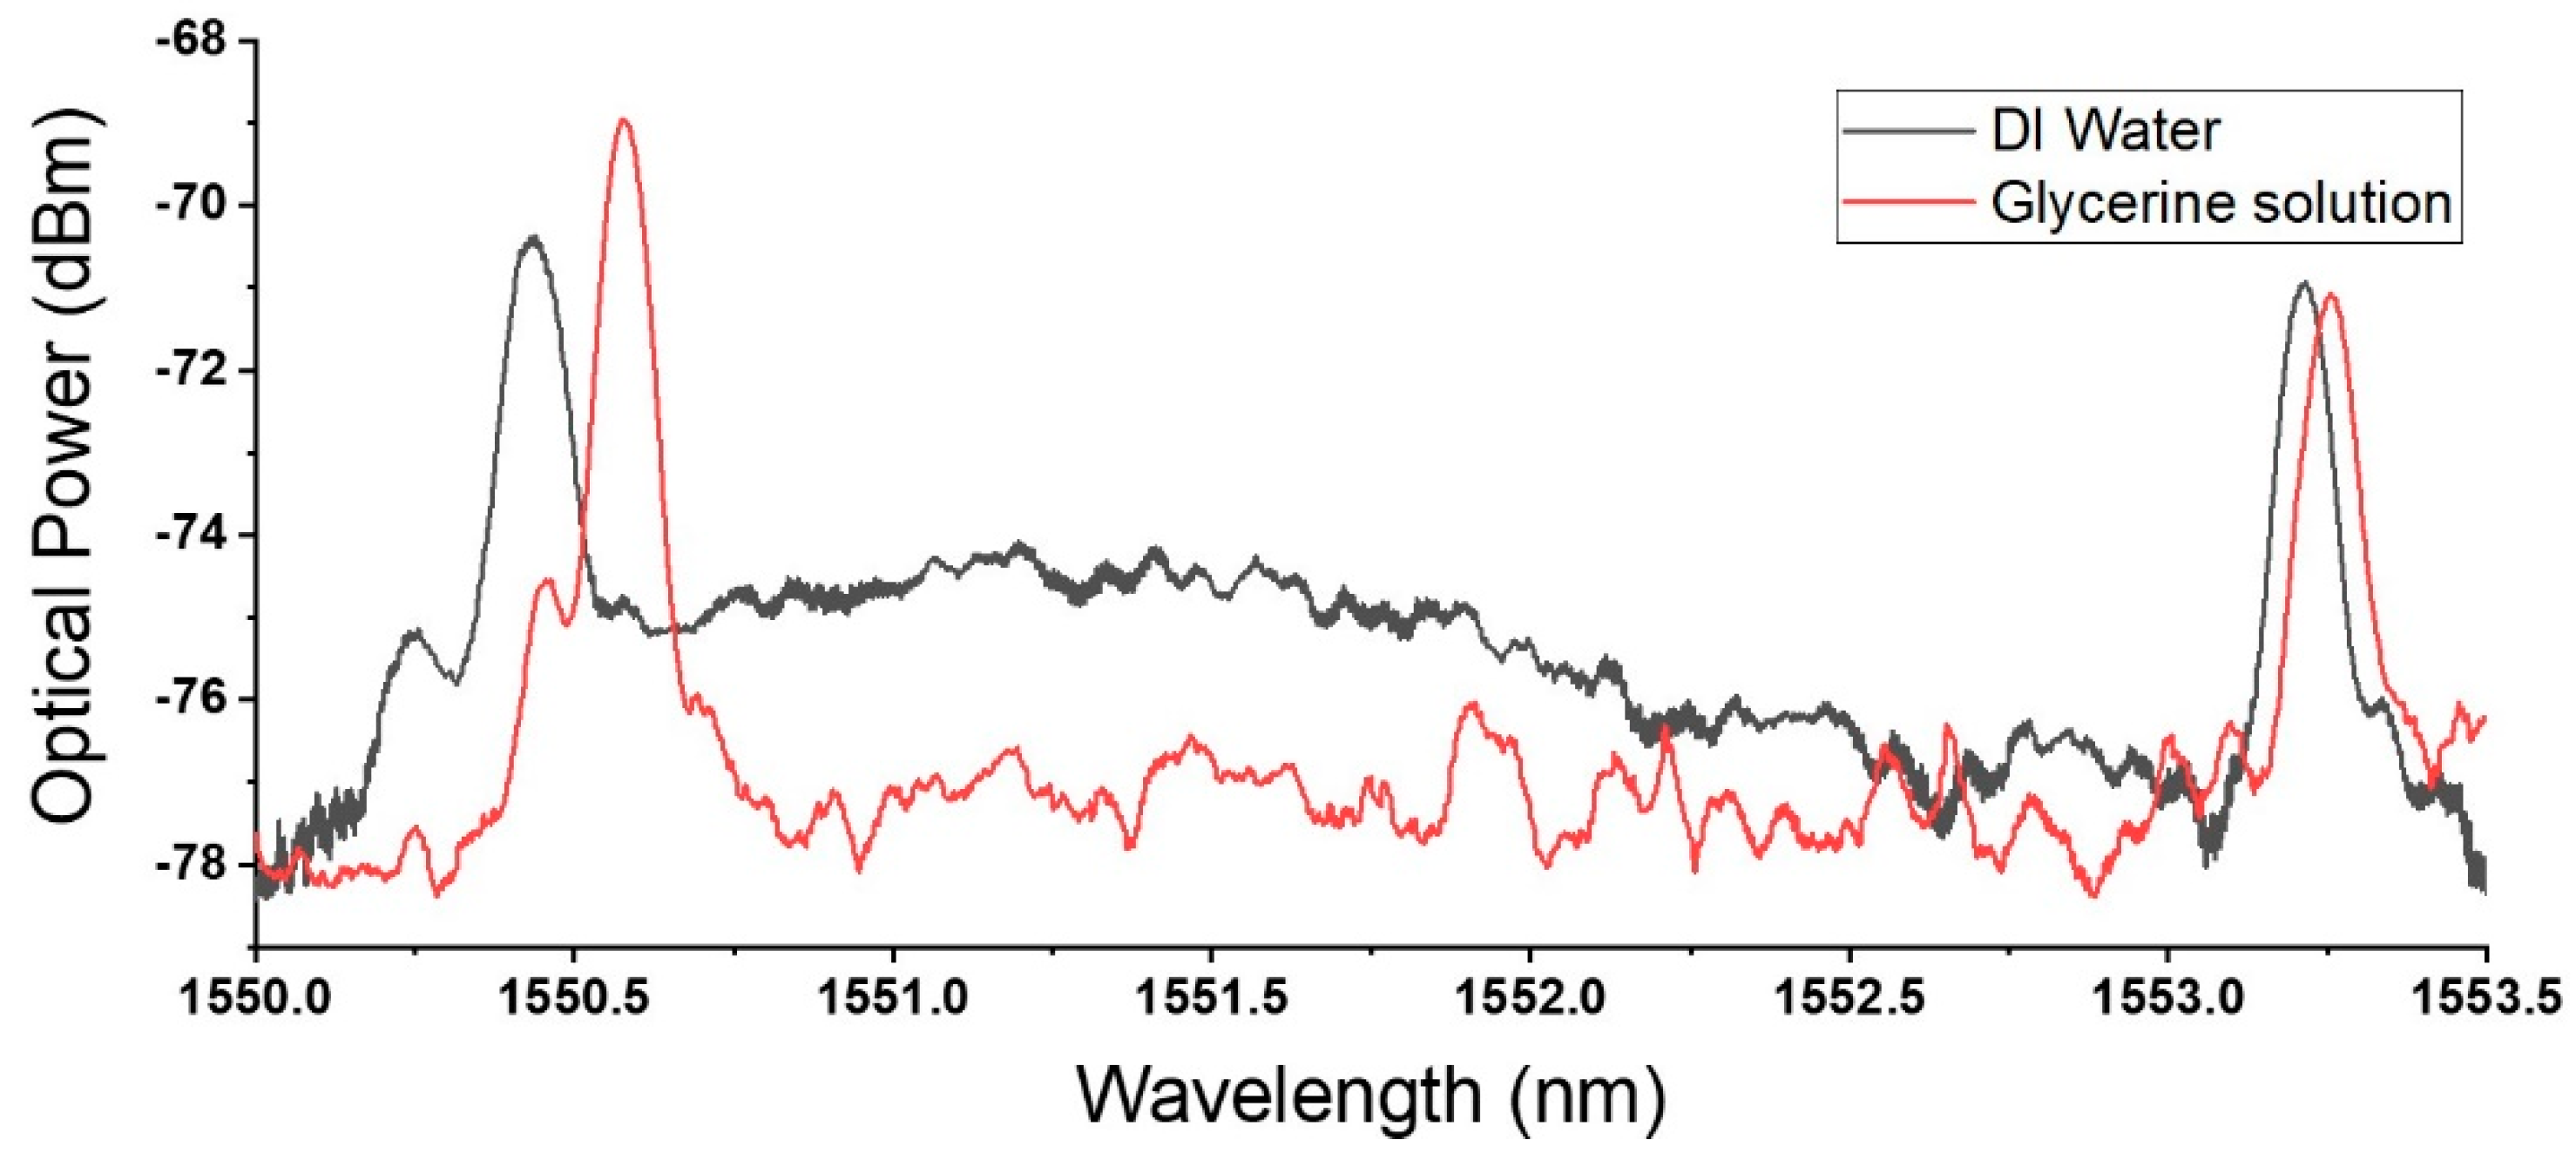
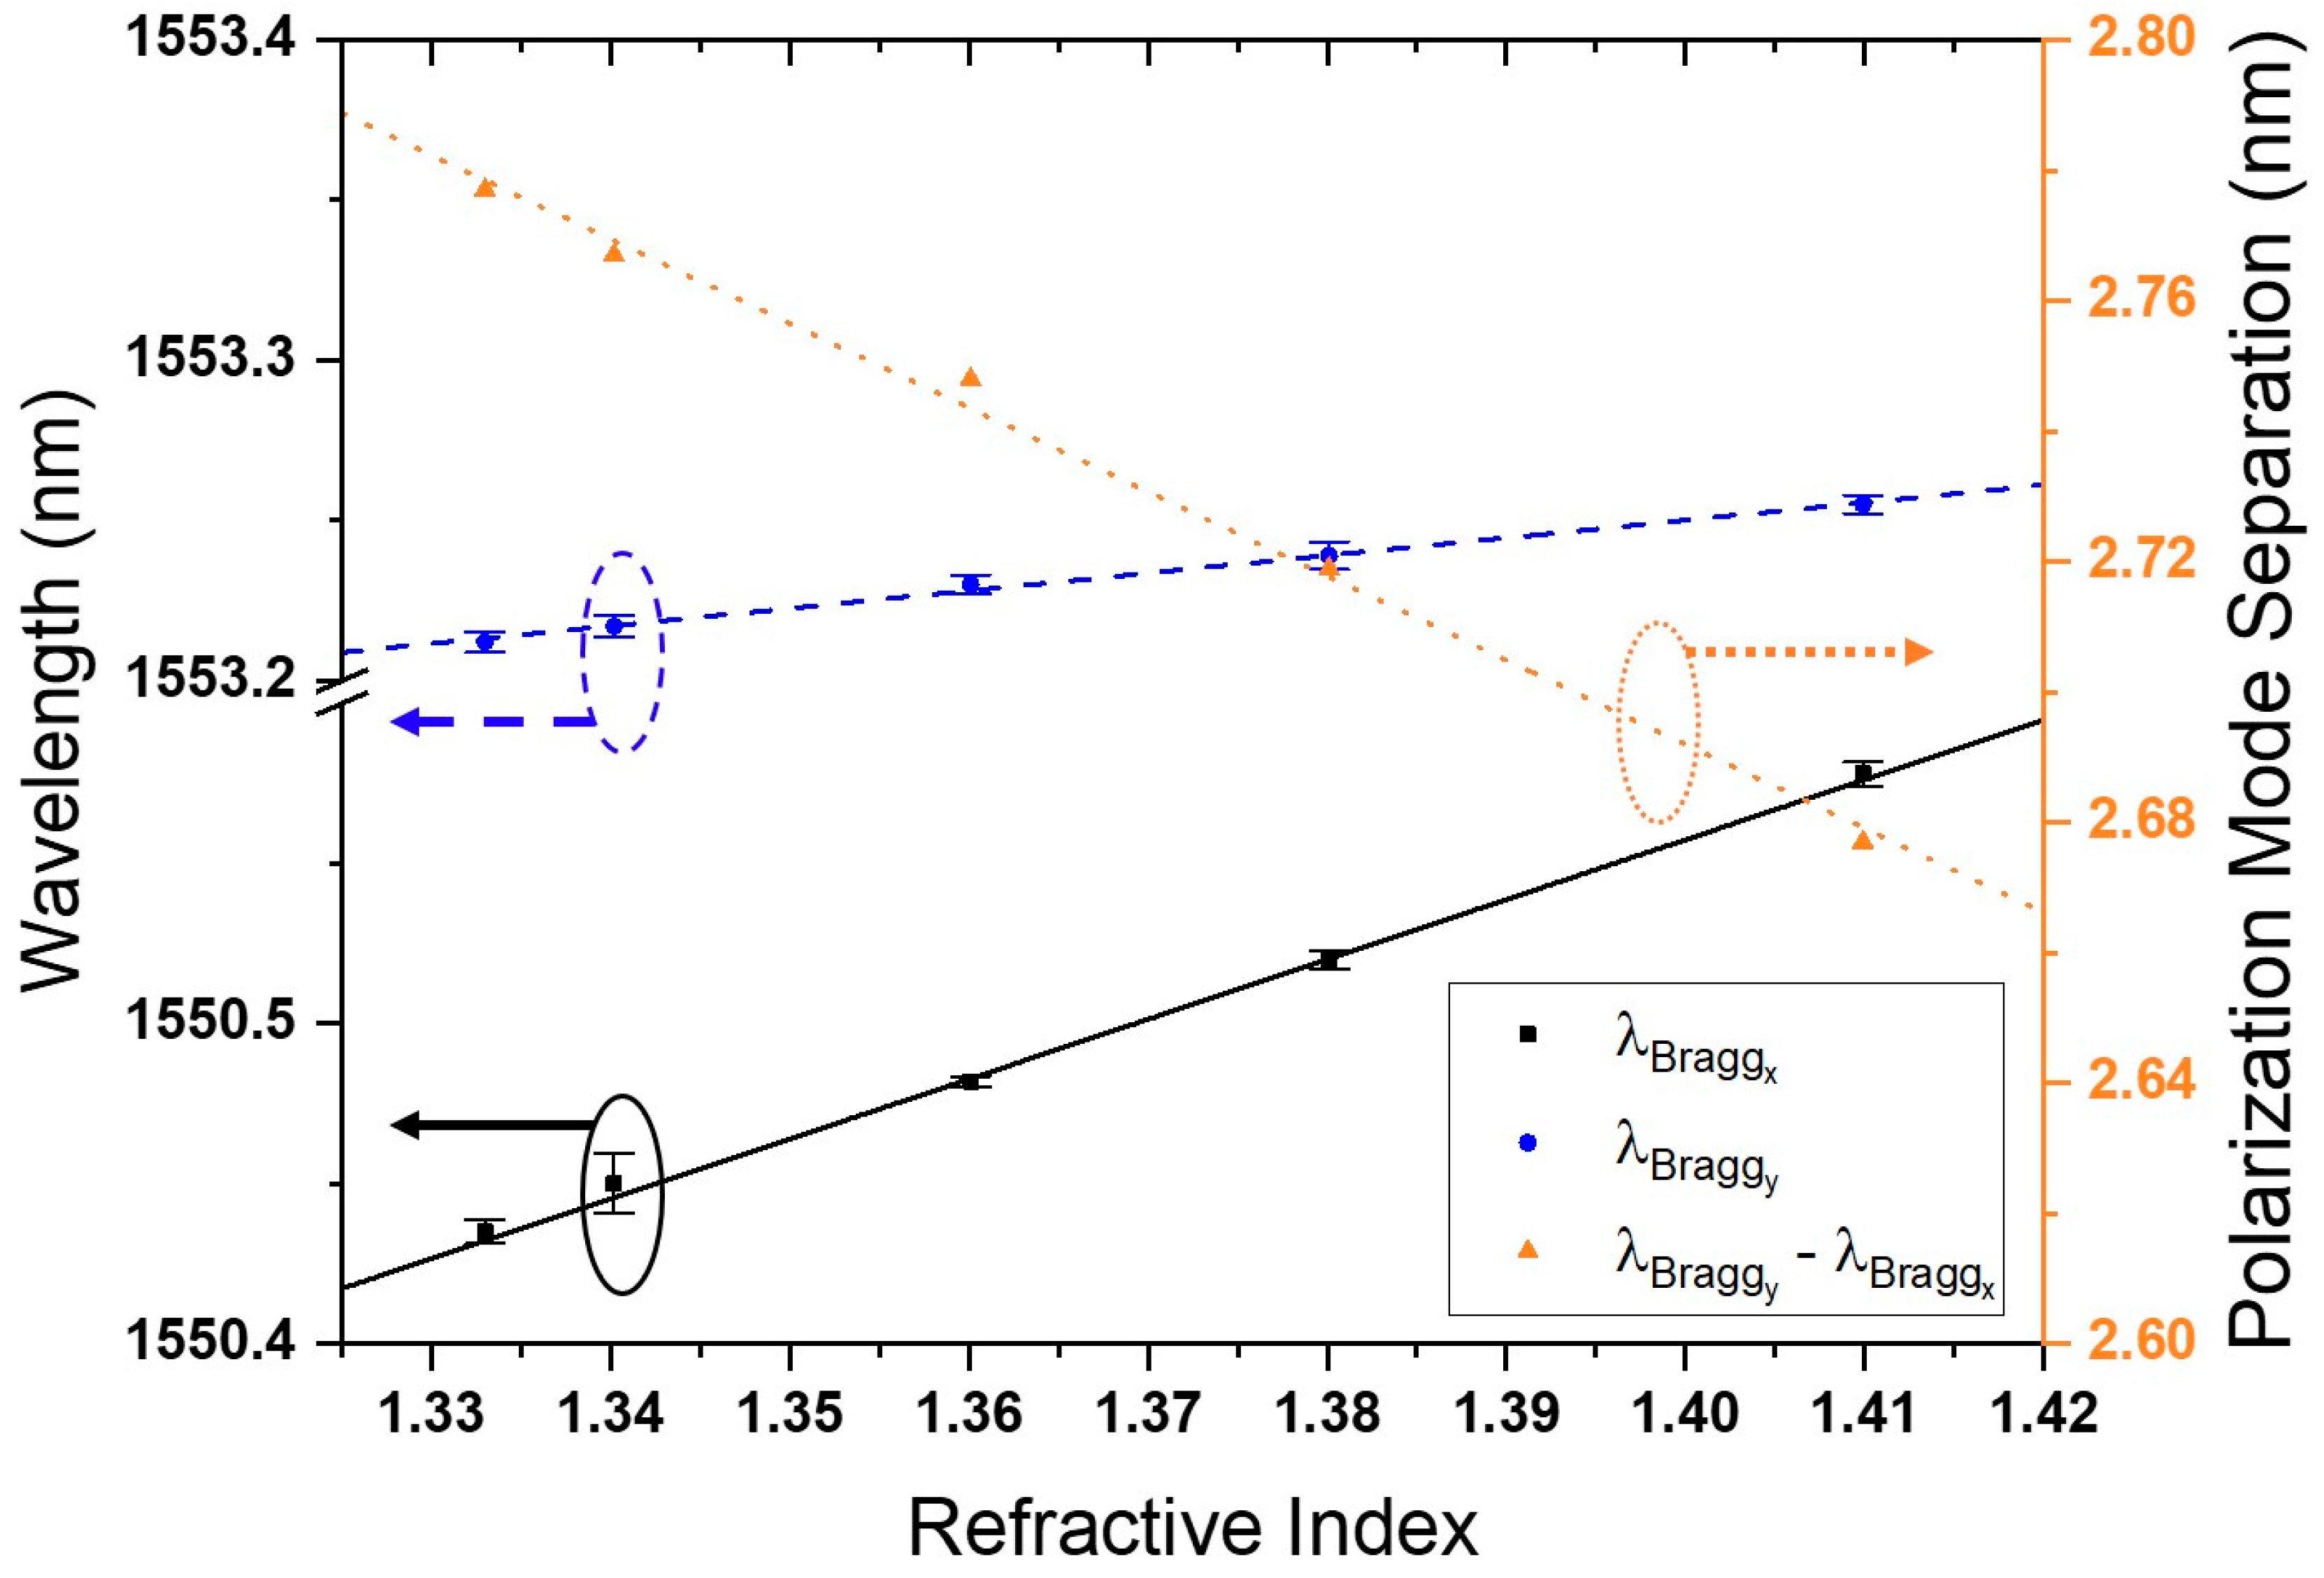
4.1. Refractive Index Measurement
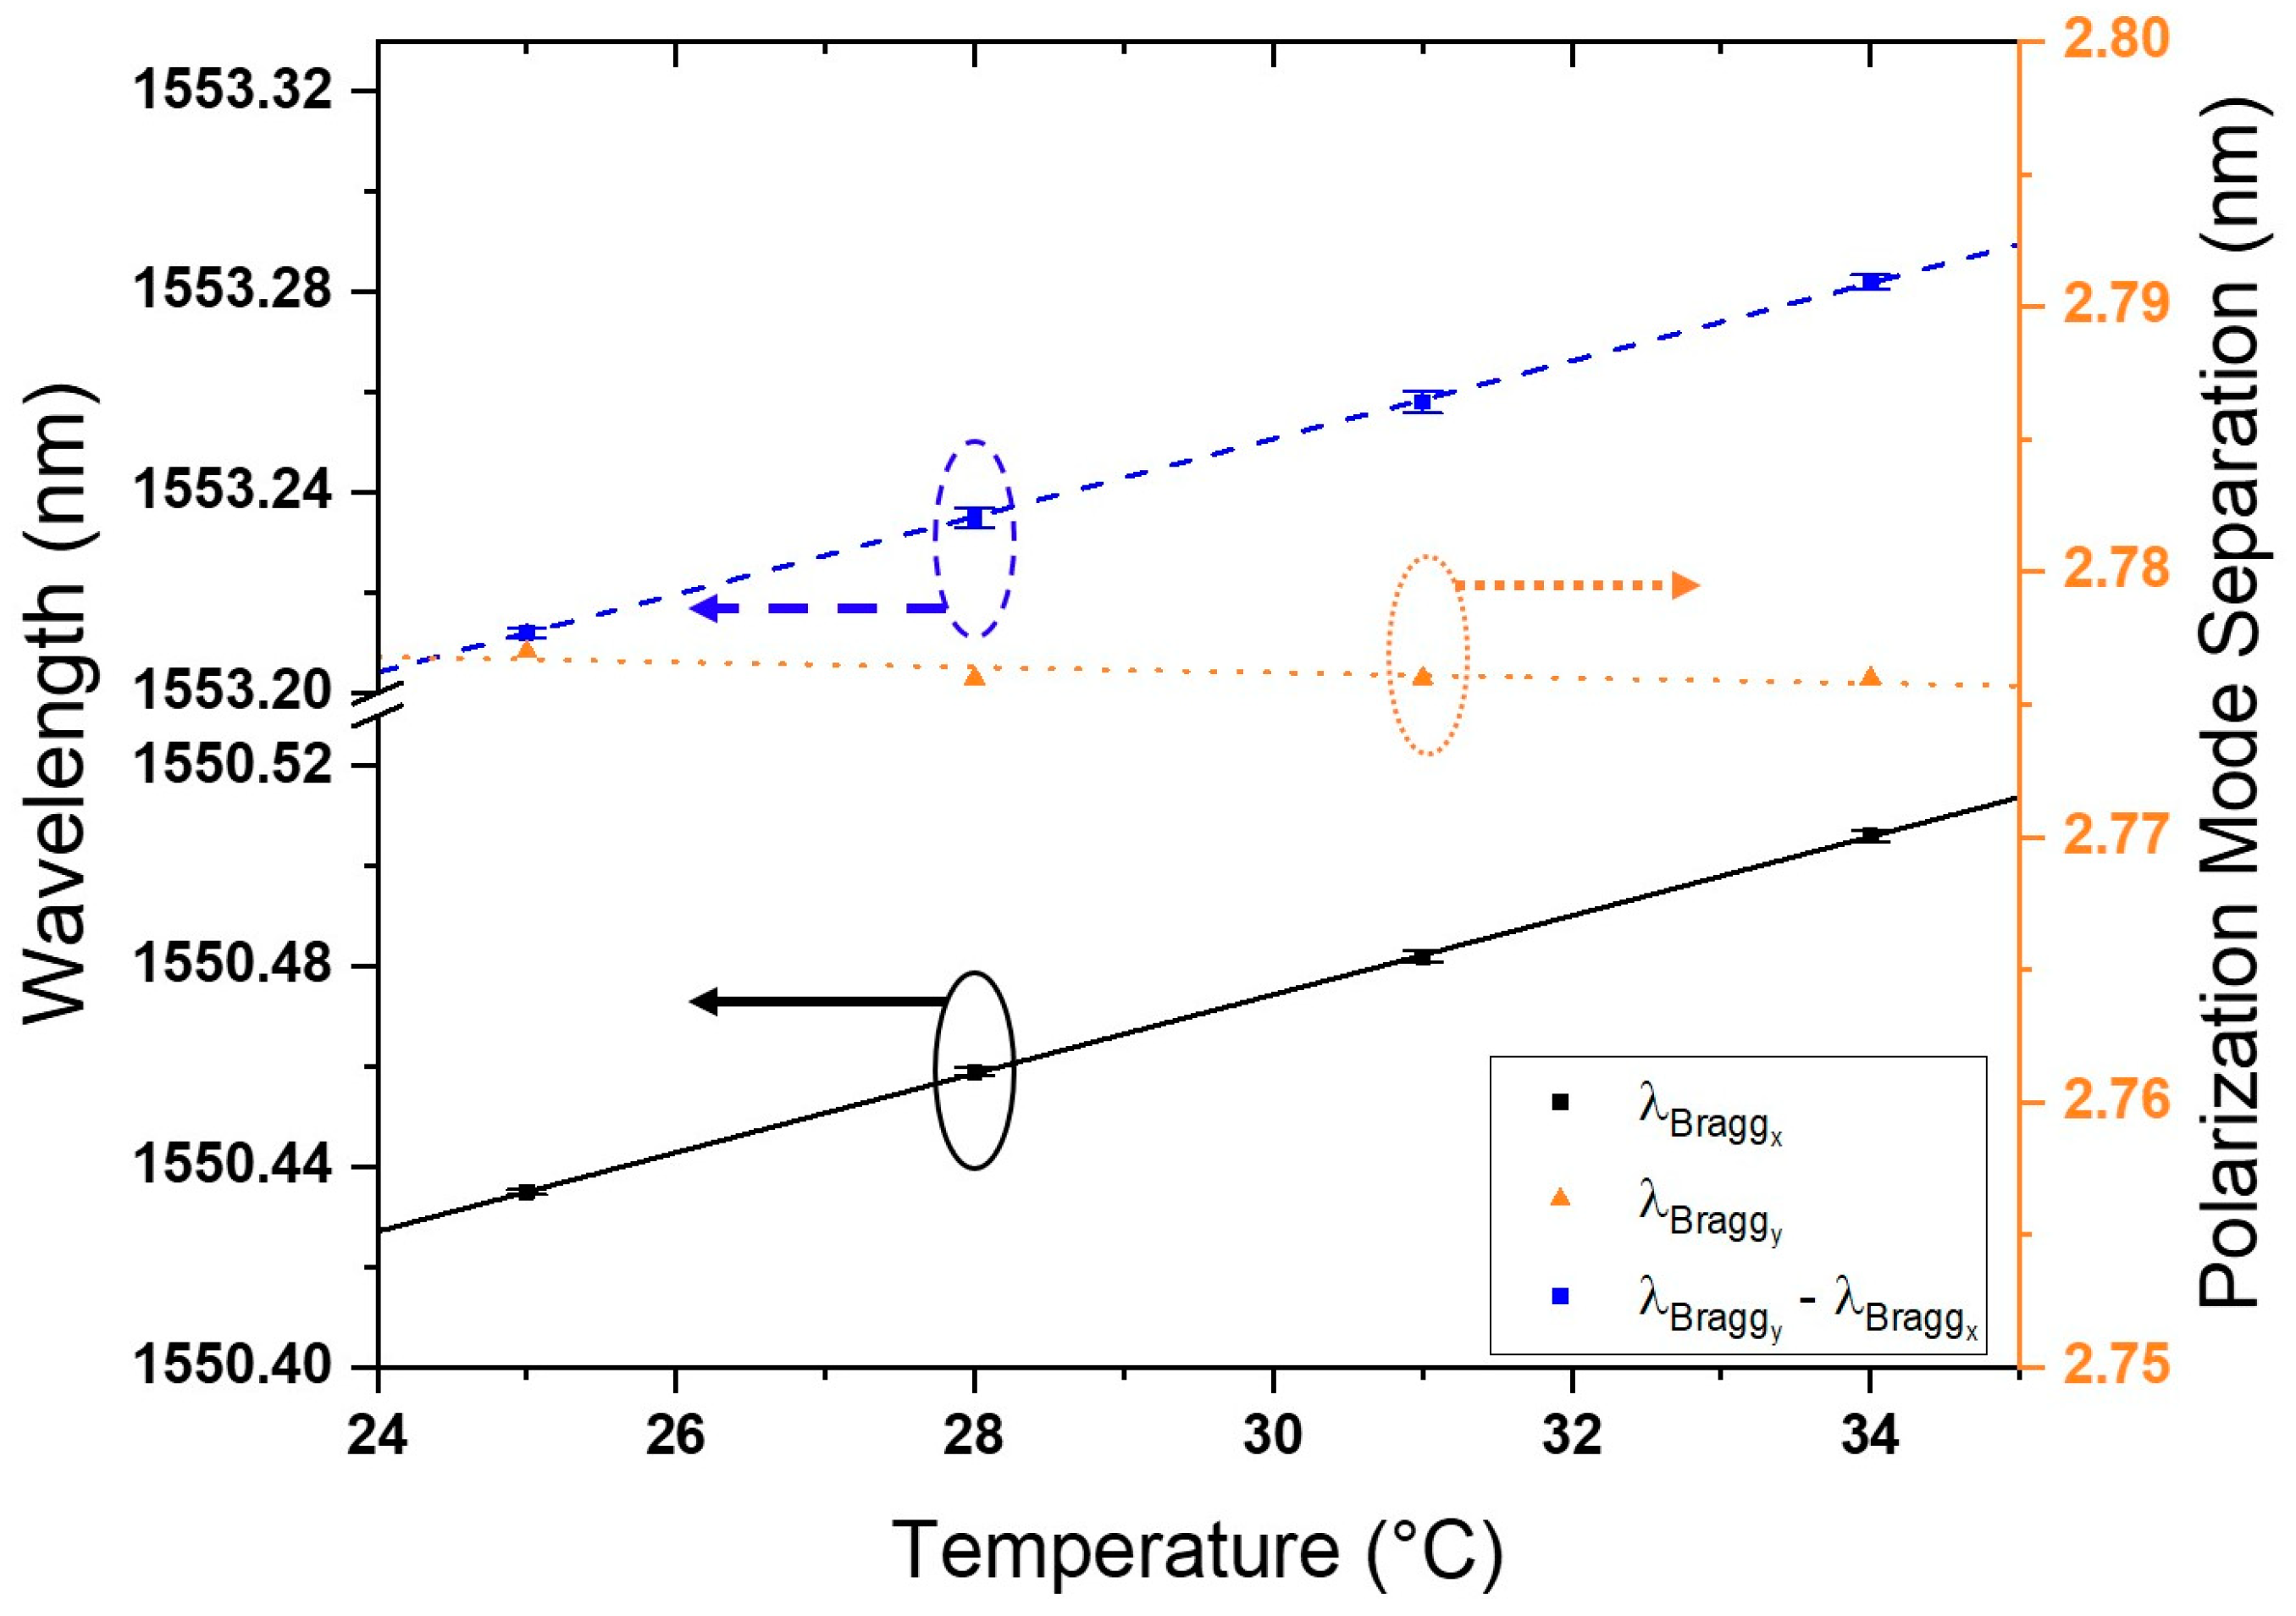
4.2. Temperature Response
5. Conclusions
Author Contributions
Funding
Acknowledgments
Conflicts of Interest
References
- Ji, W.B.; Yap, S.H.K.; Panwar, N.; Zhang, L.L.; Lin, B.; Yong, K.T.; Tjin, S.C.; Ng, W.J.; Majid, M.B.A. Detection of low-concentration heavy metal ions using optical microfiber sensor. Sens. Actuators B Chem. 2016, 237, 142–149. [Google Scholar] [CrossRef]
- Tan, Y.; Tou, Z.; Chow, K.; Chan, C. Graphene-deposited photonic crystal fibers for continuous refractive index sensing applications. Opt. Express 2015, 23, 31286–31294. [Google Scholar] [CrossRef] [PubMed]
- Tan, R.; Yap, S.; Tan, Y.; Tjin, S.; Ibsen, M.; Yong, K.; Lai, W. Functionalized fiber end superstructure fiber bragg grating refractive index sensor for heavy metal ion detection. Sensors 2018, 18, 1821. [Google Scholar] [CrossRef] [PubMed]
- Han, M.; Guo, F.; Lu, Y. Optical fiber refractometer based on cladding-mode bragg grating. Opt. Lett. 2010, 35, 399–401. [Google Scholar] [CrossRef] [PubMed]
- Lo, Y.-L.; Chuang, C.-H. Differential optical fiber refractometer based on a path-matching differential interferometer with temperature compensation. App. Opt. 2001, 40, 3518–3524. [Google Scholar] [CrossRef]
- Harris, J.; Lu, P.; Larocque, H.; Xu, Y.; Chen, L.; Bao, X. Highly sensitive in-fiber interferometric refractometer with temperature and axial strain compensation. Opt. Express 2013, 21, 9996–10009. [Google Scholar] [CrossRef] [PubMed]
- Laffont, G.; Ferdinand, P. Tilted short-period fibre-bragg-grating-induced coupling to cladding modes for accurate refractometry. Meas. Sci. Technol. 2001, 12, 765. [Google Scholar] [CrossRef]
- Wang, Y.; Wang, D.; Liao, C.; Hu, T.; Guo, J.; Wei, H. Temperature-insensitive refractive index sensing by use of micro fabry–pérot cavity based on simplified hollow-core photonic crystal fiber. Opt. Lett. 2013, 38, 269–271. [Google Scholar] [CrossRef] [PubMed]
- Zhou, K.; Chen, X.; Zhang, L.; Bennion, I. Implementation of optical chemsensors based on HF-etched fibre bragg grating structures. Meas. Sci. Technol. 2006, 17, 1140. [Google Scholar] [CrossRef]
- Li, J.; Wang, H.; Sun, L.-P.; Huang, Y.; Jin, L.; Guan, B.-O. Etching bragg gratings in panda fibers for the temperature-independent refractive index sensing. Opt. Express 2014, 22, 31917–31923. [Google Scholar] [CrossRef] [PubMed]
- Frazão, O.; Martynkien, T.; Baptista, J.; Santos, J.; Urbanczyk, W.; Wojcik, J. Optical refractometer based on a birefringent bragg grating written in an H-shaped fiber. Opt. Lett. 2009, 34, 76–78. [Google Scholar] [CrossRef] [PubMed]
- Ran, Y.; Jin, L.; Sun, L.-P.; Li, J.; Guan, B.-O. Bragg gratings in rectangular microfiber for temperature independent refractive index sensing. Opt. Lett. 2012, 37, 2649–2651. [Google Scholar] [CrossRef] [PubMed]
- Zhang, Q.; Hu, L.; Qi, Y.; Liu, G.; Ianno, N.; Han, M. Fiber-optic refractometer based on a phase-shifted fiber bragg grating on a side-hole fiber. Opt. Express 2015, 23, 16750–16759. [Google Scholar] [CrossRef] [PubMed]
- Namiq, M.F.; Ibsen, M. Hydrofluoric Acid Refractive Index Determination Using In-Situ Monitoring of Etched Fibre Bragg Gratings. In Proceedings of the Advanced Photonics 2015, Boston, MA, USA, 27 June–1 July 2015; Optical Society of America: San Diego, CA, USA, 2015. [Google Scholar]
- Lindner, E.; Hartung, A.; Hoh, D.; Chojetzki, C.; Schuster, K.; Bierlich, J.; Rothhardt, M. Trends and Future of Fiber Bragg Grating Sensing Technologies: Tailored Draw Tower Gratings (Dtgs). In Optical Sensing and Detection III; International Society for Optics and Photonics: San Diego, CA, USA, 2014; p. 91410X. [Google Scholar]
- Rothhardt, M.; Becker, M.; Chojetzki, C.; Lindner, E.; Bartelt, H. Fabrication and Applications of Draw Tower Gratings. In Proceedings of the Bragg Gratings, Photosensitivity, and Poling in Glass Waveguides 2016, Sydney, Australia, 5–8 September 2016; Optical Society of America: San Diego, CA, USA, 2016. [Google Scholar]
- Qazi, H.H.; Mohammad, A.B.; Ahmad, H.; Zulkifli, M.Z. D-shaped polarization maintaining fiber sensor for strain and temperature monitoring. Sensors 2016, 16, 1505. [Google Scholar] [CrossRef] [PubMed]
- Guan, B.-O.; Tam, H.-Y.; Tao, X.-M.; Dong, X.-Y. Simultaneous strain and temperature measurement using a superstructure fiber bragg grating. IEEE Photonics Technol. Lett. 2000, 12, 675–677. [Google Scholar] [CrossRef] [Green Version]
- Zhang, Q.; Ianno, N.J.; Han, M. Fiber-optic refractometer based on an etched high-q π-phase-shifted fiber-bragg-grating. Sensors 2013, 13, 8827–8834. [Google Scholar] [CrossRef] [PubMed]
- Ray, P.; Srijith, K.; Srinivasan, B. Enhanced sensitivity etched fiber bragg gratings for precise measurement of refractive index. In Proceedings of the International Conference on Optics and Photonics 2015, Calcutta, India, 20–22 February 2015; p. 965415. [Google Scholar]
- Bashkatov, A.N.; Genina, E.A. Water refractive index in dependence on temperature and wavelength: A simple approximation. In Saratov Fall Meeting 2002: Optical Technologies in Biophysics and Medicine IV; International Society for Optics and Photonics: San Diego, CA, USA, 2003; pp. 393–396. [Google Scholar]
- Liao, C.; Wang, Y.; Wang, D.; Yang, M. Fiber in-line mach–zehnder interferometer embedded in FBG for simultaneous refractive index and temperature measurement. IEEE Photonics Technol. Lett. 2010, 22, 1686–1688. [Google Scholar] [CrossRef]


© 2018 by the authors. Licensee MDPI, Basel, Switzerland. This article is an open access article distributed under the terms and conditions of the Creative Commons Attribution (CC BY) license (http://creativecommons.org/licenses/by/4.0/).
Share and Cite
Tan, R.X.; Ho, D.; Tse, C.H.; Tan, Y.C.; Yoo, S.W.; Tjin, S.C.; Ibsen, M. Birefringent Bragg Grating in C-Shaped Optical Fiber as a Temperature-Insensitive Refractometer. Sensors 2018, 18, 3285. https://doi.org/10.3390/s18103285
Tan RX, Ho D, Tse CH, Tan YC, Yoo SW, Tjin SC, Ibsen M. Birefringent Bragg Grating in C-Shaped Optical Fiber as a Temperature-Insensitive Refractometer. Sensors. 2018; 18(10):3285. https://doi.org/10.3390/s18103285
Chicago/Turabian StyleTan, Rex Xiao, Daryl Ho, Chun Ho Tse, Yung Chuen Tan, Seong Woo Yoo, Swee Chuan Tjin, and Morten Ibsen. 2018. "Birefringent Bragg Grating in C-Shaped Optical Fiber as a Temperature-Insensitive Refractometer" Sensors 18, no. 10: 3285. https://doi.org/10.3390/s18103285