1. Introduction
In recent years, with the development of the sensor, data storage and transmission technology, the linear (or area) array imaging mode is widely used by optical Remote Sensing sensors, whose imaging quality and efficiency have also been significantly improved [
1,
2,
3,
4]. Subsequently, the problem of image radiation inconsistency caused by pixel response non-uniformity (PRNU) and noise interferences has become the focus of attention, which consists of relative radiometric calibration and correction. Relative radiometric calibration [
5,
6] aims to solve this problem by unifying the measurement results from various pixels to one certain reference standard in order to improve the quality of result data and minimize the impact of the PRNU on other applications using this data. The relative radiometric correction [
7] eliminates the radiation inconsistencies of images with the relative radiometric calibration coefficients. The above-mentioned noise interferences include: stray light; the dark current; and stochastic noise, and can all viewed as synthetic noise. Stray light [
8] is the diffuse radiation caused by the surroundings of the object and has positive correlation with incident radiance. The dark current [
9] is the recorded value of the sensor’s internal current caused by electronic thermal motion when there is no incident radiation. The stochastic noise [
10] is the unpredictable interference randomly generated during imaging.
The relationship between the energy received by the sensor and the measurement value (recorded by the sensor) can be expressed as Equation (1).
where
is the DN (digital number) value recorded by the sensor;
is the photoelectric response coefficient;
is the entrance pupil radiation;
is the stray light;
is the dark current; and
is the stochastic noise.
The existence of all these interfering factors has made the relative radiometric calibration a complex procedure where it has to measure multiple (more than three) objects (as the source of radiation) to get the data from all pixels. It then uses the least square fitting to obtain the linear transformation relationship between the reference standard and the data from each pixel, which is considered as the relative radiometric calibration coefficient. The effective minimization of the noise in the calibration data is the key to improving the precision of the relative radiometric calibration. If we use the data from pixel 0 as the reference standard, the relative radiometric calibration calculation for pixel
k can be expressed as Equation (2).
where
is the measured value with the first subscript being the pixel number and the second subscript being the radiation source number (for example,
represents the measured value for pixel
under the radiation source
);
is the relative radiometric calibration gain coefficient and
the offset coefficient for pixel
; and
is the function to compute the pseudo-inverse of a matrix.
When selecting a source of radiation, the standard source of radiation when calibration is conducted in labs is a tungsten lamp [
11,
12] or the sun [
13,
14,
15,
16,
17]; while for in-orbit calibration, the artificial light source inside the sensor, or the sun, or the moon is selected as the source of radiation [
18,
19,
20,
21,
22].
In general, homogeneous flat ground objects with stable reflectivity and good lambertian characteristics can be chosen as the target. For lab calibration, the integrating sphere or reference board is used as the target [
23,
24,
25,
26,
27,
28], while for in-orbit calibration, the internal integrating sphere or field areas such as White Sands in New Mexico; Rogers dry lake in California; Lunar Lake in Nevada; La Crau in Southern France; DunHuang; or QingHai Lake in China as targets [
29].
In optimizing radiometric calibration, the most commonly used methods include increasing the number of radiance level for the target(s) (either the number of various radiation conditions for the same target or the number of various targets under the same radiation condition) before averaging the multiple measurements to reduce the noise interference; and to improve the precision of the radiometric calibration. For example, when calibration is conducted in the lab, measurement data is collected from the integrating sphere or reference board under various radiation conditions; for in-orbit calibration, measurements are conducted on various heterogeneous ground objects (the flat gobi or still water body) to obtain calibration data with different intensities; imagining patterns with a 90-degree yaw angle or continuously changing solar radiation are also used to acquire better quality calibration data [
30,
31].
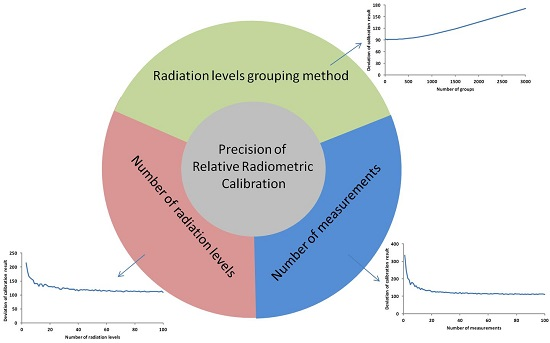
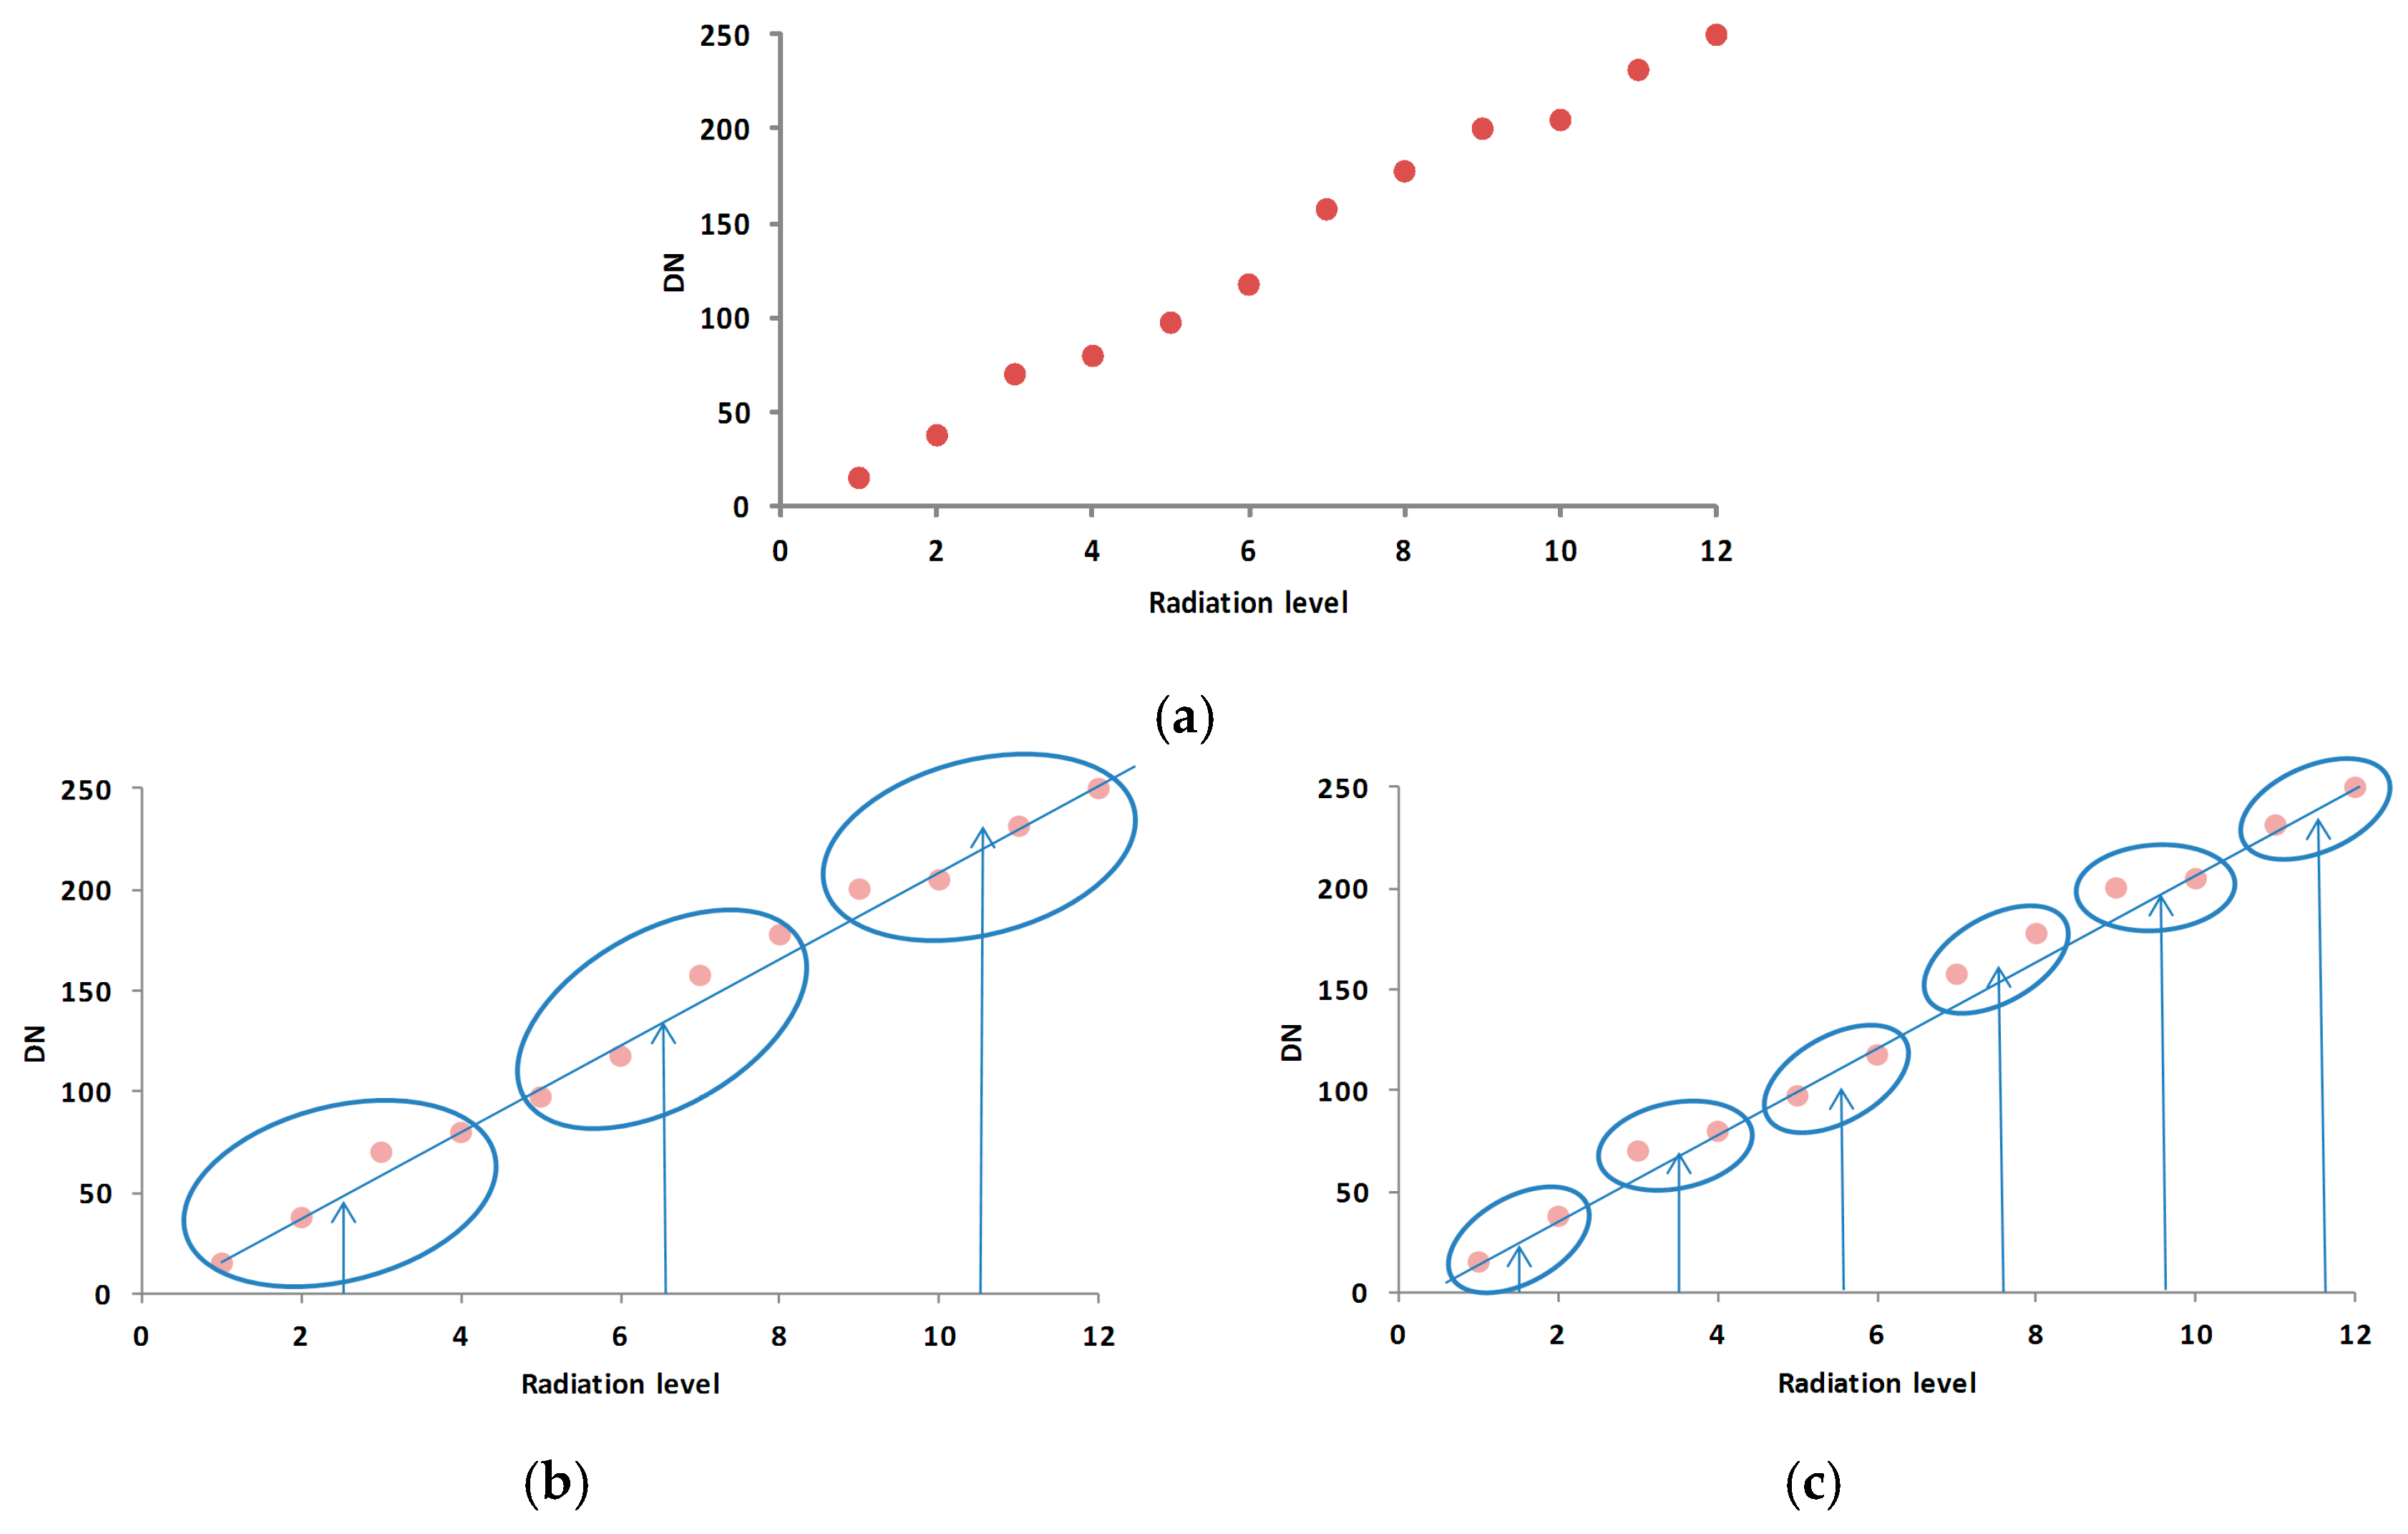
To summarize, there are three important elements for the relative radiometric calibration process: the number of radiance level; the number of measurements at each level; and when the above two elements are fixed, the way of dividing the acquired measurement data into groups before merging them. The grouping method we discussed in this paper is that averaging the multiple measurements of each level, and then dividing all the levels into groups by intensity gradient order and conducting averages for each group. Grouping controls the number of point pairs and, consequently, the accuracy of least square fits, as shown in
Figure 1. A higher precision can be achieved through the adjustment of these three elements. This paper first quantitatively analyzes the impact these three elements have on the precision of the relative radiometric calibration from a theoretical perspective; second, it illustrates the conclusions using computer simulations; and finally outlines the strategy in achieving the optimized precision.
2. Materials and Methods
Supposing the sensor has
pixels, where the number of radiance level is
and the number of measurements conducted at each radiation level is
, then Equation (1) can be rewritten as Equation (3).
where
is the measurement result of pixel
at the radiation level
;
is the photoelectric response coefficient of pixel
;
is the absolute radiance at the entrance pupil of the pixel at the radiation level
;
is the dark current of pixel
;
is the stray light of pixel
at the radiation level
;
is the corresponding stochastic noise of pixel
at the radiation level
with its mean square error being .
,
,
can be combined as synthetical noise of pixel
, which usually follows Gaussian distribution. The following discussions are all based on the assumption of Gaussian noise.
The stray light received by pixel
is determined by the radiation intensity of the radiation source
and the pixel’s position in the space at point
, where the space position can be defined as the stray light response
. With all this, Equation (3) can be transformed into Equation (4).
where
is the synthesis of the photoelectric coefficient and the stray light response coefficient for pixel
which is called the synthetical radiation response coefficient.
The average result for all the measurements of
times at each level of radiation intensity can be expressed as Equation (5).
where the superscript
represents the data number;
is the average value of the noises from all the measurements of
times with a value of
. If compared with
, the mean square error of
is reduced to
.
It is supposed that all the measurement results obtained from all the
levels of radiation intensity were divided into
groups,
(
and
), where each group had the data from the corresponding radiance level and the data series in the groups were numbered as
,
, ……, and
respectively. An average for each group, represented as
respectively, was conducted in order to further reduce the noise interference which can be expressed as Equation (6).
The mean square errors of
were further reduced and can be expressed as Equation (7).
According to the error propagation theory, when the error of each element for the data series of reference pixel 0 is expressed as
(where the right superscript
represents the matrix transposition operation), this error will be propagated to the radiometric calibration coefficients
and
during the process of using the least square method. Their mean square errors have the same value [
32], which can be represented in Equation (8).
where
represents that there are two coefficients for the linear fitting in the relative radiometric calibration. Substituting the error turning Equation (7) into Equation (8), the mean square error
can be expressed as Equation (9).
Given the parameters and , there are two cases to be discussed to minimize the error, .
Case 1:
When
is fixed, getting the minimum value of
is equivalent to minimizing
. Based on the am-gm inequality theorem [
33], we have the following inequation in Equation (10).
Based on Equation (10), the following inequation Equation (11) is derived.
Therefore, when , the equality of Equation (11) holds, which produces the minimum value for . It indicates that the even group-division will achieve a higher precision than any other grouping methods.
Case 2:
When
is not fixed, by substituting
into Equation (9), we have Equation (12).
By calculating the derivative of Equation (12) against
, we have Equation (13).
From Equation (13), it can be concluded that when
,
gets its minimum value, which indicates that it can achieve the highest precision when the data set is evenly divided into four groups and the minimum value of the error is expressed in Equation (14).
If no grouping is done, which means
and
, the error has the following value in Equation (15).
As seen from Equations (14) and (15), whether using the grouping strategy or not, the higher the number of the radiance level and the number of measurements at each level, the higher the precision becomes, i.e., the results of the relative radiometric calibration are much closer to the theoretical values without noise interference. When the radiance level
is fixed, precision will be improved if the number of measurements,
at each level is increased; when
is fixed, the precision will be improved as
is increased.
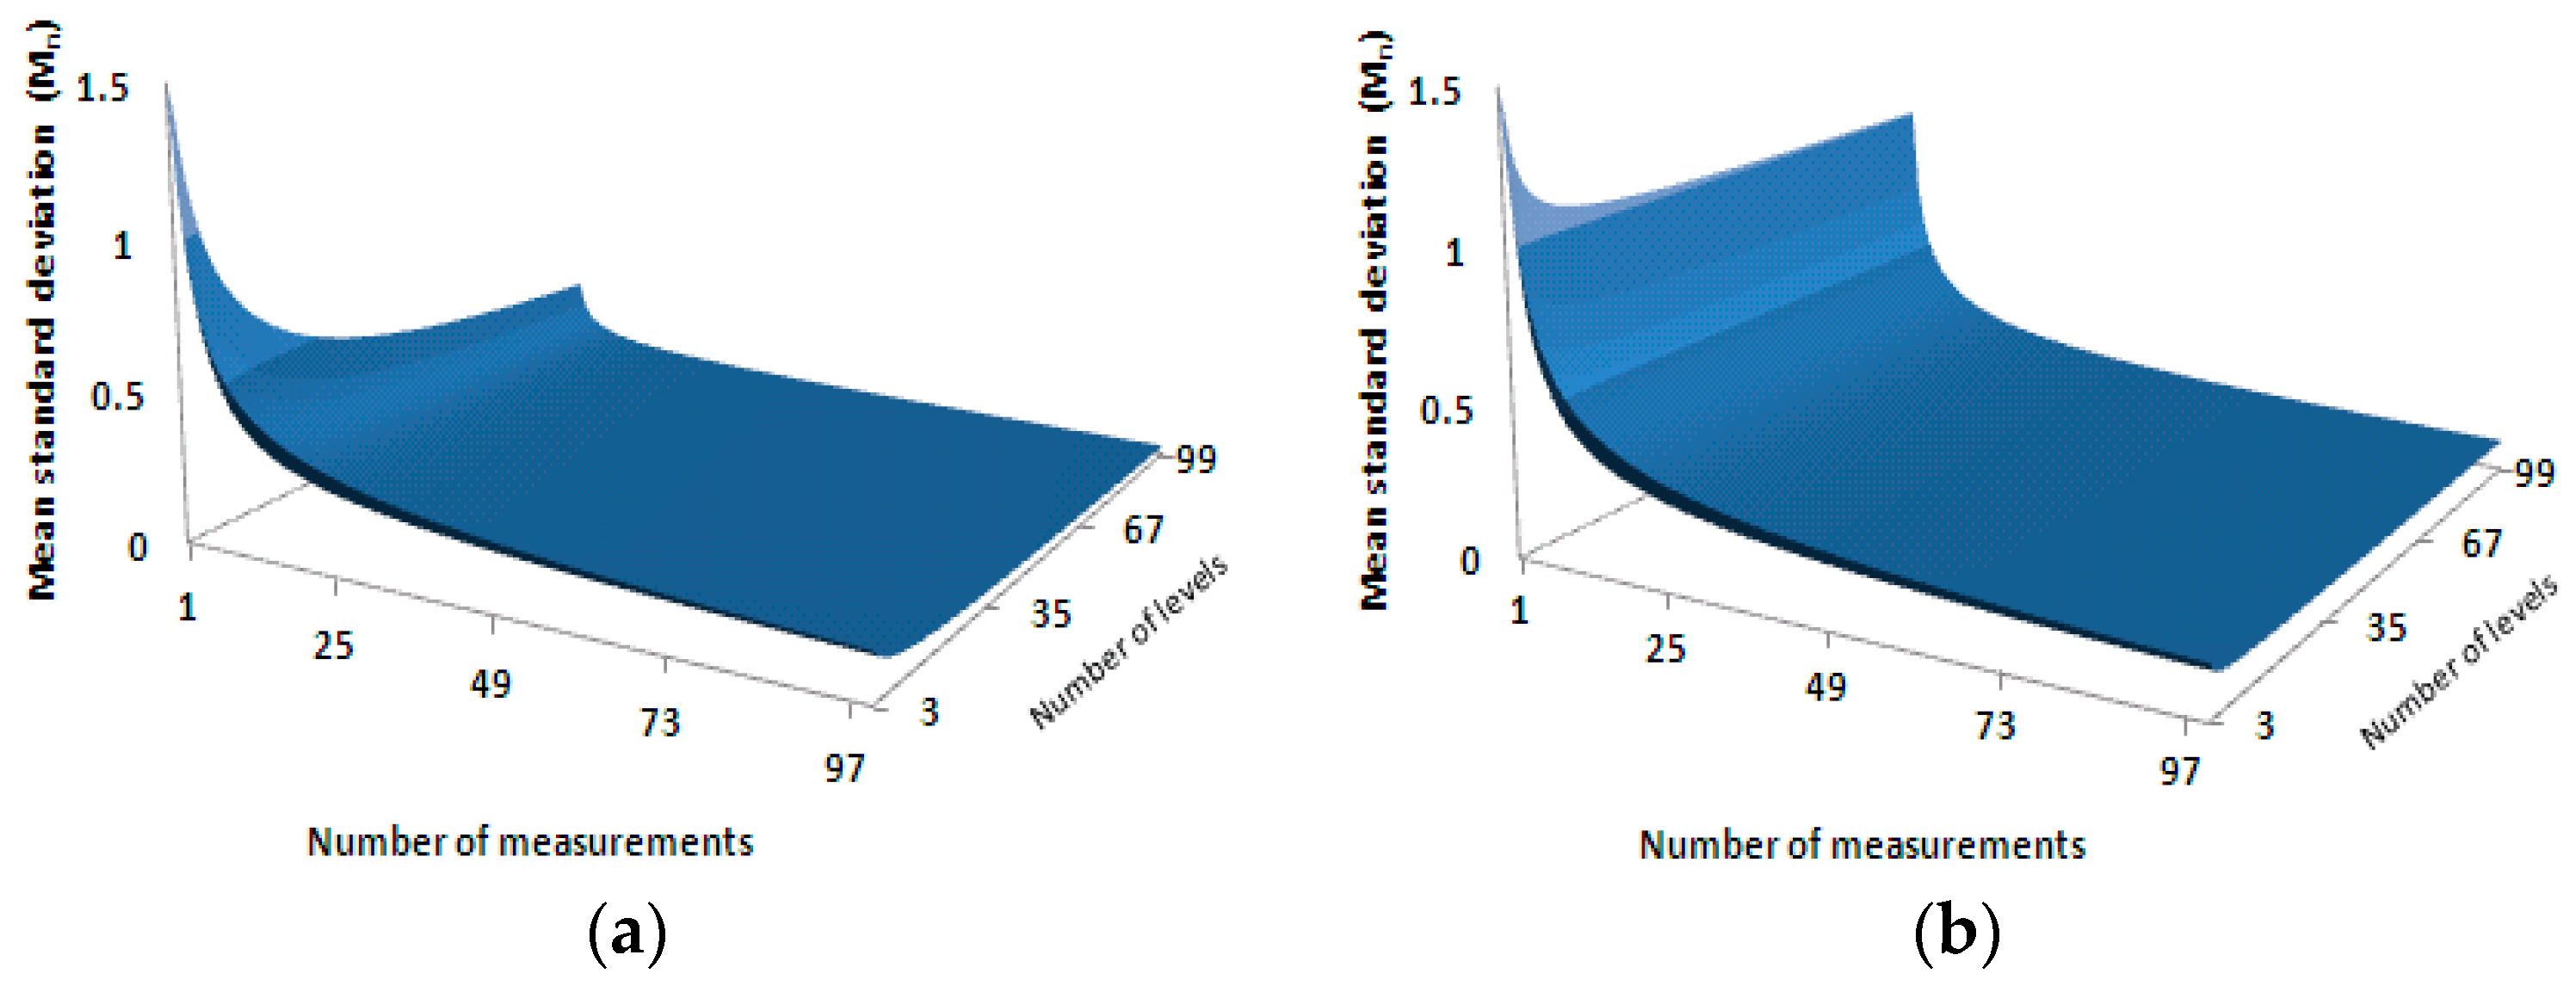
Figure 2 illustrates the relationship between the precision and these two parameters, namely the number of the radiance level and the number of measurements at each radiation level, in a 3D surface manner where
Figure 2a represents the case when the data is evenly divided into four groups and
Figure 2b without the grouping. The two horizontal axes represent the number of the radiance level and the number of measurements at each level, respectively. The vertical axis represents the mean square error of the relative radiometric calibration coefficients.
As illustrated in
Figure 2, in either case, the calibration precision was increased along with the increase of the number of the radiance level or the increase of the number of measurements at each level. When using the even-division grouping method to group the data from multiple radiance levels, the number of the radiance level and the number of measurements had the equivalent effect and showed their strongest effect when the grouping number was four (as shown in Equation (14)). As expressed by Equation (15), when no grouping was done, the number of measurements had a stronger impact than the number of the radiance level.
3. Results
To verify the theory and illustrate the conclusions, the simulation was conducted to cover three cases with the parameters defined in
Table 1.
Case 1: the number of pixels, the number of the radiance level and the grouping method were all fixed; however, the number of measurements at each level was not fixed;
Case 2: the number of pixels, the grouping method and the number of measurements at each level were all fixed; however, the number of the radiance level was not fixed;
Case 3: the number of pixels, the number of the radiance level and the number of measurements at each level were all fixed, but the grouping method was not fixed.
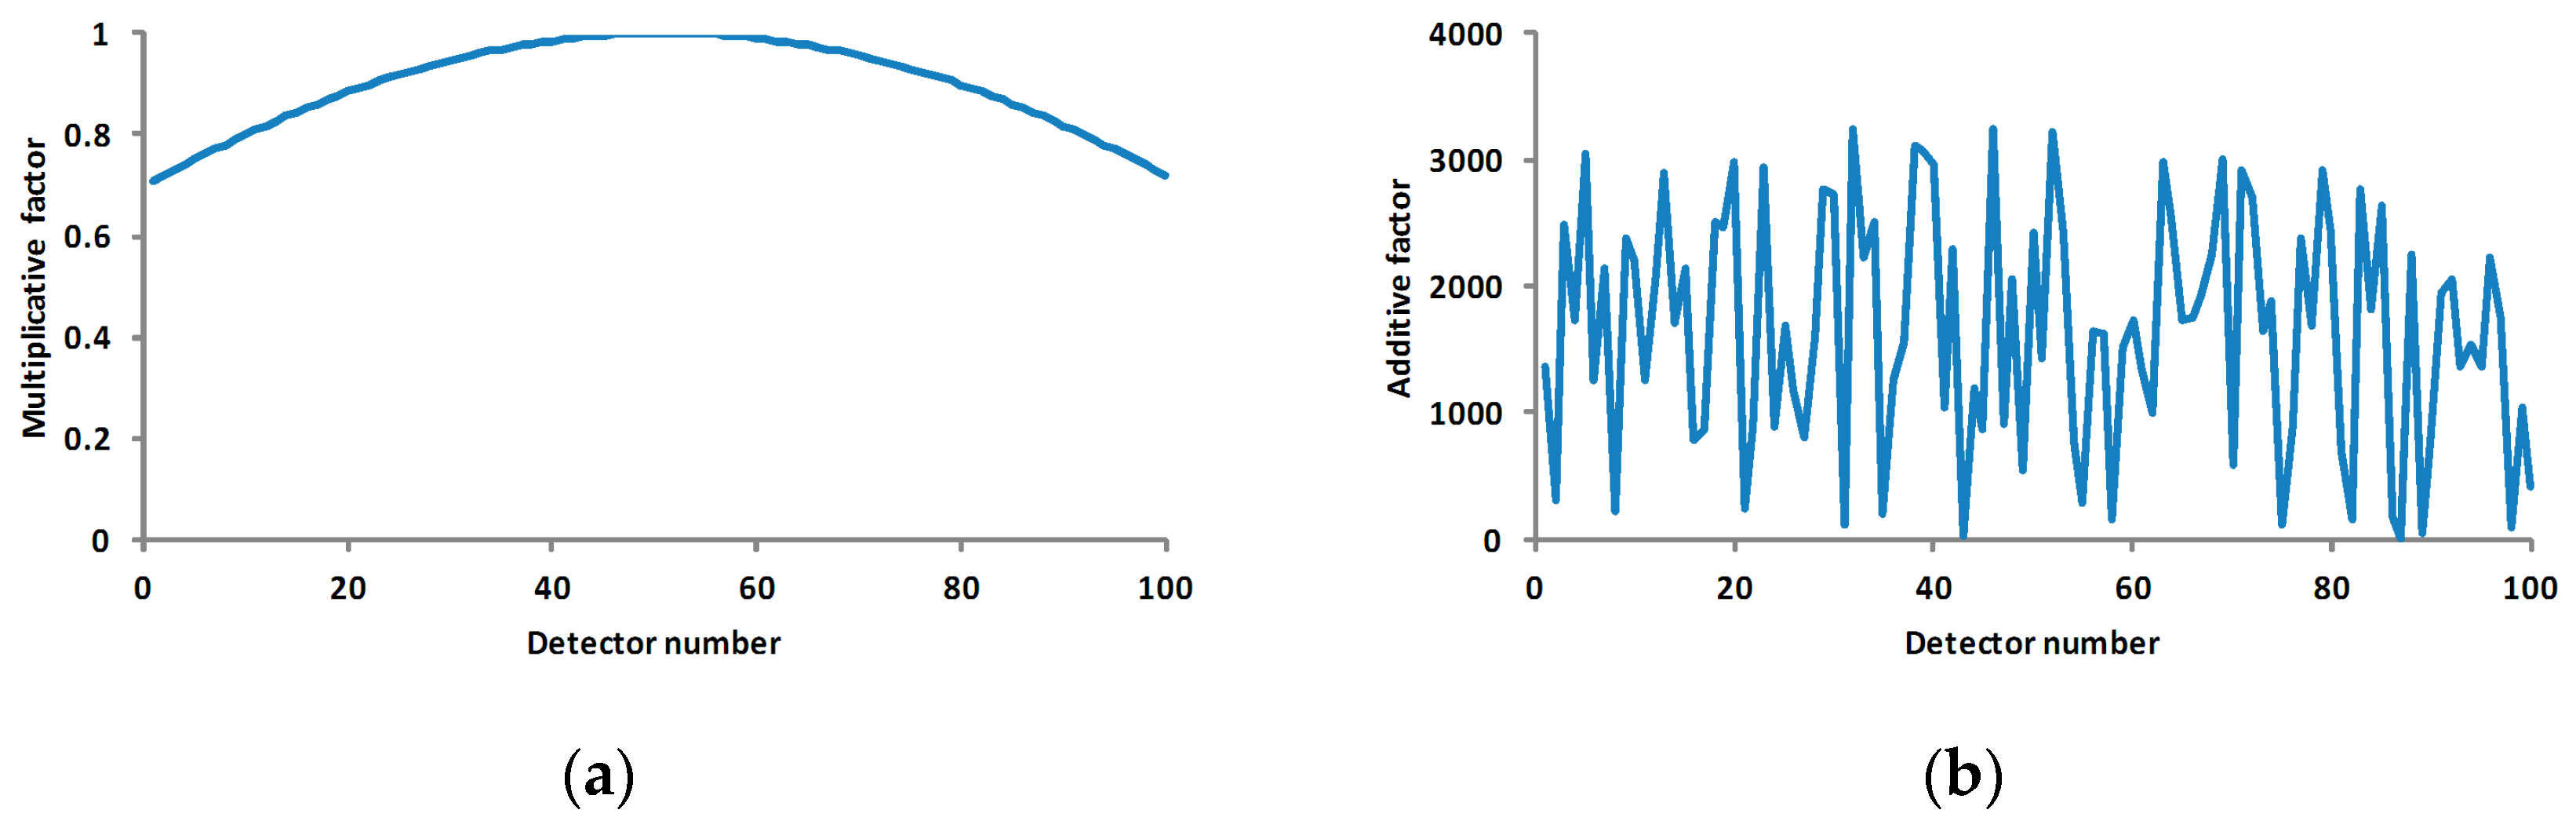
The simulation data was quantified using two bytes with the valid value from 0–65,535. The maximum value of the stochastic noise was less than 5% of the maximum quantified value (3276). The multiplicative factor (synthetical radiation response coefficient) of each pixel was the sinusoidal values from 0.25 π to 0.75 π with 0.005 π being the interval. The additive factor (synthesis of dark current and stochastic noise) is random data with its maximum value less than 5% of the maximum quantified value. The gain coefficient is the reciprocal of the multiplicative factor and the offset coefficient is the quotient of the additive factor divided by the multiplicative factor. The radiation level was evenly distributed using the same interval in the range of 10%–90% of the maximum quantified value. Pixel 51 was selected as the reference standard.
Case 1: to understand the impact of the number of averaging measurements for each level on the precision.
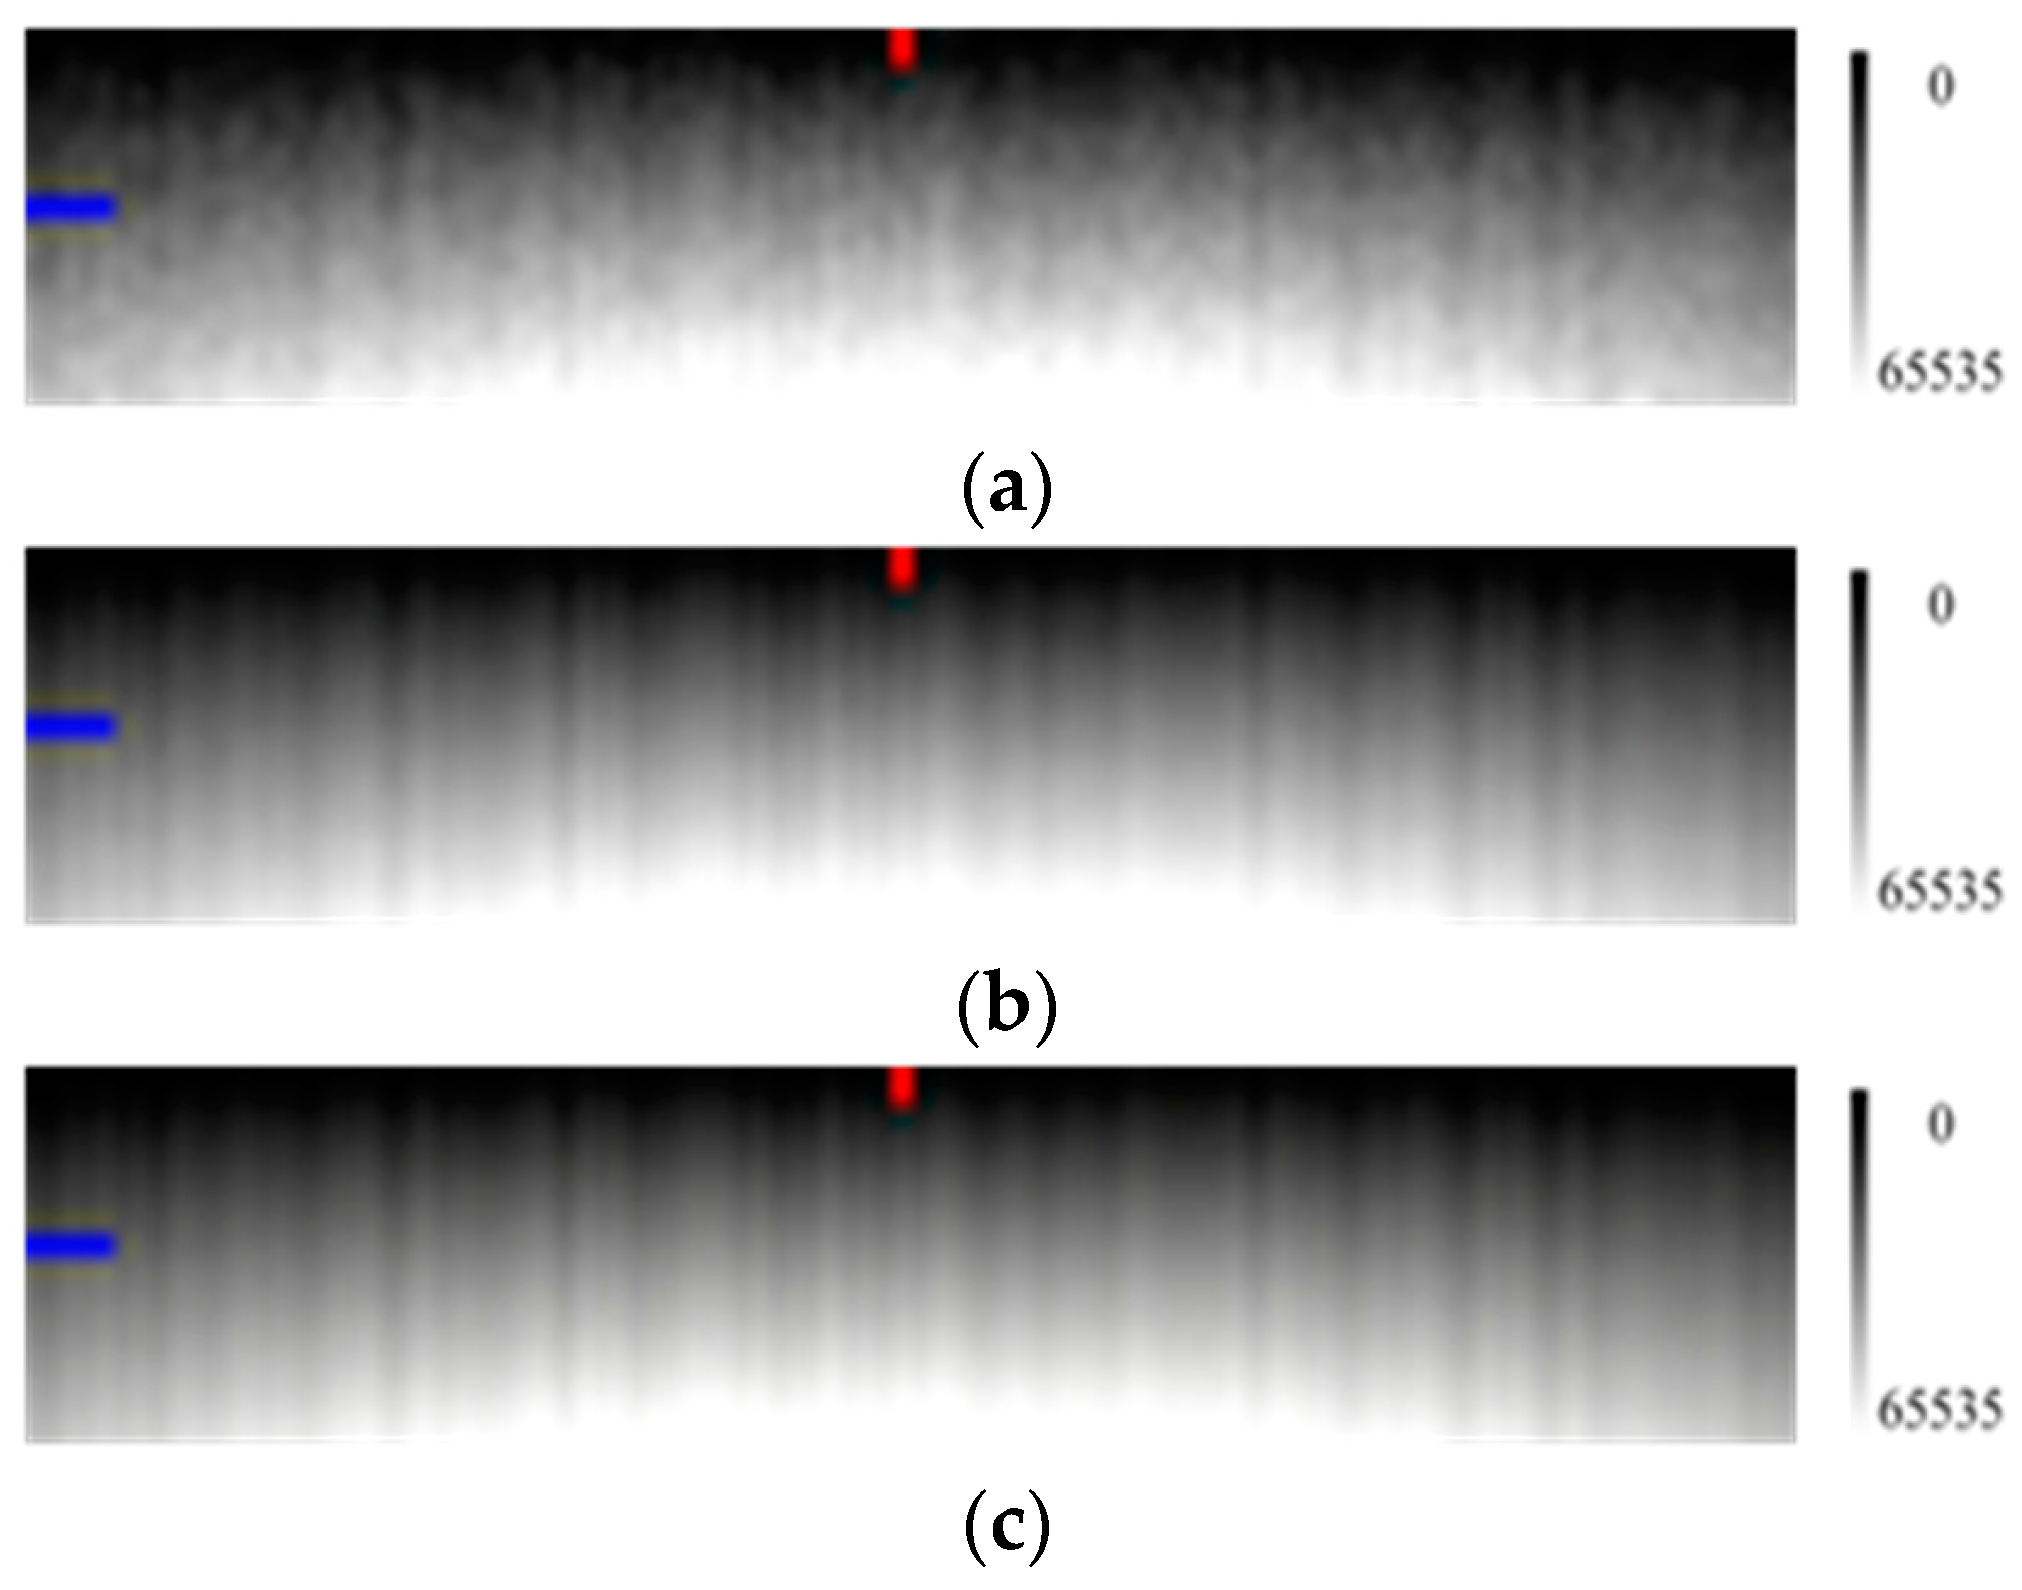
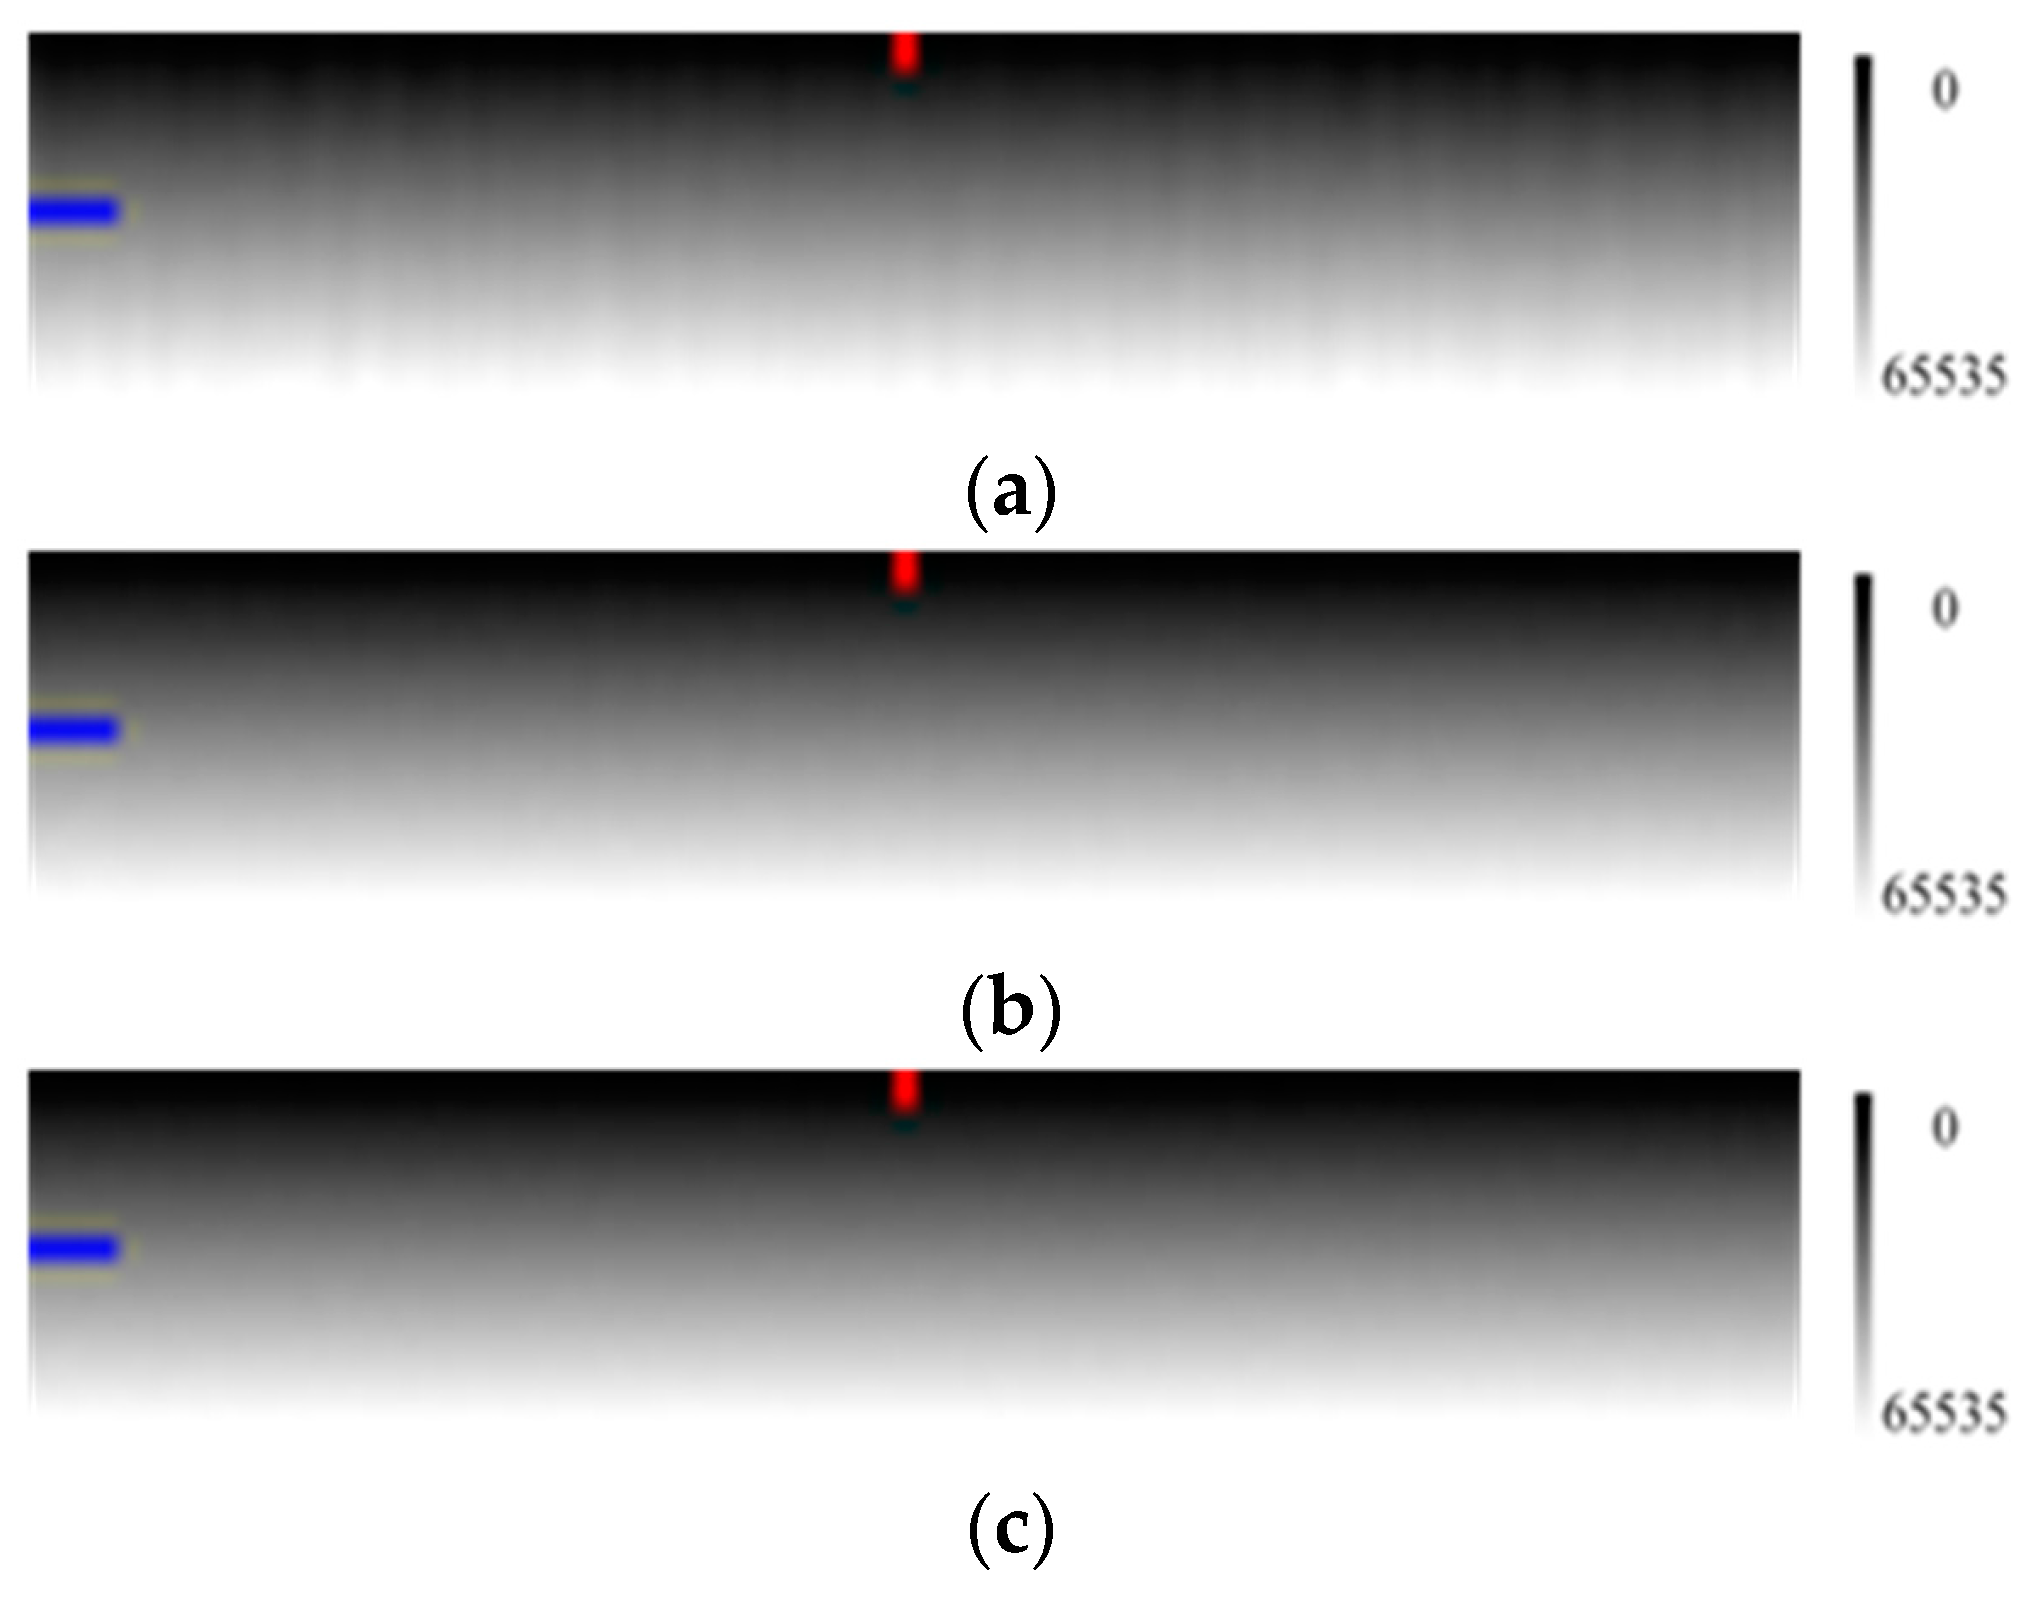
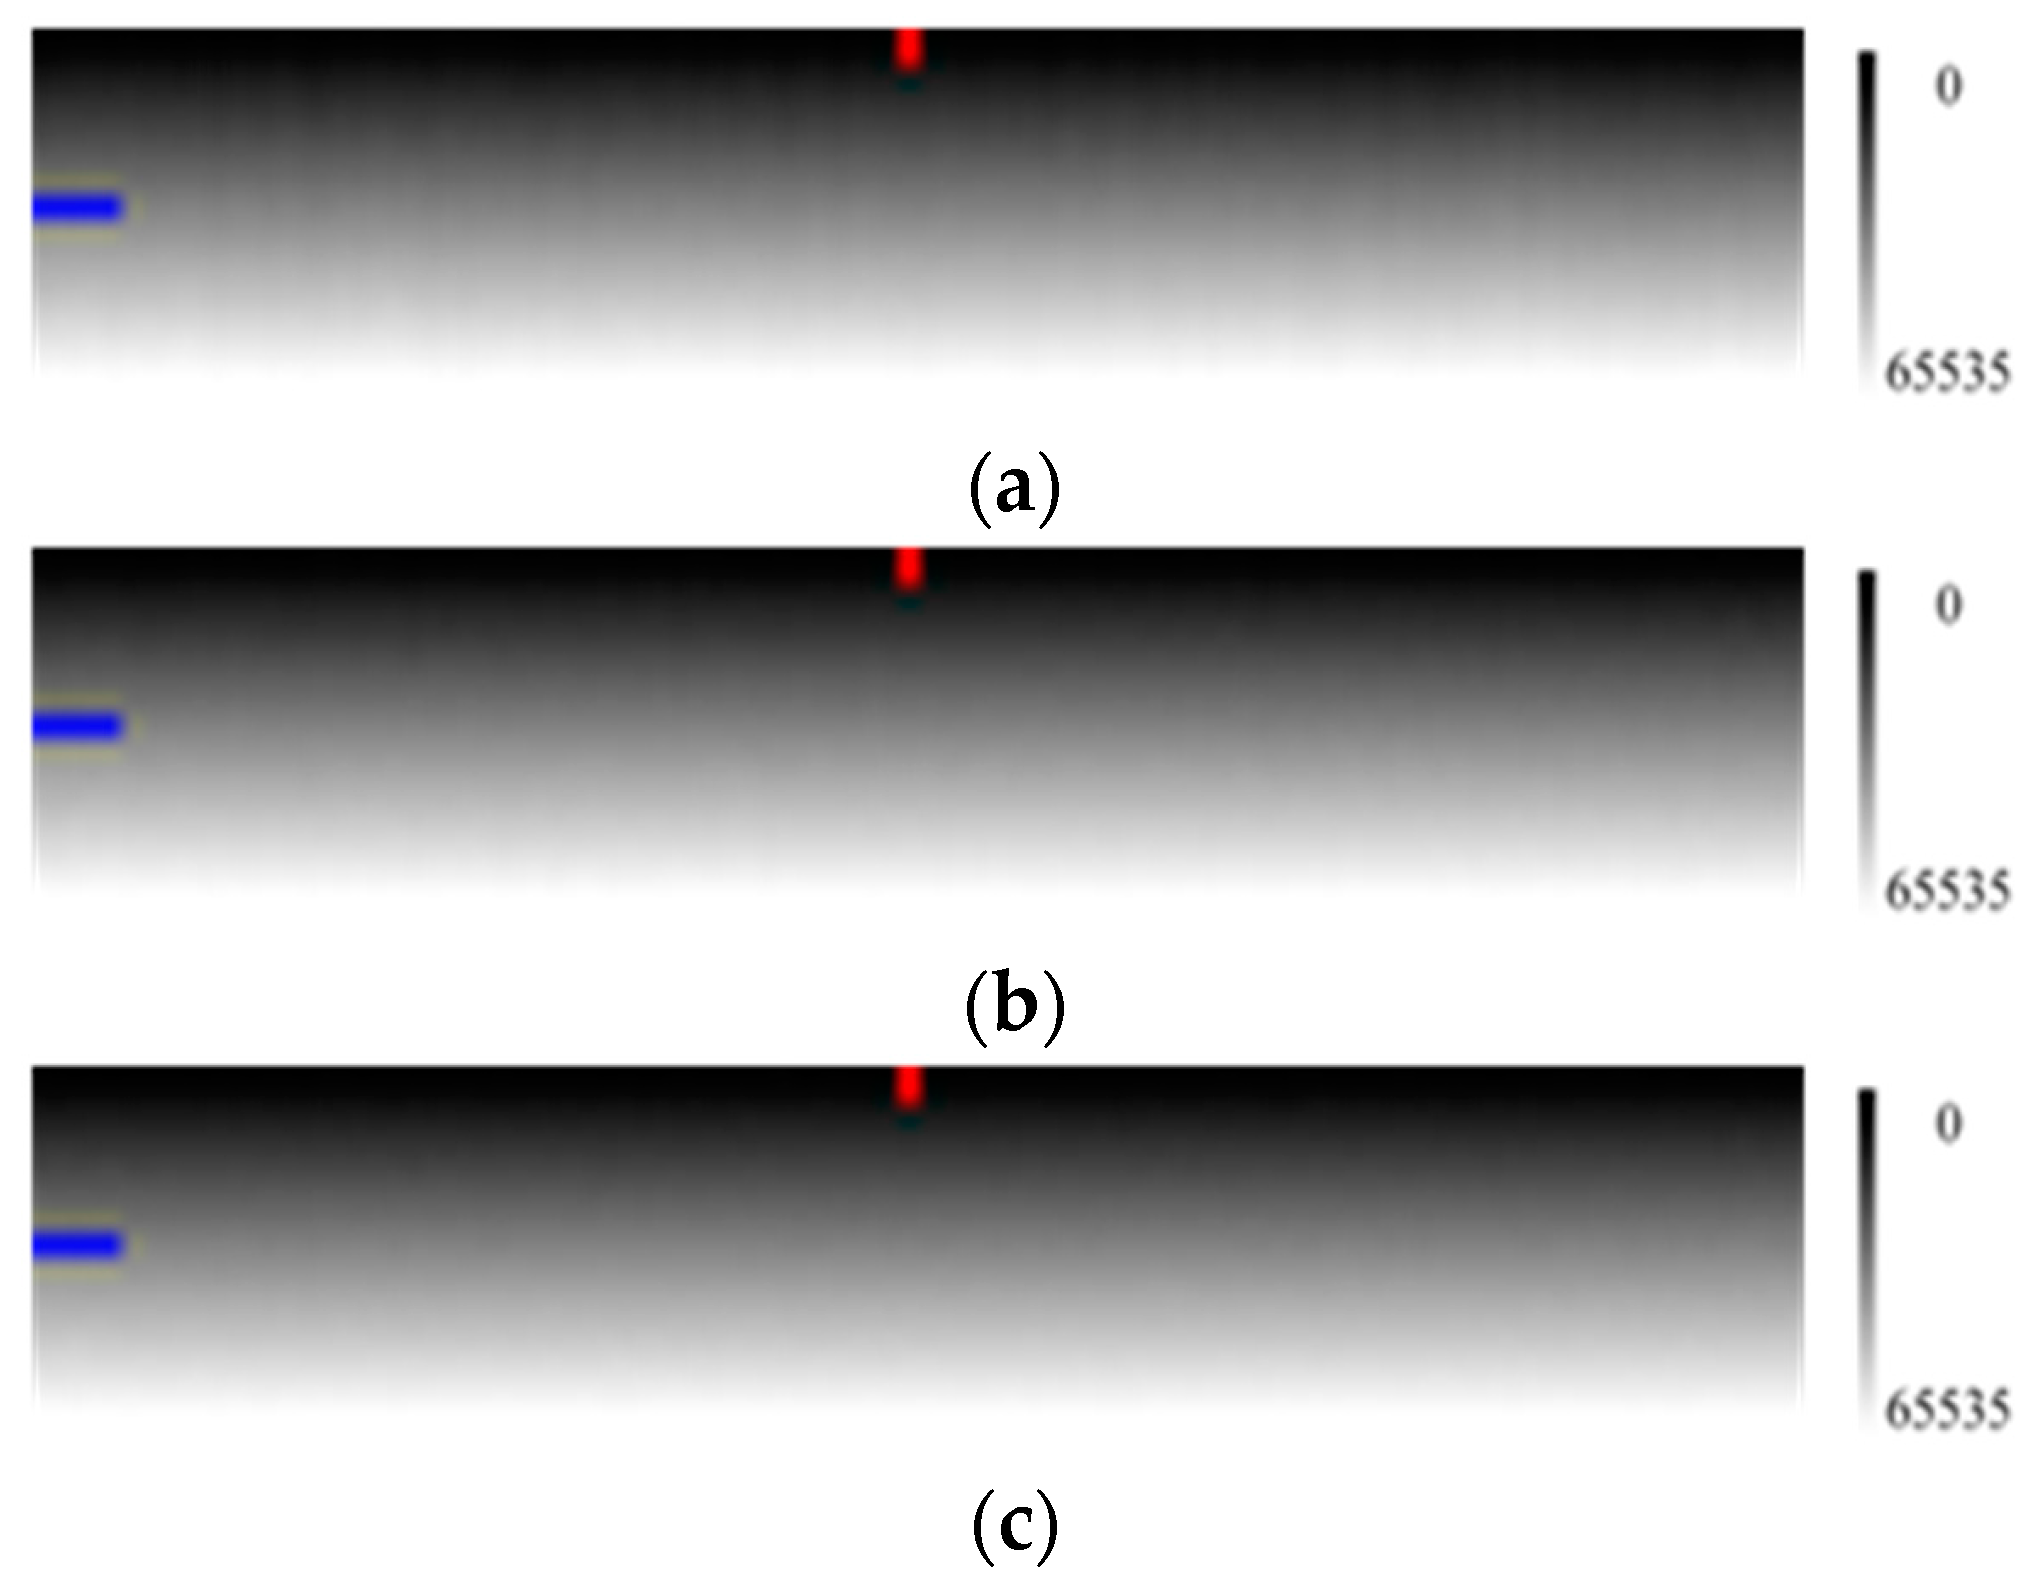
In
Figure 3, it is clear that when the number of measurements increases, the image sharpens and the radiation response difference among the pixels is more obvious.
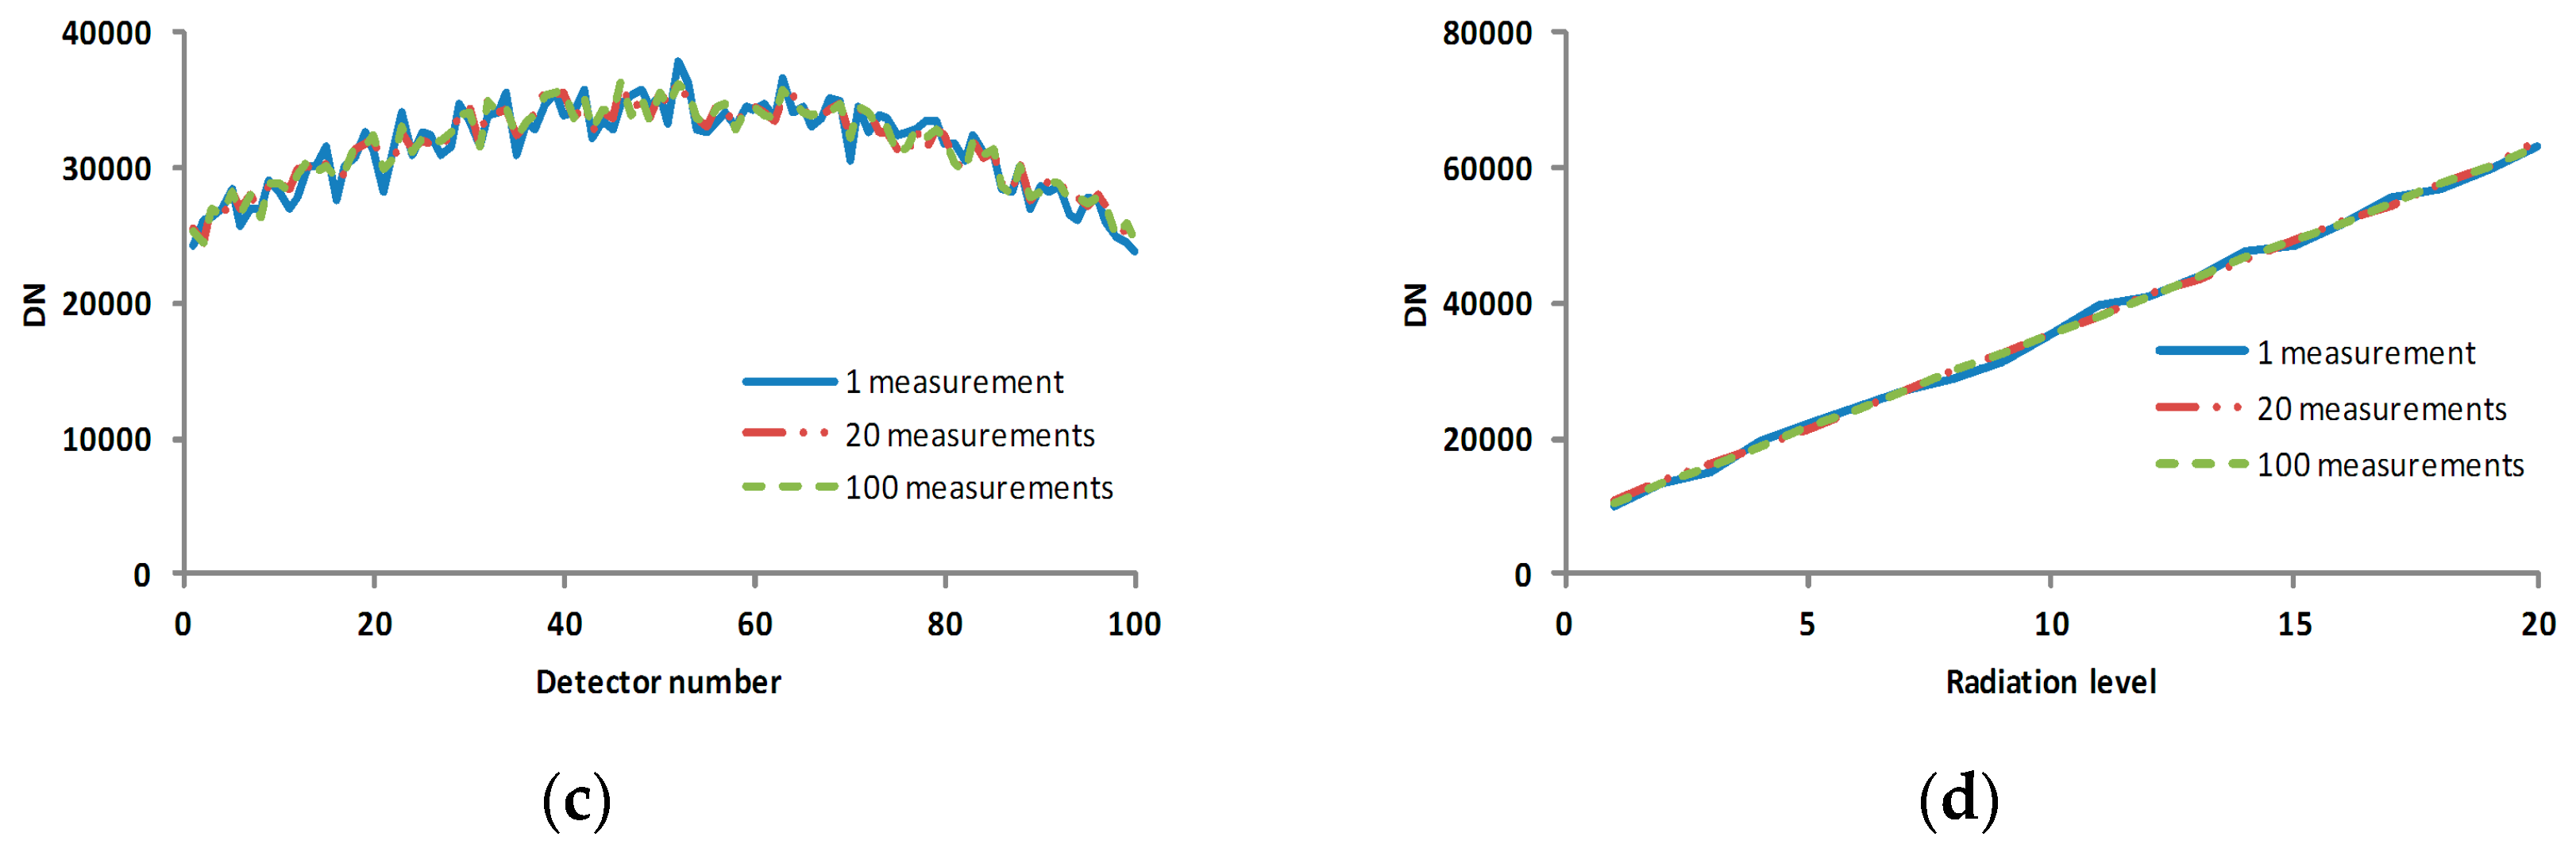
Figure 4c,d also showed that increasing the number of measurements can reduce noise effect and make profiles more smooth.
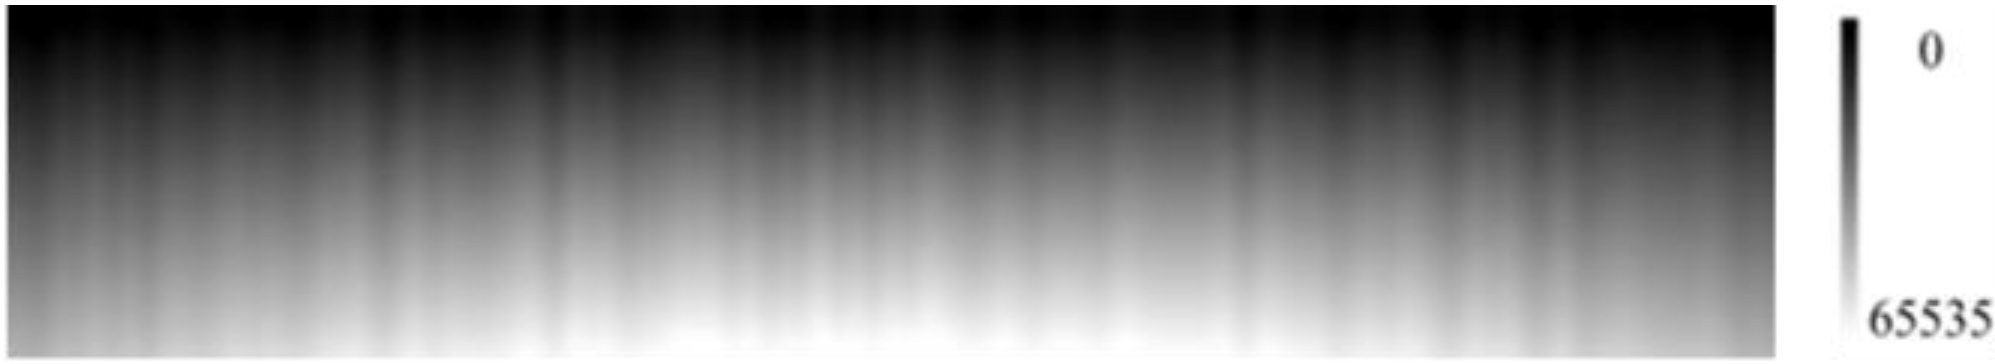
Figure 5 is the verification image, whose multiplicative and additive factor are the same as that of the calibration image in
Figure 3. Both images have noises of the same characteristic but different values.
As shown in
Figure 6, the relative calibration result was much better with the calibration coefficients from larger numbers of the averaged measurements.
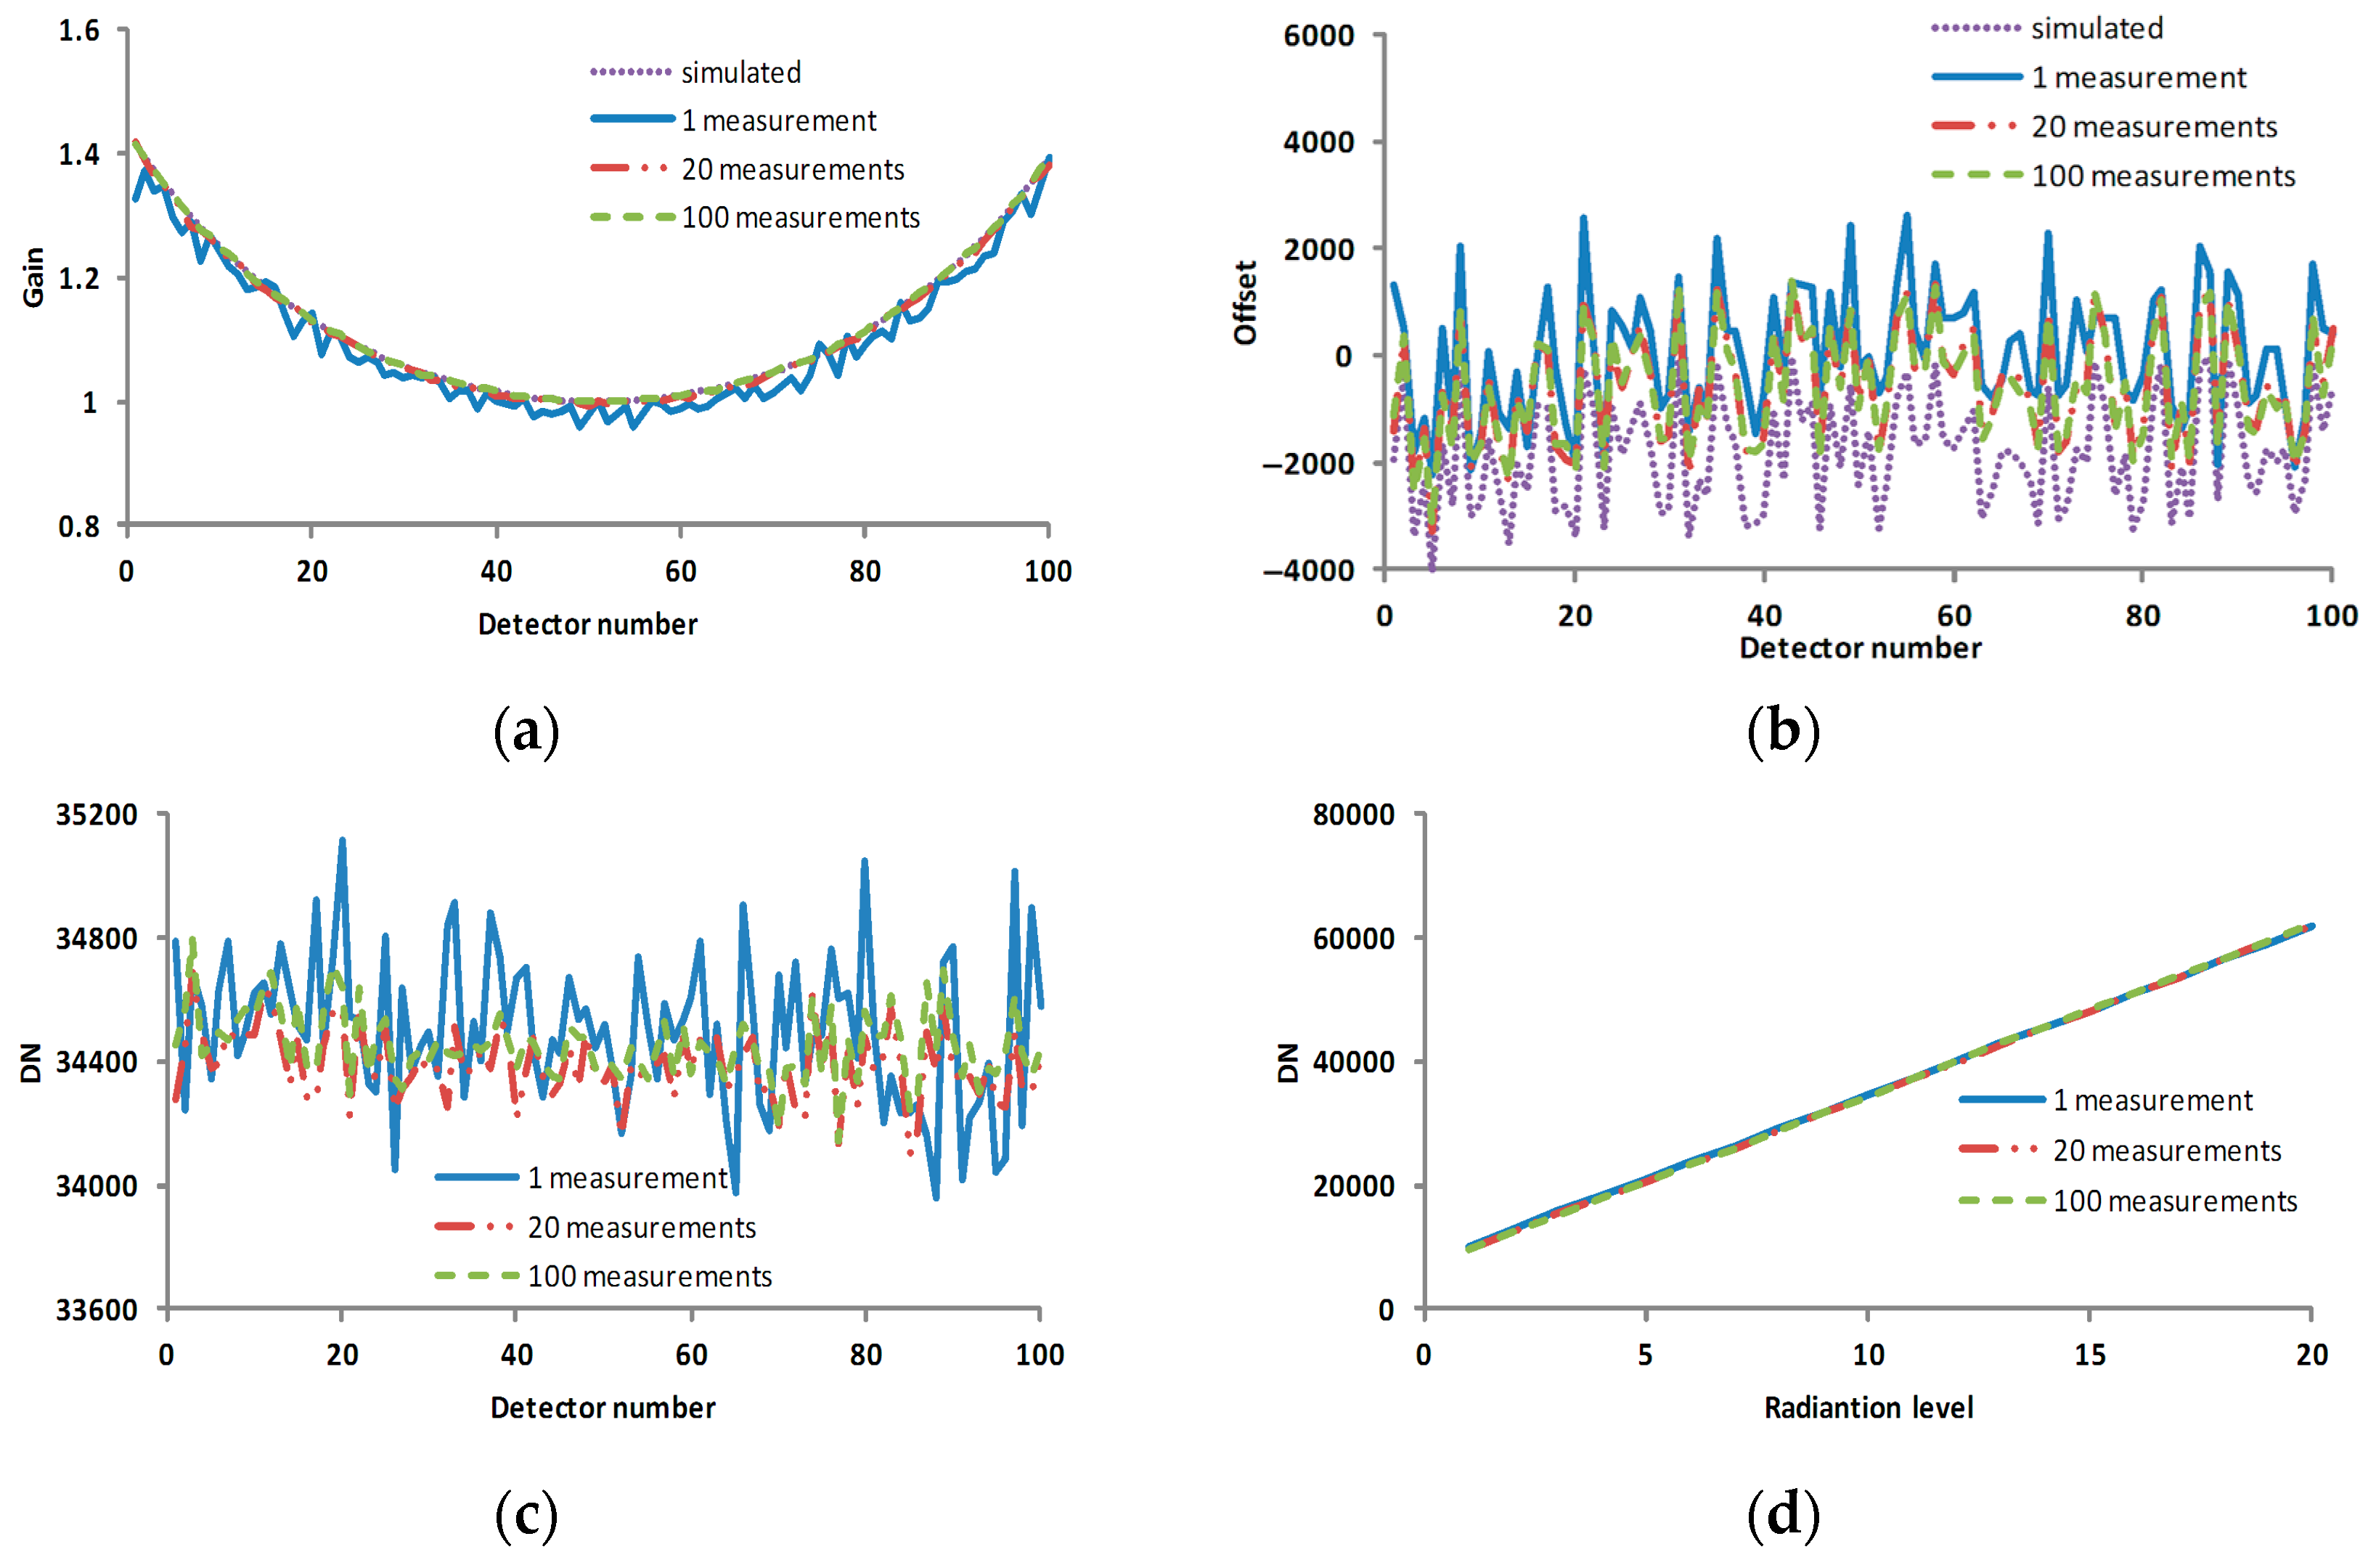
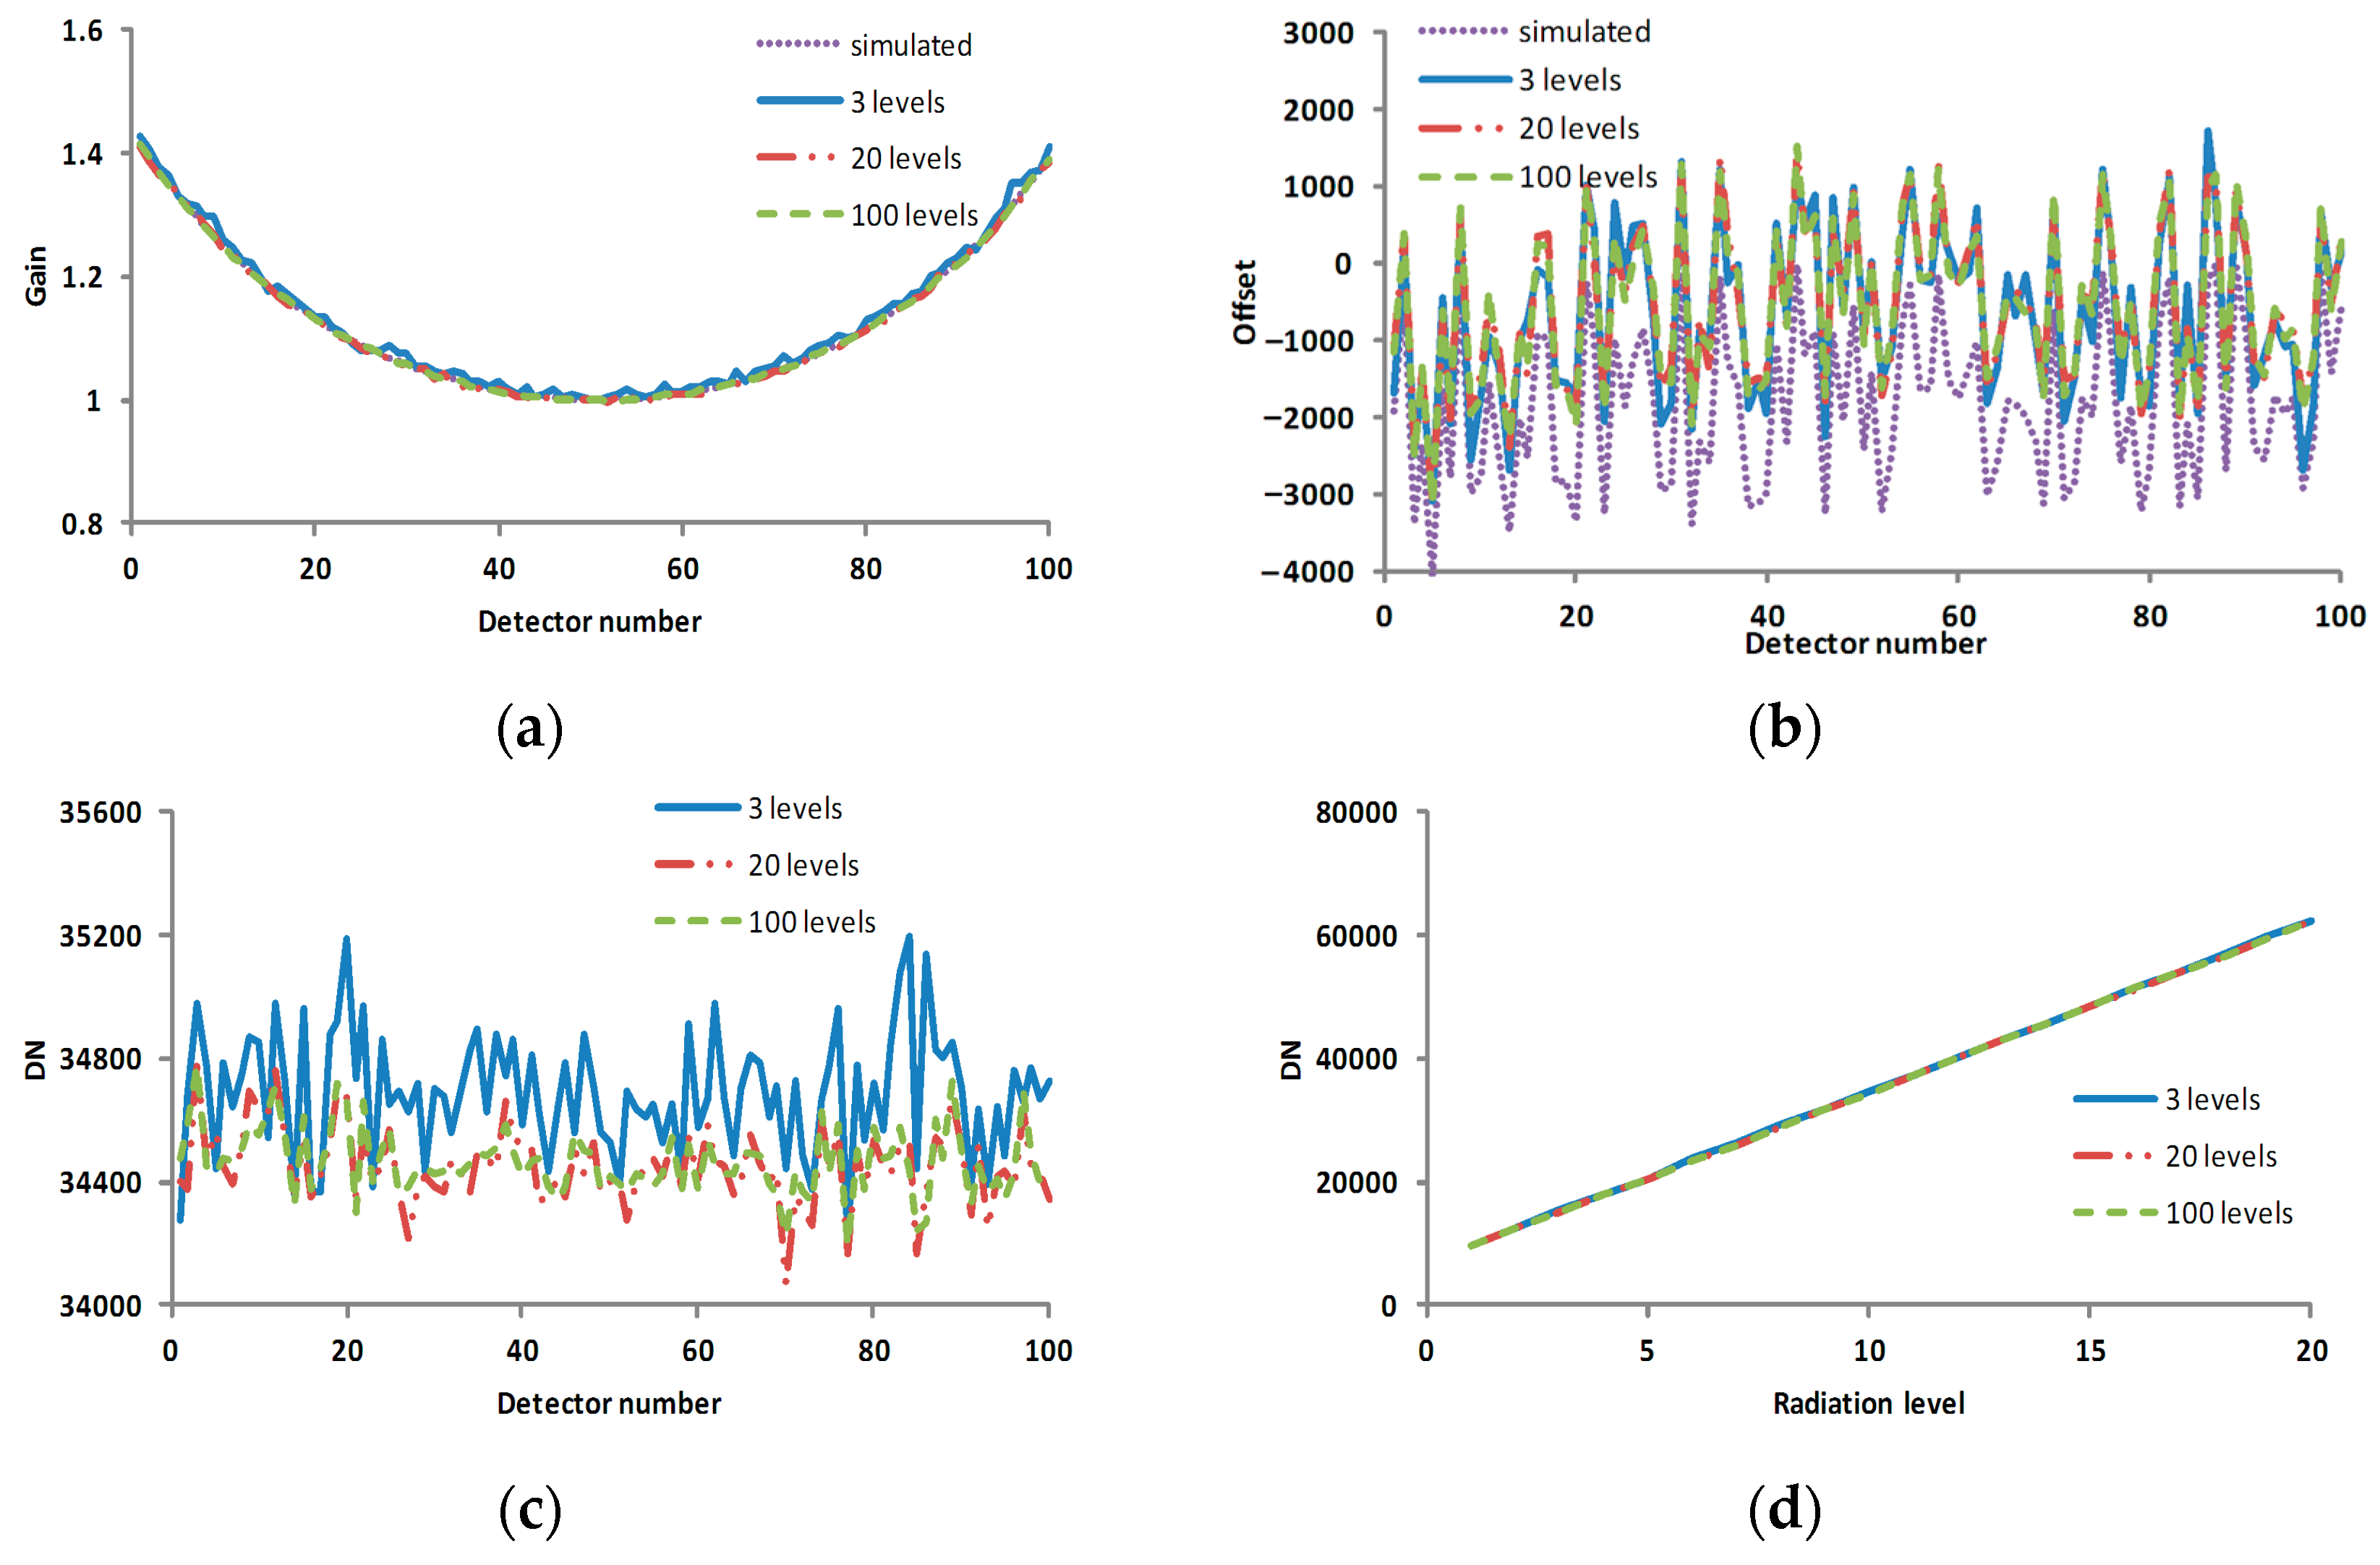
As seen in
Figure 7, the calculated calibration coefficients became much closer to the simulated calibration coefficients as the number of measurements increased, and the corresponding corrected result was also improved.
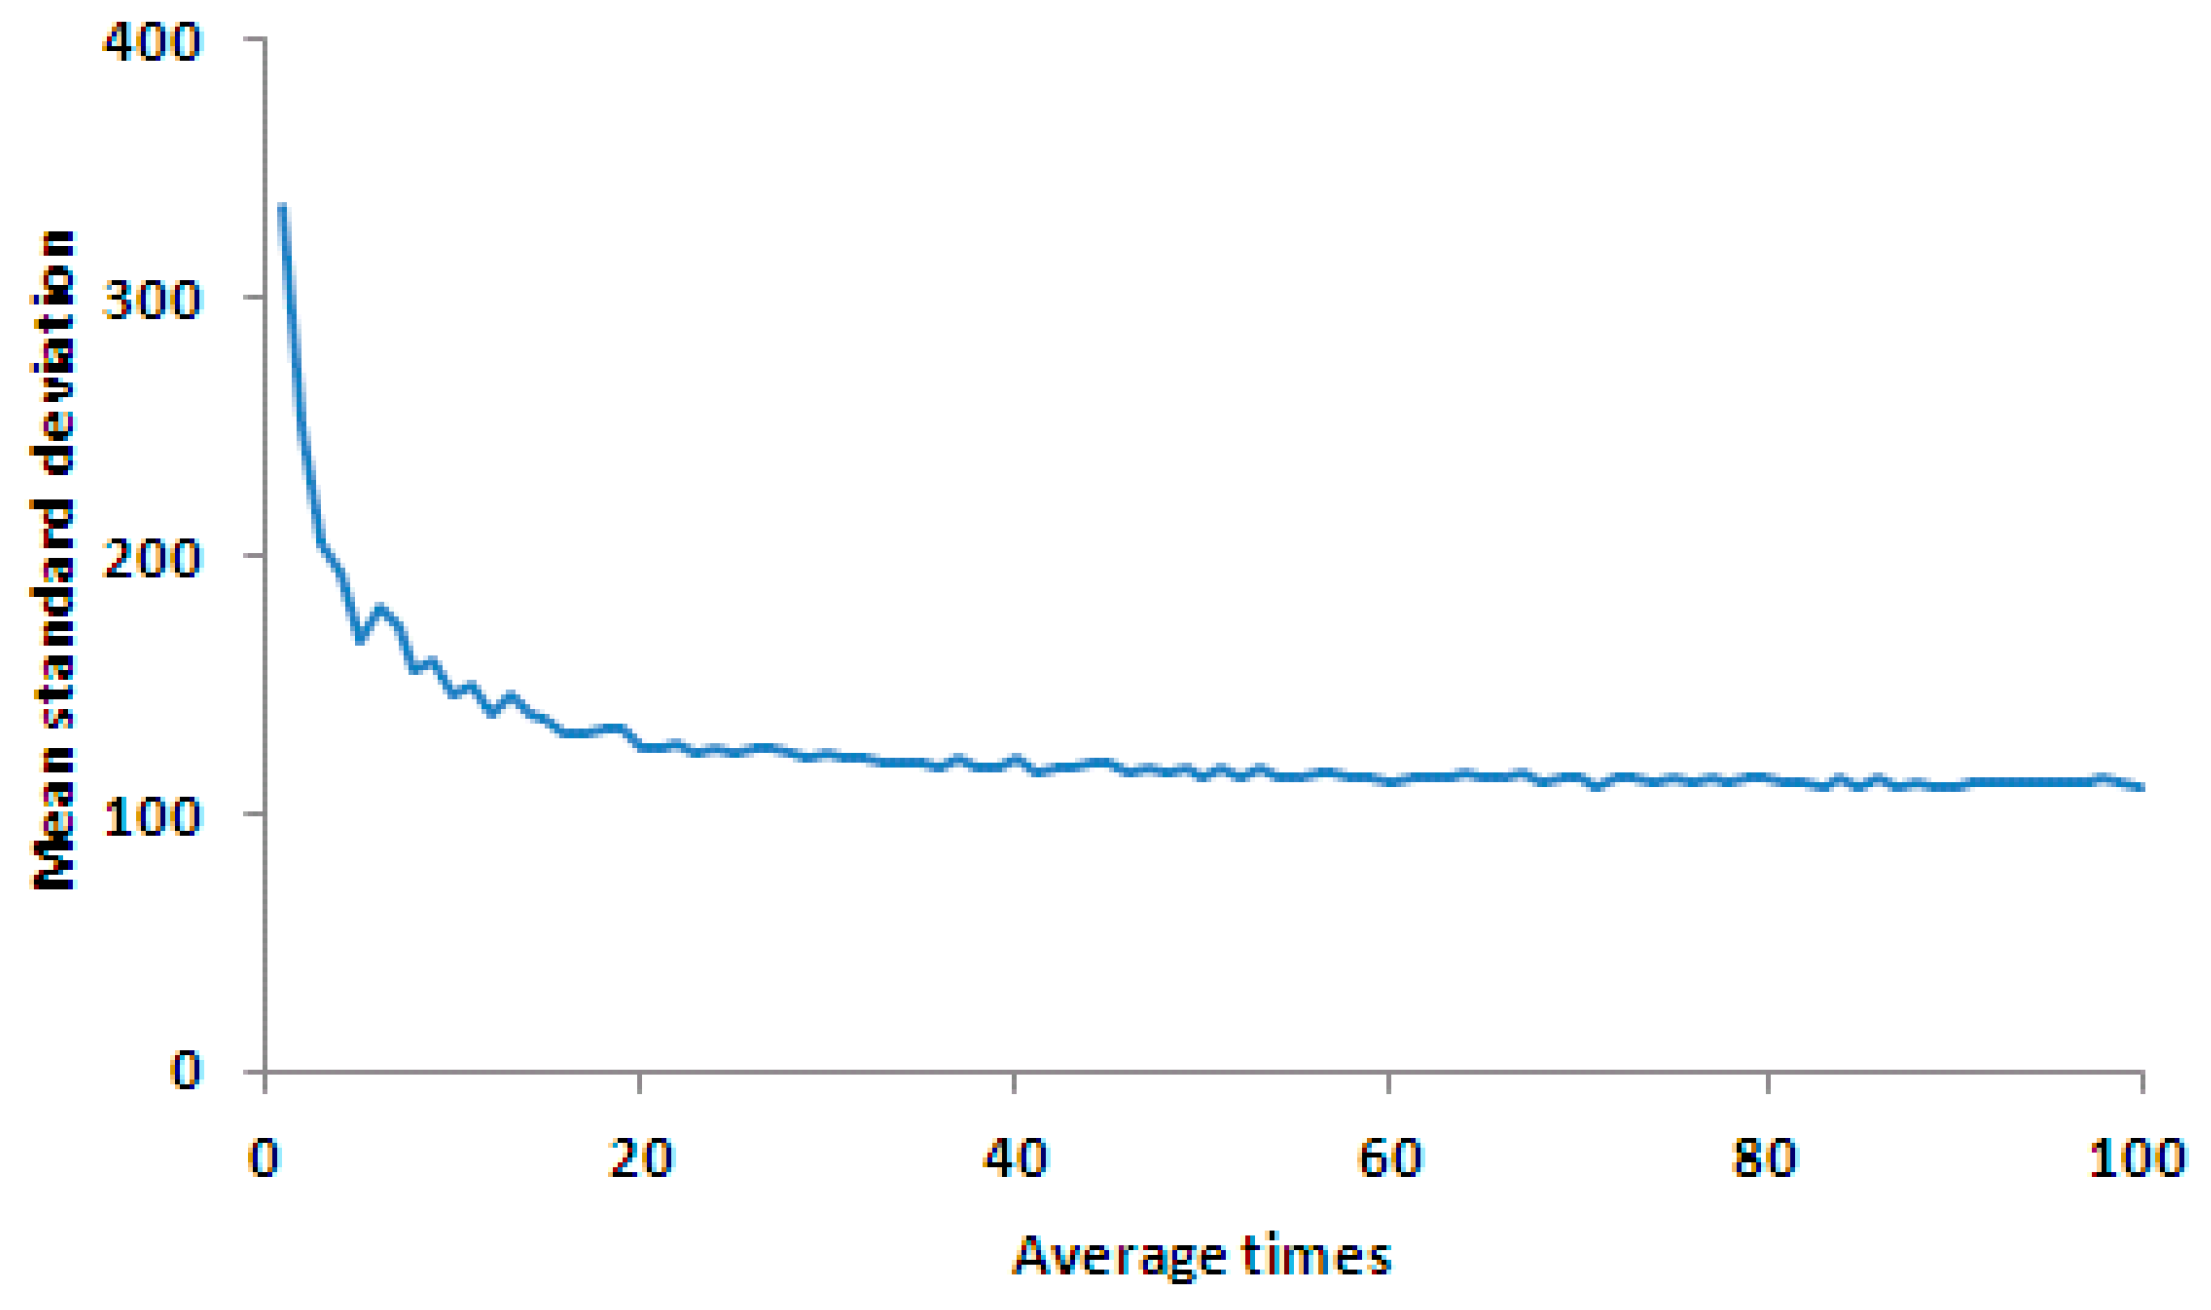
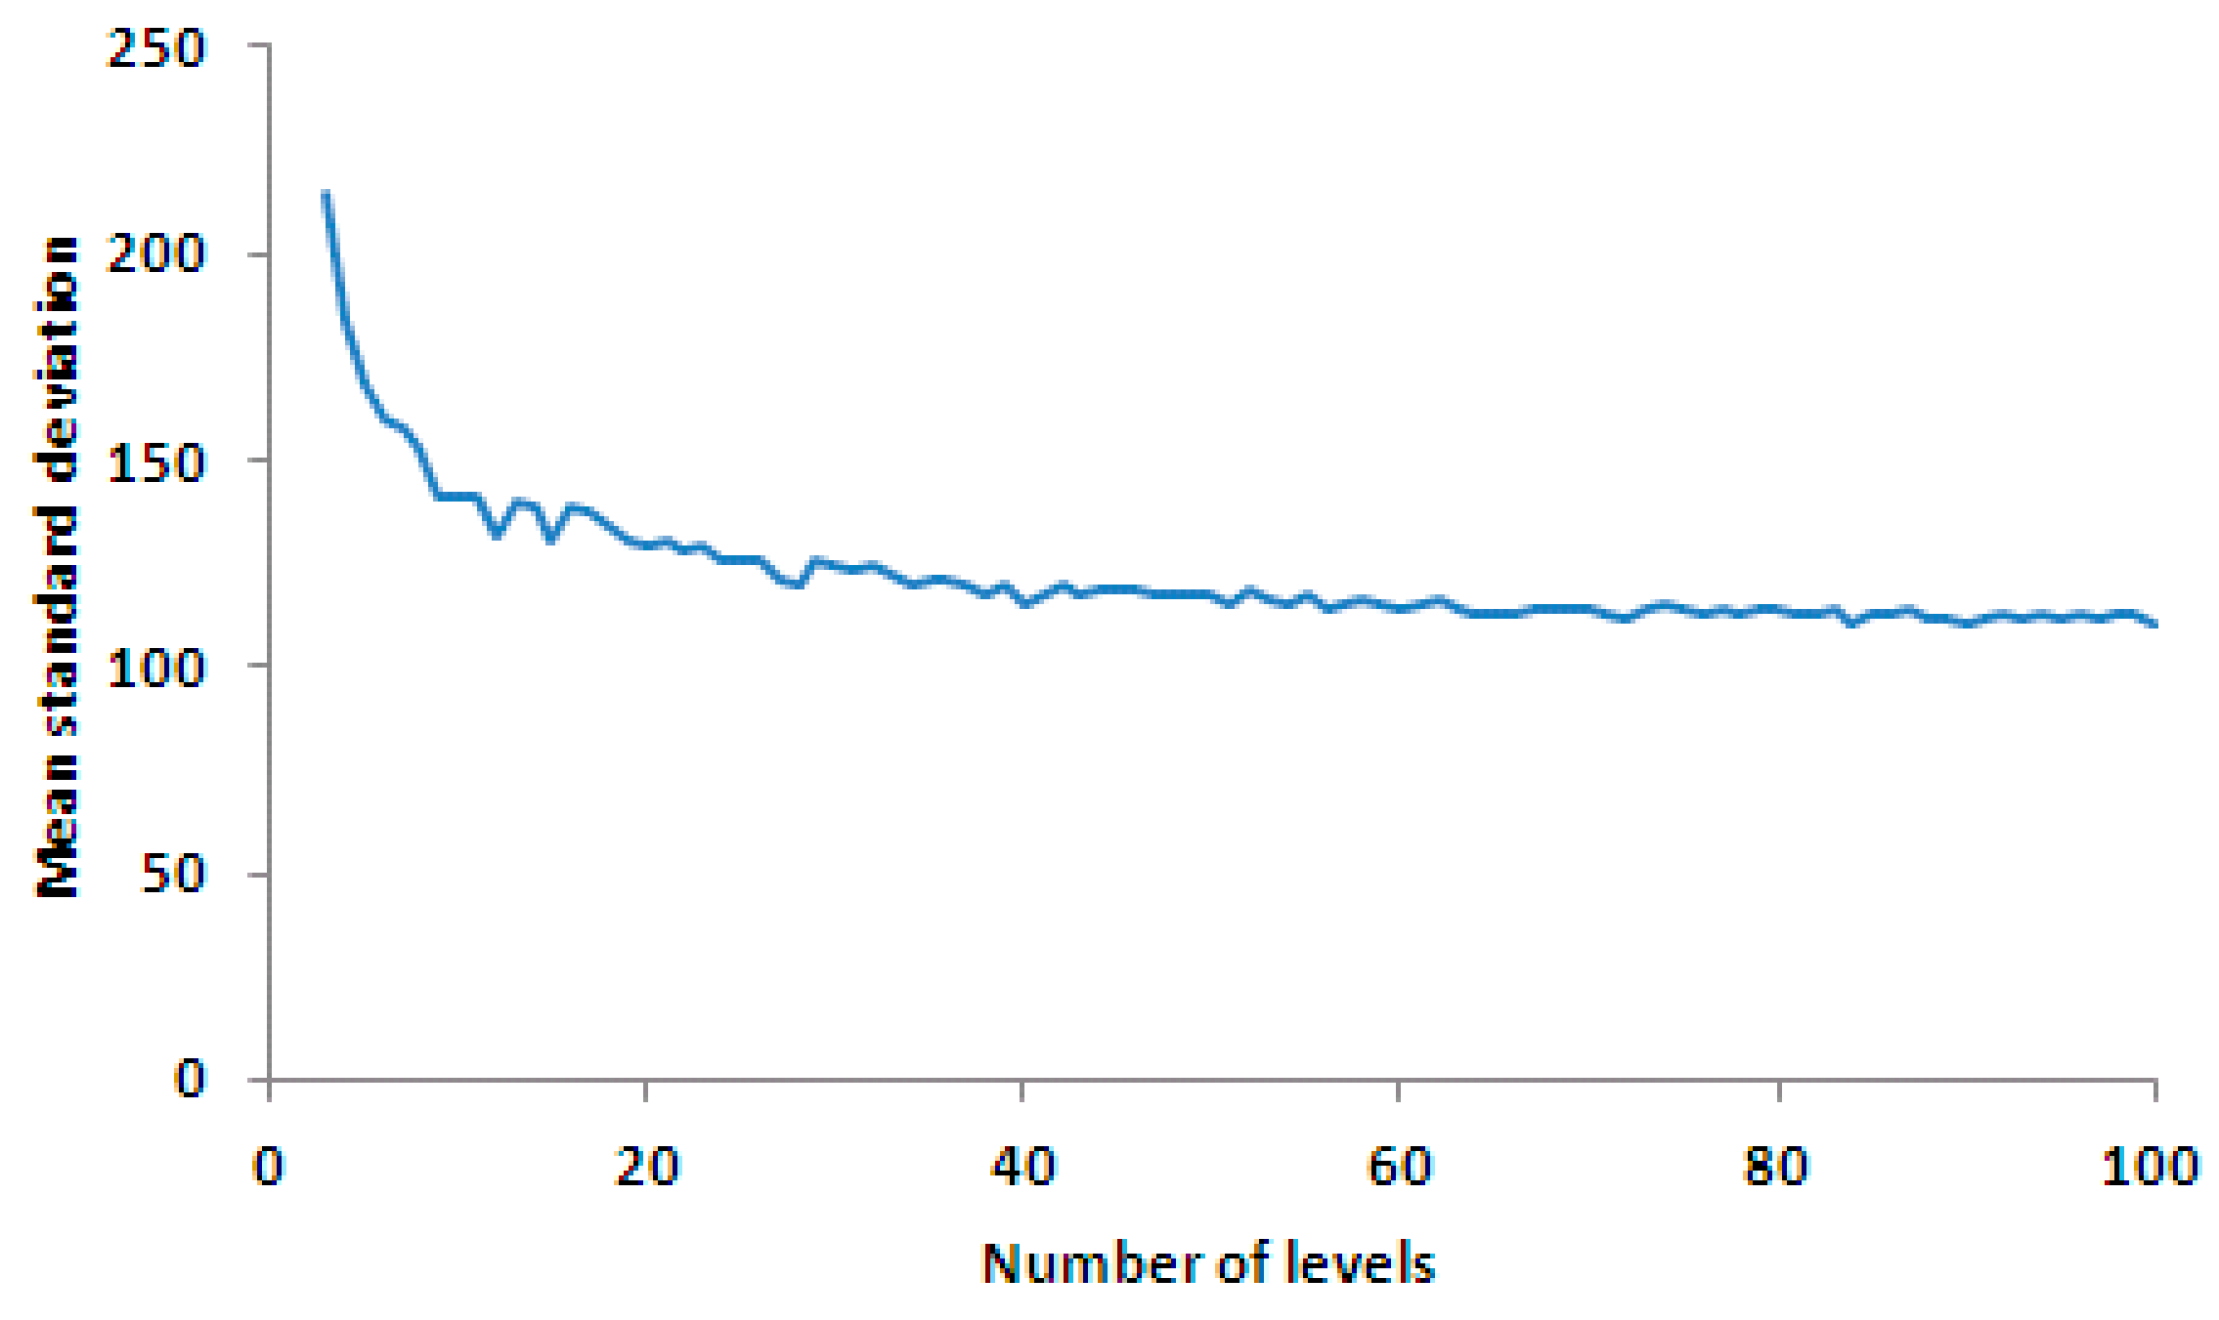
As illustrated in
Figure 8, the larger the number of averaging measurements, the smaller the standard deviation of the corrected result. The error was reduced dramatically when the number of averaging was increased from three to 20. When the number of averaging was larger than 20, the error was reduced more slowly.
Case 2: to understand the impact of the number of the radiance level on the precision.
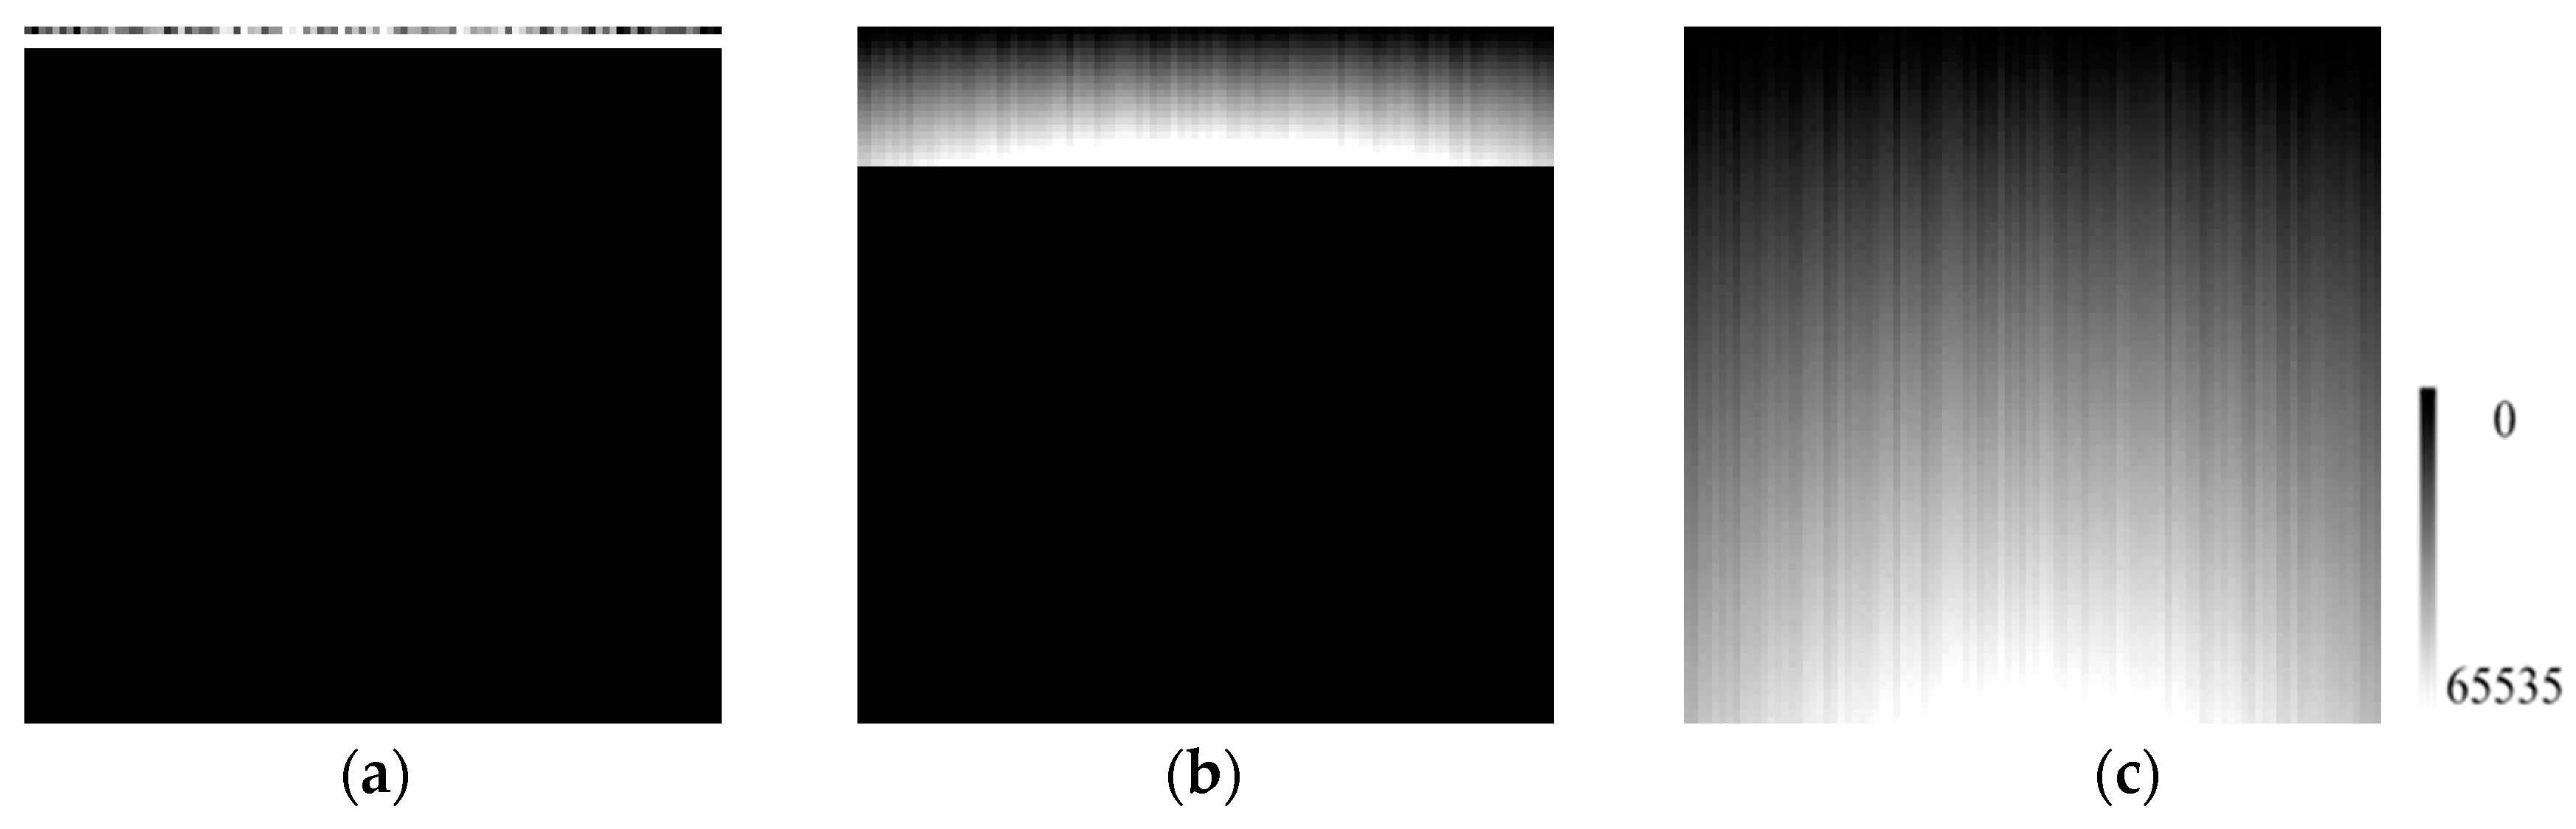
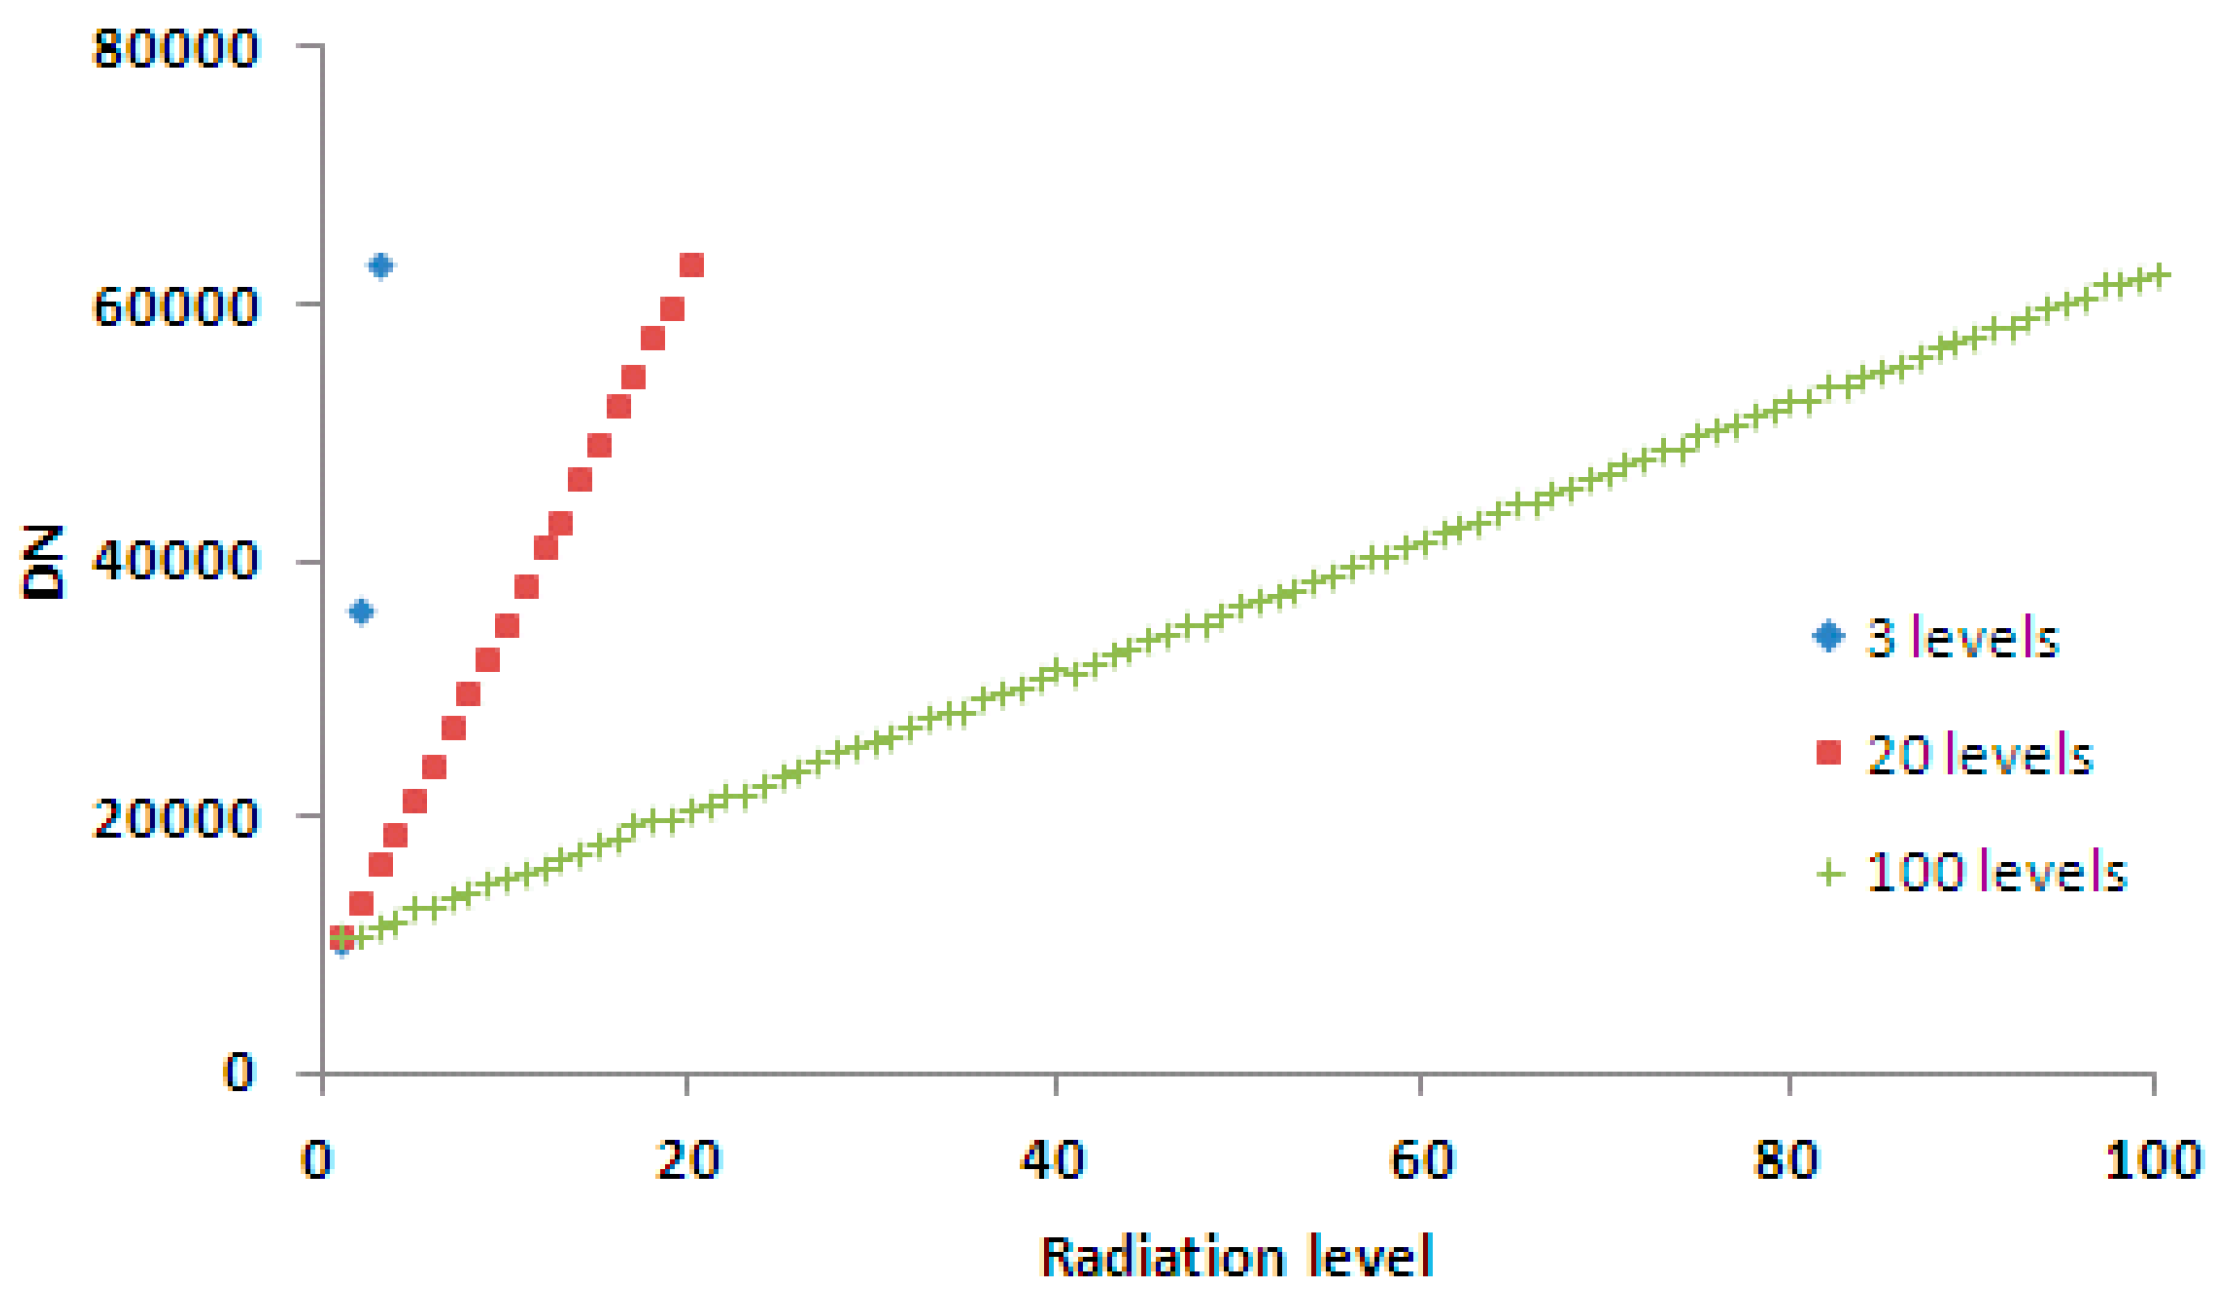
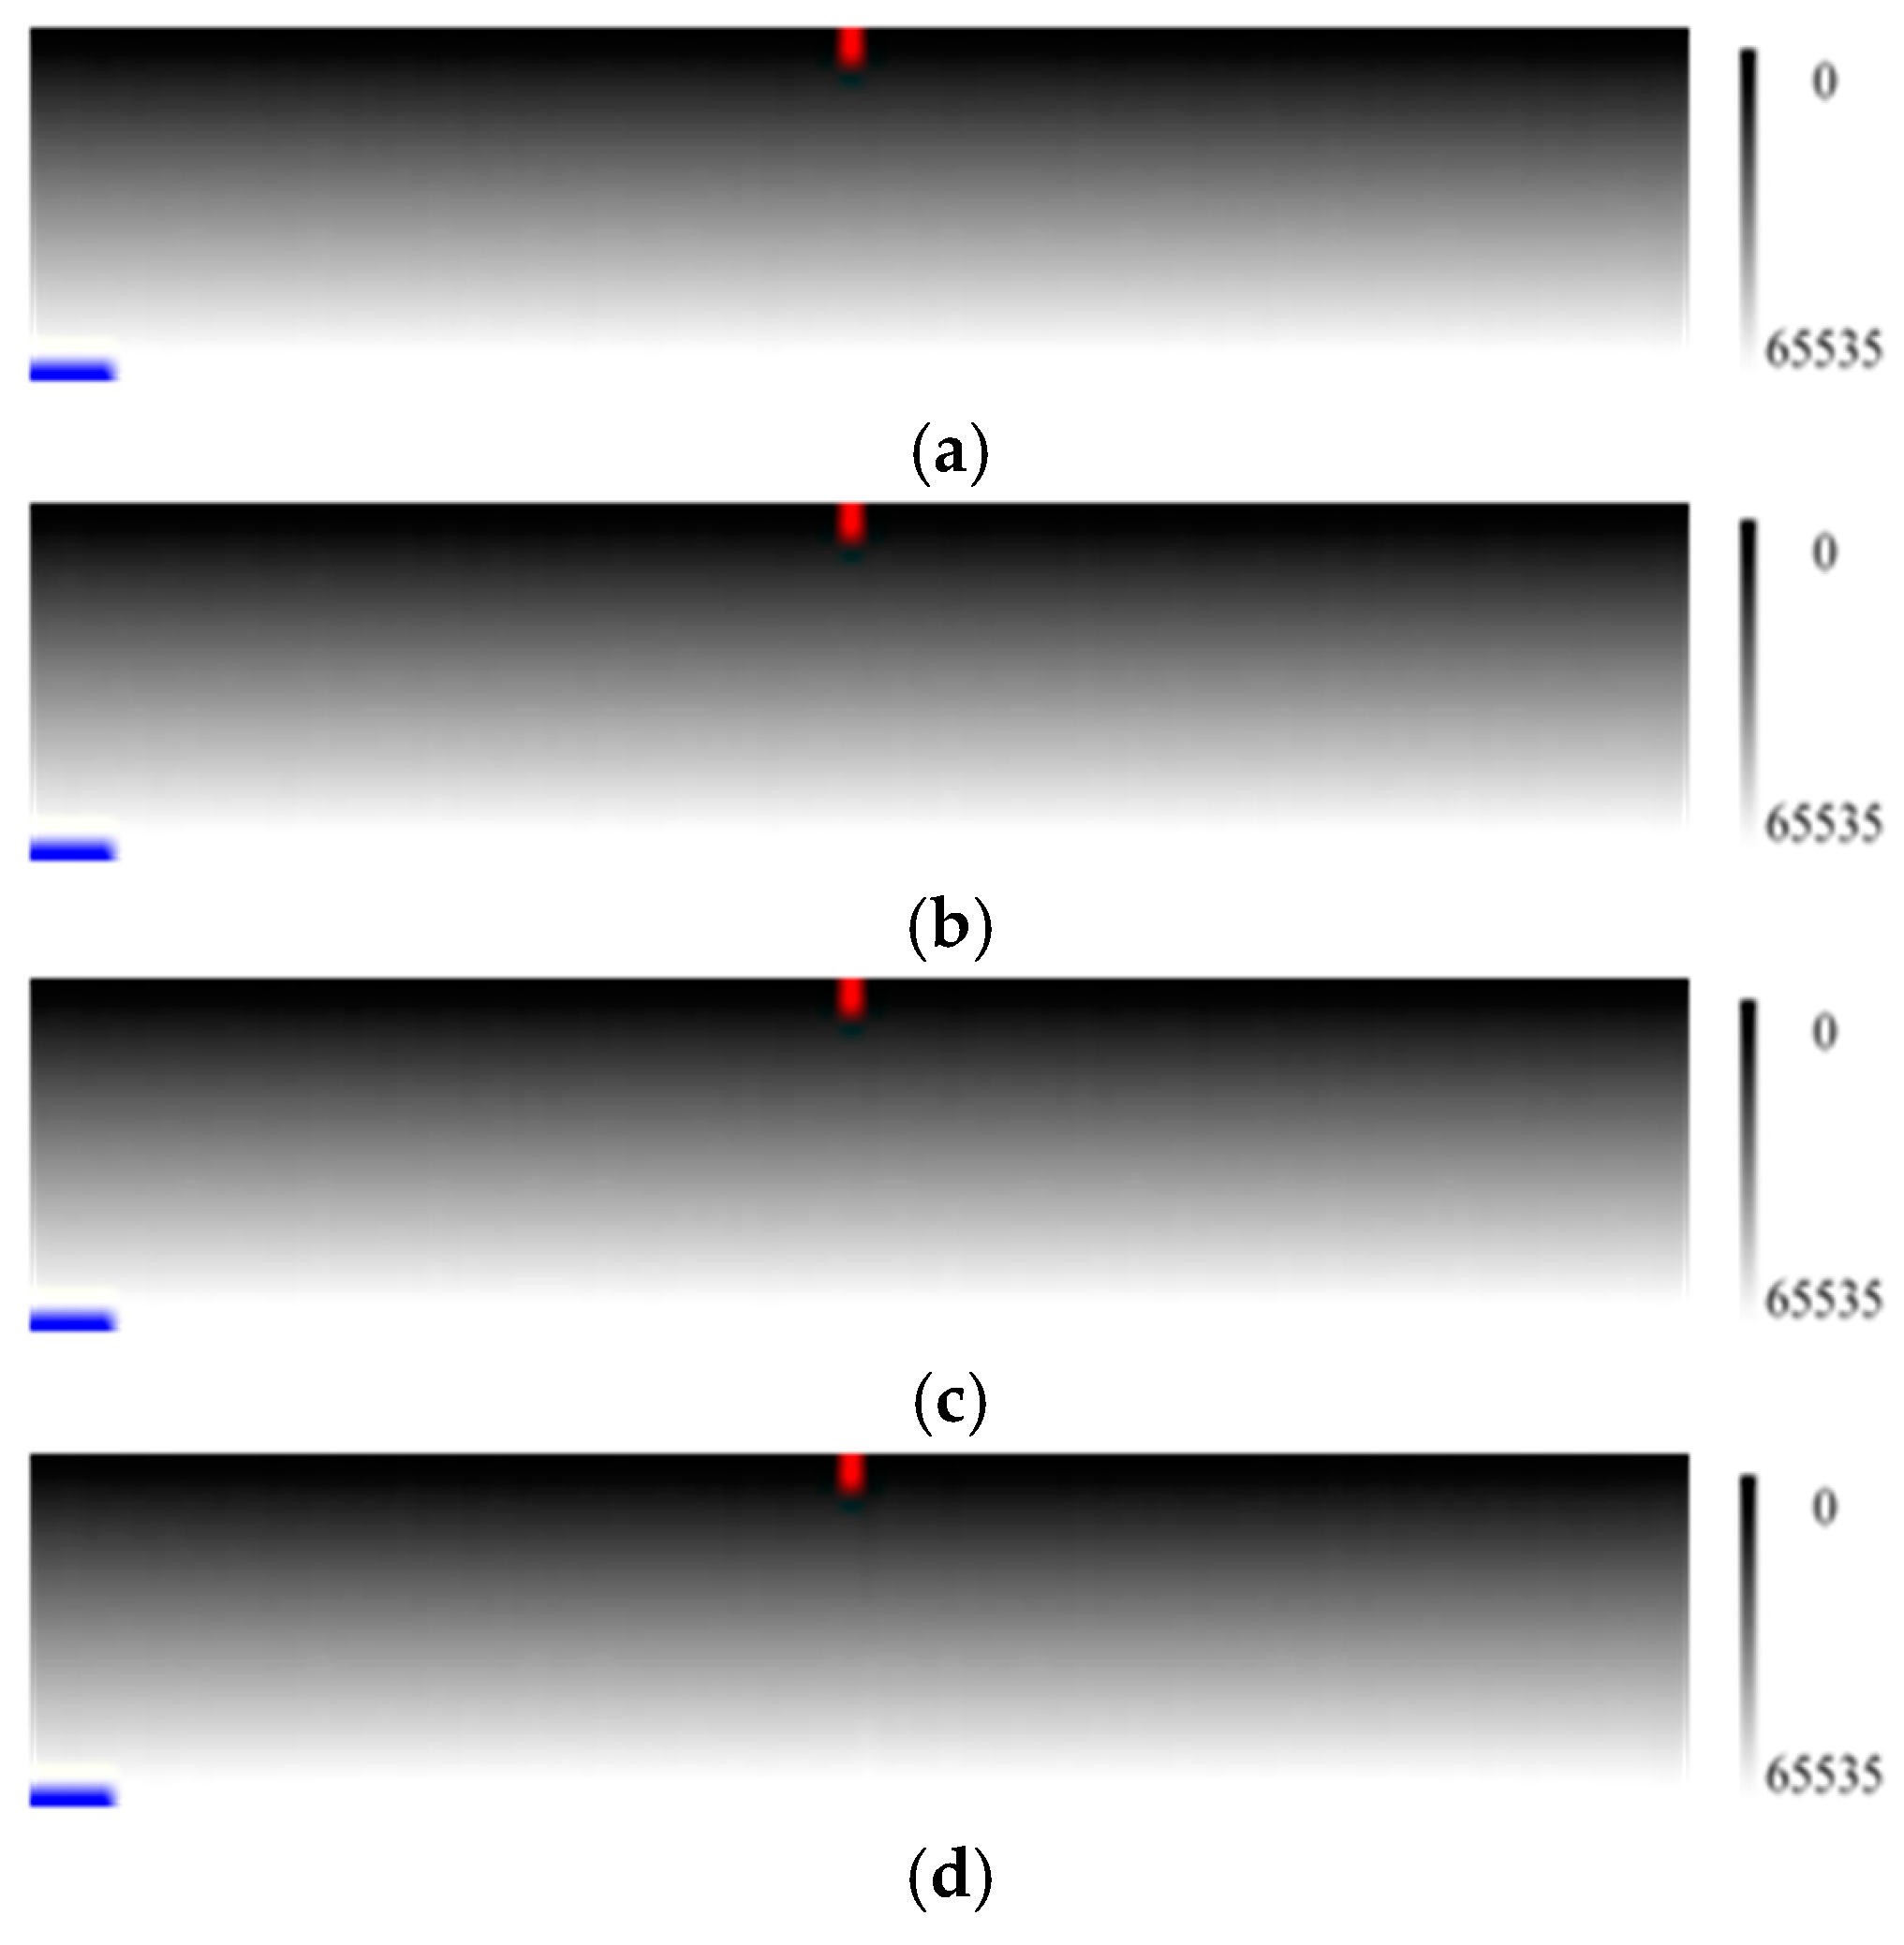
As illustrated in
Figure 9 and
Figure 10, the numerical ranges of the columns with the same column number were duplicated, but the interval between levels was smaller as the number of levels increased.
As shown in
Figure 11, the relative calibration result was better with the calibration coefficients from larger numbers of the radiance level.
As seen from
Figure 12, the calculated gain coefficients became much closer to the simulated gain coefficients and the calculated offset coefficients had little change as the number of levels increased, so the corresponding corrected result was improved.
As illustrated in
Figure 13, the bigger the number of radiance level, the smaller the standard deviation of the corrected result. The error was reduced dramatically when the number of radiance level was increased from three to 30. When the number of the radiance level was bigger than 30, the error was reduced more slowly, along with the increase of the number of the radiance level.
Case 3: to understand the impact of the grouping method on the precision.
Figure 14 is the simulated calibration data for grouping method analysis.
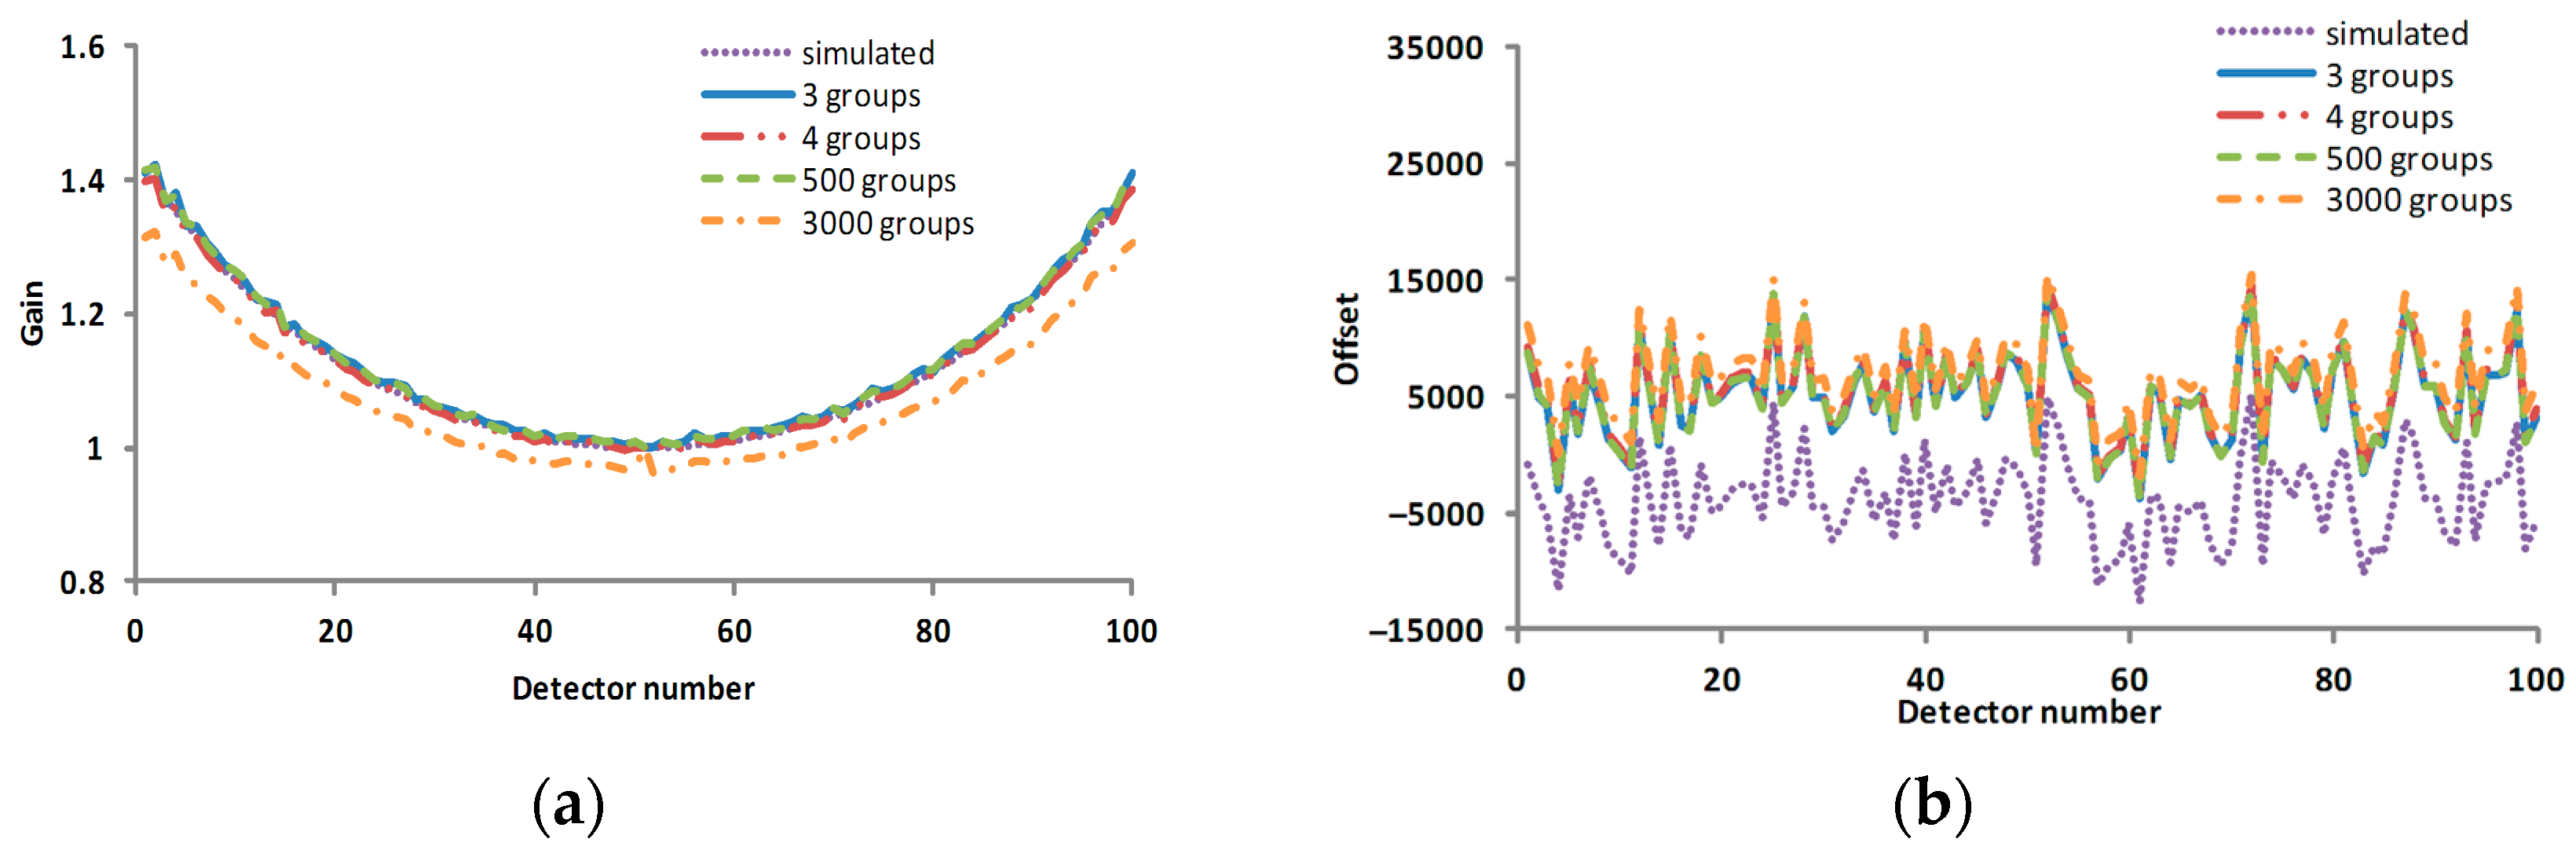
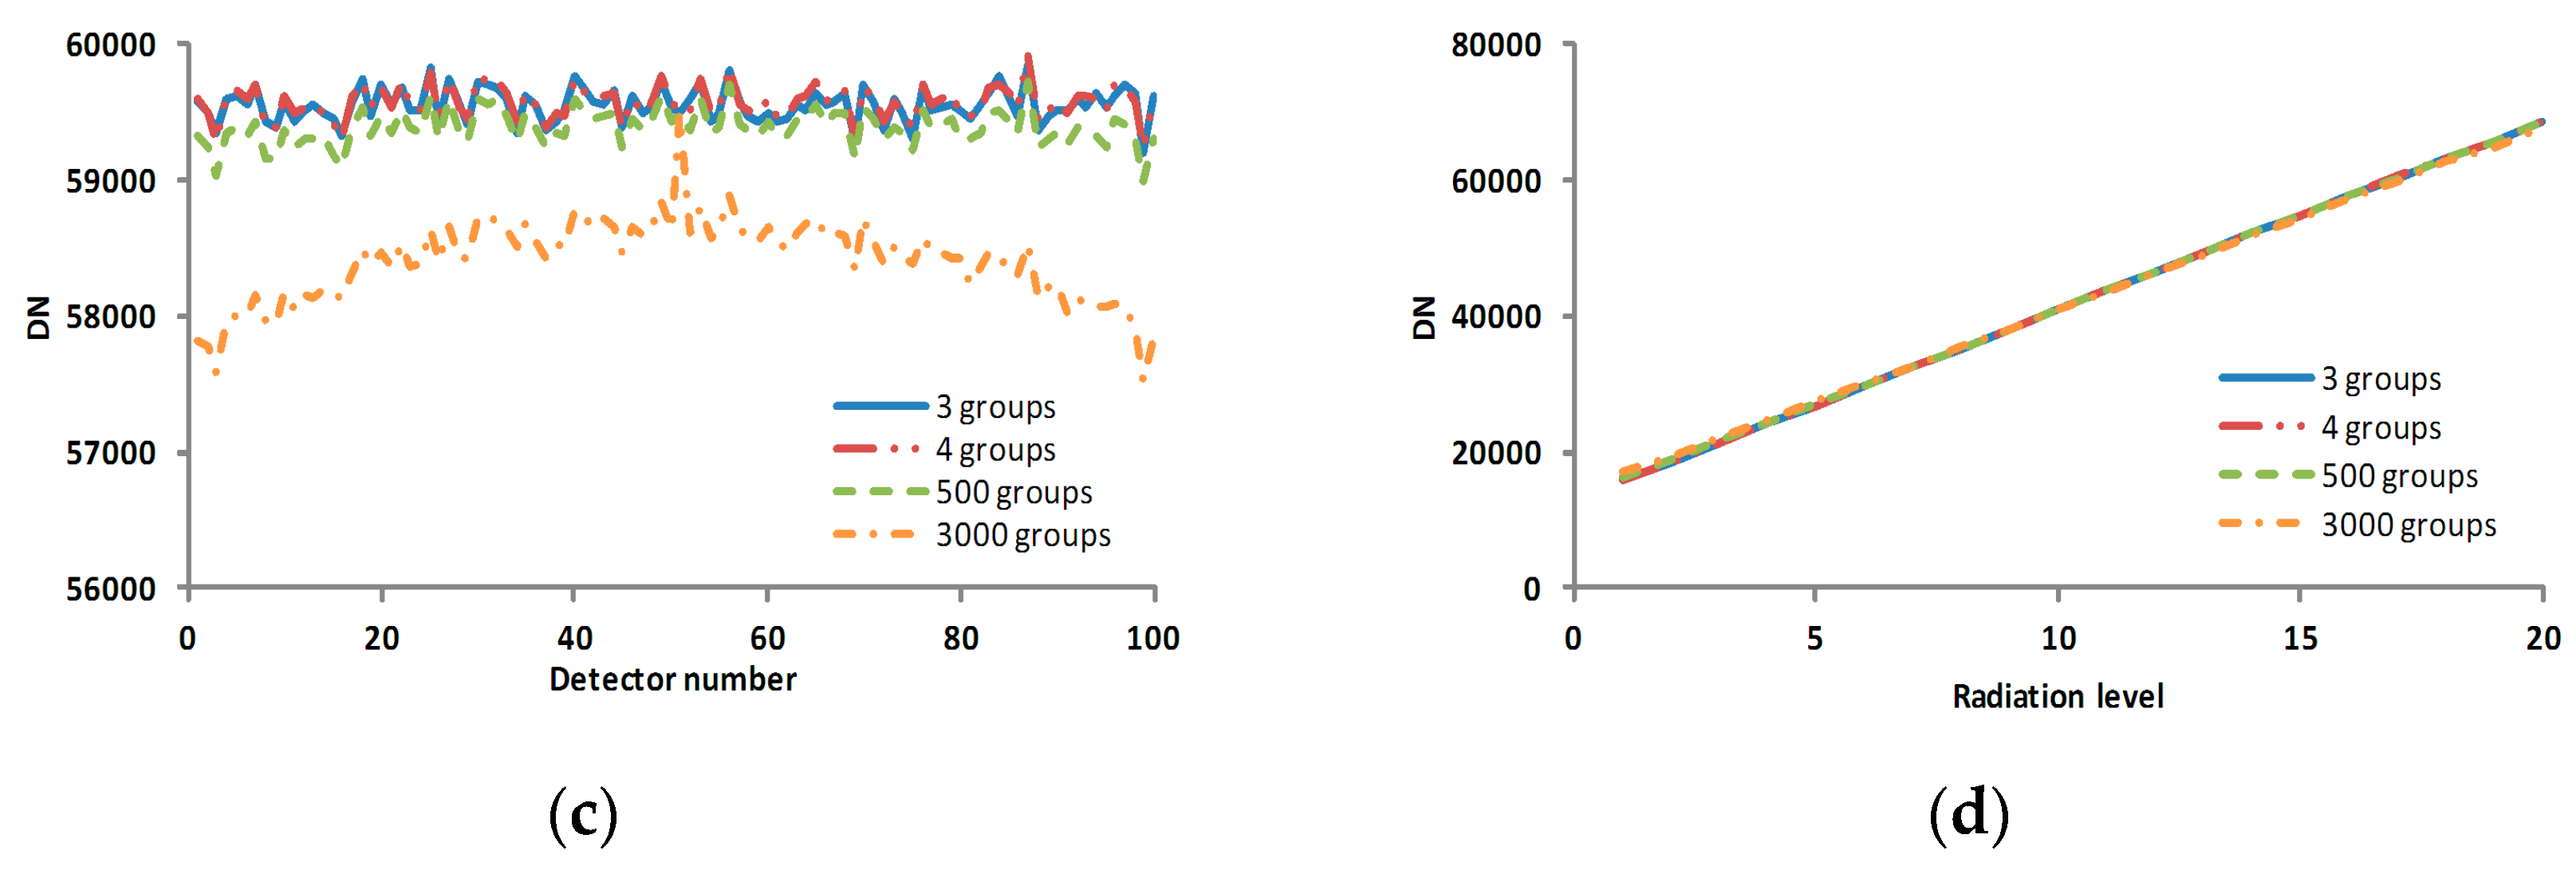
We divided the 3000 radiance level evenly into 3, 4, …, 1500, 3000 groups, which was divisible to 3000, and conducted average calculation for each level and each group, followed by the calculation of the relative radiometric calibration coefficients using pixel 51 as the standard reference. Correcting the verification image by the calculated relative radiometric calibration coefficients of various grouping cases, we obtained the results shown in
Figure 15.
Although the differences among the corrected result images in
Figure 15 are not obvious, it is still shown in
Figure 16 that the calculated gain coefficients became much closer to the simulated gain coefficients and the calculated offset coefficients had little change as the number of groups decreased, and the corresponding corrected result was improved. The standard deviations of the profiles in
Figure 16c for 3, 4, 500, 3000 groups are 122.73, 120.32, 129.53 and 302.57, respectively.
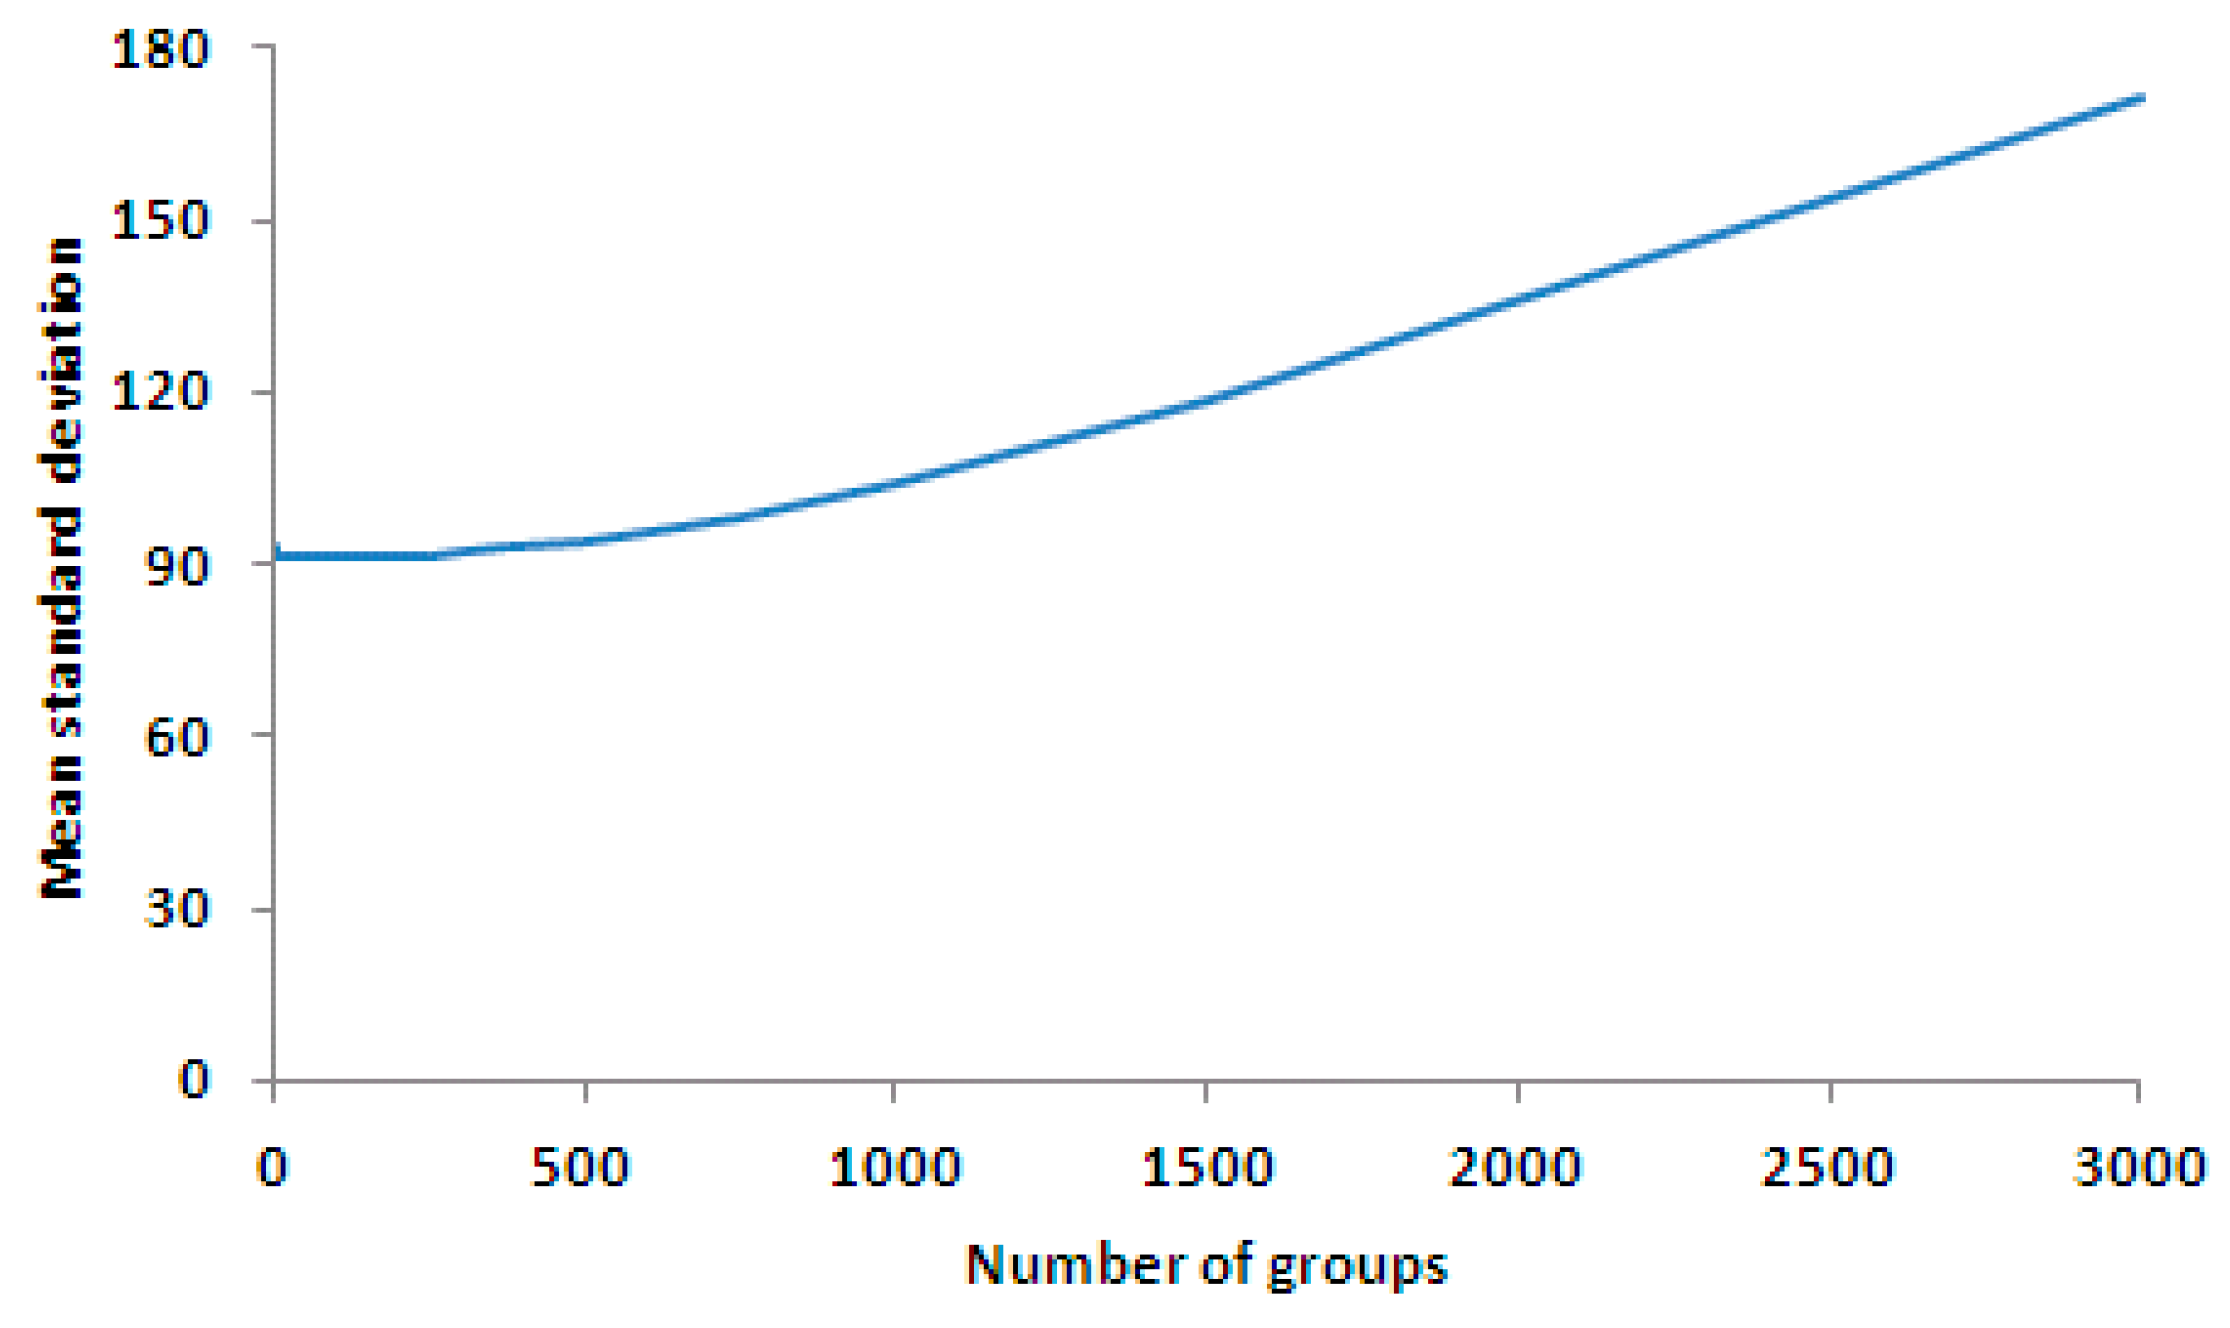
As illustrated by
Figure 16 and
Figure 17, the calibration result produced by four groups even-division was better than that of any other even-division. When the number of groups was increased, the calibration result became worse, which coincides with the conclusion from Equation (13).
4. Discussion
It was difficult to increase the radiance level for the targets during the course of the experiment when conducting the traditional relative radiometric calibration (no matter which method, either lab calibration, or in-orbit internal, or in-orbit synchronization, was used). For example, it is feasible to increase the radiance level from five to 10, or even 20 in lab calibration. However, it is impractical to increase the radiance level to 100 or more as it requires a large number of radiation sources where (1) each source has spectral radiation stability and a distinct radiation difference from the others; (2) a combination of multiple radiation sources and many integral spheres (or reference boards) with different reflective properties; or (3) a radiation source which can fine tune the radiation energy. None of these can easily achieved. Even if the required radiance level is met, the workload of the measurements is huge because every time the radiation source is adjusted, the measurement and the record need to be done accordingly, and as a result the workload in processing the data is also increased.
However, utilizing Equations (14) and (15), the precision of the calibration coefficients can be improved rapidly via the increase of the number of measurements at each radiation level. When the number of grouping is four, the increase of the radiance level achieves the same effect as the increase of the number of measurements. In other cases, the increase of the number of measurements demonstrated a stronger effect than the increase of the radiance level. To increase the number of measurements is relatively easier to implement and does not actually add any difficulty to the whole calibration process, thus making the experiment as well as the data processing process simple and efficient. It was also noticed that this method of improving the calibration precision by increasing the number of measurements is based on the assumptions that the experimental environment and the sensors' working status are stable and the characteristics of the stochastic noise are unchanging. As the number of measurements cannot be infinitely increased, dozens of measurements should suffice. Therefore, in order to improve the precision of the relative radiometric calibration, the strategy is to increase the number of the radiance level and the number of measurements simultaneously and take the latter as the main force.


