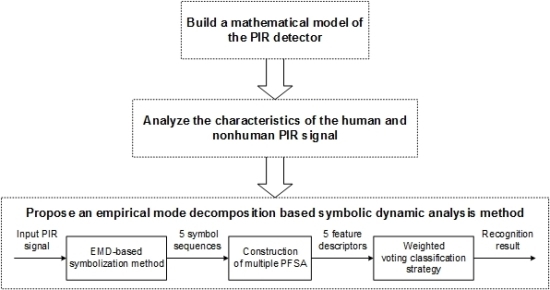
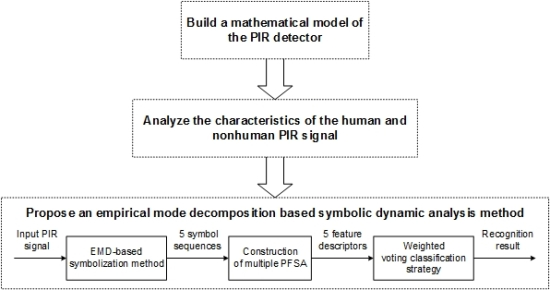
Article

EMD-Based Symbolic Dynamic Analysis for the Recognition of Human and Nonhuman Pyroelectric Infrared Signals

1
Key Lab of Optoelectronic Technology and Systems, Chongqing University, 174 Shazheng Street, Chongqing 400044, China
2
Technology Center of Sichuan Changhong Electric Co. Ltd, 199 Tianfu Road, Chengdu 610000, China
*
Author to whom correspondence should be addressed.
These authors contributed equally to this work.
Sensors 2016, 16(1), 126; https://doi.org/10.3390/s16010126
Submission received: 10 November 2015 / Revised: 14 January 2016 / Accepted: 14 January 2016 / Published: 20 January 2016
(This article belongs to the Special Issue Infrared and THz Sensing and Imaging)

Abstract

:
In this paper, we propose an effective human and nonhuman pyroelectric infrared (PIR) signal recognition method to reduce PIR detector false alarms. First, using the mathematical model of the PIR detector, we analyze the physical characteristics of the human and nonhuman PIR signals; second, based on the analysis results, we propose an empirical mode decomposition (EMD)-based symbolic dynamic analysis method for the recognition of human and nonhuman PIR signals. In the proposed method, first, we extract the detailed features of a PIR signal into five symbol sequences using an EMD-based symbolization method, then, we generate five feature descriptors for each PIR signal through constructing five probabilistic finite state automata with the symbol sequences. Finally, we use a weighted voting classification strategy to classify the PIR signals with their feature descriptors. Comparative experiments show that the proposed method can effectively classify the human and nonhuman PIR signals and reduce PIR detector’s false alarms.

Graphical Abstract

1. Introduction

The pyroelectric infrared (PIR) detector has been widely used in many industrial and security applications. It has many advantages, such as low cost, low power consumption and no invasion of privacy, which endow it with strong market competitiveness [1]. However, in the field of public security, due to its restrained target discriminating ability and vulnerability to environmental noise, its performance is often limited by high false alarm rates and classification errors [2]. Therefore, exploring effective feature extraction and classification methods for recognizing the human and nonhuman PIR signals has become a meaningful and interesting task.
In recent years, some researchers have used PIR sensors or sensor networks for target tracking [3], fire detection [4] and human identification [5], etc., but only a few studies have attempted to explore an effective human and nonhuman recognition method with a single PIR sensor [6,7,8]. In [6], Wang et al. employed wavelet packet entropy (WPE) to capture the transient features of human and nonhuman PIR signals and declared that their method could recognize the adults, dogs and bulbs. Considering that auto-regressive (AR) spectrum analysis can obtain high frequency resolution, Gong et al. [7] used AR-based spectral estimation to extract the frequency features of the human and nonhuman PIR signals for reducing PIR detector false alarms. Besides, Xin et al. [8] adopted symbolic dynamic filtering (SDF) as the feature extraction method for target detection and classification using seismic and PIR sensors and obtained satisfactory results.
The methods mentioned above have indeed improved PIR detector performance, but they still have some drawbacks. Although the WPE-based feature extraction method can effectively capture the transient features of the original PIR signal, to achieve a high classification accuracy, the wavelet bases must be carefully selected. The AR model is a suitable tool for the analysis of the stationary signals, but PIR signals are sometimes non-stationary. SDF can effectively identify the statistical patterns of the symbol sequences generated from the time series data [9], however, the symbolization can be viewed as a coarse-graining of the original PIR signal, which may lose the detailed feature information contained in the original PIR signal [10]. Besides, these studies only provide signal processing methods for human and nonhuman recognition, but they never analyze the inherent differences between human and nonhuman PIR signals or use these differences to explore a more effective recognition method.
To address the problems mentioned above, first, we build a mathematical model of the PIR detector for analyzing the discriminable features of the human and nonhuman PIR signals and finding their inherent differences. Then, according to the analysis results, we propose an empirical mode decomposition (EMD)-based symbolic dynamic analysis method for effectively extracting the discriminable features of human and nonhuman PIR signals. In the proposed method, firstly, we propose an EMD-based symbolization method to rudimentarily extract the detailed features of the original PIR signals into five symbol sequences. Secondly, through constructing multiple probabilistic finite state automata (PFSA) with the symbol sequences, we generate five feature descriptors for each PIR signal. Finally, using a weighted voting classification strategy, we integrate the feature information contained in the feature descriptors and classy the original PIR signal.
The rest of the paper is organized as follows: Section 2 discusses the physical characteristics of the human and nonhuman PIR signals. Section 3 describes the proposed method. Section 4 evaluates the performance of the proposed method in two different applications. Section 5 gives the conclusions of this paper.

2. Physical Characteristics of Human and Nonhuman PIR Signals

To find an effective human and nonhuman PIR signal recognition method, firstly, we analyze theoretically their discriminable features using a mathematical model of a PIR detector. As shown in Figure 1a, a typical PIR detector usually consists of a Fresnel lenses array, a PIR sensor and an electronic module.
Figure 1. (a) Structure of a common PIR detector; (b) layout of the Fresnel lenses array; (c) top view of the distribution of the SZs and NZs in each detection layer, where the sectors labeled by “+” indicate the PSZs, those labeled by “−“ indicate the NSZs and the gaps between the PSZs and NSZs indicate the BZs; (d) lateral view of the distribution of the three detector layers.
Sensors 16 00126 g001
The Fresnel lenses array partitions the detector’s field of view (FOV) into a series of alternately distributed “sensitive zones” (SZs) and “blind zones” (BZs). Owing to the dual structure of the PIR sensor, the SZs are divided into positive SZs (PSZ) and negative SZs (NSZ) [11]. If a thermal source goes from a PSZ into a NSZ, the polarity of sensor’s output will be reversed. Because of the three-row layout of the Fresnel lenses array, as shown Figure 1b, the FOV of the PIR detector is accordingly divided into three detection layers, as shown in Figures 1c,d, each detection layer contains different number of SZs (or NZs). Because of the different heights and body shapes, the human and nonhuman targets would intersect with different detection layers when they cross the detector’s FOV. To find the relationship between the intersection pattern of the target and the characters of its PIR signals, we build a mathematical model of the PIR detector. When a PIR sensor is heated by a thermal source, it would generate a current signal that satisfies Equation (1) [12,13]:
I ( t ) = p A s d d t T ( t ) = p A s α C p exp ( G T h t C p ) u ( t ) d d t Φ ( t )
where t indicates the time instance, p, Cp and α indicate the pyroelectric coefficient, heat capacity and absorptivity of the sensitive element respectively, T(t), As and GTh separately indicate the temperature, surface area and thermal conductance of the PIR sensor, u(t) is the unite step function, is the convolution operator, and Φ(t) is the thermal power received by the PIR sensor. According to Liu’s study [13], based on the Stefan-Boltzman law, Φ(t) can be simplified as Equation (2):
Φ ( t ) = k B ε h ( T a 4 T s 4 ) d 0 2 A ( t ) + N ( t )
where d0 indicates the distance between the thermal source and the PIR sensor, kB indicates the emissivity of the thermal source, εh is the Stefan-Boltzmann constant, Ta and Ts indicate the temperature of the ambient and the the thermal source respectively, N(t) is the thermal noise and A(t) is the surface area of the thermal sources that can be observed by the PIR sensor. In the PIR detector, because the infrared radiation coming from the PSZs would be offset by those coming from the NSZs [11], A(t) actually equals to the difference between the target’s surface area that exposes in the PSZs and that exposes in the NSZs, i.e.,:
A ( t ) = i = 1 N A i + ( t ) i = 1 N A i ( t )
where A i + ( t ) is the targets’ surface area that exposes in the ith PSZ, A i ( t ) indicates the surface area that exposes in the ith NSZ, N is the number of the PSZs (or NSZs) in the entire FOV. Therefore, we can term A(t) as “net effective area” (NEA) and term its changing curve as the “NEA curve”.
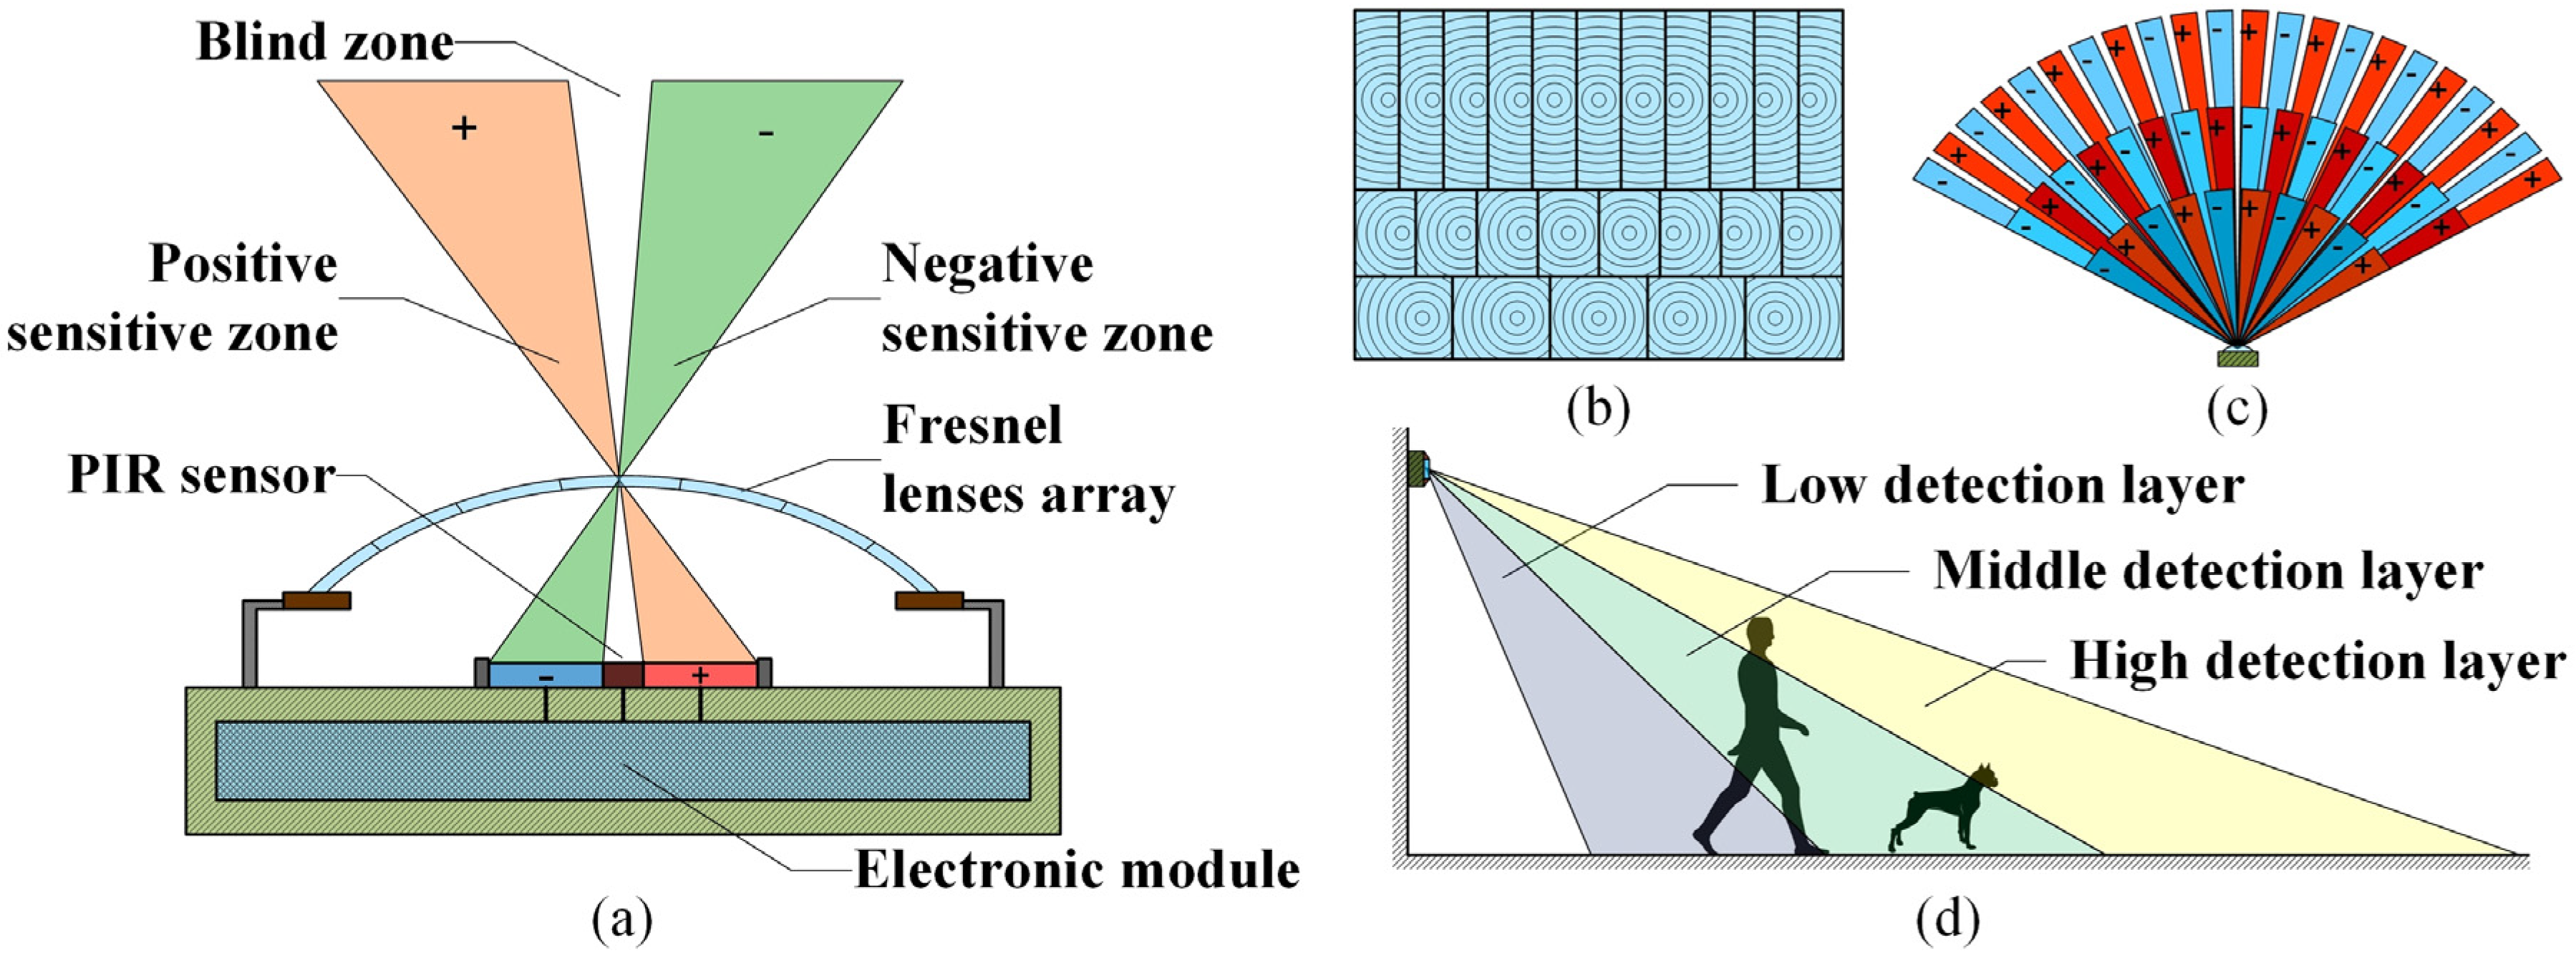
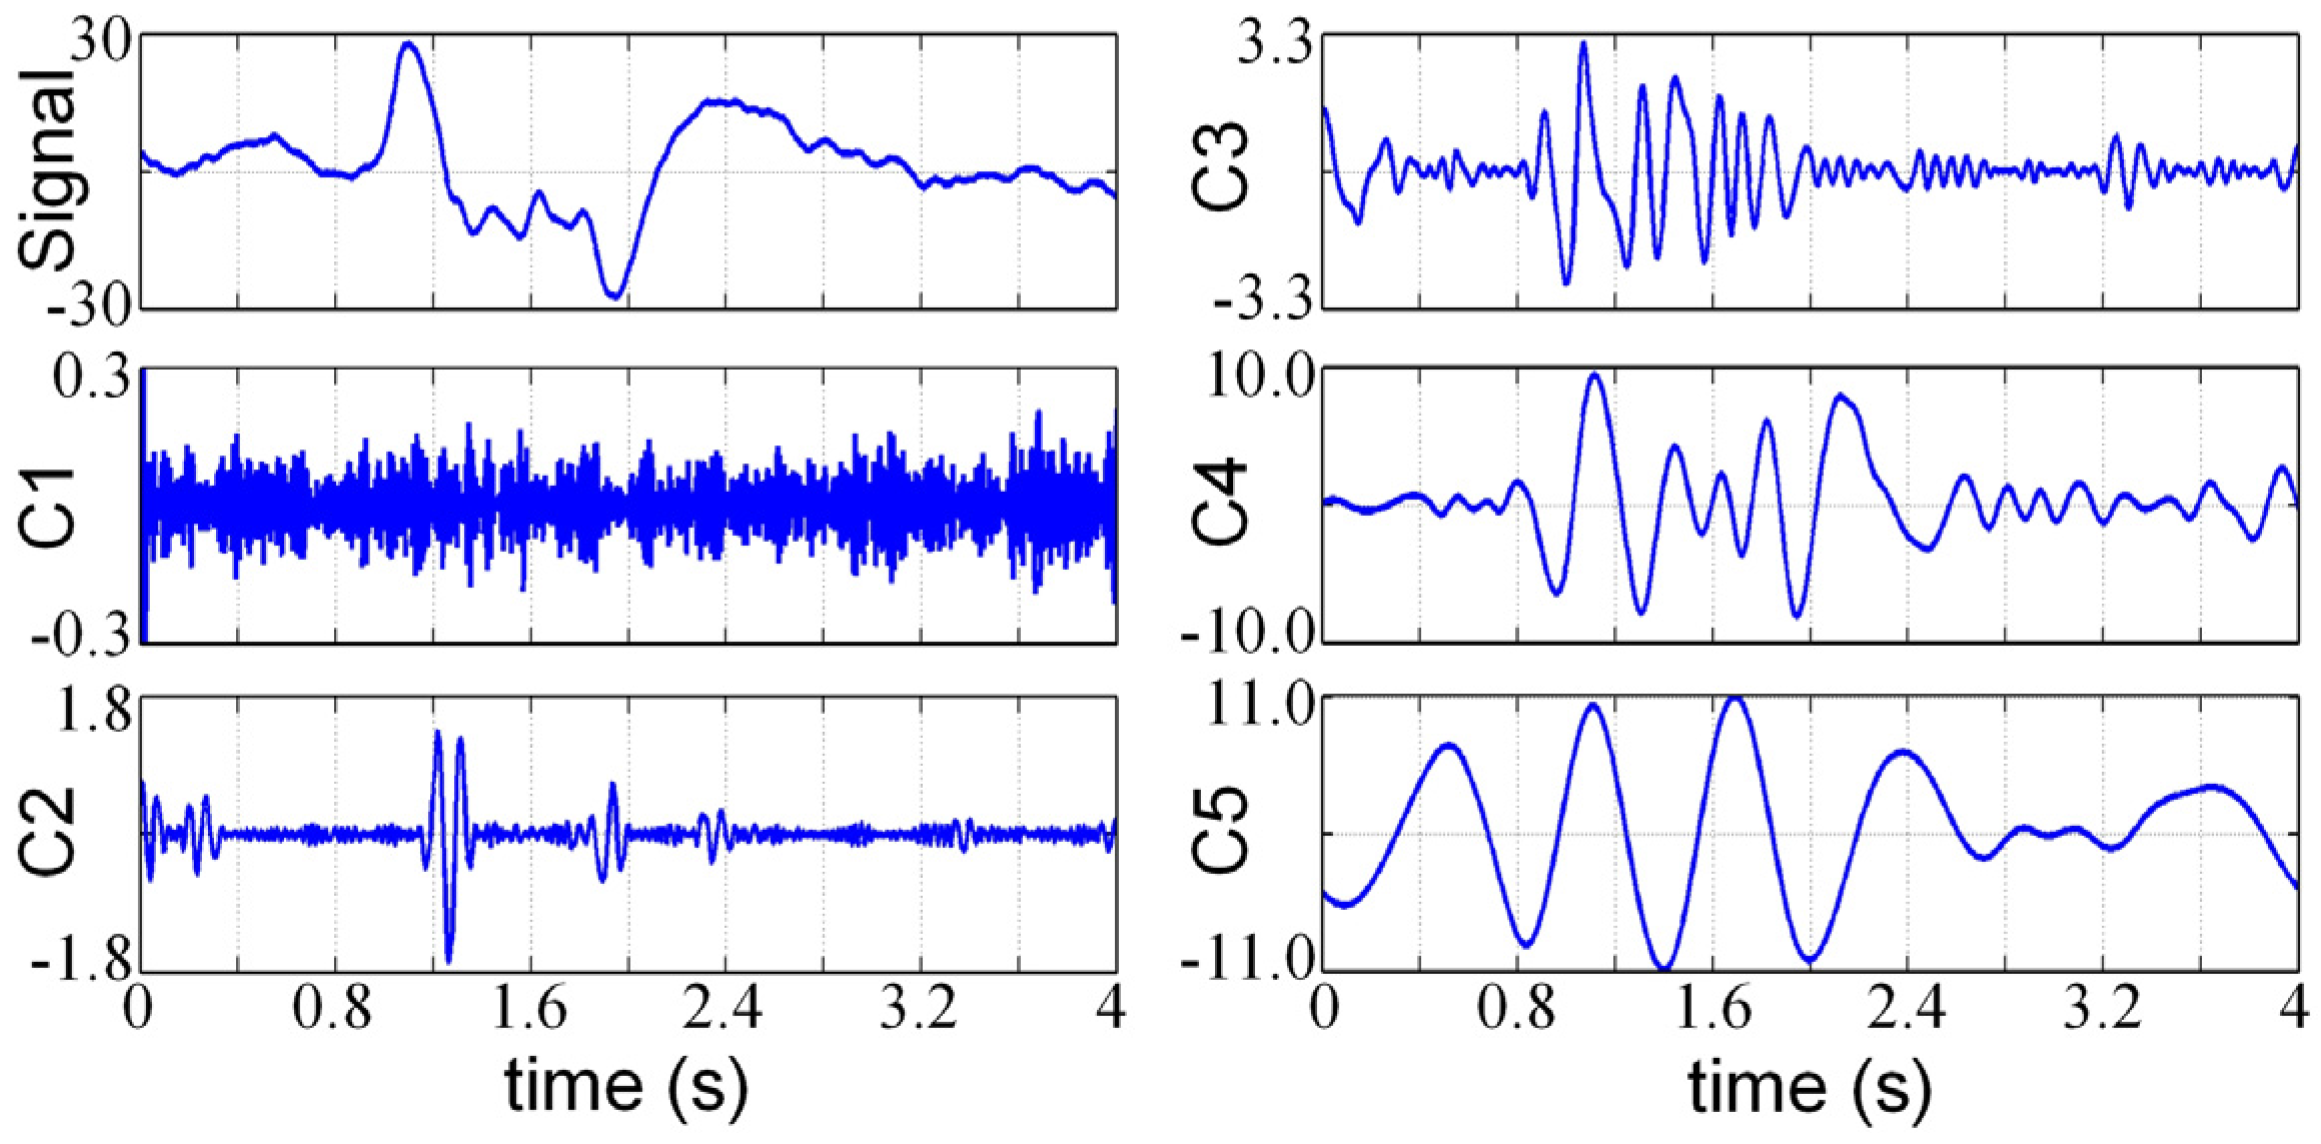
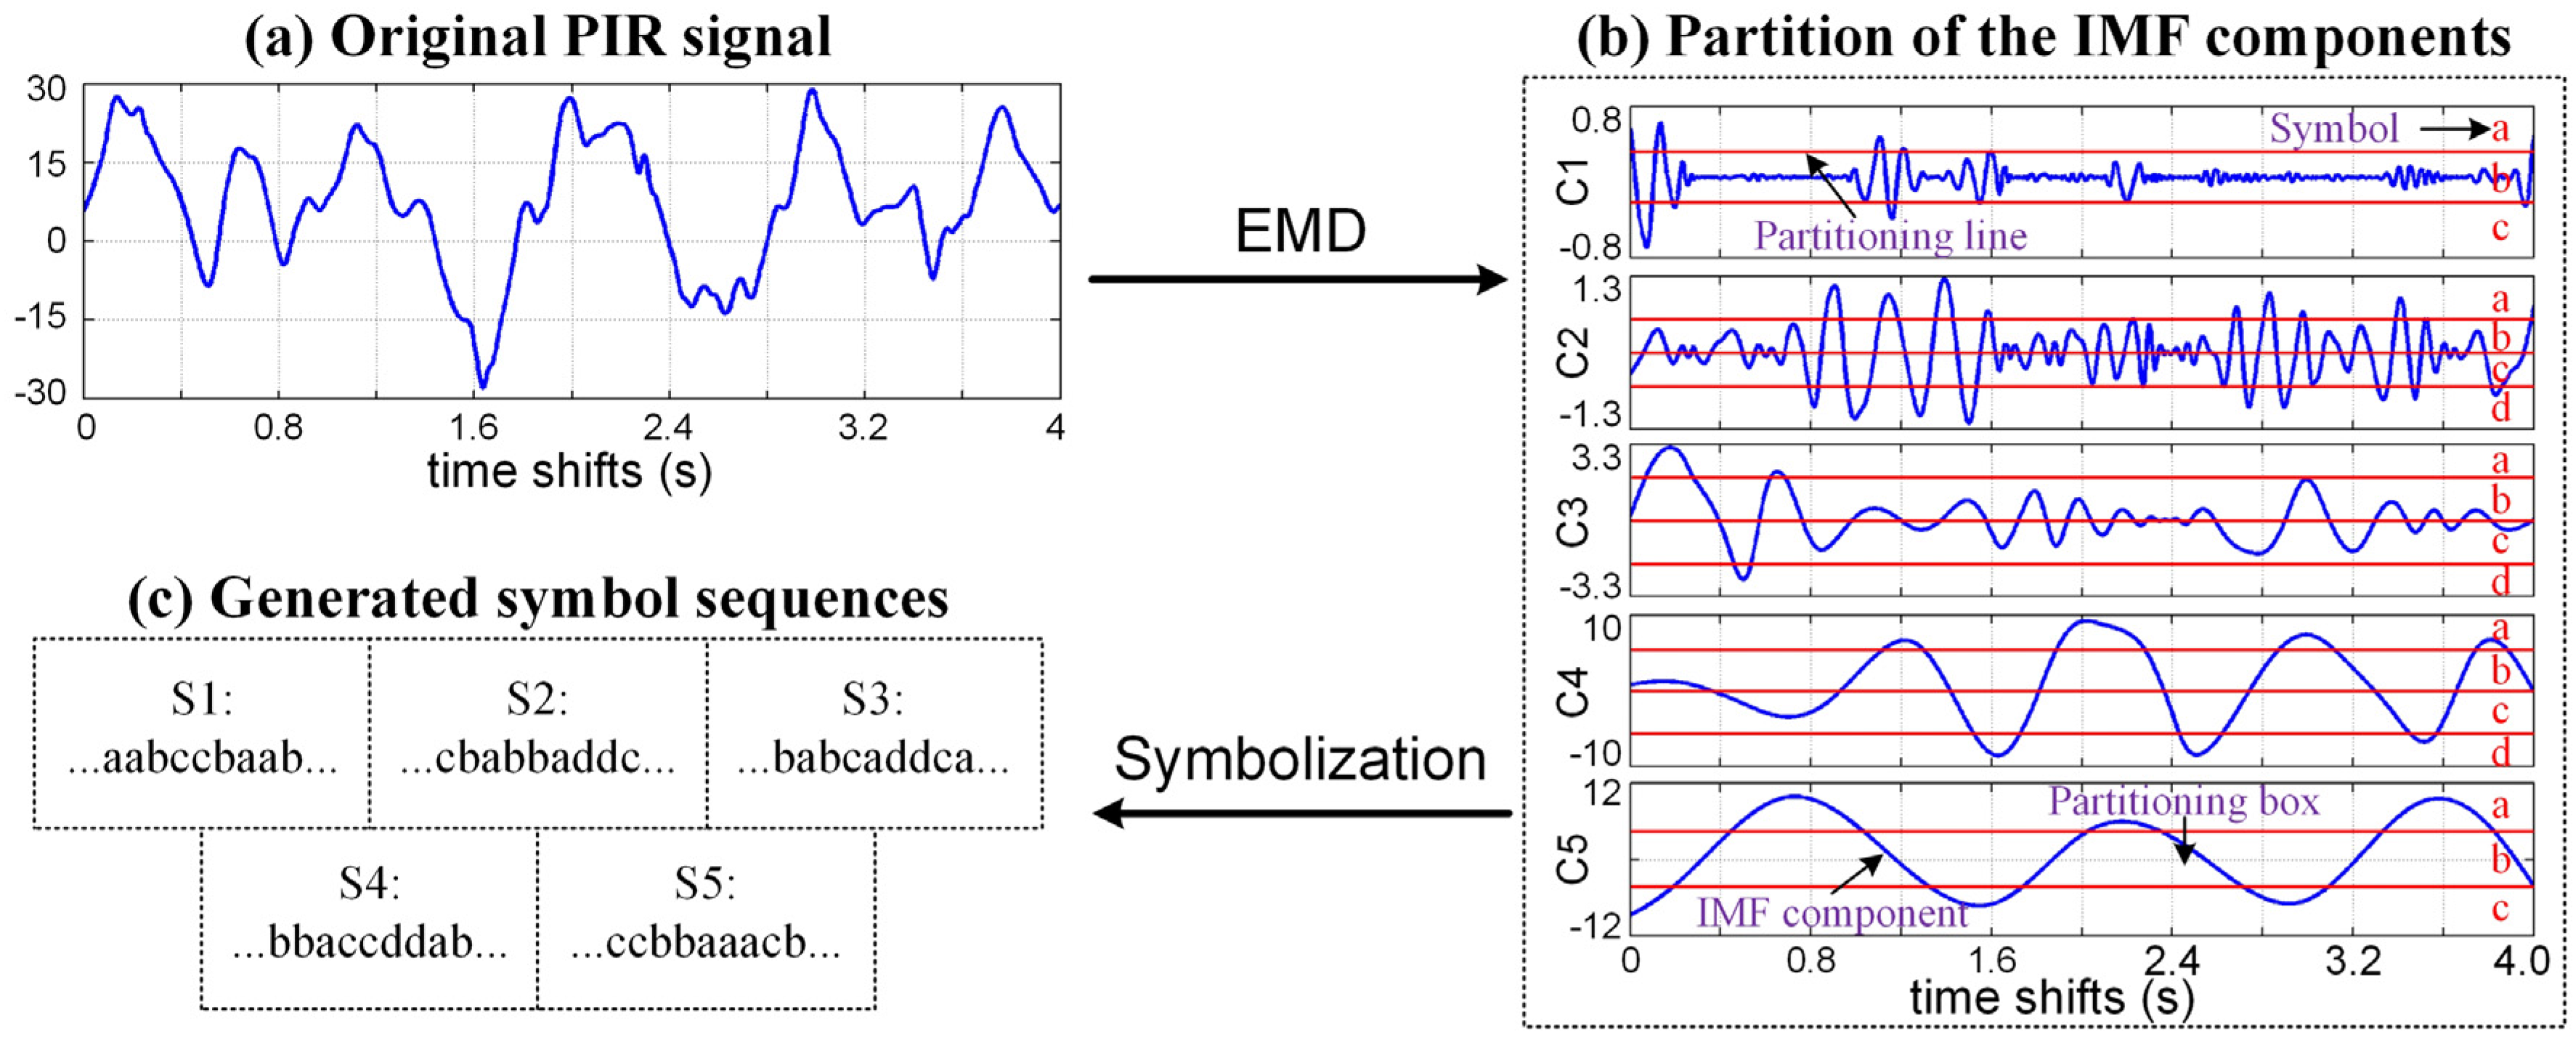
Using the mathematical model elaborated above, we can simulate the generation process of the human and nonhuman PIR signals (taking an adult and a dog for instance) for analyzing their inherent differences. As shown in Figure 2, because the detector’s FOV is divided into three detection layers by the Fresnel lenses array, according to the targets’ body shapes and the width of SZs and BZs [7], we first calculate the “layer-NEA curves” of each target, i.e., the changing curves of the surface area that exposes in each detective layer, rather than the entire FOV. We can see from Figure 2 that, even in the same detection layer, the adult’s and dog’s layer-NEA curves still have different patterns, this is because the adult and dog have different body widths. Through adding the three layer-NEA curves together, we can obtain the targets’ NEA curves in the entire FOV. We can see from Figure 2 that because the adult is much higher than the dog, he can intersect with more detection layers than a dog. Therefore, after adding the three layer-NEA curves together, the adult would generate a relatively complex NEA curve with many riding wives and small fluctuations, whereas the dog will generate a smoother one. Through substituting the NEA curves (i.e., A(t)) and another sensor’s parameters into Equations (1) and (2), we can obtain the simulated PIR signals.
Figure 2. Simulation of the adult’s (a) and the dog’s (b) PIR signals, where the squares with the symbol “+” in the front view of FOV indicate the PSZs and those with the symbol “−“ indicate the NSZs, the blank between PSZ and NSZ indicates the PSZs.
Sensors 16 00126 g002
From Figure 2, we can see that the simulated PIR signals have the same characteristics with the corresponding NEA curves, which means that the adult’s PIR signals would have more riding waves and small fluctuations, whereas the dog’s one is much smoother. The analytical result indicates that the discriminable features of the human and nonhuman targets (i.e., the body shape and height) are represented by the details of their PIR signals.
To verify the credibility of the analytical results, we collected 100 adults’ and dogs’ PIR signals under the same conditions as the simulation. As shown in Figure 3, we compared the collected PIR signals with the simulated results and calculate the average correlation coefficients between them. The average correlation coefficients between the simulated and collected PIR signals of the adults and dogs are 0.802 and 0.819, respectively, which proves the credibility of the analytical results.
Figure 3. Real (blue-solid) and simulated (red-dashed) PIR signals of adult (a) and dog (b).
Sensors 16 00126 g003

3. EMD-Based Symbolic Dynamic Analysis

According to the analytical result mentioned above, we know that the key issue for the recognition of the human and nonhuman PIR signals is to effectively extract their discriminable features from their signal details. To do this, we propose an EMD-based symbolic dynamic analysis method. As shown in Figure 4, the proposed method mainly consists of three steps:
(1)
Use an EMD-based symbolization method to generate five symbol sequences with the feature information of the original PIR signals.
(2)
Construct multiple probabilistic finite state automata (PFSA) with the generated symbol sequences for generating five feature descriptors for each PIR signal.
(3)
Use a weighted voting classification strategy to fuse the feature information contained in the feature descriptors and classify the original PIR signal.
Figure 4. Constitution of the EMD-based symbolic time series analysis.
Sensors 16 00126 g004

3.1. EMD-Based Symbolization

Empirical mode decomposition is a novel nonlinear and non-stationary signal processing method [14,15] that has been widely used in many applications, such as fault diagnosis [16] and biomedical signal analysis [17]. It is built on the assumption that each complex signal is composed of a number of simple oscillation modes. According to the time scales of these oscillation modes, EMD can separate them into a number of simple fluctuations named intrinsic mode functions (IMF). The relationship between a complex signal X(t) and its IMF components can be described by Equation (4):
X ( t ) = i = 1 N C i ( t ) + r N ( t )
where N is the number of total IMF components, Ci(t) and r N ( t ) indicate the ith IMF component and the residue respectively.
Taking the advantage of EMD, we can isolate the details of the PIR signal from the original signal and decompose them into specific IMF components because their time scales are relatively smaller than another components. Then, through analyzing these IMF components, we can specially extract the discriminable features of the human and nonhuman PIR signals carried by the signal details. Following this line of thought, we present an EMD-based symbolization method to extract the detailed features of the original PIR signal and generate five symbol sequences for further analysis.
The first step of the proposed method is using the EMD to decompose the original PIR signal into a number of IMF components. Because the details of the PIR signals usually have small time scales and the EMD always arranges the IMF components in an ascending order of their time scales [14], thus the details of the original PIR signal would be primarily extracted into the first few IMF components. For this reason, we can just use the first five IMF components for further feature extraction. Figure 5 shows the decomposition results of an adult’s PIR signals, we can see that the details of the PIR signal have been successively decomposed into different IMF components and arranged in an ascending order of their time scales.
Figure 5. IMF components of an adult's PIR signal, where Ci is the ith IMF component.
Sensors 16 00126 g005
To extract the feature information contained in the generated IMF components, as shown in Figure 6, the second step of the proposed symbolization method is partitioning the data space of the IMF components for generating five symbol sequences. In the partitioning procedure, first, the data space of the ith IMF component Ci is partitioned into a number of mutually exclusive and exhaustive regions using the maximum entropy partition method [18], which ensures that the information-rich regions of the IMF component can be partitioned finer and those with sparse information are partitioned coarser. Then each region is labeled by a unique symbol picked from an alphabet Σ i . The choice of the alphabet size | Σ i | depends on the specific data set and experiments [19], so the alphabets adopted by different IMF components may have different sizes. For example, in illustration shown in Figure 6b, the alphabet used for the partition of C1 is Σ 1 = { a , b , c } with the size of 3, whereas the alphabet used for partitioning C2 is Σ 2 = { a , b , c , d } with the size of 4. At last, each data point in Ci is assigned to a particular symbol according to the region where the data point falls, in this way, we can generate a symbol sequence Si from the ith IMF component. Through repeating this partitioning procedure on each generated IMF component, we can obtain five symbol sequences as shown in Figure 6c.
Figure 6. Illustration of the EMD-based symbolization method, where Ci indicates the ith IMF component and Si indicates the symbol sequence generated from Ci.
Sensors 16 00126 g006
It has been indicated in [20] that the essential robust features of the original signal can be extracted into a symbol sequence through an appropriate partition, but these features still cannot be directly used for the classification. Therefore, further analysis is still needed to generate appropriate feature descriptors for the original PIR signal.

3.2. Construction of Multiple PFSA

To extract the features contained in a symbolic sequence, Ray [20] constructed a probabilistic finite state automat from a symbol sequence with an assumption that the symbol sequence satisfies the Dth order Markov machine, and then he calculated the normalized left eigenvectors of the state transition matrix of the constructed PFSA and used them as the signal’s feature descriptor. The feature descriptor generated by Ray’s method can effectively represent the patterns represented by the symbol sequence [21], so we adopt Ray’s method for generating five feature descriptors from the multiple symbol sequences generated by the EMD-based symbolization method.
As shown in Figure 7, to construct a PFSA from the symbol sequence Si, we first put a sliding window with the length of D on the symbol sequence and treat the D symbols fallen in the window as a state of the PFSA. Through sliding the window along Si, we can convert Si to a state sequence (termed as Qi = qi,1, qi,2,…).
Figure 7. An example of constructing a PFSA from a symbol sequence, the left-hand of the figure indicates the generation of state sequence and the right hand indicates the constructed PFSA, in which the circle indicates the state of the PFSA and the arrow indicates the transition between the states.
Sensors 16 00126 g007
Then we use the generated state sequence to estimate the probability of the transition between two states according to Equation (5):
P ( ο i , k | ο i , l ) = P ( ο i , k ο i , l ) P ( ο i , l ) N ( ο i , l , ο i , k ) j = 1 | Ψ i | N ( ο i , l , ο i , j )
where ο i , l and ο i , k indicate two possible state values that may occur in Qi respectively, P(oi,k|oi,l) indicates the transition probability from oi,l to oi,k, N(oi,l, oi,k) indicates the count of the event that the state transits from oi,k to oi,l and Ψ i = { o i , 1 , o i , 2 , , o i , | Ψ i | } indicates the set of all possible state values, i.e., q i , j Ψ i . After calculated the transition probabilities between all states of the constructed PFSA, we can obtain the state transition probability matrix Π i defined by Equation (6):
Π i = [ p ( ο i , 1 | ο i , 1 ) p ( ο i , 1 | ο i , | Ψ i | ) p ( ο i , | Ψ i | | ο i , 1 ) p ( ο i , | Ψ i | | ο i , | Ψ i | ) ]
After obtained the transition probability matrix, we calculate its left eigenvectors and generate one feature descriptor of the original PIR signals according to Equation (7):
f i = j = 1 | Ψ i | ν j
where fi indicates the feature descriptor generated from the ith symbol sequence and vj indicates the jth normalized eigenvector of Π i . Through repeating this feature descriptor generation procedure on the five symbol sequences respectively, we can generate five feature descriptors for each PIR signal.
Because the IMF components are numerically orthogonal to each other [14] and the symbolization procedures of these IMF component are mutually independent (Section 3.1), the symbol sequences generated by the EMD-based symbolization method are mutually uncorrelated, and so do the feature descriptors.

3.3. Weighted Voting Classification Strategy

After generated five feature descriptors for the original PIR signal, next we need to fuse the feature information contained in the feature descriptors for classifying the original PIR signal. Therefore, inspired by the boosting algorithm [22], we propose a weighted voting classification strategy with five classifiers.
Figure 8. Construction of the weighted voting classification strategy, where Ci indicates the ith classifier.
Sensors 16 00126 g008
The proposed classification strategy is shown in Figure 8. First, we separately classify the generated feature descriptors with five classifiers and obtain five reference classes of the original PIR signal. Then, according to the generated reference classes, the five classifiers vote for the final class of the original PIR signal through a weighted voting mechanism.
Specifically, we assign higher voting weights to the classifiers with low classification errors, whereas the classifiers with high classification errors can only obtain a lower voting weights. In this way, a more accurate classifier can play a greater role in determining the final class of the original PIR signal. Algorithm 1 gives the voting weights determination procedure of the proposed classification strategy.
Algorithm 1. Voting weights determination procedure:
   Input: A dataset of PIR signals T = {x1,y1),(x2,y2),…,(xN,yN)} with size of N, where xiRn is the ith PIR signal and yi∈{–1,1} is the class of xi, −1 indicates “nonhuman” and 1 indicates “human”;
   Output: A linear combination of five classifiers.
   Step 1. Implement the proposed feature extraction method on dataset T to generate five feature sets: F1, F2,…,F5, where Fj={f1,j, f2,j,…,fN,j} and fi,j is the jth feature descriptor of the ith PIR signal in the dataset;
   Step 2. From j = 1 to 5 do:
(a)
Train the jth classifier and calculate its classification error ej defined by Equation (8) with the feature set Fj using the five-fold cross validation procedure recommended by [23], where Cj indicates the discriminant function of the jth classifier and I is the indicator function:
e j = 1 N i = 1 N I ( C j ( f i , j ) y i )
(b)
Calculate the voting weight of the jth classifier using Equation (9)
w j = 1 2 log ( ( 1 e j ) / e j )
   Step 3. Construct a liner combination with C1, C2, …, C5, and the final class of a PIR signal x can be determined according to Equation (10), where FC is the final class of x, fj is the jth feature descriptor of x, and sign indicates the signum function:
F C = s i g n ( j = 1 5 w j C j ( f j ) )

4. Experiments and Discussion

To verify the effectiveness of the proposed method, we establish two databases of human and nonhuman PIR signals. The contents of these two databases are shown in Table 1. Note that the PIR signals in Database 1 are collected from adults, dogs, and the warm wind generated by an air condition in different indoor environments, whereas those in Dataset 2 are collected from adults, dogs, and geese in different outdoor environments. All PIR signals are collected with a commercial PIR detector and a data acquisition card using a sampling frequency of 1000 Hz and a duration of 2 s. With these two databases, we perform multiple experiments to compare the performance of the proposed method, WPE [6], AR [7] and SDF-based [24] (without the wavelet preprocessing) feature extraction methods.
Table 1. Construction of human and nonhuman PIR signal database.
Database 1Database 2
AdultsDogsWarm windAdultsDogsGeese
200200200200200200

4.1. Experiments on Database 1

The experiments implemented on Database 1 are used to verify the effectiveness of the proposed method for indoor intrusion detection. The reason why we choose the dog and warm wind as the nonhuman targets is that the false alarms of the PIR detector in the indoor environment are mainly caused by pets and heating apparatus.
Generally, it may be more reasonable to use a one-class classifier to implement the human and nonhuman recognition, but there is only a small range of disturbance sources of the PIR detector in the indoor environment, therefore, besides the one-class classifiers, we can also adopt the support vector machine (SVM) as the classifier of the proposed classification strategy for obtaining a higher classification accuracy. Because SVM is a binary classifier, as shown in Figure 9, we adopt a two-layer recognition procedure to deal with the three-class (i.e., adult, dog and warm wind) classification problem. Each layer contains a feature extraction and classification procedure elaborated in Section 3. Because the characteristics of the warm wind’s PIR signals are quite different from the ones of adults and dogs, we use the first recognition layer to determine whether the input PIR signal is collected from warm wind, if not, we will use the second recognition layer to determine the specific class of the original PIR signal (i.e., adult or dog).
Figure 9. Two-layer recognition procedure for indoor intrusion detection.
Sensors 16 00126 g009

4.1.1. Voting Weights Determination

As described in Section 3.3, in the proposed classification strategy, the voting weights of the classifiers are directly calculated according to the voting weights determination procedure described in Section 3.3 rather than the wildly used grid searching algorithm. Therefore, to determine the voting weights of the classifiers, we first equally divide Database 1 into two datasets and term them as Subset 1 and Subset 2 respectively, then we use Subset 1 to execute the voting weights determination procedure and use Subset 2 to perform the comparative experiments.
To determine the voting weights of the classifiers in the first recognition layer, we categorize the adults’ and the dogs’ PIR signals in Subset 1 to a same class and label them as the positive samples, whereas the warm wind’s PIR signals are marked as the negative samples, and then we perform the Algorithm 1 described in Section 3.3 with all PIR signals in Subset 1. While in the voting weights determination procedure for the second recognition layer, we discard the warm wind’s PIR signals and just use the adult’s and dog’s PIR signals to perform the Algorithm 1. The classification errors of the classifiers in each recognition layer are summarized in Table 2, where SVMj indicates jth SVM of the weighted voting classification strategy and RLm indicates the mth recognition layer. According to the classification errors, we calculate the voting weights of the classifiers according to Equation (9), the voting weights are summarized in Table 3 and their sum has been normalized to one.
Table 2. Classification errors of the classifiers in each recognition layer for the recognition of adults, dogs and warm wind in the indoor environment.
ClassifierSVM1SVM2SVM3SVM4SVM5
RL11.50%1.50%6.50%12.00%7.00%
RL24.00%2.50%10.00%17.50%13.50%
Table 3. Voting weights of the classifiers in each recognition layer for the recognition of adults, dogs and warm wind in the indoor environment.
ClassifierSVM1SVM2SVM3SVM4SVM5
RL10.270.270.170.130.16
RL20.260.290.180.120.15

4.1.2. Experimental Results and Discussion

After determined the voting weights, we use the leave-one-out cross validation procedure recommended by [23] to optimize another parameters (i.e., the size of the alphabets) of the proposed method and testify its effectiveness with Subset 2. Besides the proposed method, we also implement the WPE, AR and SDF-based feature extraction method on Subset 2 for comparison. The parameter tuning and performance evaluation of these methods are also using the above-mentioned leave-one-out procedure. The experimental results are listed in Table 4 using the confusion matrix, where the rows are the actual classes and the columns are the predicted classes. The “Recall”, “Precision” and the “Recognition accuracy” of each method are summarized in Table 5.
We can see from Table 5 that, for the recognition of the warm wind, the proposed method only shows a slightly better performance than another three methods, but for the recognition of the adults and dogs, the proposed method shows a remarkably better performance that only two human targets are missed and no false alarm emerges.
Table 4. Recognition results of each method in the experiments executed on Database 1.
MethodsClassWarm WindDogHuman
Warm wind9730
WPEDog5932
Human2791
Warm wind9910
ARDog0982
Human0496
Warm wind9370
SDFDog4879
Human01585
Our methodWarm wind10000
Dog01000
Human0298
Table 5. Recall, precision and the overall recognition accuracy of each method in the comparative experiments on Database 1.
Recognition MethodWarm WindDogsAdultsRecognition Accuracy
RecallPrecisionRecallPrecisionRecallPrecision
WPE97.00%93.27%93.00%90.29%91.00%97.85%93.67%
AR99.00%100%98.00%95.15%96.00%97.96%97.67%
SDF93.00%95.88%87.00%79.82%85.00%90.43%88.33%
Our method100.00%100.00%100.00%98.04%98.00%100.00%99.33%
EMD is a self-adaptive signal decomposition method, so unlike the wavelet decomposition, it has no need of any base functions [14], so the proposed method can avoid the performance degradation caused by a bad choice of wavelet bases. EMD is also a suitable tool for non-stationary signal processing, therefore, the proposed method can provide a more reliable recognition result than AR-based feature extraction because sometimes the PIR signals are non-stationary. As for SDF, it has the advantage of low computational complexity and memory requirement [9], but because of the coarse graining of the original PIR signal, it may loss the feature information contained in the signal details, which are closely related to the body shape features of the human and nonhuman targets. The proposed method can be viewed as an improvement of SDF, because EMD makes it possible to specially analysis the detailed components of the original PIR signal, the proposed method can effectively extract the discriminable features of human and nonhuman PIR signals. However, we cannot claim that our method is better than another three methods for any applications, because the introduction of EMD also cause an increment of computational complexity and memory requirement. There should be a comprehensive consideration between the requirement of recognition accuracy and the computing speed.

4.2. Experiment on Database 2

The experiments implemented on Database 2 are to verify the effectiveness of the proposed method for outdoor pedestrian detection. In our application, the most likely occurred nonhuman targets are dogs and geese, or another wild animals with similar body sizes and shapes, that’s the reason why we choose doge and geese as the nonhuman subjects in our experiments.
Because dog’s and geese’s PIR signals are quite similar with each other, but they are relatively distinctive from human PIR ones, we can combine the dog’s and geese’s PIR signals together as an outlier class and classify them from the human PIR signals using a one-layer recognition procedure shown in Figure 10.
Figure 10. Recognition procedure of the outdoor pedestrian detection.
Sensors 16 00126 g010

4.2.1. Voting Weights Determination

Similar to the experiments on Database 1, to determinate the voting weights of the classifiers in the weighted voting classification strategy, we equally divide the Database 2 into two subsets and term them as Subset 3 and Subset 4, respectively. Subset 3 will be used to perform the voting weights determination procedure elaborated in Section 3.3, and Subset 4 will be used to verify the effectiveness of the proposed method.
To perform the voting weights determination procedure, we combine the dog and goose’s PIR signals in Subset 3 together and label them as the negative samples. Then we execute the Algorithm 1 with all PIR signals in Subset 3. The classification errors of the classifiers are summarized in Table 6, where SVMj indicates jth SVM of the weighted voting classification strategy and RLm indicates the mth recognition layer. According to these classification errors, we calculate the voting weights of the classifiers using Equation (9), the normalized voting weights are listed in Table 7.
Table 6. Classification errors of the classifiers for the recognition of adults, dogs and geese in the outdoor environment.
ClassifierSVM1SVM2SVM3SVM4SVM5
Error2.00%3.00%10.50%17.50%17.50%
Table 7. Voting weights of the classifiers for the recognition of adults, dogs and geese in the outdoor environment.
ClassifierSVM1SVM2SVM3SVM4SVM5
Weight0.310.280.170.120.12

4.2.2. Experimental Results and Discussion

After determined the voting weights, to verify the effectiveness of the proposed method for outdoor pedestrian detection, we implement the proposed method on Subset 4 and compare its performance with the WPE, AR-based and SDF-based feature extraction method, the parameter selection and performance evaluation of these methods are identical with that in Section 4.1. The classification results are summarized in Table 8. The recall, precision and the overall recognition accuracy of each method are listed in Table 9.
Table 8. Recognition results of each method in the experiments executed on Database 2.
MethodsClassHumanNonhuman
WPEHuman9010
Nonhuman6194
ARHuman955
Nonhuman4196
SDFHuman8416
Nonhuman8192
Our methodHuman973
Nonhuman0200
Table 9. Recall, precision and the overall recognition accuracy of each method in the comparative experiments on Database 2.
Recognition MethodHumanNonhumanRecognition Accuracy
RecallPrecisionRecallPrecision
WPE90.00%93.75%97.00%95.10%94.67%
AR95.00%95.96%98.00%97.51%97.00%
SDF84.00%91.30%96.00%92.31%92.00%
Our method97.00%100.00%100.00%98.52%99.00%
We can see from Table 8 and Table 9 that the proposed method obtains the highest recognition accuracy that only three human targets are missed and no false alarm emerges.
Although the most common nonhuman subjects in our applications are dogs and geese, or another wild animals with similar body shapes, there may be more disturbance sources in other applications. Therefore, we recommend that readers use a flexible strategy to deal with the multiclass classification problem, for example, combining all nonhuman targets together and classifying them from the human ones, or just adding more layers into the recognition procedure elaborated in Section 4.1. Besides, the one-class classifiers, such as support vector data description (SVDD) [25], are also recommended.

5. Conclusions

For reducing PIR detector false alarms, after analyzing the inherent differences between human and nonhuman PIR signals using a mathematical model of a PIR detector, we propose an EMD-based symbolization method for generating five symbol sequences with the detailed feature information of the original PIR signals. Then, we construct the multiple PFSA based on the generated symbol sequences for extracting five feature descriptors of the original PIR signal. Third, we used a weighted voting classification strategy to fuse the features represented by the feature descriptors and then classify the original PIR signals. To verify the effectiveness of the proposed method, we executed comparative experiments on two databases with the proposed method, WPE, SDF and AR-based feature extraction methods. The experimental results show that the proposed method can effectively reduce the false alarms of a PIR detector.

Acknowledgments

This work was supported by Projects of the National Science and Technology Program (2013GS500303), Key Science and Technology Projects of CSTC STC2012GG-YYJSB40001, CSTC2013-JCS F40009) and the National Natural Science Foundation of China (61105093). The authors express deep appreciation to A. Ray and S. Bahrampour for providing the SDF code, and thank P. Flandrin for providing the EMD toolbox. The authors are also grateful to L. Yu and G. Zhao for their sincere assistance in the experimental data collection. Finally, we want to thank the editors and reviewers for their constructive and valuable suggestions.

Author Contributions

The work presented in this paper is a collaborative development by four authors. Jiaduo Zhao designed the methods and experiments, developed the data collection modules and perform the comparative experiments. Weiguo Gong defined the research theme and guided the data analysis. Yuzhen Tang and Weihong Li perform the data collection and data analysis. Jiaduo Zhao wrote this paper, Weiguo Gong reviewed and revised the paper.

Conflicts of Interest

The authors declare no conflict of interest.

References

  1. Yun, J.; Lee, S.-S. Human movement detection and identification using pyroelectric infrared sensors. Sensors 2014, 14, 8057–8081. [Google Scholar] [CrossRef] [PubMed]
  2. Hong, S.G.; Kim, N.S.; Kim, W.W. Reduction of false alarm signals for pir sensor in realistic outdoor surveillance. ETRI J. 2013, 35, 80–88. [Google Scholar] [CrossRef]
  3. Yoo, J.; Kim, H.J. Target tracking and classification from labeled and unlabeled data in wireless sensor networks. Sensors 2014, 14, 23871–23884. [Google Scholar] [CrossRef] [PubMed]
  4. Erden, F.; Toreyin, B.U.; Soyer, E.B.; Inac, I.; Gunay, O.; Kose, K.; Cetin, A.E. Wavelet based flickering flame detector using differential pir sensors. Fire Saf. J. 2012, 53, 13–18. [Google Scholar] [CrossRef] [Green Version]
  5. Fang, J.-S.; Hao, Q.; Brady, D.J.; Guenther, B.D.; Hsu, K.Y. Real-time human identification using a pyroelectric infrared detector array and hidden markov models. Opt. Express 2006, 14, 6643–6658. [Google Scholar] [CrossRef] [PubMed]
  6. Wang, L. Human infrared signal recognition using single PIR detector. In Proceedings of the 4th International Congress on Image and Signal Processing (CISP), Shangai, China, 15–17 October 2011.
  7. Gong, W.; Wen, K.; He, L.; Cheng, L.; Li, Y. Human and nonhuman recognition using pyroelectric infrared detector. Int. J. Thermophys. 2012, 33, 2237–2241. [Google Scholar] [CrossRef]
  8. Jin, X.; Sarkar, S.; Ray, A.; Gupta, S.; Damarla, T. Target detection and classification using seismic and PIR sensors. IEEE Sens. J. 2012, 12, 1709–1718. [Google Scholar] [CrossRef]
  9. Rao, C.; Ray, A.; Sarkar, S.; Yasar, M. Review and comparative evaluation of symbolic dynamic filtering for detection of anomaly patterns. Signal Image Video Process. 2009, 3, 101–114. [Google Scholar] [CrossRef]
  10. Daw, C.S.; Finney, C.E.A.; Tracy, E.R. A review of symbolic analysis of experimental data. Rev. Sci. Instrum. 2003, 74, 915–930. [Google Scholar] [CrossRef]
  11. Rafique, F.; Siddiqui, N. Passive ir field gradient detection of thermal objects in active fresnel zones. Infrared Phys. Technol. 2013, 60, 145–154. [Google Scholar] [CrossRef]
  12. Hossain, A.; Rashid, M.H. Pyroelectric detectors and their applications. IEEE Trans. Ind. Appl. 1991, 27, 824–829. [Google Scholar] [CrossRef]
  13. Liu, T.; Liu, J. Design and implementation of a compressive infrared sampling for motion acquisition. EURASIP J. Adv. Signal Process. 2014, 2014, 1–15. [Google Scholar] [CrossRef]
  14. Huang, N.E.; Shen, Z.; Long, S.R.; Wu, M.C. The empirical mode decomposition and the hilbert spectrum for nonlinear and non-stationary time series analysis. Proc. R. Soc. Lond. A: Math. Phys. Eng. Sci. 1998, 454, 903–995. [Google Scholar] [CrossRef]
  15. Huang, N.E.; Shen, Z.; Long, S.R. A new view of nonlinear water waves: The hilbert spectrum 1. Annu. Rev. Fluid Mech. 1999, 31, 417–457. [Google Scholar] [CrossRef]
  16. Lei, Y.; Lin, J.; He, Z.; Zuo, M.J. A review on empirical mode decomposition in fault diagnosis of rotating machinery. Mech. Syst. Signal Process. 2013, 35, 108–126. [Google Scholar] [CrossRef]
  17. Sweeney-Reed, C.M.; Nasuto, S.J. A novel approach to the detection of synchronisation in EEG based on empirical mode decomposition. J. Comput. Neurosci. 2007, 23, 79–111. [Google Scholar] [CrossRef] [PubMed]
  18. Rajagopalan, V.; Ray, A. Symbolic time series analysis via wavelet-based partitioning. Signal Process. 2006, 86, 3309–3320. [Google Scholar] [CrossRef]
  19. Jin, X.; Gupta, S.; Mukherjee, K.; Ray, A. Wavelet-based feature extraction using probabilistic finite state automata for pattern classification. Pattern Recognit. 2011, 44, 1343–1356. [Google Scholar] [CrossRef]
  20. Ray, A. Symbolic dynamic analysis of complex systems for anomaly detection. Signal Process. 2004, 84, 1115–1130. [Google Scholar] [CrossRef]
  21. Gupta, S.; Ray, A. Symbolic Dynamic Filtering for Data-Driven Pattern Recognition. Available online: http://linkslab.uconn.edu/wp-content/uploads/sites/246/2014/05/Gupta_Nova_08.pdf (accessed on 18 January 2016).
  22. Wu, X.; Kumar, V.; Ross Quinlan, J.; Ghosh, J. Top 10 algorithms in data mining. Knowl. Inf. Syst. 2008, 14, 1–37. [Google Scholar] [CrossRef]
  23. Salzberg, S.L. On comparing classifiers: Pitfalls to avoid and a recommended approach. Data Min. Knowl. Discov. 1997, 1, 317–328. [Google Scholar] [CrossRef]
  24. Bahrampour, S.; Ray, A.; Sarkar, S.; Damarla, T.; Nasrabadi, N.M. Performance comparison of feature extraction algorithms for target detection and classification. Pattern Recognit. Lett. 2013, 34, 2126–2134. [Google Scholar] [CrossRef]
  25. Tax, D.M.; Duin, R.P. Support vector data description. Mach. Learn. 2004, 54, 45–66. [Google Scholar] [CrossRef]

