1. Introduction
The Internet of Thing (IoT) is the interaction of ubiquitous everyday sensors and devices to link physical and virtual objects through seamless networks. To construct a novel paradigm “anytime, anywhere, any service for anyone”, the IoT involves various heterogeneous techniques. The opportunities offered by the IoT make it possible to provide various applications based on it. Among them, the smart home is a sophisticated research field in smart automation systems of which the overall motive is the enhancement of users’ comfort and the guarantee of their safety and security conditions with minimal operation costs. Since a smart home is an automated environment, it has the capability to monitor, detect and record daily activity patterns by using different types of sensors and communication technologies.
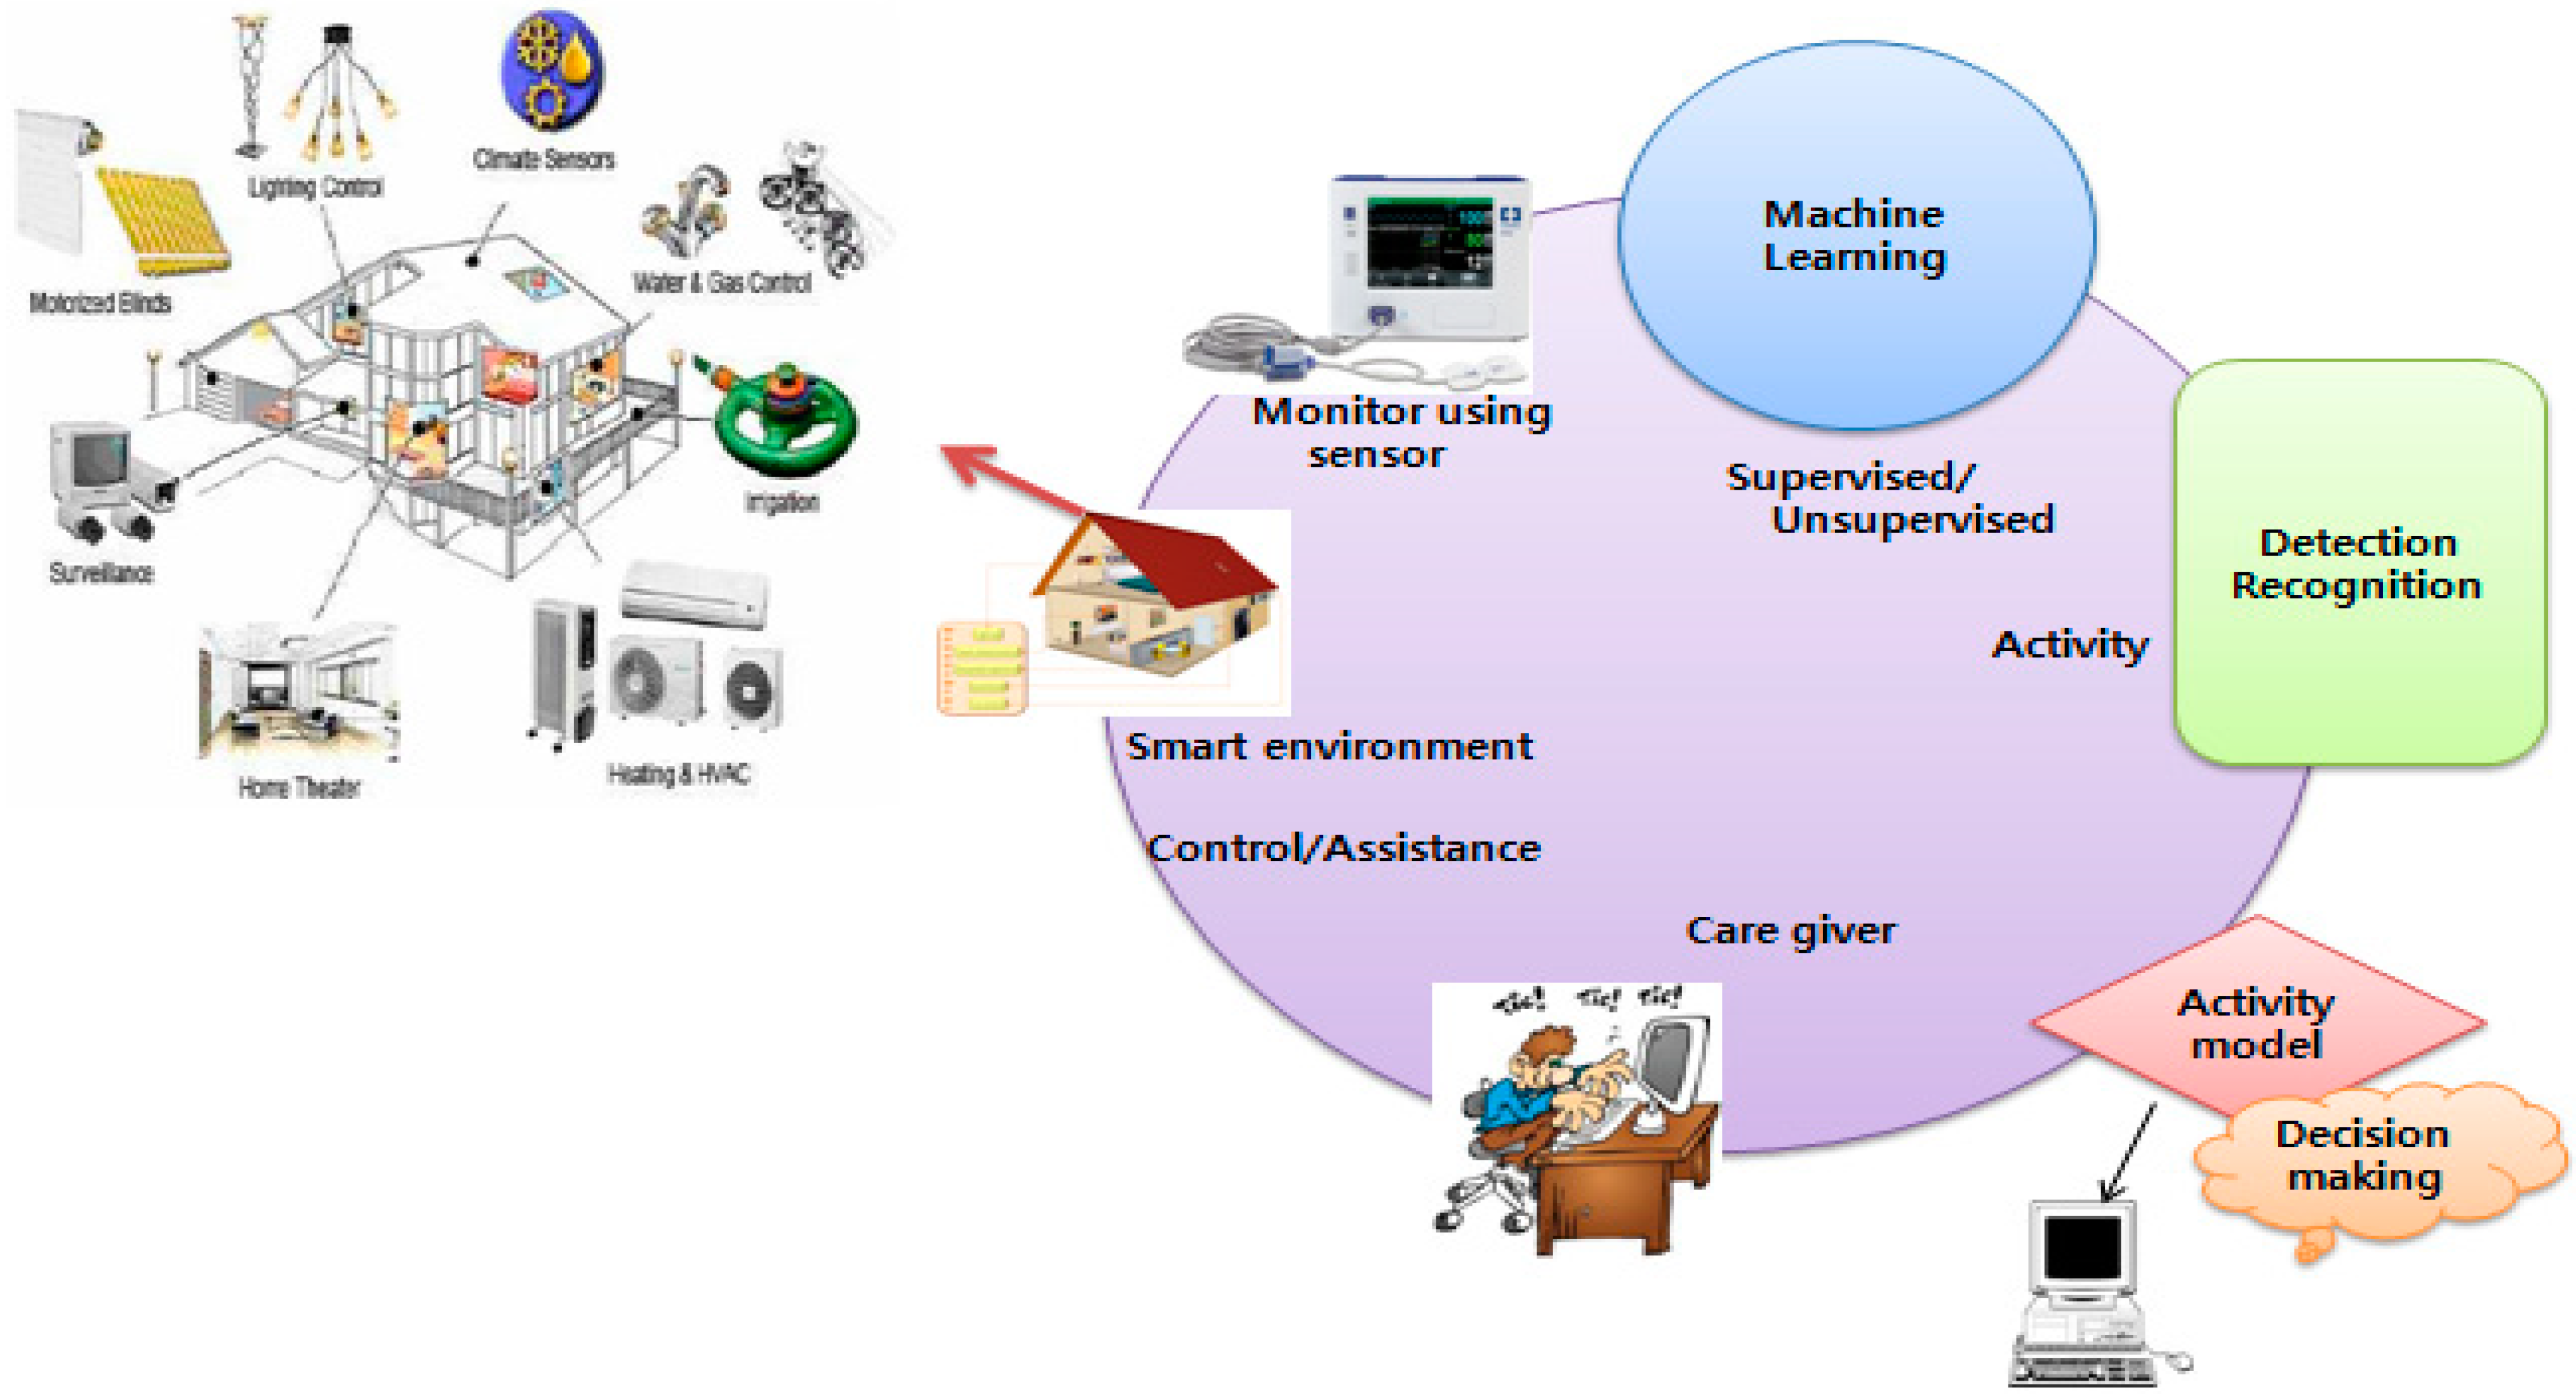
Users’ daily activity generate patterns that play an important role in the smart home environment. These patterns are used to favor the recognition of user activity that is useful to improve the smart home applications in terms of efficiency and management energy, healthcare and security as shown in
Figure 1. Indeed, the user activities inside the smart home environment have to be monitored and recorded in order to facilitate their control from the remote. Thus, user activity recognition gives the location and time of an activity. According to
Figure 1, the abnormal activities in the user behavior can be revealed by constructing the normal behavioral patterns. So,
Figure 1 describes the user monitoring in the smart home environment by using object sensors whose collected information is given to the machine learning algorithm as input. In addition, this information is processed by the system to detect anomalies in the user behavior. Therefore, the user can be assisted remotely after receiving an alert message if any unwanted behavior is revealed. Thus, one of the key points of this monitoring system is the ability to provide a response by recognizing the normal user behavior. Furthermore, the following
Figure 1 describes the user monitoring in the smart home environment.
Figure 1.
User activity recognition in smart home [
1].
Figure 1.
User activity recognition in smart home [
1].
The aim of this work is to discuss the possibilities of recognizing and predicting user activities in the smart home environment. If we can develop an accurate activity recognition method, it can be implemented into the smart home control system. Based on the activity recognized by this method, the smart home can provide the appropriate service to the user automatically.
However, the activity recognition is challenging in the real world due to the variability and the complexity of user activities that affect the accuracy of recognition processes. Many researches, which will be introduced in the next chapter, have suggested the ways for the activity recognition, but the accuracy did not reach expectations. The reason is that they focused on only a subpart and not the entire work. Overall, the activity recognition process is made up of two parts. First, the repeated patterns must be discovered and classified from a lot of activities. Second, what action the pattern means should be decided upon. Most previous works dealt with only one of these two points. It is hard to obtain optimal performance if any issue is not investigated from the overall viewpoint.
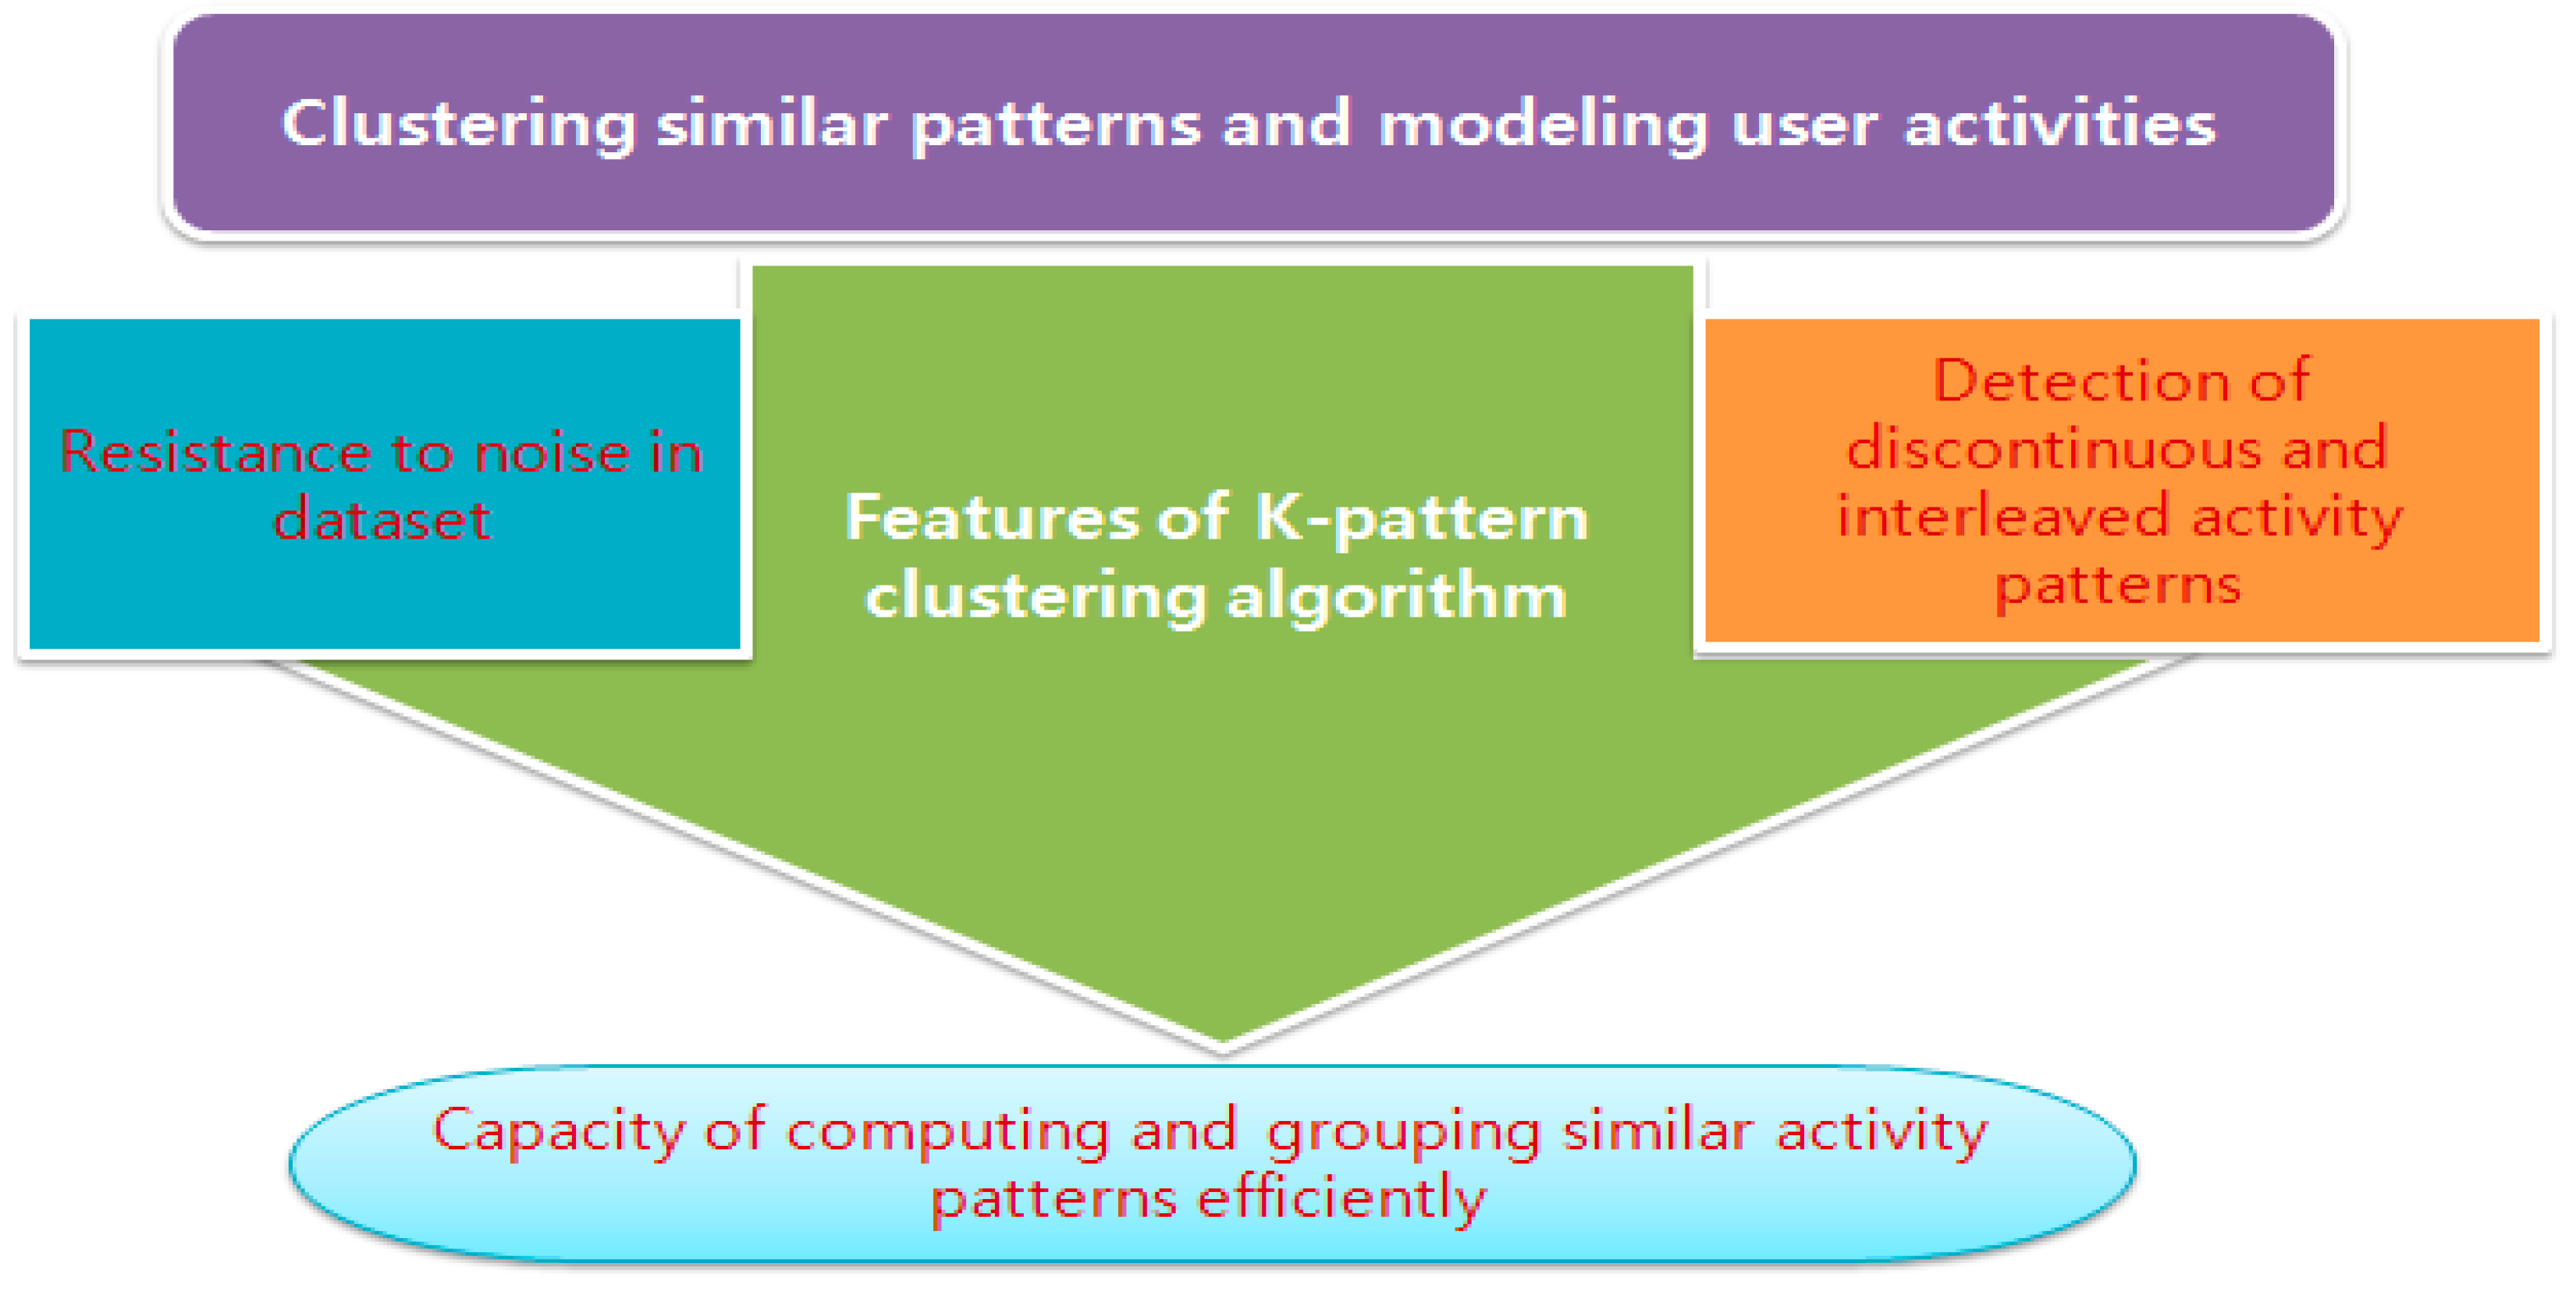
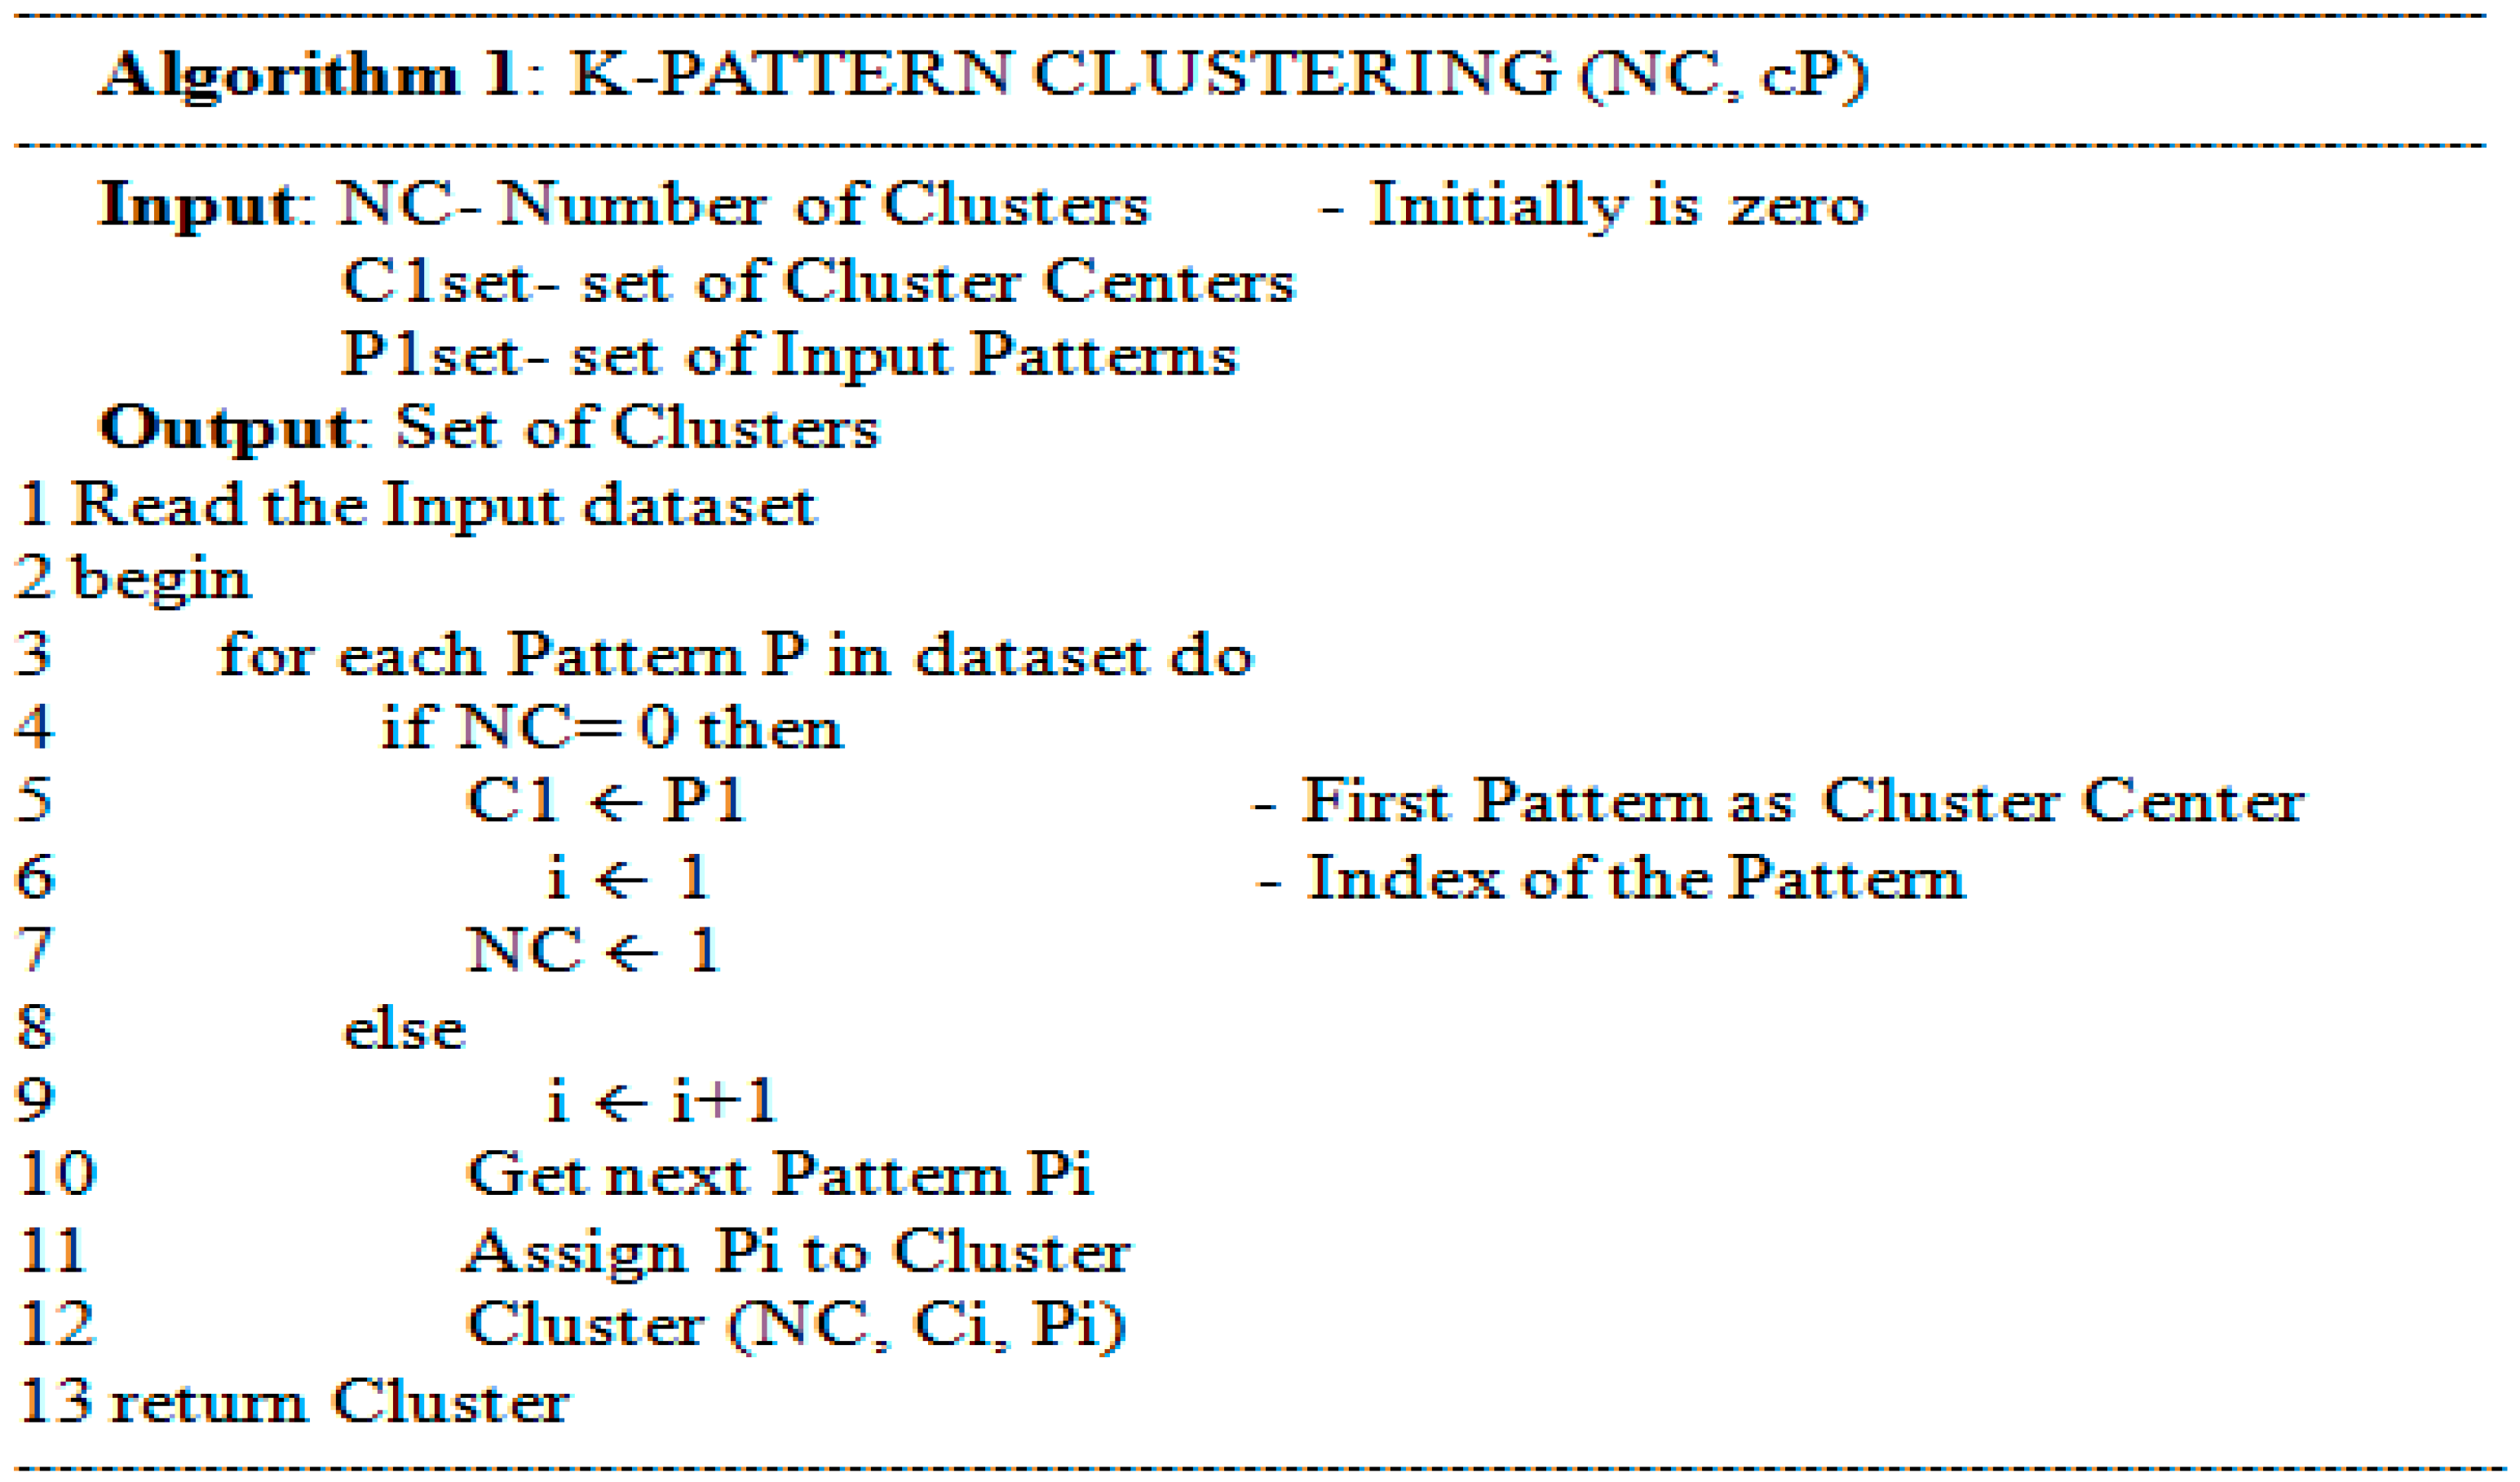
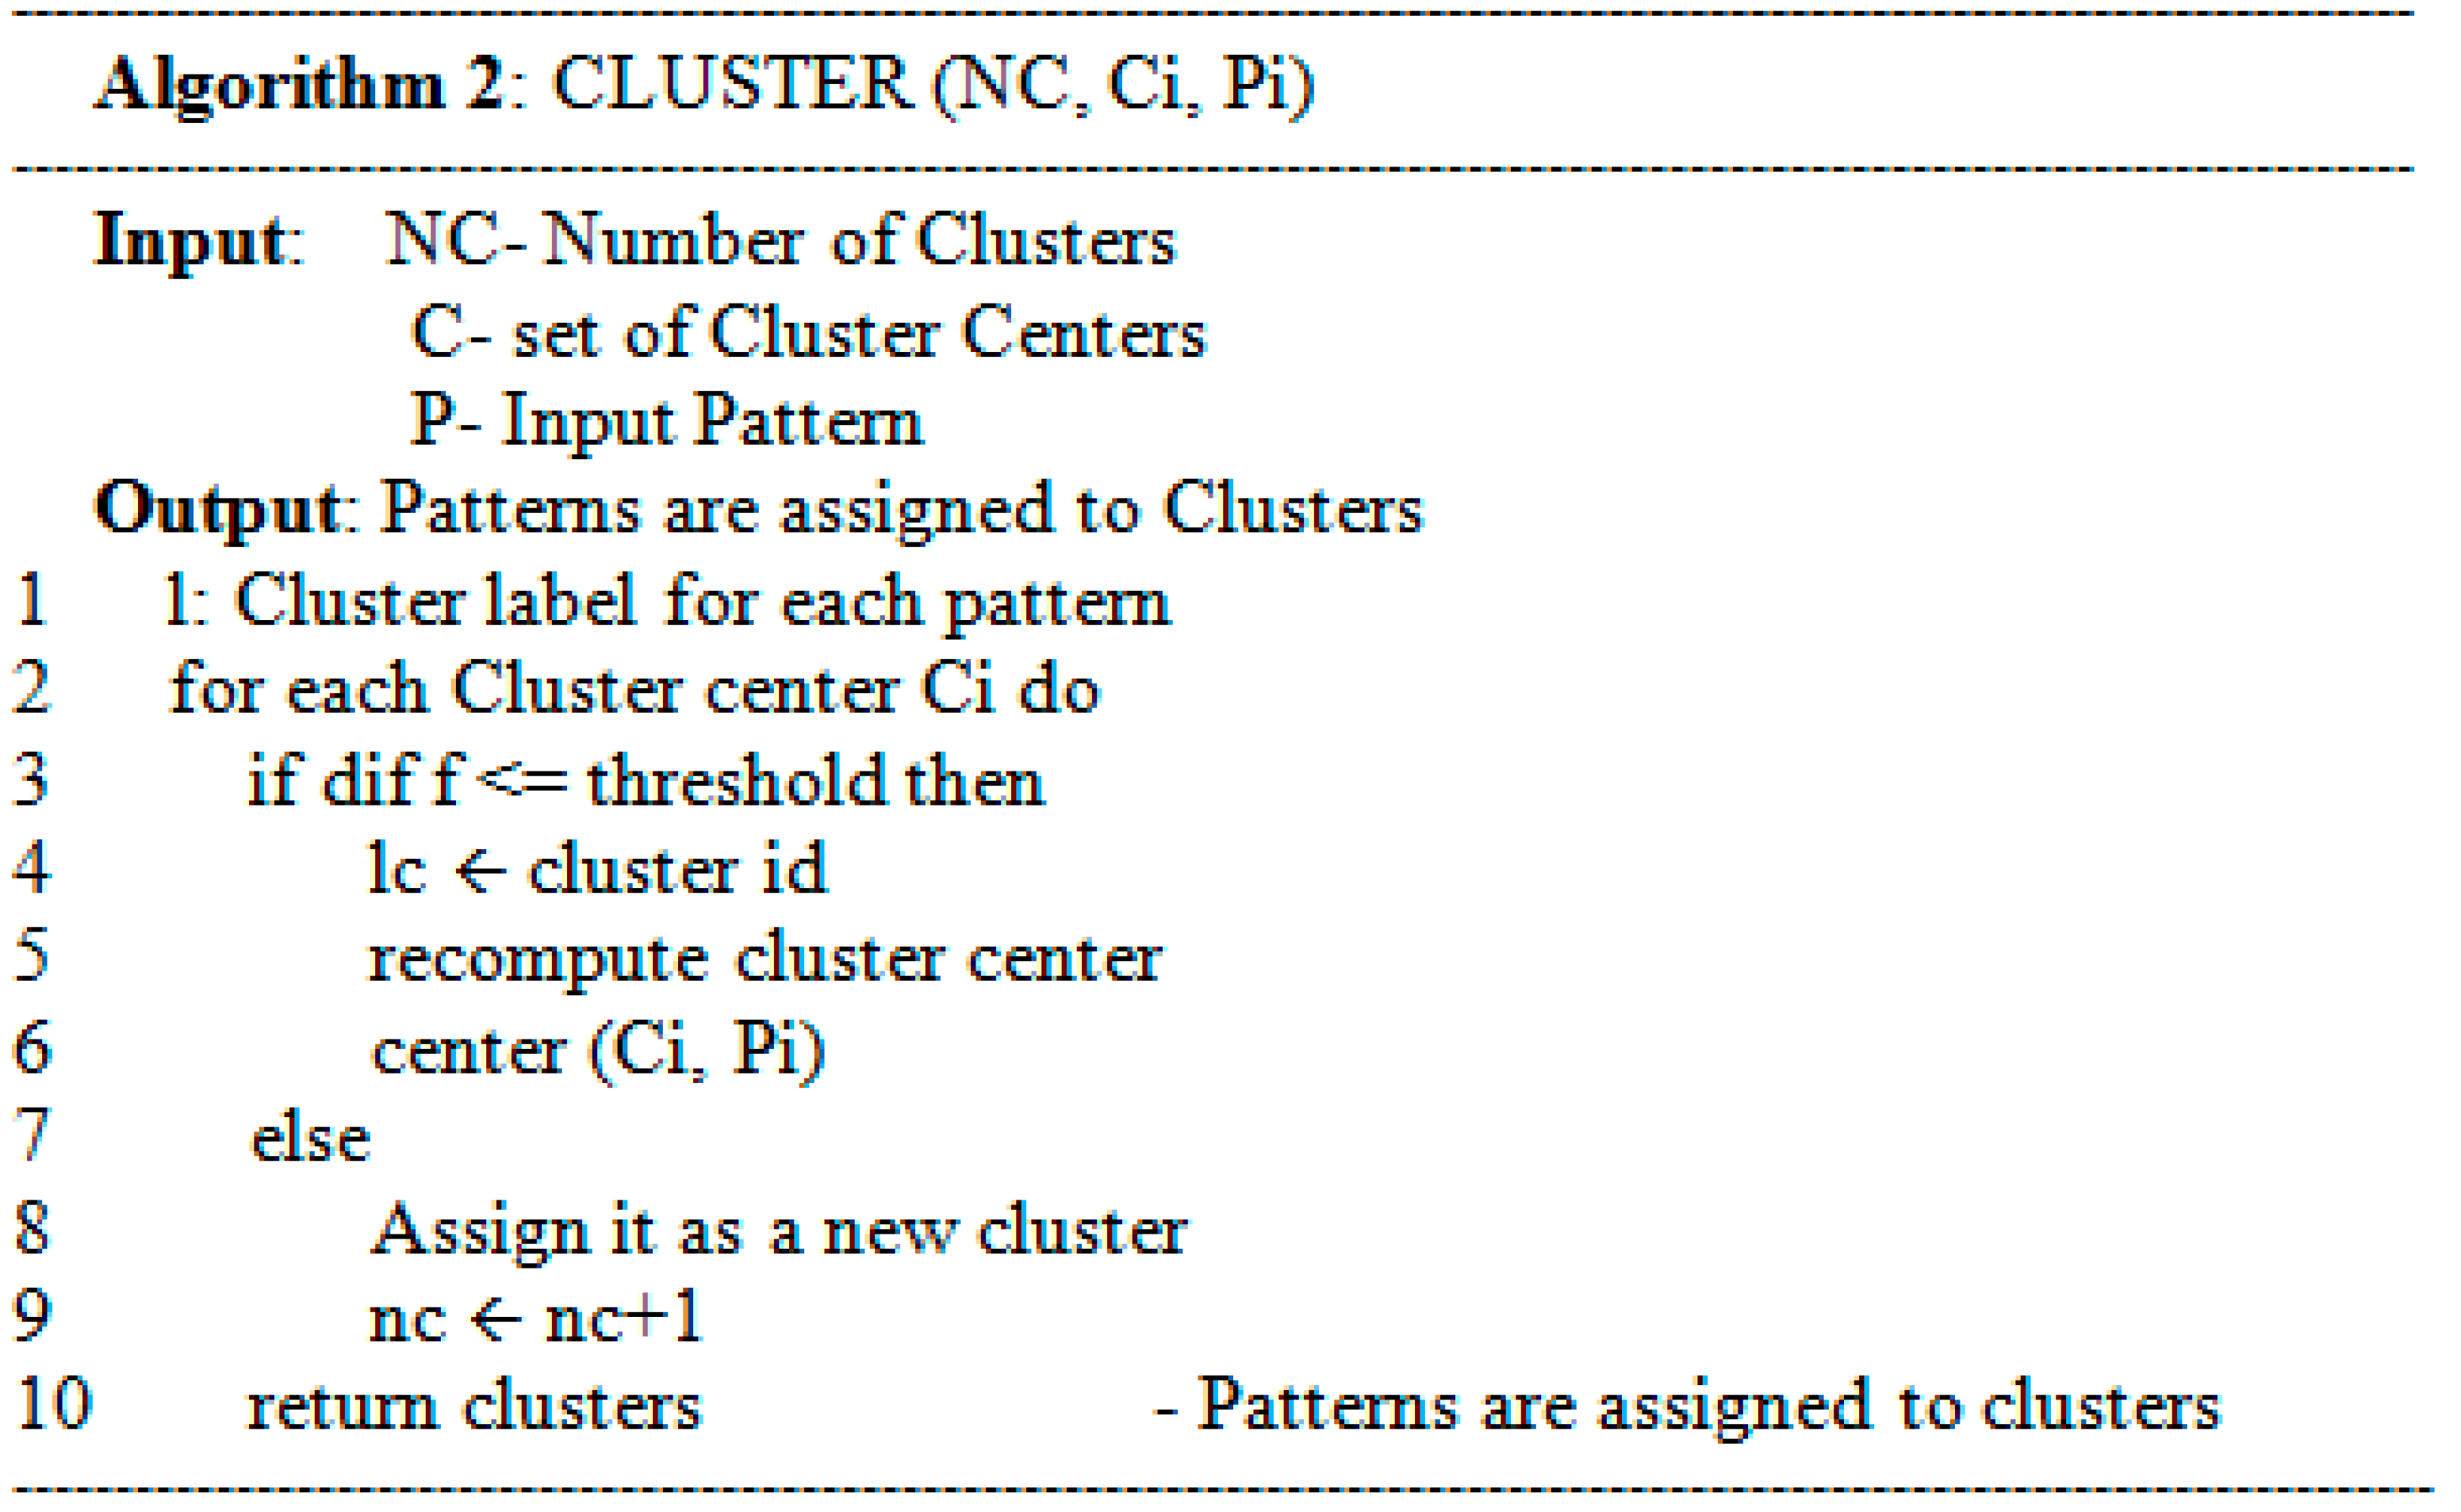
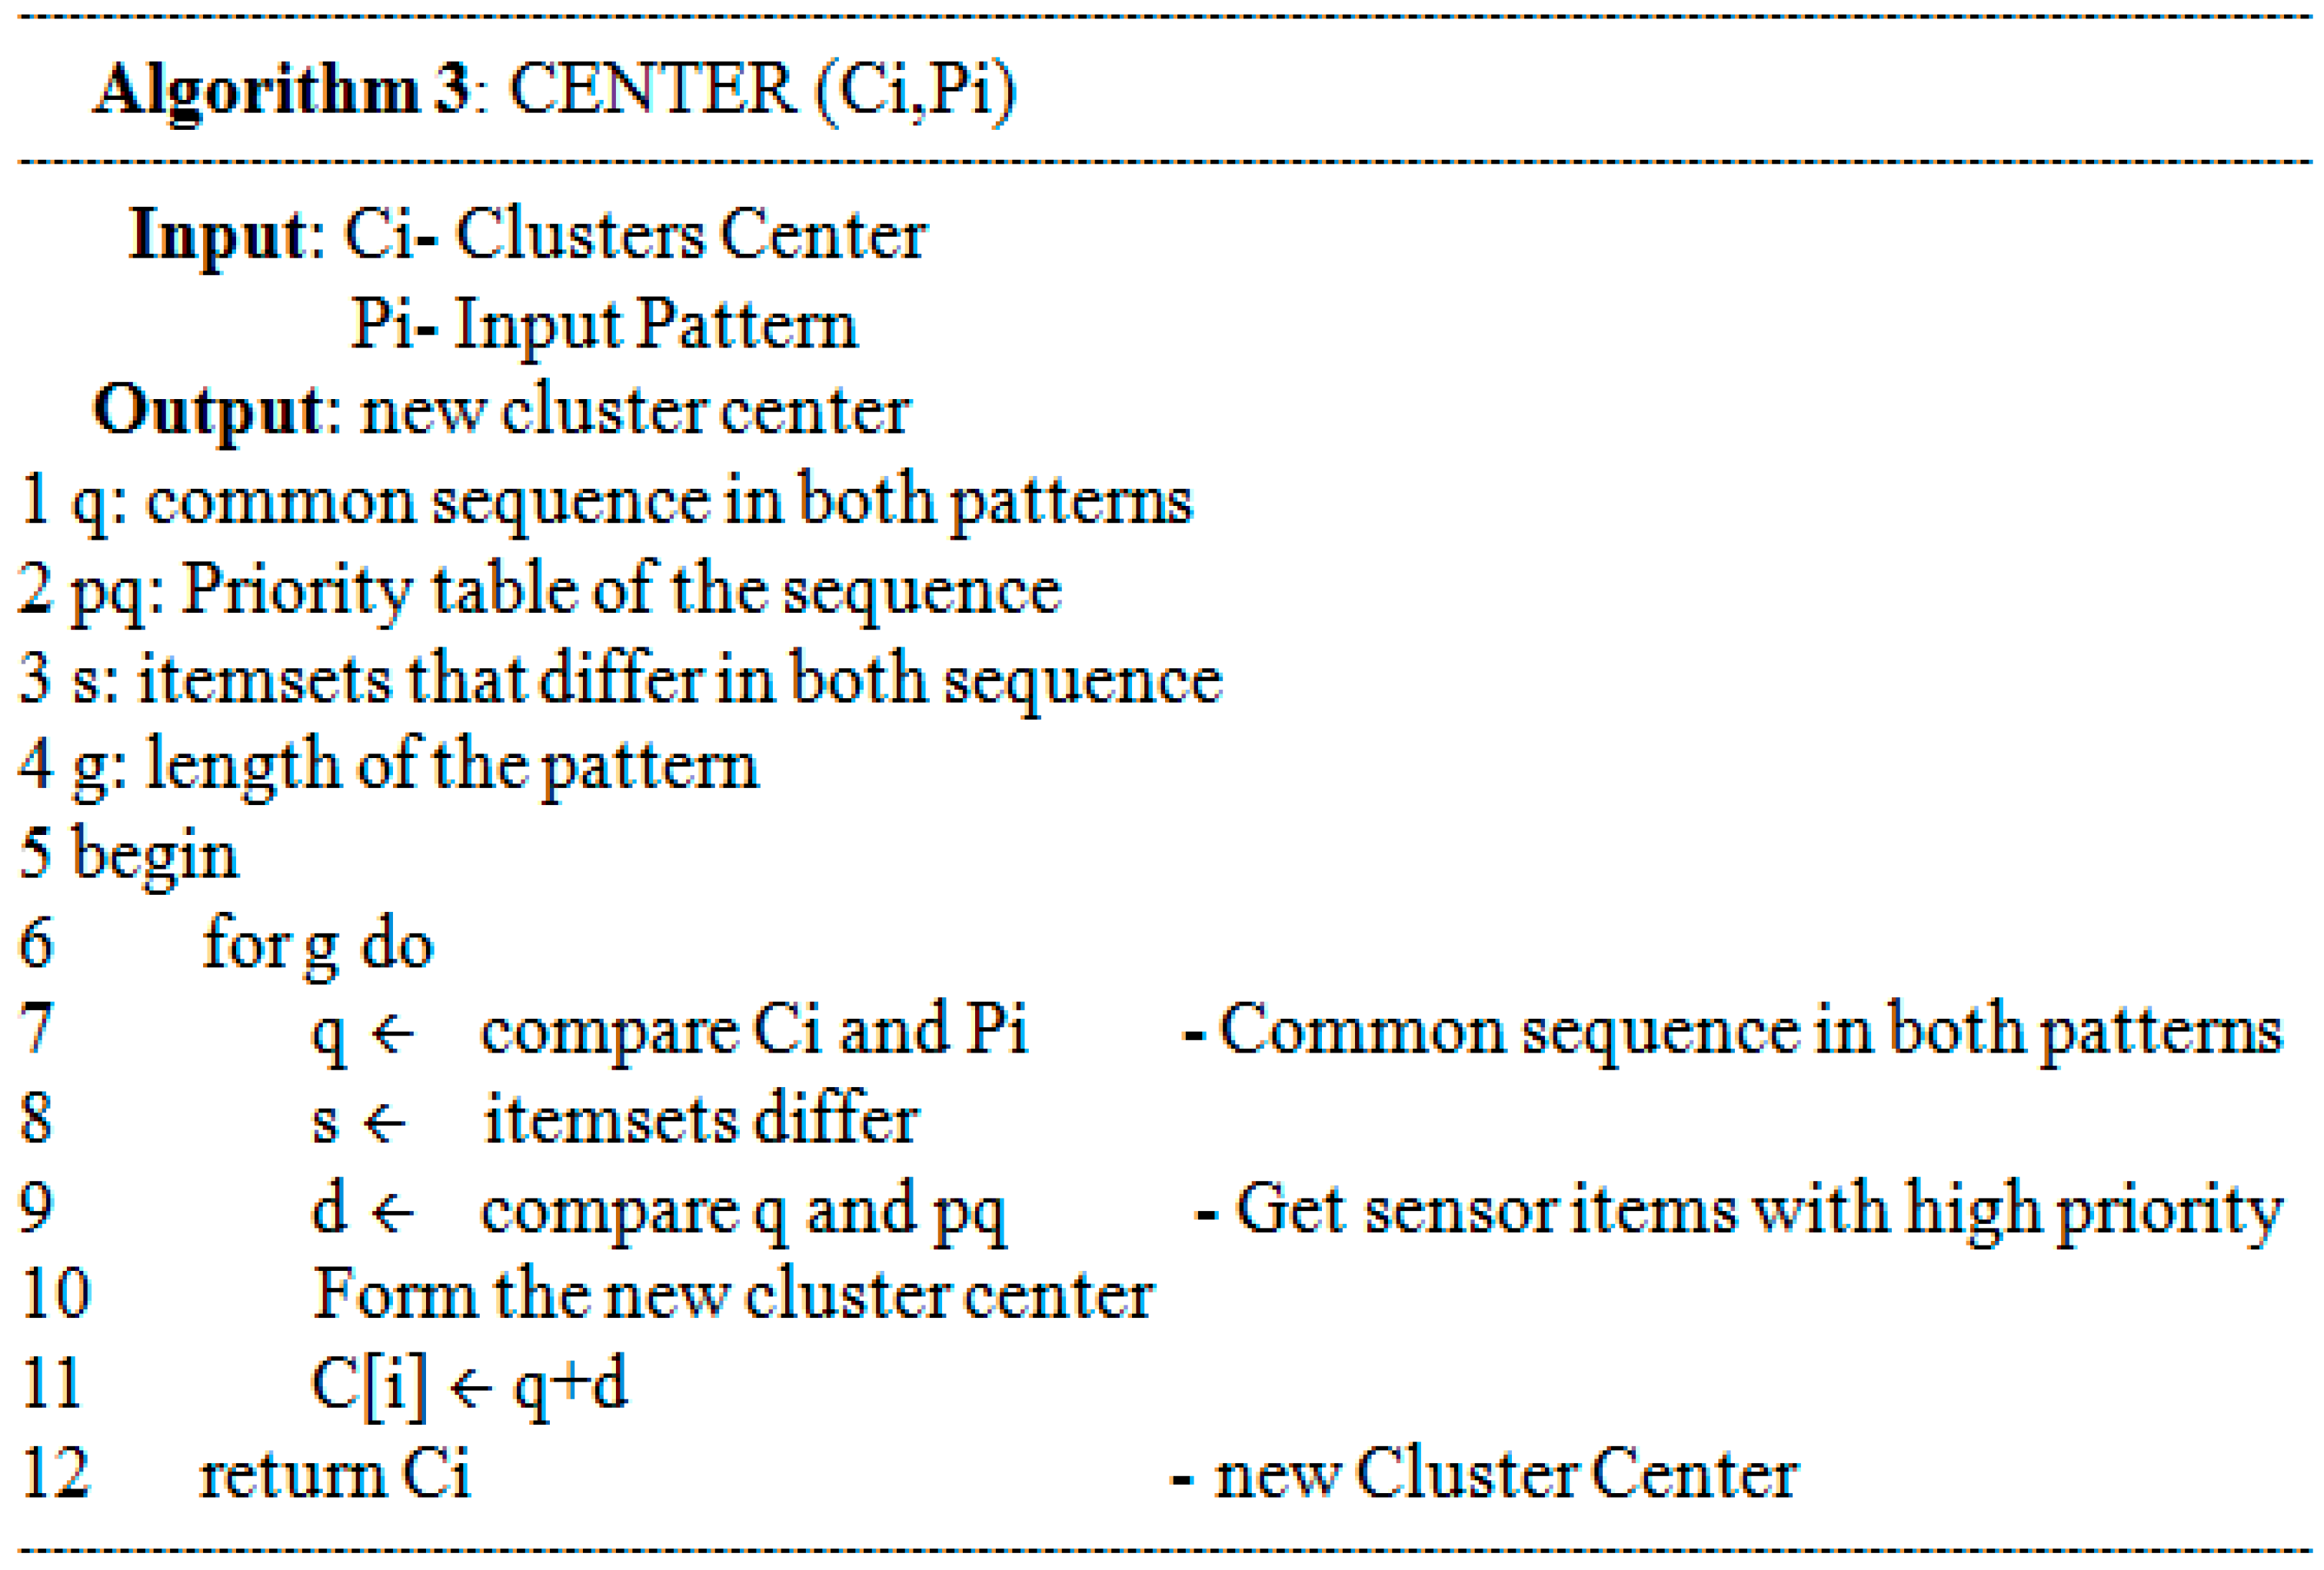
The contribution of this paper comes from this point. Among various existing methods, this paper suggests the best combination of a pattern clustering method and an activity decision algorithm, considering the features of the IoT, especially the smart home environment. As a result, our research takes two steps. First, in order to detect repeated patterns or anomalous user behavior from varied and complex user activities, we investigated existing works extensively. Among them, we chose the K-pattern clustering algorithm [
1] because it shows the best performance in terms of the temporal complexity and cluster set flexibility even for the very large amount of data in the IoT smart home environment. The detailed explanation will be given in
Section 3.1. On the other hand, the second step describes the training of smart environments for predicting and recognizing user activities inside his/her personal space in order to mitigate the issues related to that activity recognition in the real world. Here, the monitored user plays an essential role in the differentiation of daily activities and habits of each individual. In other words, this step is able to represent the user activities and their variations, and also to recognize those activities when they occur in the smart home environment. Our experimental results in
Section 4 showed that the Allen’s temporal relations [
2] based artificial neural network (ANN) gives the highest accuracy for user activity recognition. However, this accuracy is achieved at the cost of the run-time as shown in
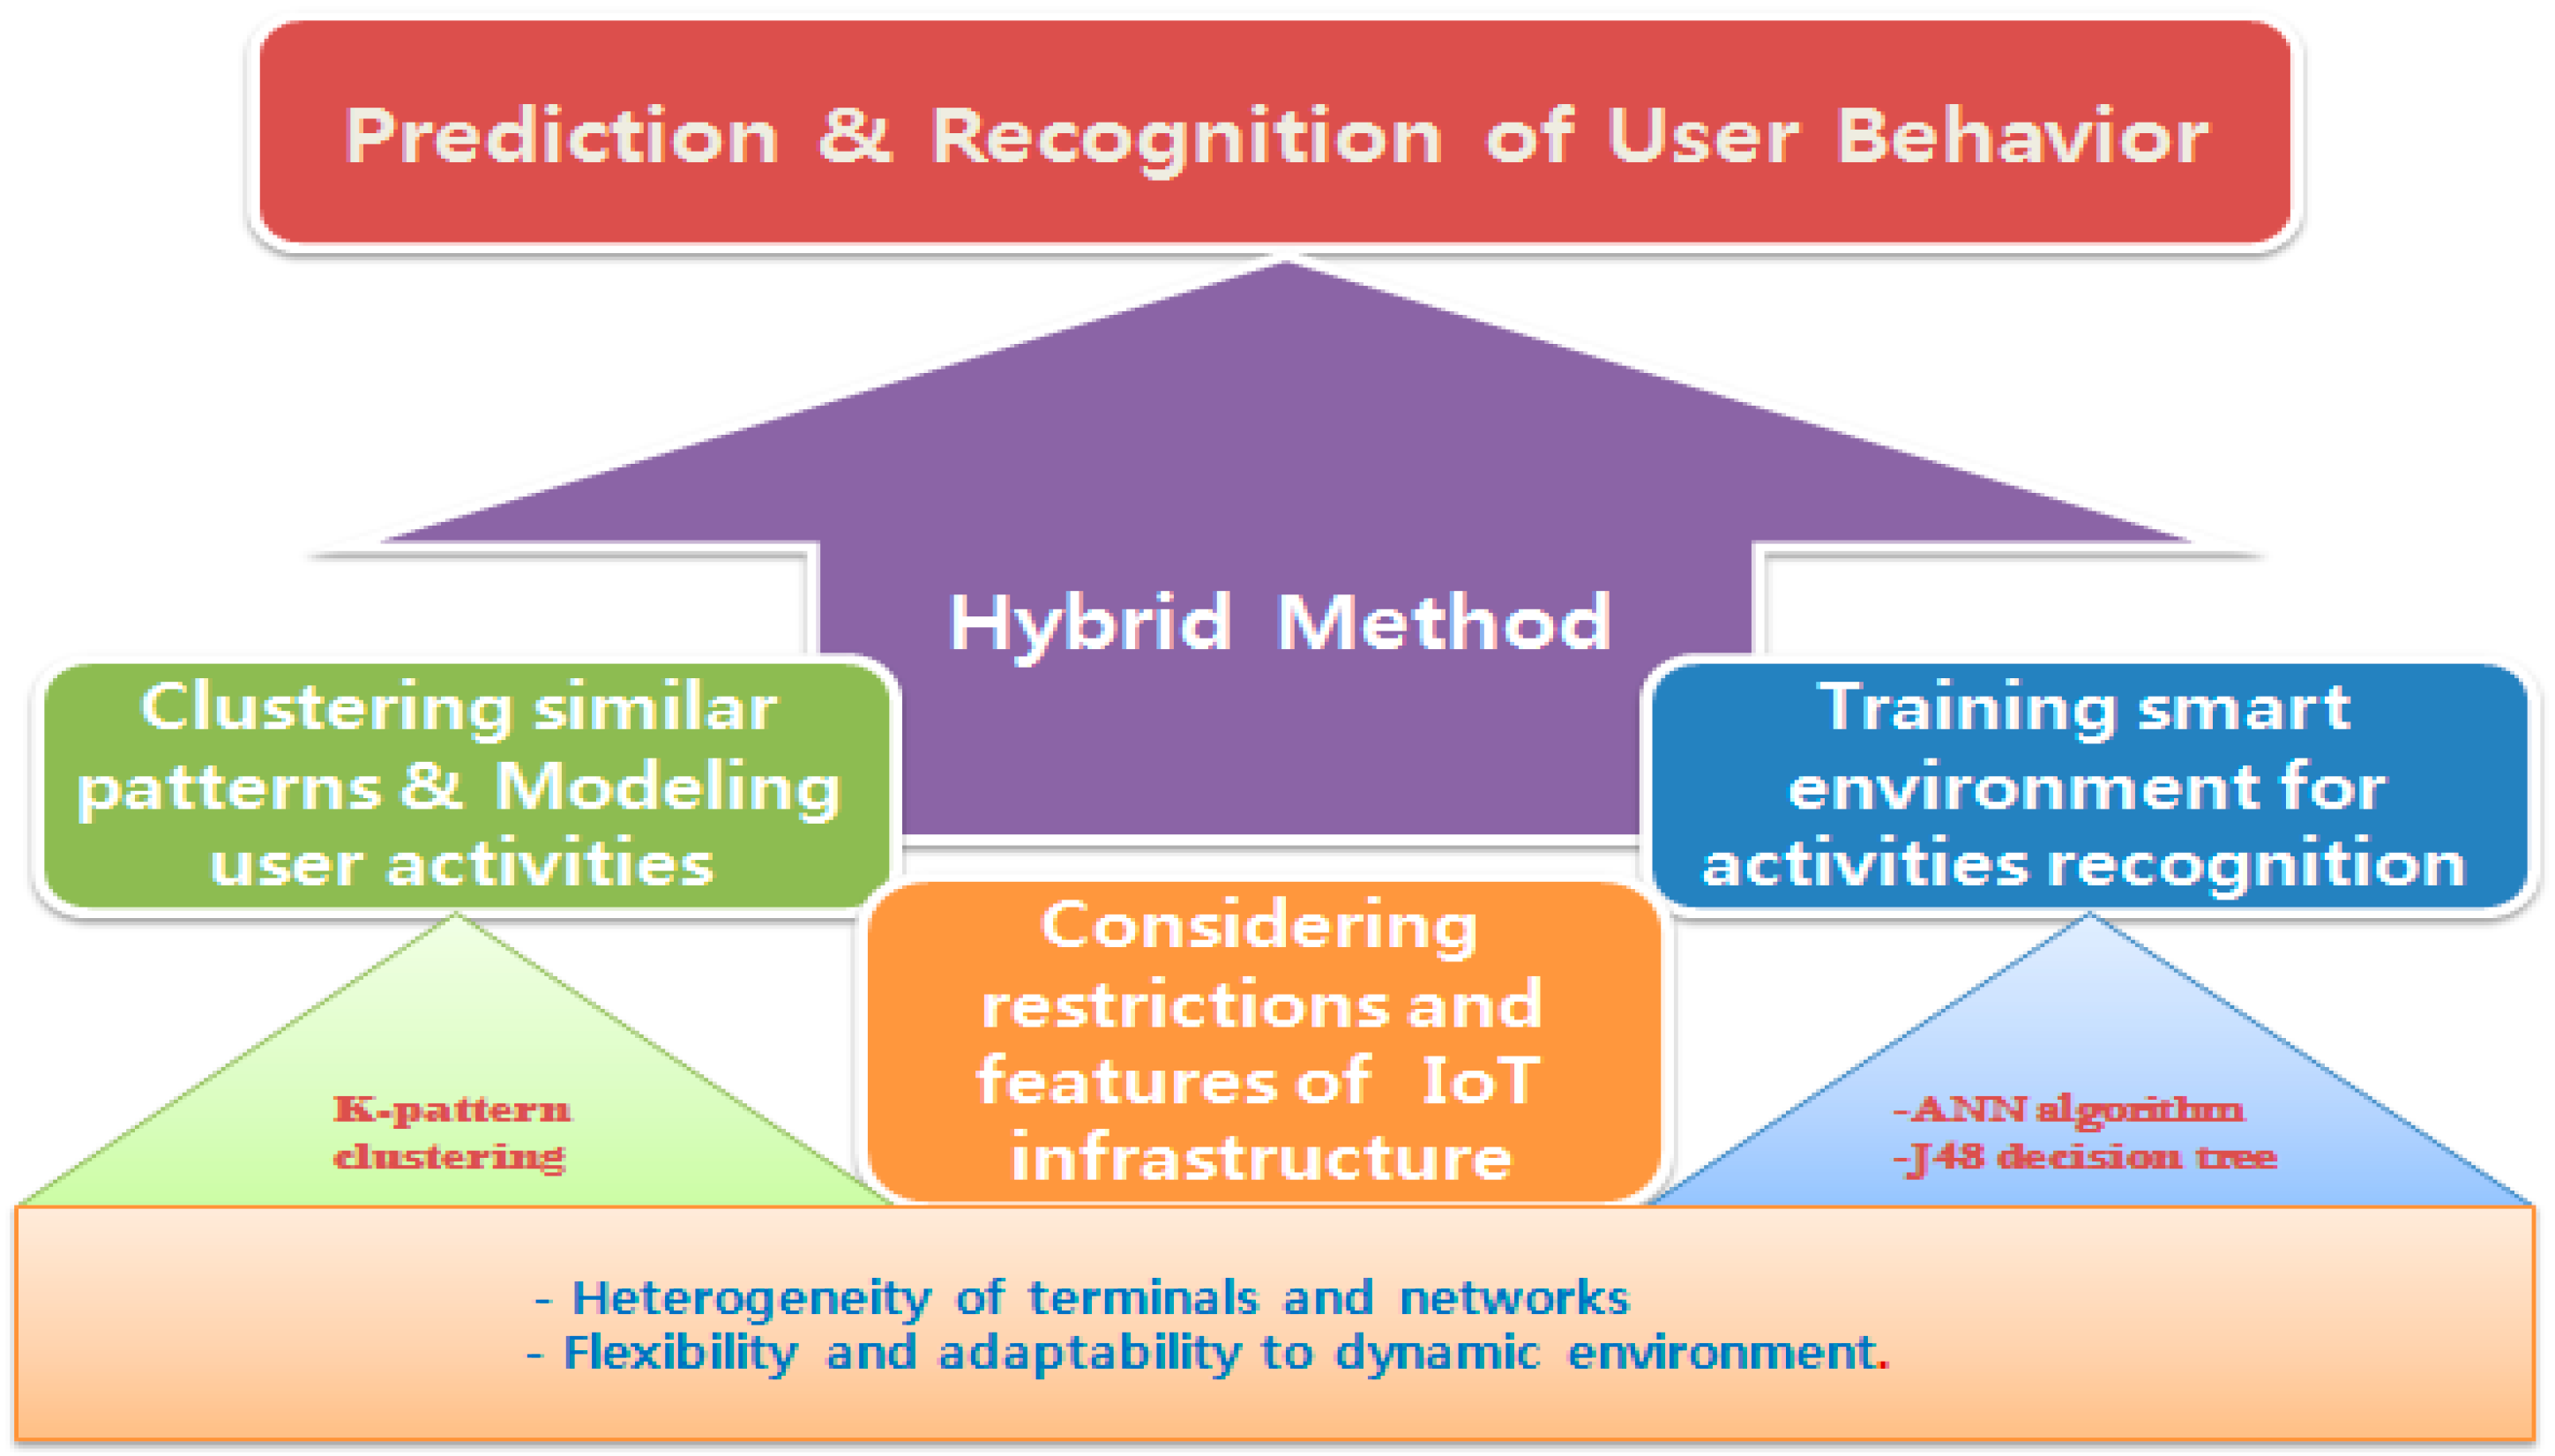
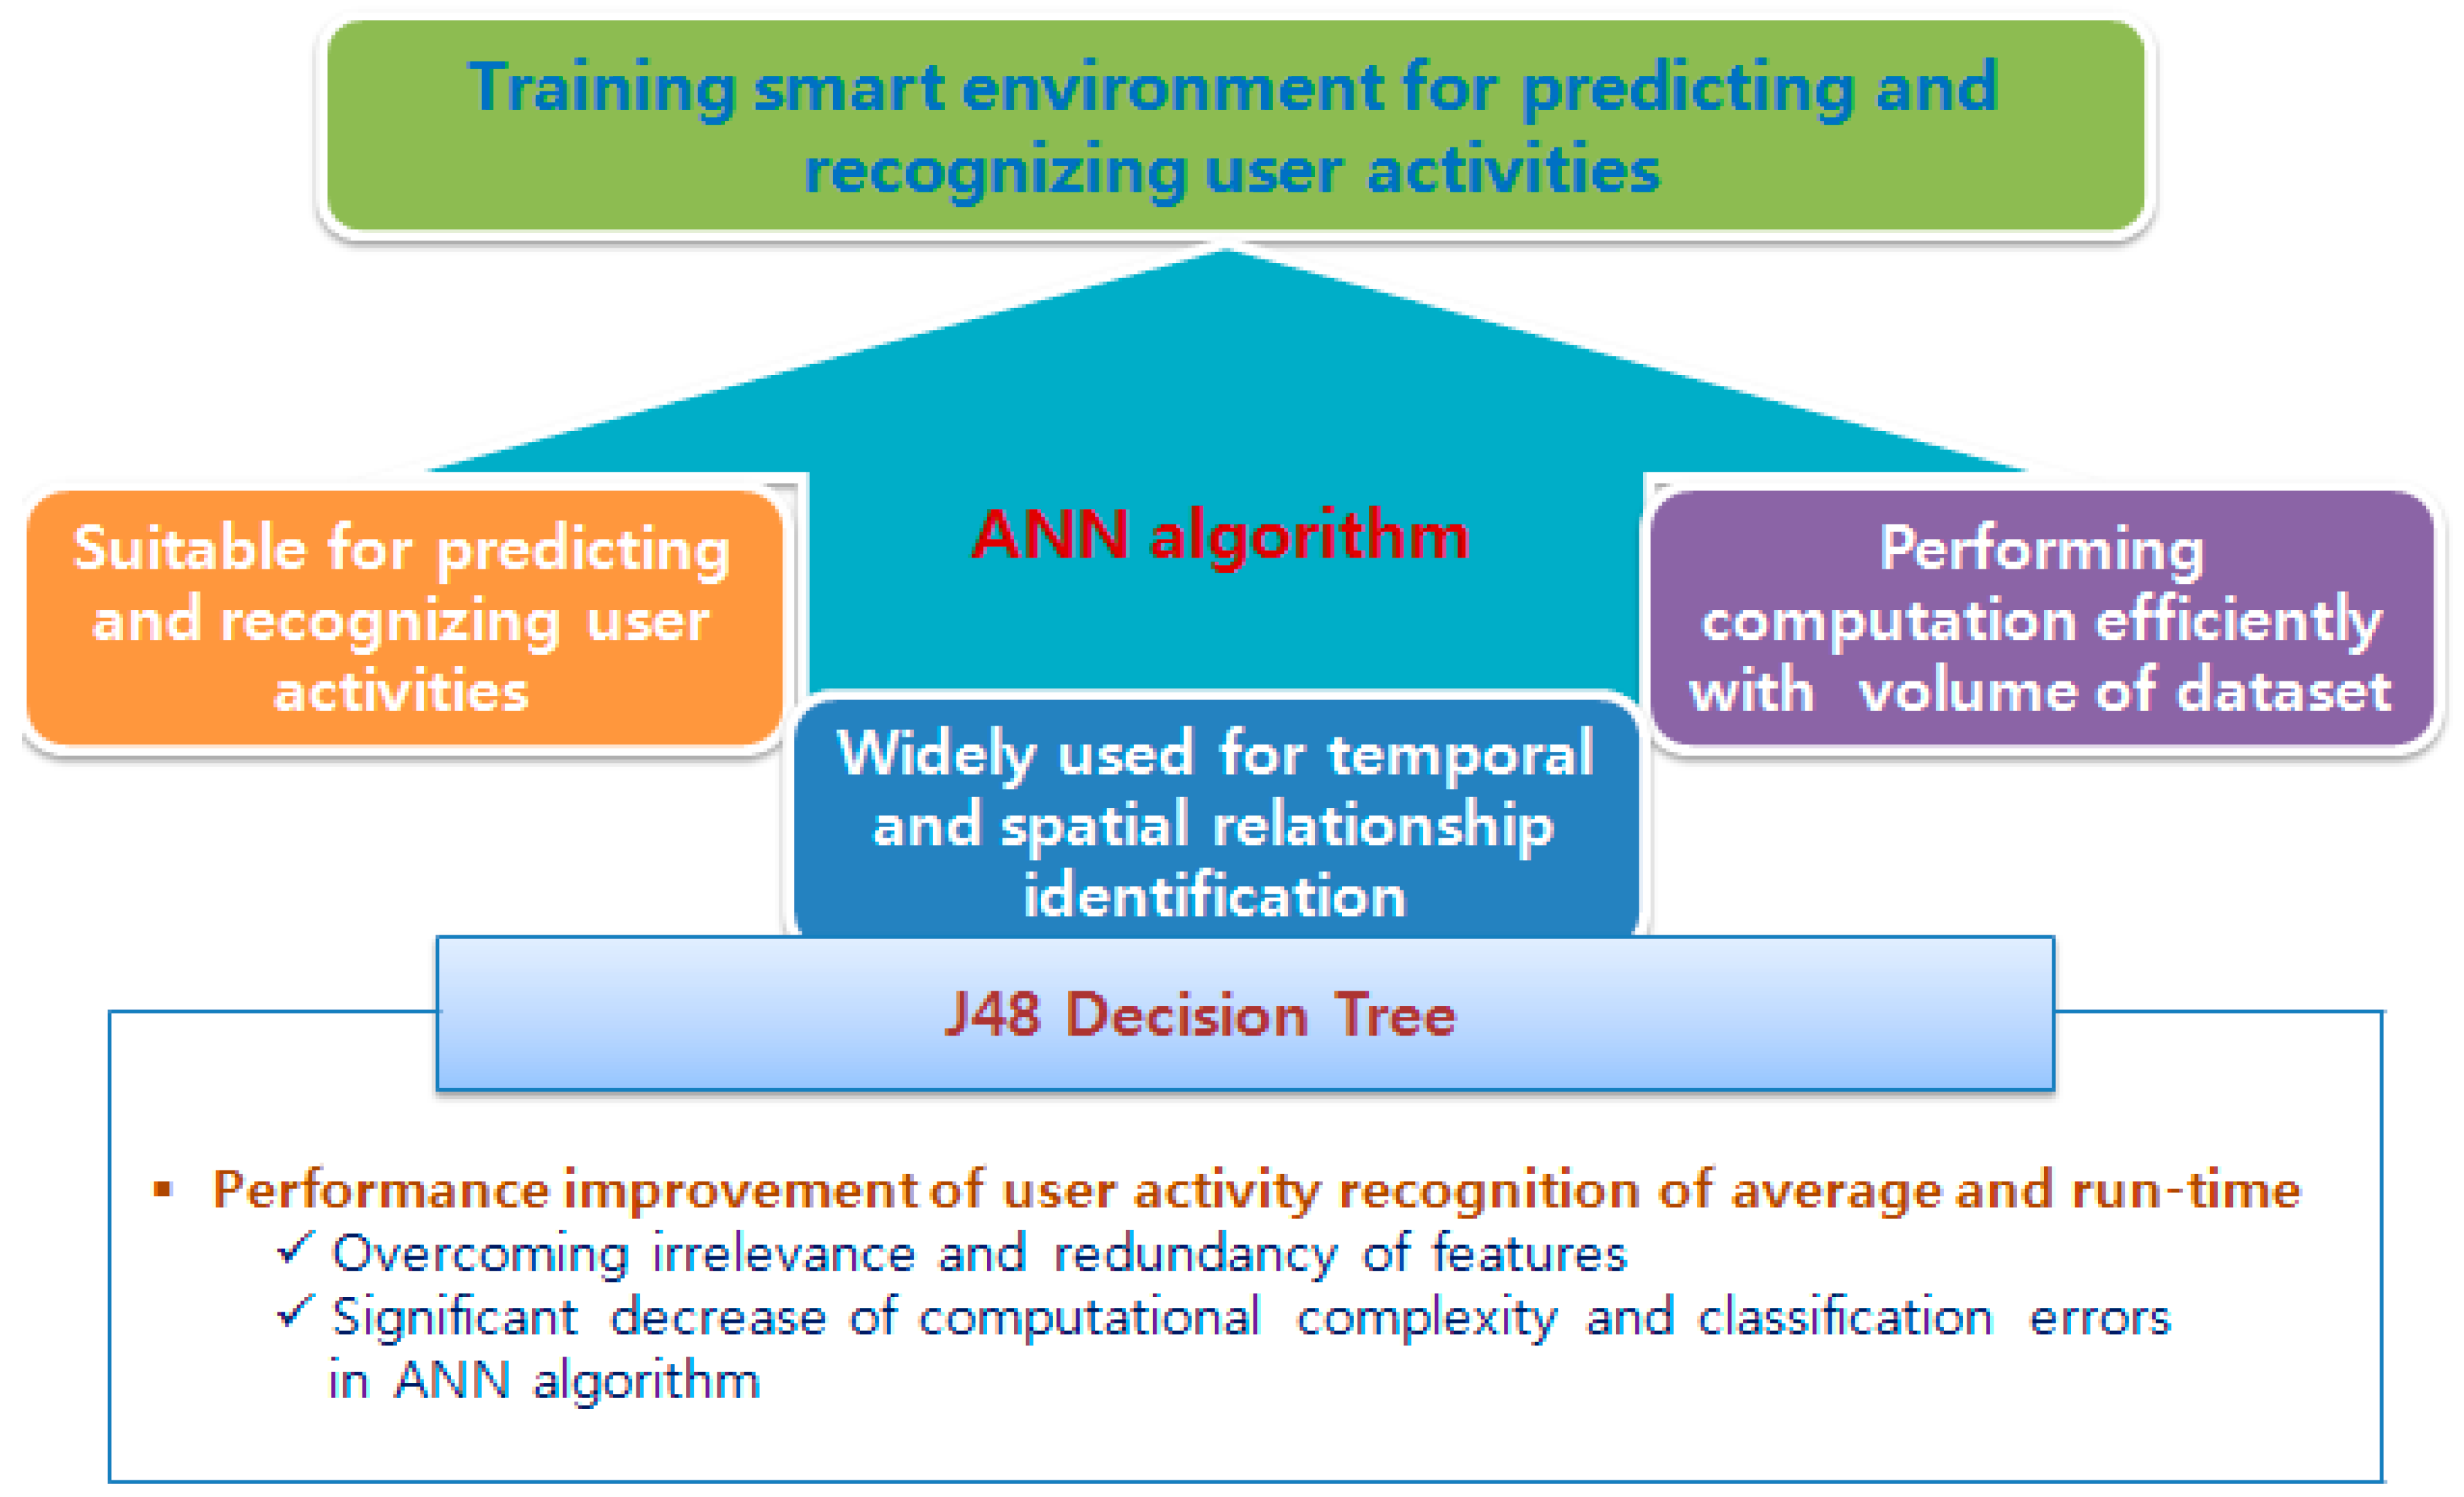
Section 4.2. We suggest the additional use of an efficient feature selection approach called the J48 decision tree to improve both the average accuracy and the run-time performance as shown in
Figure 2. This hybrid method deals with the activity recognition challenges, considering the restrictions and features of the IoT based smart home environment.
Most previous researches have showed their limits, especially when they face some challenges such as “concurrent activity recognition”, “discontinuous and interleaved activity recognition”, interpreting different meanings and different time sequences, etc. On the contrary, our hybrid method is more accurate and extensible to a dynamic environment such as the smart home. It allows the detection of anomalous or unexpected behaviors, and the mitigation of activity recognition issues in the real world. So, the achievement of this goal is possible by applying the K-pattern clustering algorithm to the temporal based neural network learning algorithm for unsupervised classification of recognizing and predicting user behavior in the smart home environment.
Additionally, unlike conventional detection methods, our hybrid approach considers the problem of heterogeneity and scalability in the smart home infrastructure, focusing on security mechanisms and resident comfort enhancement.
Figure 2.
Architecture of hybrid method.
Figure 2.
Architecture of hybrid method.
The remainder of this work is organized as follows: In the next section, the related work is introduced. In
Section 3, a theoretical description of the proposed method is presented.
Section 4 provides experimental analysis. Finally, the conclusion and future works are offered in
Section 5.
2. Related Work
Various researches have been proposed in the IoT based smart home environment to enhance the security, safety and comfort of residents with minimal operation costs. Obviously, inside smart homes, the use of sensors is indispensable for tracking user activities. Activities daily living (ADL) of users is monitored and the general activity patterns are modeled according to the user position in his/her environment. Thereby, any anomalous or unexpected behavior of the activity pattern can be detected. Moreover, other researches have been employed to mitigate the activity recognition issues with different approaches in various real world activities. However, the diversity and complexity in activities are often very high in daily living.
In [
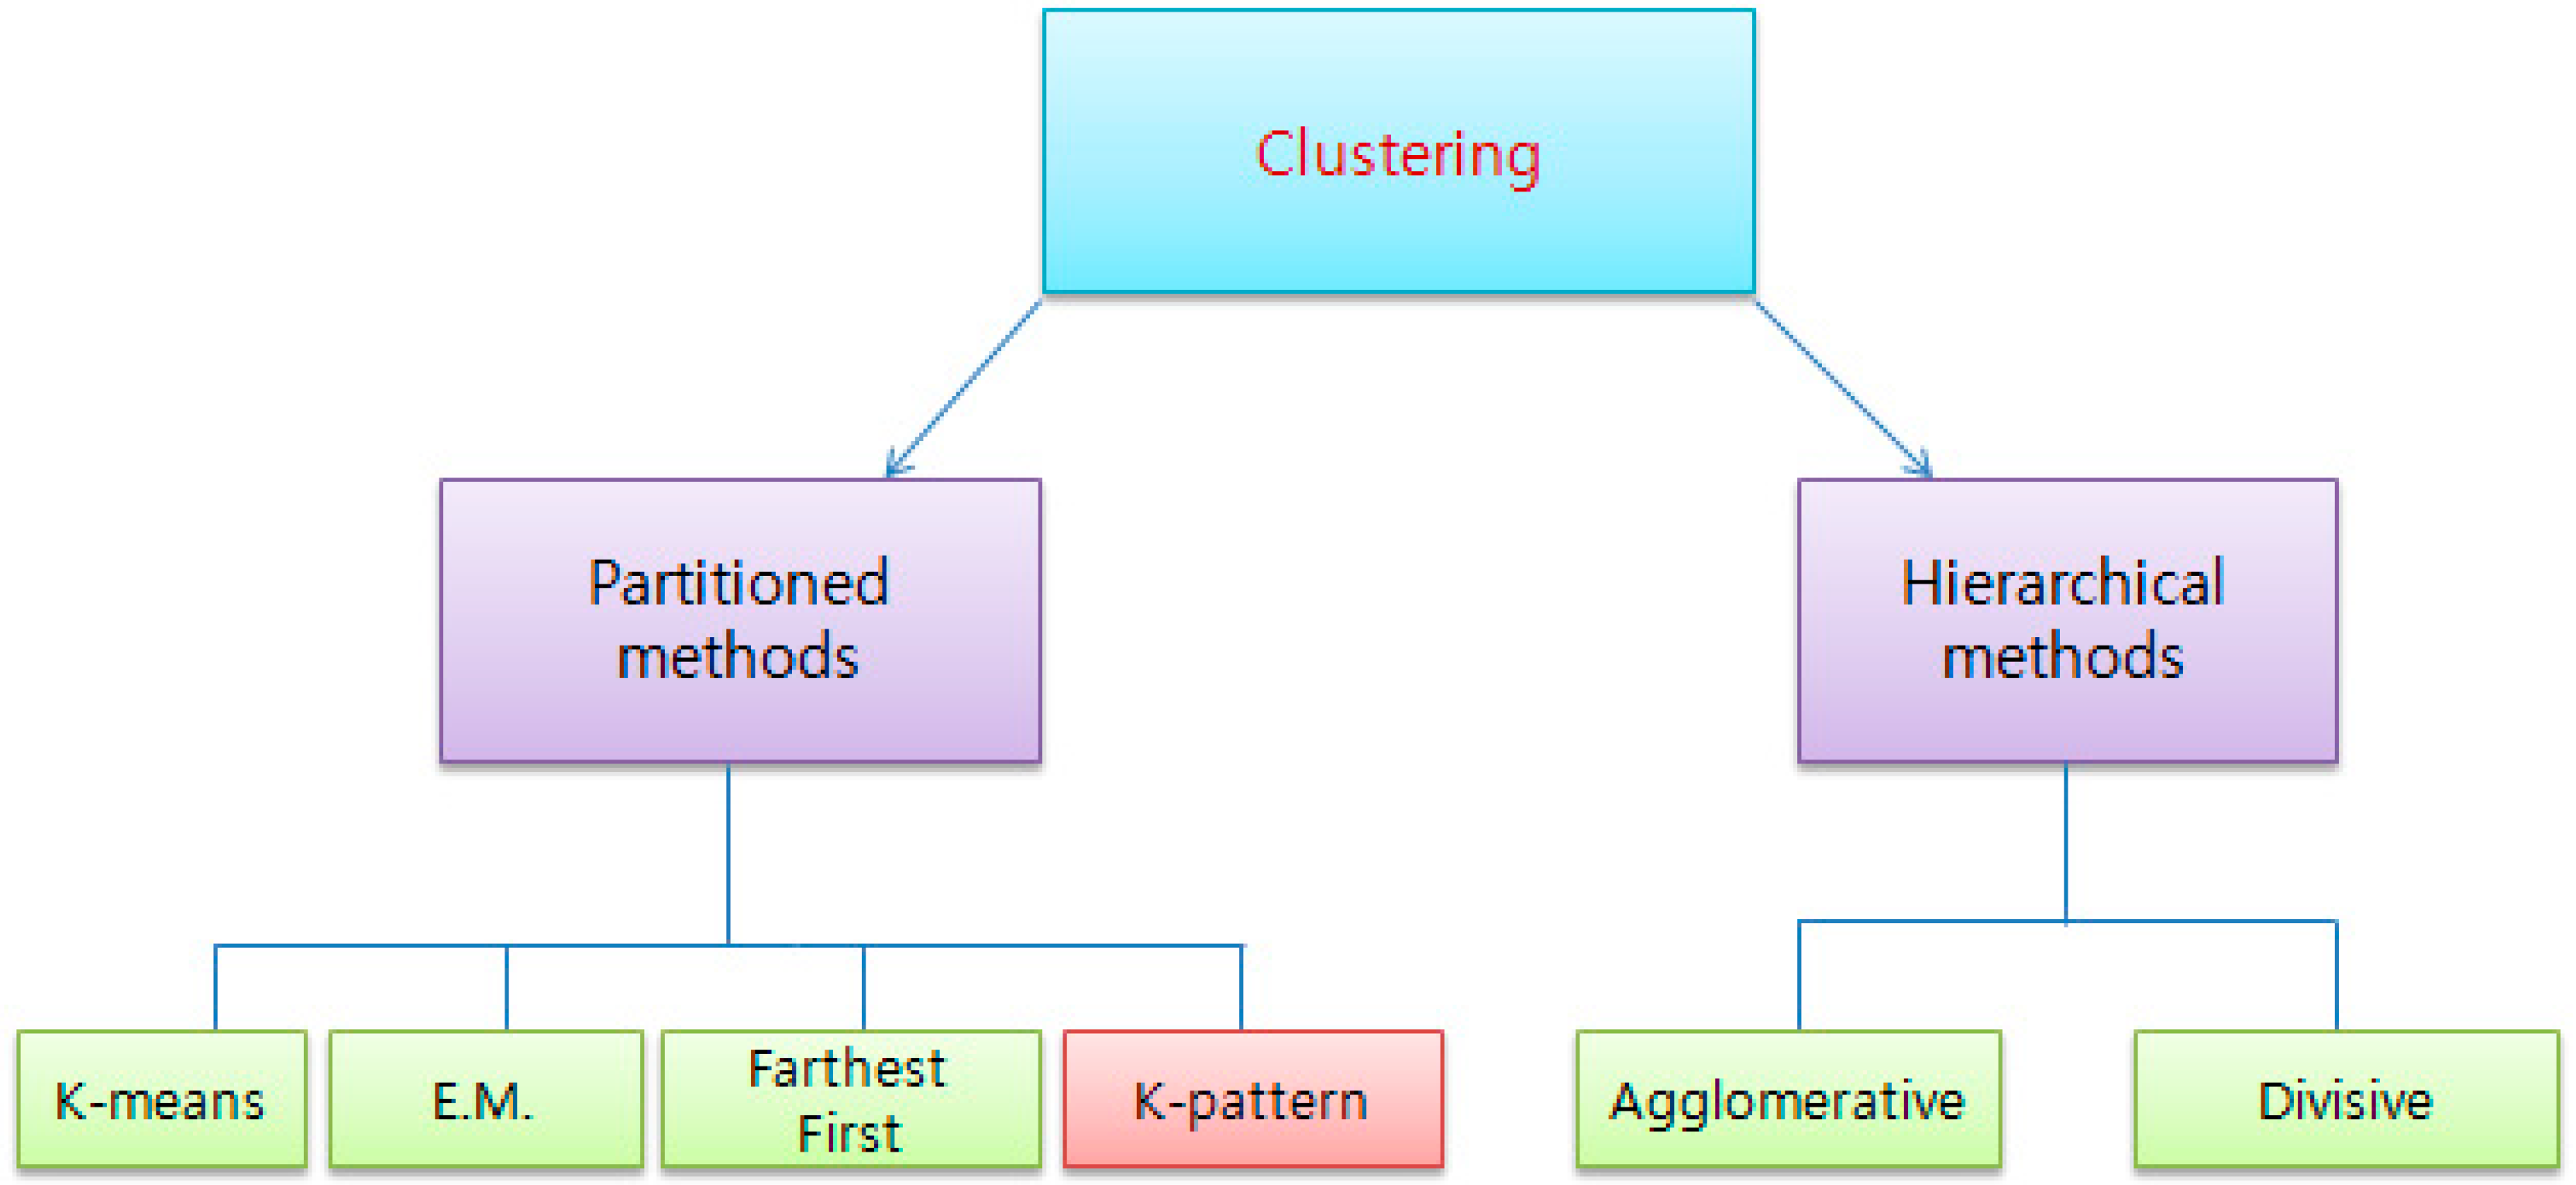
3], the EM-algorithm is used to form groups of similar objects. The algorithm is simple and fast but its efficiency depends on the number of input features, the number of objects, and also the iteration number.
Jakkula
et al. [
4] suggest to partition with a centroid by using the k-means clustering approach. A distance measurement scheme assigns a score to a cluster with the minimum value. However, the efficiency of the algorithm depends upon the number of clusters, the selection of the cluster center, and the number of iterations.
In [
5], a hierarchical clustering algorithm is used in a distributed environment to measure its performance and accuracy by applying validation measures like entropy, coefficient of variance and time. The number of clusters needs not to be determined in advance and also easy to be implemented. However, the hierarchical algorithm produces poor quality of clusters and takes a long time for execution when a huge dataset is given.
The SOM algorithm [
6] provides the higher accuracy in classifying objects into their suitable clusters. Moreover, it gives better results compared to the k-means and the EM-clustering algorithm when using random datasets. However, as the number of clusters k increases, the performance decreases considerably; or when using a huge dataset, the SOM algorithm shows poor results.
In general, the existing clustering algorithms above have some ambiguity in processing noisy data. Indeed, this noise makes it difficult to include an object into a certain cluster because it affects the results of the algorithms. In contrast, the K-pattern clustering algorithm has the ability to overcome this drawback.
On the other hand, some works integrate user behavior through activity recognition. Detecting user activities usually implies the collection of observation sequence in order to recognize new events. Some approaches to the activity prediction include sequential activity prediction using the decision trees, the k-nearest neighbor, and the Markov or Bayesian models.
Alam
et al. [
7] use probabilistic models such as Hidden Markov Models (HMM) for modeling user activities. It is a widespread method for identifying the spatio-temporal relationships between the sensor data and also for finding the time series forecasting [
8,
9]. However, the run-time is very long for huge data volumes.
In [
10], another classification method for activity recognition is considered based on C4.5 classifier. This technique provides good enough results. However, its performance in terms of the recognition accuracy is less than the neural network algorithm due to the diversity and complexity of activities in the real world [
11].
In this work, we use the neural network algorithm based temporal relations to overcome these drawbacks related to the recognition accuracy and long run-time, especially with various, complex and large volume of data.
4. Experimental Analysis
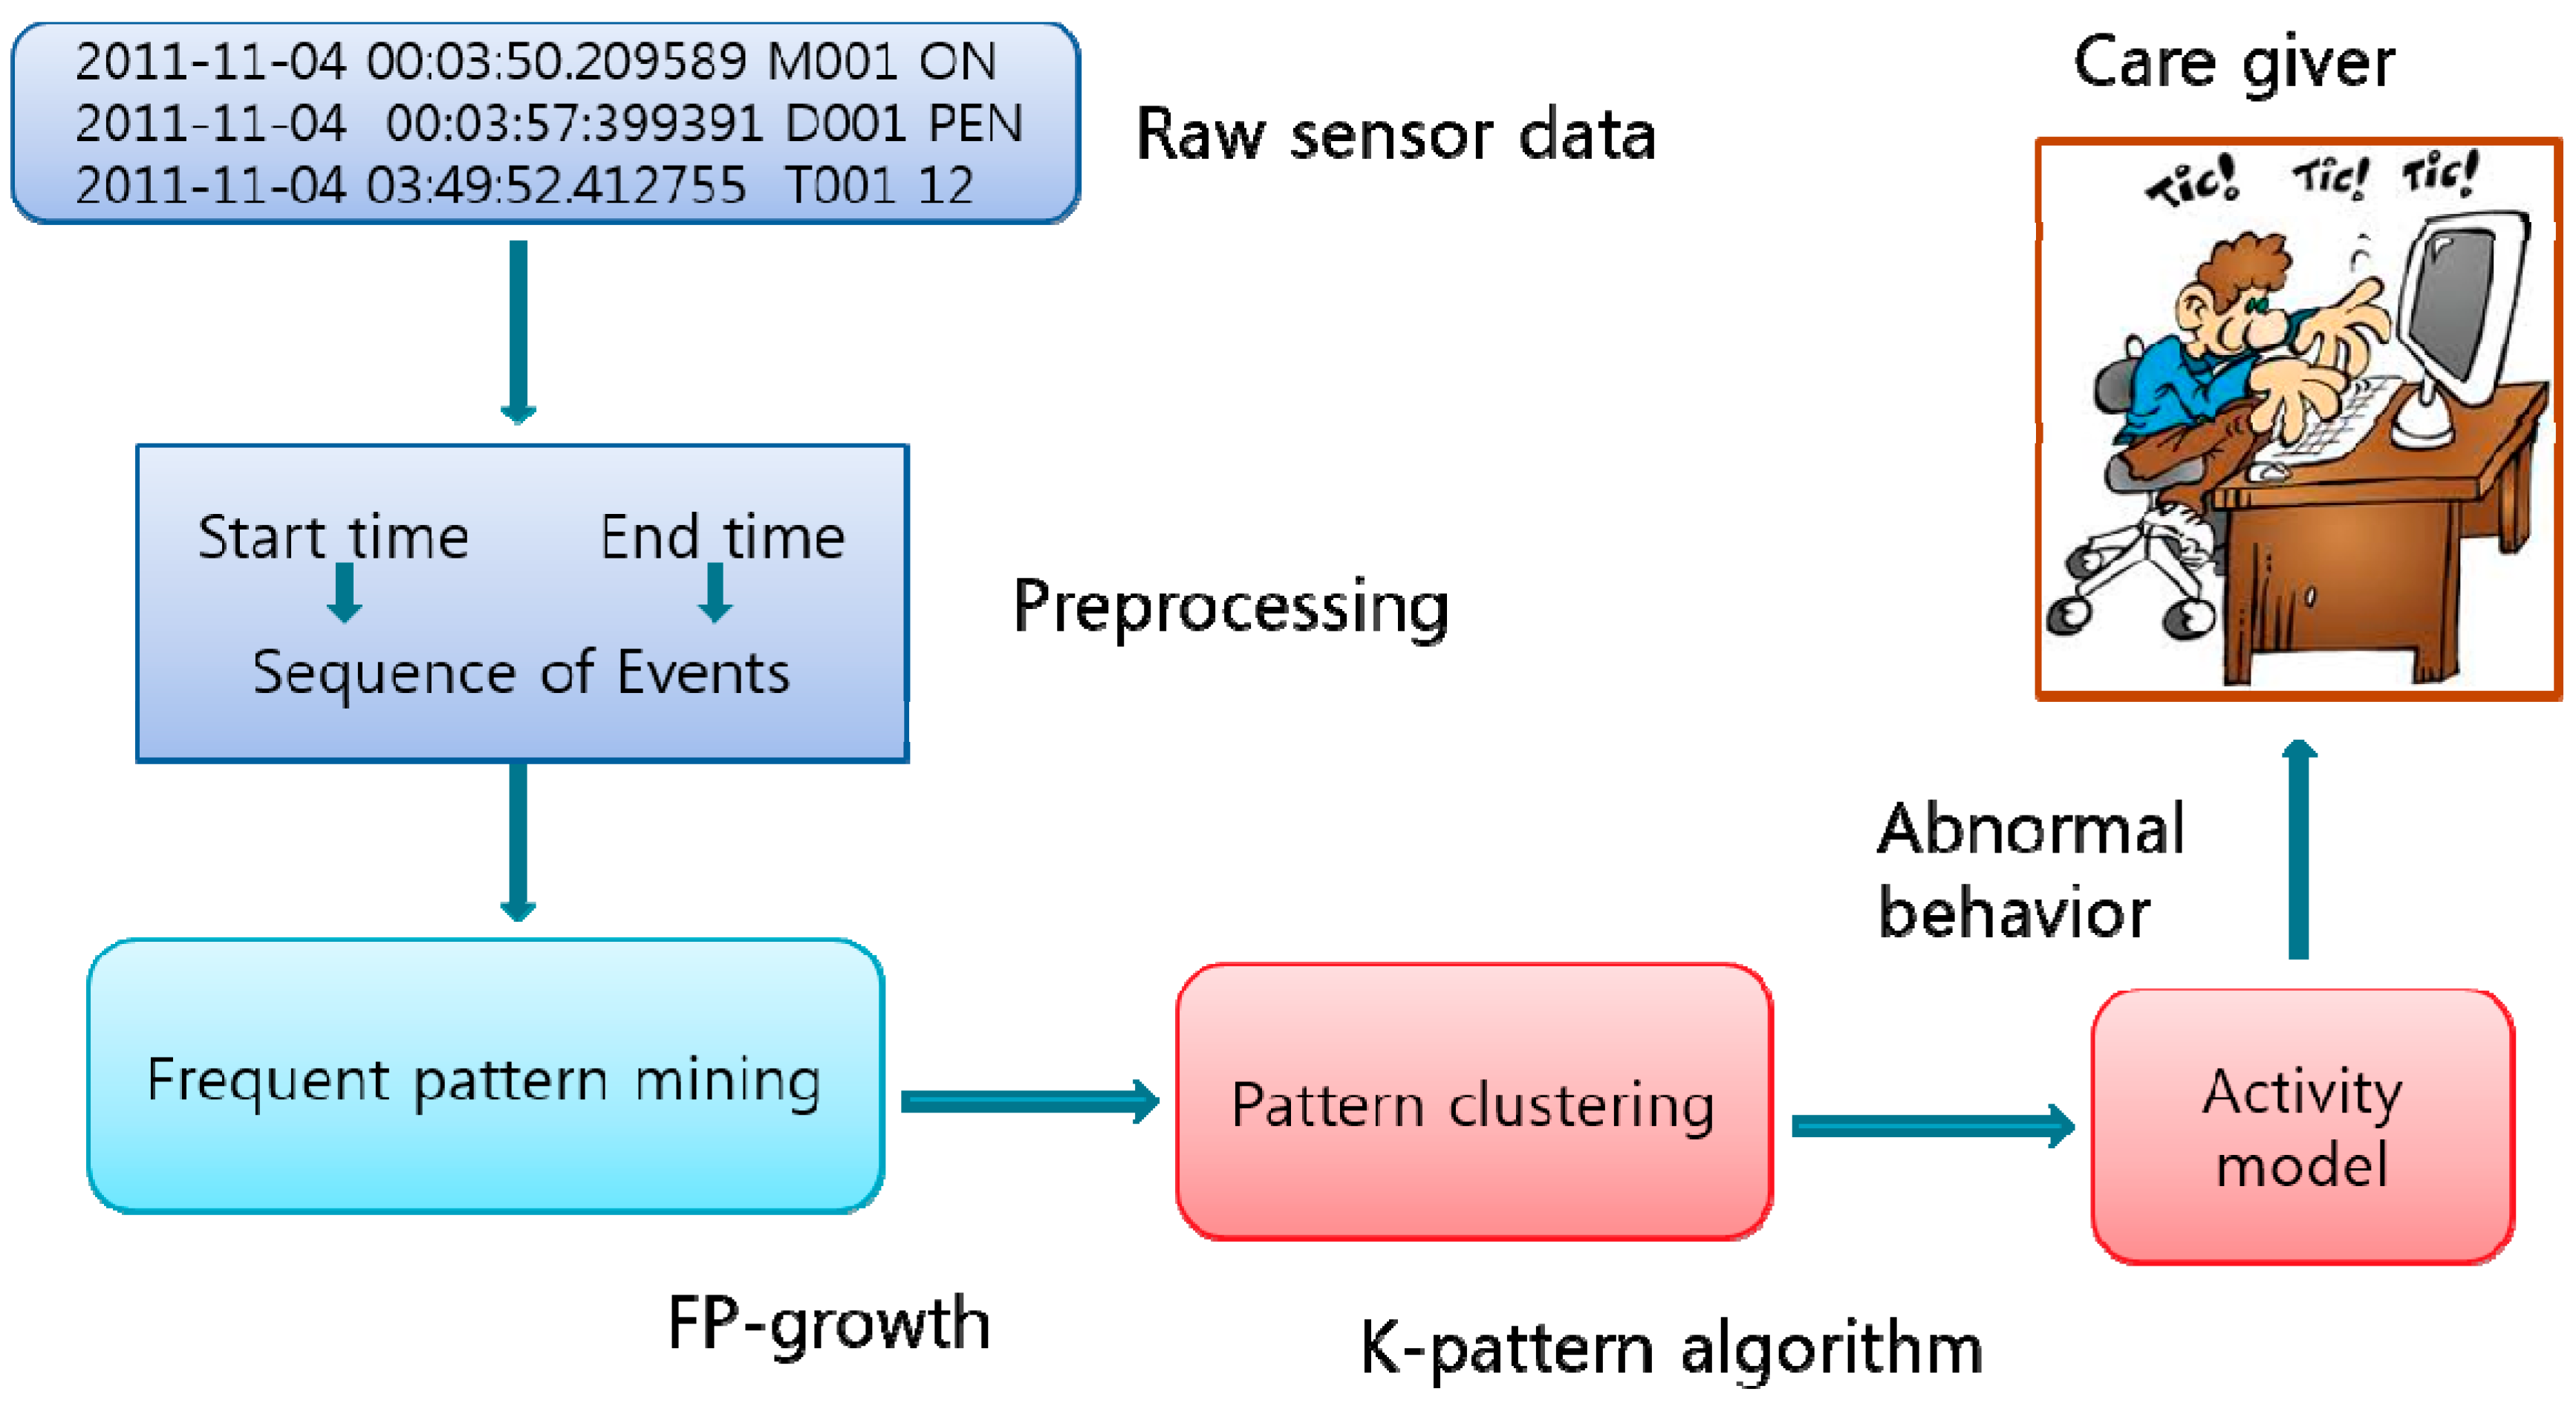
In this section, the possibility of implementing the user activity recognition inside the smart home is discussed. First of all, our analysis aims to find the most important temporal relations by assessing some classification algorithms. To achieve this goal, we consider a set of events from each activity, which have the temporal relations between them. These temporal relations are used to recognize activities that have been undertaken. Furthermore, a sequence of these temporal relations between successive events defines the type of activity in the dataset. These temporal relations of successive event are detected by some algorithms such as FP-growth [
15,
16] and Apriori algorithm [
17], based on the importance degree of each activity. The importance degree is the sum of the probability that each sequence of events can be discovered when any activity detected in a dataset is input to a pattern algorithm. This characterizes each activity and always impacts the activity recognition. Consequently, if a specific sequence of events is discovered, the recognition method determines that it belongs to the activity with the highest importance degree.
Meanwhile, for the accurate analysis, a temporal relation must occur for at least the minimum number, then this minimum number is dynamically changed in this work depending on the total number of events in each activity. If the minimum number is absolute, any activity including events less than the absolute value cannot be recognized however large a fraction is the most important temporal relation that takes among the total events. Thus, a relative threshold on the minimum occurrence of events for classification algorithms is used considering the number of events during each activity.
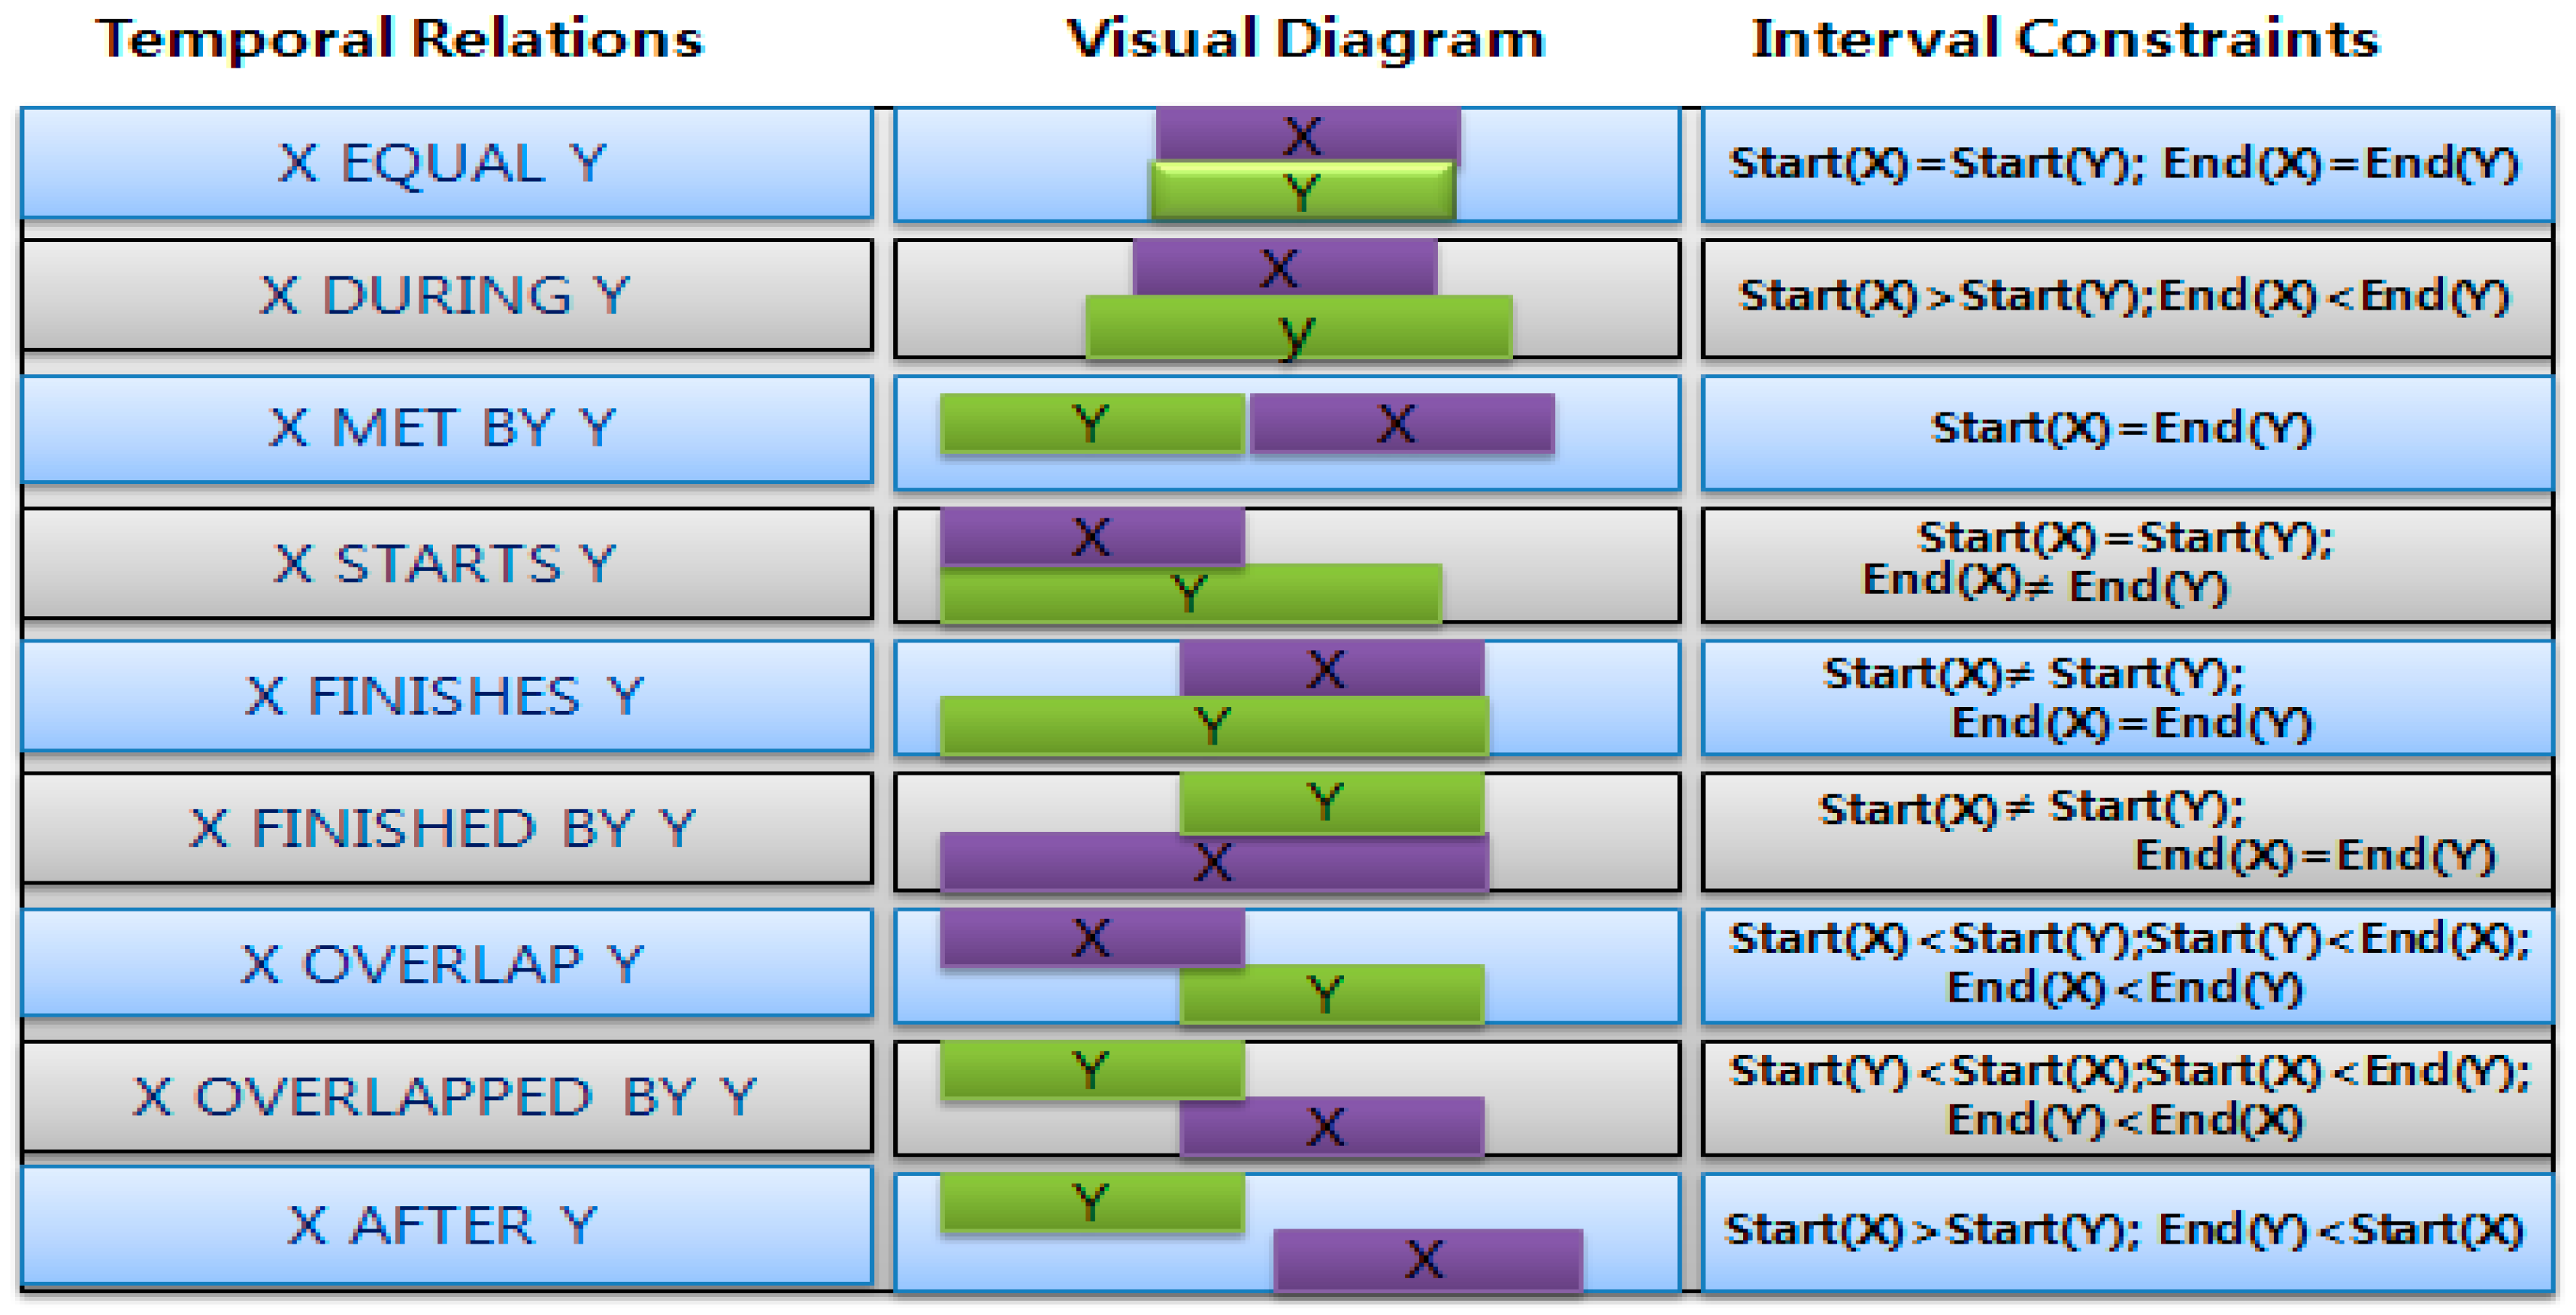
The actions we had interest in include taking a bath, preparing breakfast, listening to music, preparing lunch and playing a game. Those actions can be recognized through a set of temporally related activities as shown in
Figure 11. For example, if a light in the bathroom is turned on, the faucet in the bathtub is turned on and left running for some time, and the light is turned off more than 15~20 min later, then we can guess an occupant took a bath. On the other hand, if a motion sensor in the dining room detects a person, the refrigerator door is opened, and the heat increases around an oven, then we can think a resident is preparing a meal. The meal at 11:00 a.m. may be thought as either breakfast or lunch depending on his or her daily routines that have been observed for a long time. Some sound or acoustic sensors can be used to know whether a dweller is listening to music or playing a game.
The data related to those activities were taken from [
23] and simulated for different periods,
i.e., for two weeks and one week, respectively. A total of 77 and 84 sensors were attached to electric devices and appliances in two apartments of a 30-year old and a 80-year old woman, respectively, and the on and off information of corresponding devices was collected for 14 days. Using different methods such as the neural network algorithm, C4.5 classifier, naïve Bayes, and HMM, we evaluated the activity recognition accuracy for the most important activities as well as the runtime performance. As aforementioned, WEKA provides an implementation of the learning algorithms that are easily applied to our dataset [
24]. With WEKA, the selected learning classification algorithms were evaluated by using 10-fold cross validation.
Further, in order to reduce classification errors and computational complexity caused by redundancy and irrelevance of data, we adopted the feature selection method of J48 decision tree [
25]. Indeed, this is one of the most popular feature selection methods to improve the performance in terms of running time and accuracy. The J48 decision tree feature selection method utilizes a sequence of attributes which has the highest similarity between them in a given set of training feature vectors to create a classification model,
i.e., a statistical property that measures how useful a given attribute is to separate the training examples according to their target classification [
26]. By using the J48 decision tree algorithm, we can learn which feature plays an important role towards the target classification and select several ones as the main features for other machine learning techniques. After all, we compare the running time of ANN, HMM and NB algorithms after making use of a feature selection method. The experimental results substantiated the superiority of the neural network algorithm compared to C4.5 classifier, naive Bayes, and HMM algorithm in terms of average accuracy.
4.1. Comparison of the Recognition Accuracy
At first, all activities are discovered based on all available data in the common dataset. Then, the activities that most frequently appear are considered as the dominant activities in the smart home environment.
Table 5 describes the recognition accuracy by each classifier algorithm for the dominant activities during the period of two weeks. The accuracy is defined as the ratio of successful activity recognitions to the total occurrences of the activity.
Table 5.
Activity recognition with data of two weeks.
Table 5.
Activity recognition with data of two weeks.
| Activity | ANN | HMM | NB | C4.5 |
|---|
| Taking bath | 0.93 | 0.85 | 0.85 | 0.85 |
| Preparing breakfast | 0.94 | 0.88 | 0.88 | 0.89 |
| Listening to music | 0.57 | 0.54 | 0.52 | 0.52 |
| Playing game | 0.94 | 0.90 | 0.89 | 0.91 |
| Preparing lunch | 0.55 | 0.53 | 0.52 | 0.53 |
As for the results of two weeks’ training, the method is satisfactory overall, even though the accuracy barely exceeds 50% for certain activities. This low accuracy can be explained by the fact that, these activities include some actions (events) that occur also in different activities. For example, listening to music can be executed simultaneously when a user is opening the faucet in the bathroom or selecting the favorite games on his/her computer. Even though she/he may listen to music while they are either taking a bath or playing a game, the event can be still regarded as listening to music as the major action with high certainty. Therefore, this situation constitutes one of the main difficulties of our dataset and an efficient solution should be found to overcome this issue. On the other hand, the low accuracy for a certain activity may be due to its lower importance than other similar activities. For instance, both preparing lunch and preparing breakfast activities may include some common actions. However, since people more likely eat breakfast at home than lunch, those common actions are considered preparing breakfast as the main activity with higher certainty.
Next, the recognition accuracy of the system was evaluated with the data of one week and the results are given in
Table 6. Overall, the results are better than the case with two week data. We guess this is because it is easier to recognize several dominant activities in small datasets. As the number of activity types increases in proportion to the amount of data, there is a higher chance that an activity similar to one of the dominant ones can be included in the two week dataset. The pattern recoginition scheme may confuse the dominant activity and the similar one occasionally.
Table 6.
Activity recognition with data of one week.
Table 6.
Activity recognition with data of one week.
| Activity | ANN | HMM | NB | C4.5 |
|---|
| Taking a bath | 0.98 | 0.92 | 0.92 | 0.93 |
| Preparing breakfast | 0.69 | 0.66 | 0.64 | 0.66 |
| Listening to music | 0.91 | 0.87 | 0.86 | 0.88 |
| Playing a game | 0.65 | 0.61 | 0.61 | 0.63 |
| Preparing lunch | 0.73 | 0.69 | 0.70 | 0.71 |
However, compared to
Table 5, we notice the inversion in the accuracy between listening to music and playing a game. The similar situation is observed between preparing breakfast and preparing lunch. The recognition accuracy for playing a game and preparing breakfast was reduced to around 62.5% and 66.25%, respectively, while listening to music and preparing lunch were recognized more accurately with around 88% and 70.7% accuracy. Indeed, this is due to the similarity between activities within the dataset. For instance, listening to music and playing a game are related activities. Likewise, preparing breakfast and preparing lunch are related. Since the related activities contain the same major actions (events), the distinction between them is very difficult to be made.
Throughout this experiment, we noticed that the increased recognition error for one activity is complemented by the decreased error for another related activity. This tradeoff is controlled by the choices of the most important temporal relations between events. Thus, if closely related activities are merged into one activity, the recoginition accuracy can be significantly improved. For example, by combining preparing breakfast and preparing lunch into a single activity, preparing a meal, we can improve the recognition accuracy. The same can be done by combining listening to music and playing a game into a single activity, entertainment.
Table 5 and
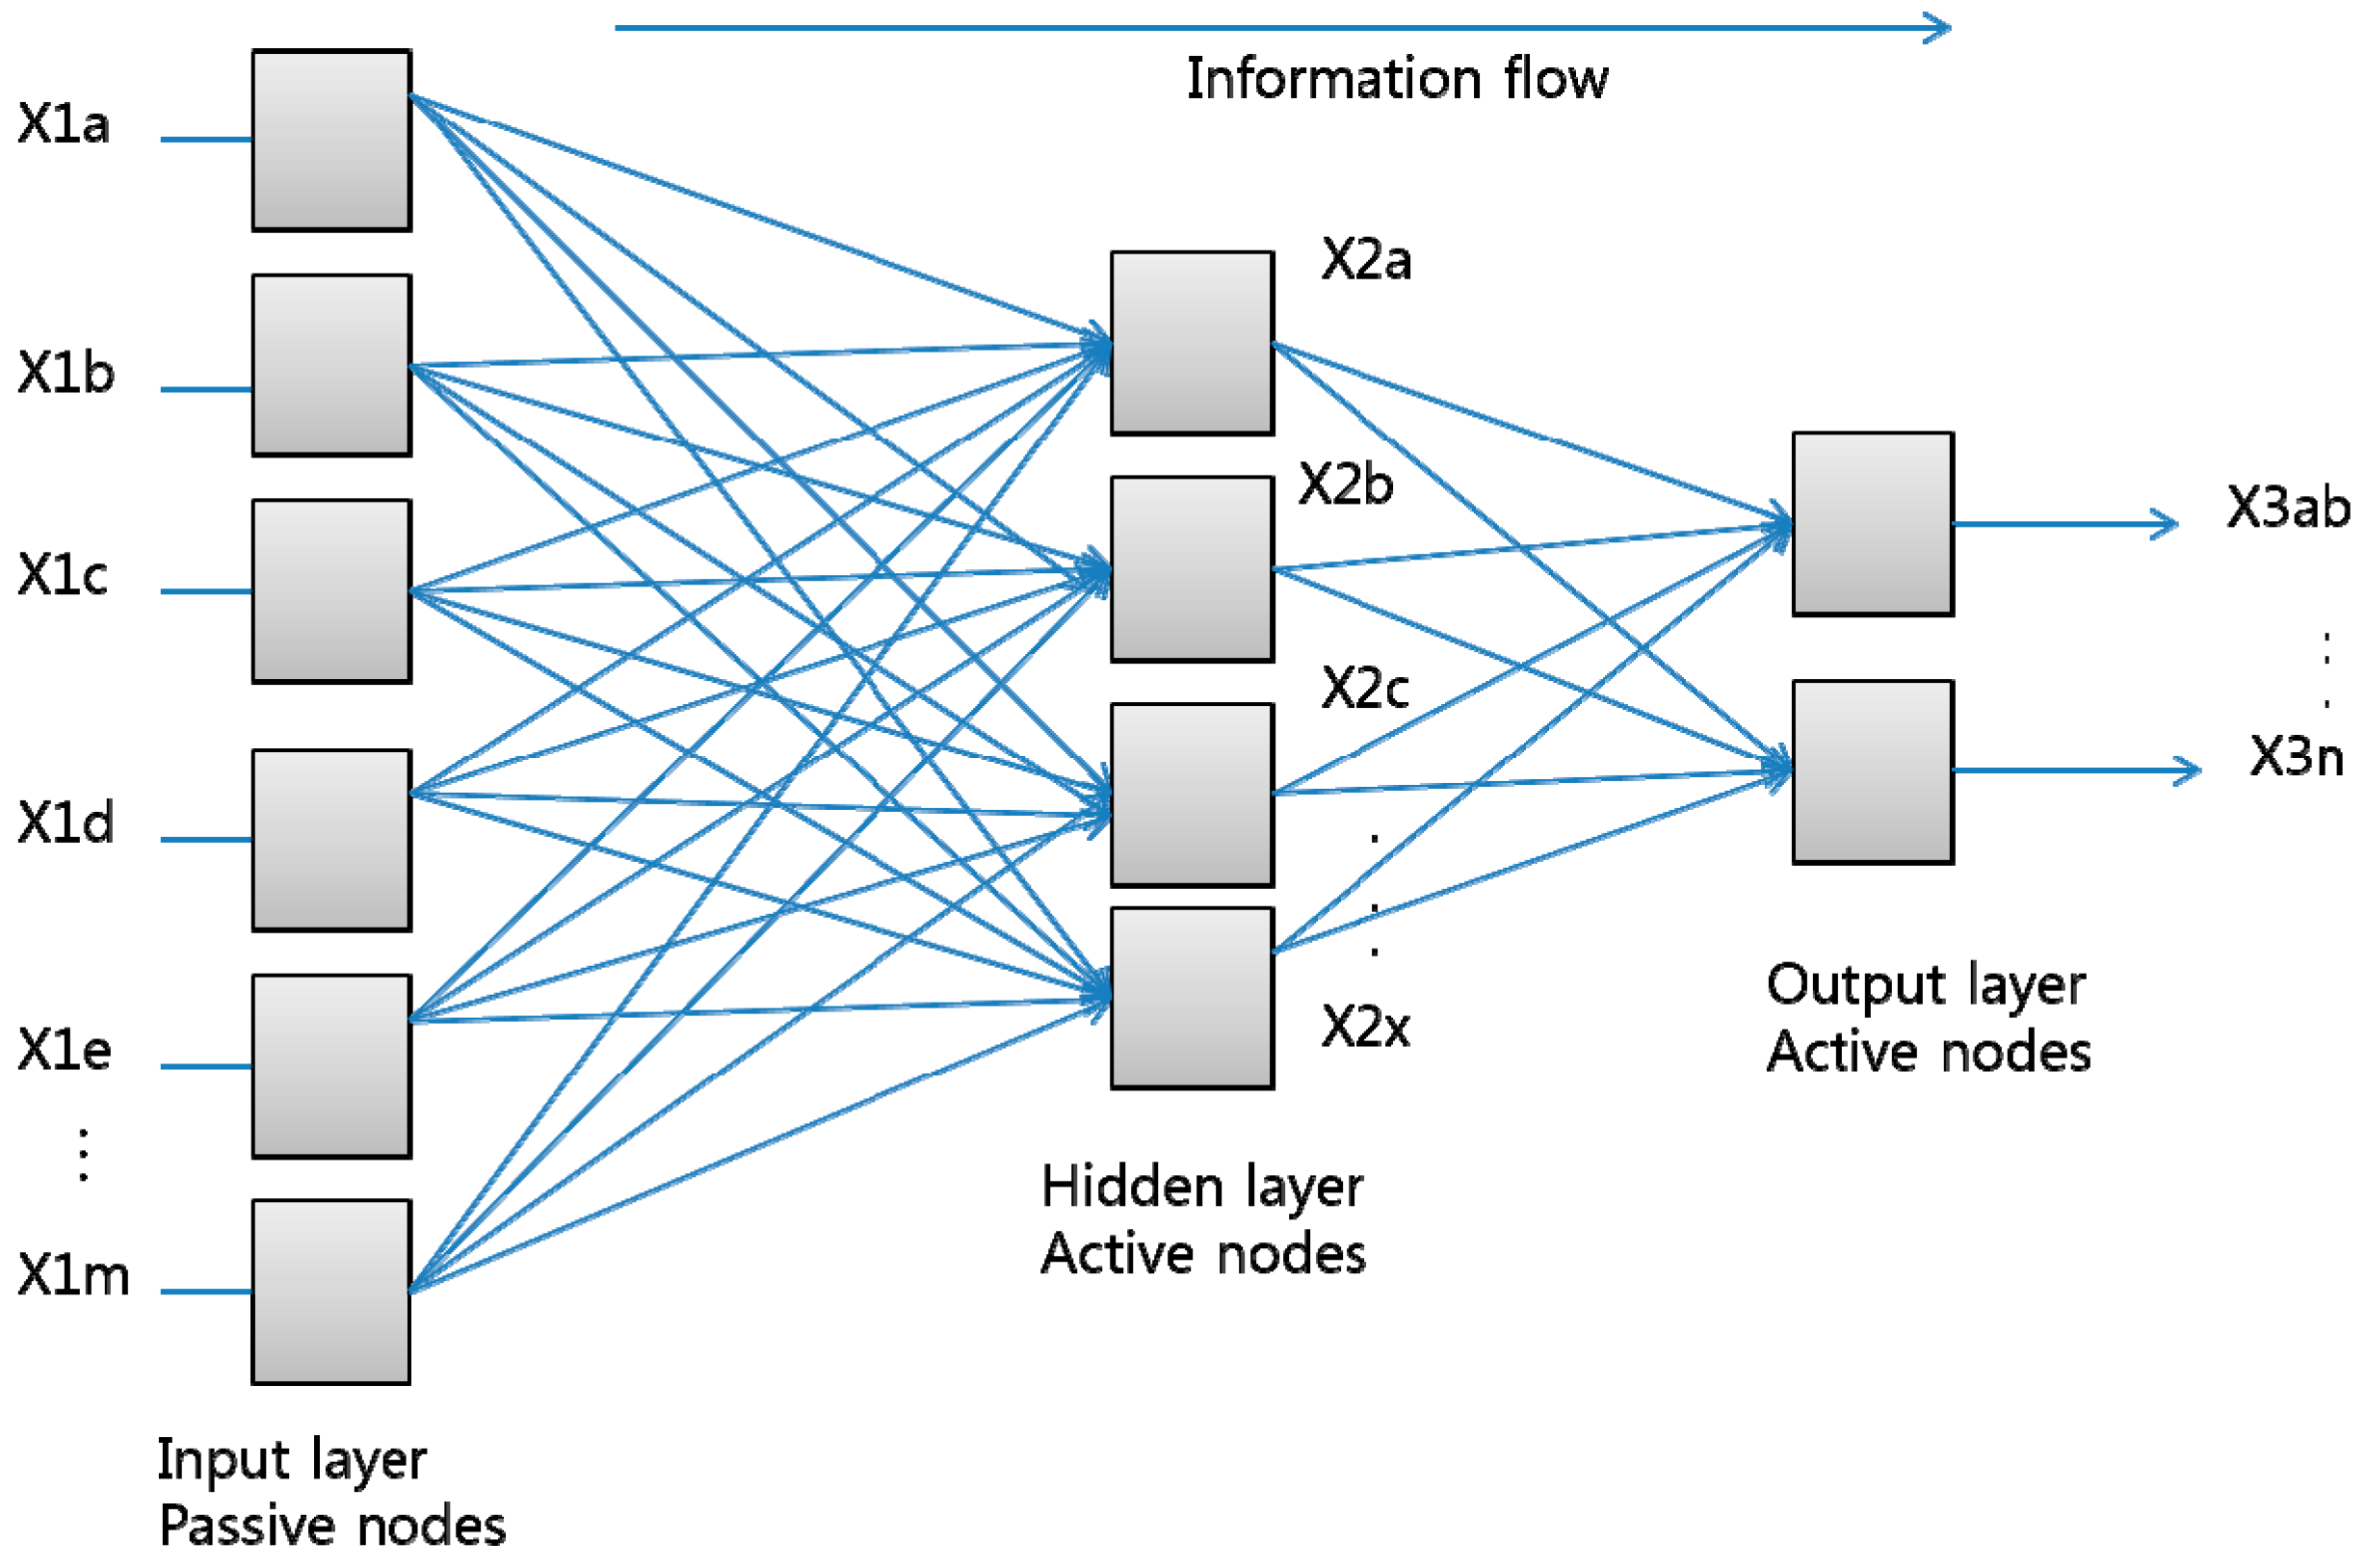
Table 6 show that most algorithms in our study have a good performance in recognizing user activities. The ANN algorithm yields the highest accuracy of about 79% for both datasets, while NB yields the lowest accuracy of around 74%. This ANN algorithm efficiency is due to its interconnecting artificial neurons which provide a general and robust method to learn a target function from input examples. Moreover, since the ANN algorithm is also applied to problems with dynamic or non-linear relationships, it can capture many kinds of relationships that may be difficult to be modeled by other classification techniques. As seen in
Figure 9, the Multilayer-Perception learning method is chosen to recognize activities.
Finally, the J48 decision tree feature selection method was added to improve the average accuracy of all algorithms.
Table 7 shows that the J48 decision tree can improve the average accuracy of all the algorithms. Especially for ANN, on average, an improvement of 7% can be made.
Table 7.
Comparison of average accuracy.
Table 7.
Comparison of average accuracy.
| | Comparison of Average Accuracy |
|---|
| Algorithms | 1 Week Dataset | 2 Weeks Dataset |
|---|
| wo/J48 | w/J48 Tree | wo/J48 | w/J48 Tree |
|---|
| ANN | 0.79 | 0.88 | 0.78 | 0.83 |
| NB | 0.74 | 0.77 | 0.73 | 0.79 |
| HMM | 0.75 | 0.82 | 0.74 | 0.78 |
4.2. Comparison of the Runtime
The runtime was evaluated for two purposes: First, the comparison between the three algorithms, ANN, NB, and HMM; Second, to see how much the runtime can be reduced by using the J48 decision tree feature selection method.
Table 8 gives the runtime of each algorithm in detail without and with the feature selection. The feature selection method was helpful to reduce the runtime for all the algorithms in common. Particularly, the runtime of ANN was reduced to just about 8% as compared to the result without the feature selection method. Despite the improvement by the J48 decision tree, the runtime of ANN is still longer than the other algorithms. However, we argue that this can be complemented by the better performance in terms of the activity recognition accuracy.
Table 8.
Comparison of runtime.
Table 8.
Comparison of runtime.
| | Runtime (s) |
|---|
| Algorithms | 1 Week Dataset | 2 Weeks Dataset |
|---|
| wo/J48 | w/J48 tree | wo/J48 | w/J48 tree |
|---|
| ANN | 50.12 | 3.99 | 316.80 | 25.15 |
| NB | 0.31 | 0.32 | 0.10 | 0.03 |
| HMM | 0.35 | 0.56 | 1.14 | 0.89 |
5. Conclusions and Future Work
In this paper, we discussed the possibility of recognizing and predicting user activities in IoT based smart environments. Due to the complexity and variety of user activities, we proposed a hybrid approach consisting of the K-pattern clustering and neural network algorithm based on temporal relations. The K-pattern clustering demonstrated its efficiency to group and identify the user activity model. Additionally, the K-pattern clustering is more suitable than others for detecting a discontinuous and interleaved activity pattern.
In the mean time, we suggested an approach for user activity recognition and prediction based on the artificial neural networks, which provided good results in general. However, we also need to resolve some unsatisfactory results caused by the similarity between related activities. The recent adoption of a feature selection approach based on the J48 decision tree significantly improved the recognition accuracy and runtime performance.
After all, our hybrid method of K-pattern and ANN is more accurate, extensible, and adaptable in a dynamic environment such as an IoT network and is useful for smart home applications. In our future research, we will improve the activity recognition accuracy with the presence of more sensitive sensors to collect more useful information in the smart home environment. Moreover, the application of more efficient feature selection approaches to a classification method to overcome redundancy and irrelevant attributes is desirable.


