Communication

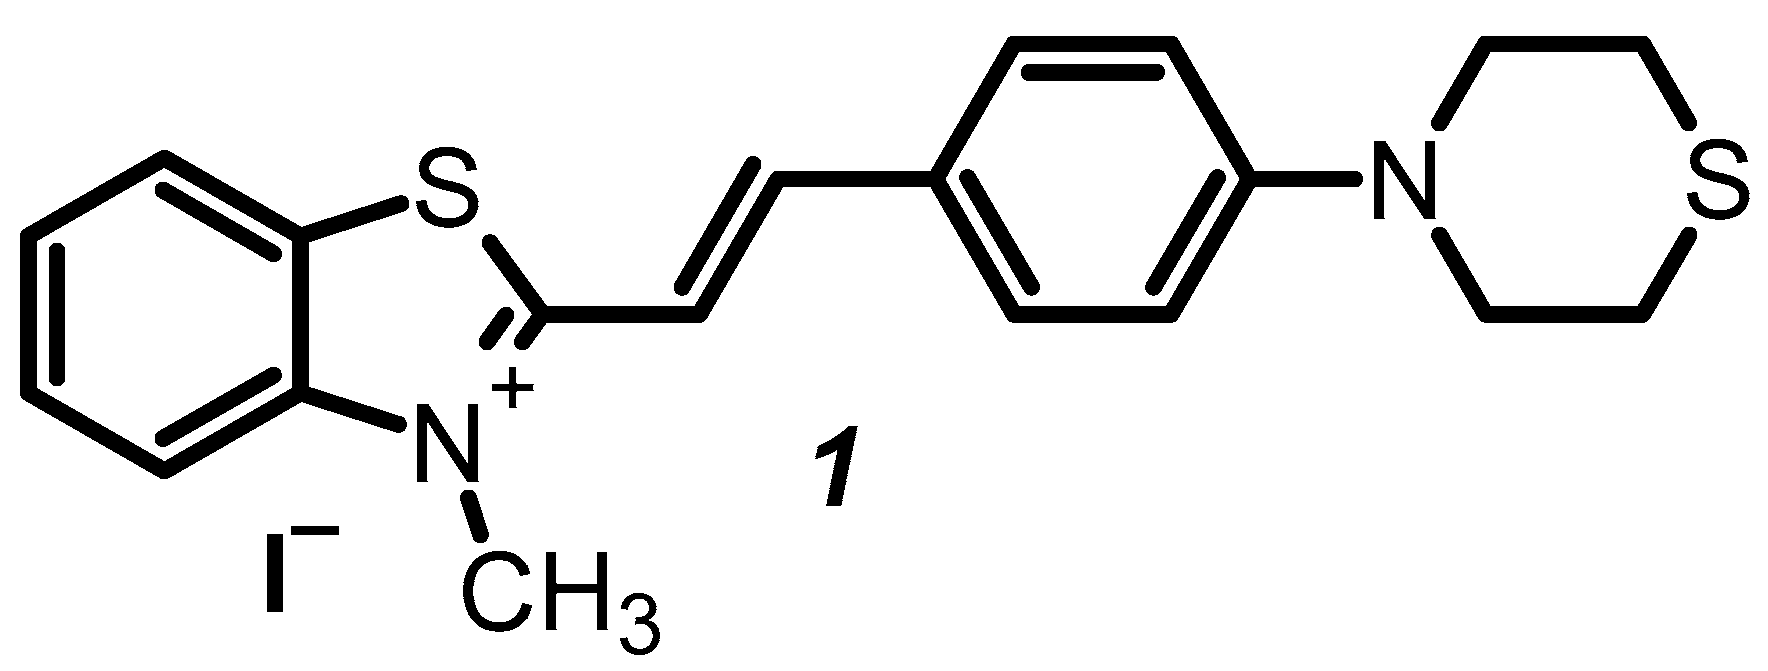
(E)-3-Heptyl-2-(4-thiomorpholinostyryl)benzo[d]thiazol-3-ium Iodide as Solvatochromic and Fluorogenic Dye for Spectroscopy Applications

by
Aleksey A. Vasilev
1,2,*,
Meglena I. Kandinska
1,
Anton Kostadinov
3,
Laura Dietz
3 and
Stanislav Baluschev
3,4
1
Faculty of Chemistry and Pharmacy, Sofia University “St. Kliment Ohridski”, 1 James Bourchier Blvd., 1164 Sofia, Bulgaria
2
Institute of Polymers, Bulgarian Academy of Sciences, Akad. G. Bonchev St., bl 103A, 1113 Sofia, Bulgaria
3
Max Planck Institute for Polymer Research, Ackermannweg 10, 55128 Mainz, Germany
4
Faculty of Physics, Sofia University “St. Kliment Ohridski”, 5 James Bourchier Blvd., 1164 Sofia, Bulgaria
*
Author to whom correspondence should be addressed.
Molbank 2023, 2023(3), M1727; https://doi.org/10.3390/M1727
Submission received: 30 June 2023 / Revised: 12 September 2023 / Accepted: 15 September 2023 / Published: 18 September 2023
(This article belongs to the Section Organic Synthesis)

Abstract

:
The development of new selective fluorogenic probes for monitoring microbiological objects and cellular compartments may help to determine the mechanism of pathogenesis of new pathogens in living cells. The easy and reliable synthetic strategy for the direct preparation of chemically pure styryl dye (E)-3-heptyl-2-(4-thiomorpholinostyryl)benzo[d]thiazol-3-ium iodide is described. The photophysical properties in different solvents and in water medium neat and in the presence of the dsDNA and RNA of the dye is demonstrated and compared with that of the known structure analogue. The cellular uptake and the ability to bind cell organelles is determined. The introduction of a heptyl substituent attached to the quaternary nitrogen atom of the benzothiazole ring leads to an improvement in the photophysical properties of the dye.

1. Introduction

The outbreaks of viral infections over the past 50 years have been a major incentive for the scientific community not to underestimate these pathogens. The development of new selective fluorogenic probes for monitoring cellular components of healthy and infected cells may help to determine the mechanism of the pathogenesis of new pathogens in living cells. In addition, the fluorogenic dyes are among the most important components of the PCR kits for pathogen detection and recognition. In this regard, solvatochromic and halochromic dyes are a desirable component of the modern PCR kits. The “light-on” fluorescent probes can be used as substrates for testing new pharmacophores and tracing their cellular uptake and their function in the living systems in the absence and in the presence of the target pathogens, as well. As imaging agents, cyanine dyes demonstrate a pronounced spectroscopic response upon specific biopolymer binding, and at the same time, they show a therapeutic effect after cell entering. Therefore, they are among the most active theragnostic agents [1,2]. The structure–function relationship was often explored by developing different analogues varying substituents on cyanine aromatic units that influenced the dyes’ affinity to specific polynucleotide binding and respectively demonstrate the different spectroscopic response and biological activity [3]. Cyanines usually show no intrinsic fluorescence in water solutions, while their fluorescence significantly increases upon polynucleotide binding, which makes them the perfect fluorescent probes for DNA/RNA [3,4,5] visualization and analysis. For more than sixty years, the main application of the styryl cyanine dyes, a large subgroup in the cyanine class, was mainly as sensitizers in photographic emulsions until the systematic work conducted by Yarmoluk and co-workers [6] who demonstrated the ability of the styryl cyanine dyes to bind different nucleic acids (NA) as intercalators or mainly as groove binders [7,8,9]. The investigated styryl dyes demonstrated an increase in their fluorescence in a presence of nucleic acids several times. Meantime, Li and Chang published protocols for the preparation of novel styryl dyes and their RNA binding and live cell staining [10]. Shortly thereafter, Lu et al. described [11] the synthesis and the photophysical properties of a new RNA-selective fluorescent dye integrated with a thiazole orange and a p-(methylthio)styryl moiety. The authors proved that the new heterocyclic sulfur containing styryl dye had better nucleolus RNA staining and imaging performance in living cells than the commercial stains [11]. It also exhibits excellent photostability, cell tolerance, and counterstain compatibility with 4′,6-diamidino-2-phenylindole for specific RNA-DNA colocalization in bioassays [11].
We recently reported a new styryl dye 1 (Figure 1), a thiomorpholine derivative [12], which demonstrates excellent properties as a dye for visualizing cell organelles. Specifically, the dye is nontoxic to the cells under study, as it permeates the cell and nuclear membranes and accumulates in the nuclei of living cells. Dye 1 shows a significant increase in its fluorescence after DNA binding [12]. The above-described interesting and useful research has stimulated our search for new fluorogenic biolabeling reagents for nucleic acid and living cell visualization.
In this regard, the aim of the present report is to describe the synthesis of the novel styryl dye 2 (Scheme 1) combining N-heptylbenzothiazolium and phenylthiomorpholine scaffolds and to check its photophysical properties in the absence and in the presence of DNA and RNA. A comparison between the photophysical behavior of dye 2 with the less hydrophobic dye previously described by our lab analogue (dye 1 (Figure 1)) [12] was performed as well.

2. Results and Discussion
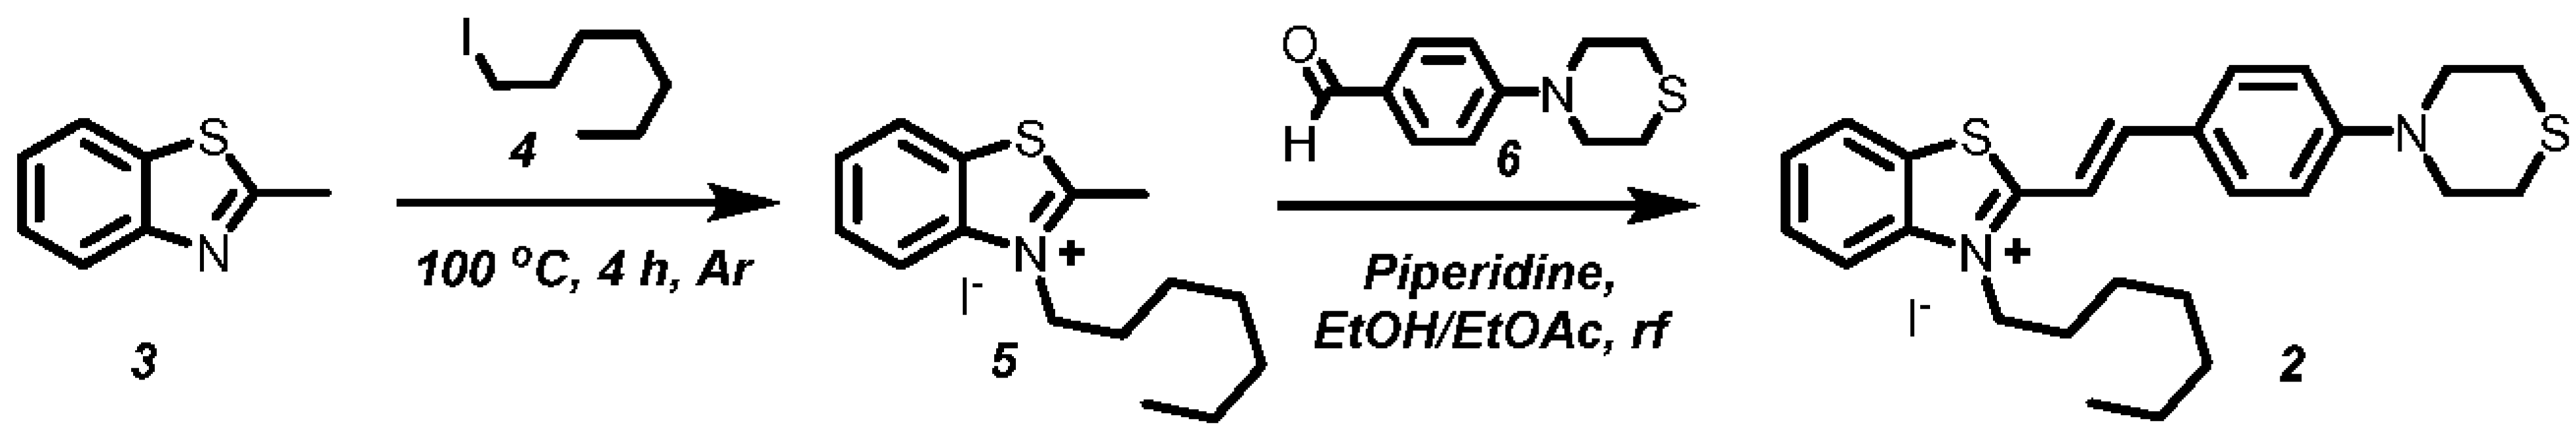
2.1. Synthesis

(E)-3-heptyl-2-(4-thiomorpholinostyryl)benzo[d]thiazol-3-ium iodide (2) was synthesized (Scheme 1), similar to its already reported analogue (E)-3-Methyl-2-(4-thiomorpholinostyryl)benzo[d]thiazol-3-ium iodide (1) [12]. The quaternization of 2-methylbenzo[d]thiazole (3) with 1-iodoheptane (4) was performed without solvent in a sealed tube under an inert atmosphere. The quaternized 2-methylbenzo[d]thiazole 5 was obtained in high yield—91%, without evidence of side reactions or byproduct formation. In comparison, 2-methylbenzo[d]thiazole (3) was quaternized with 1-bromoheptane [13,14] or with 1-iodoalkanes [15] under reflux in dry acetonitrile for a prolonged time—24 h [13] or one week [14] with yields of the quaternary salt of 10% [13] and 44% [15], respectively. The reported tendency of decreasing yields of the quaternized products with the increasing alkylating agent carbon chain length when the reaction was carried out in acetonitrile was not observed in our cases [12].
Refluxing the 2-methylbenzo[d]thiazolium salt 5 and functionalized benzaldehyde 6 [12] in an ethanol–ethyl-acetate mixture and piperidine as a base resulted in the target styryl dye 2, which was isolated directly from the reaction mixture as purple needles in high yield and purity. Applying the same conditions of condensation between the N-alkylated 2-methylbenzo[d]thiazolium salt 5 and aldehyde 6 as the reported for 1 [12] in this case also did not require further purification of the dye obtained (Scheme 1).

2.2. Photophysical Properties of Dye 2 Compared to Dye 1

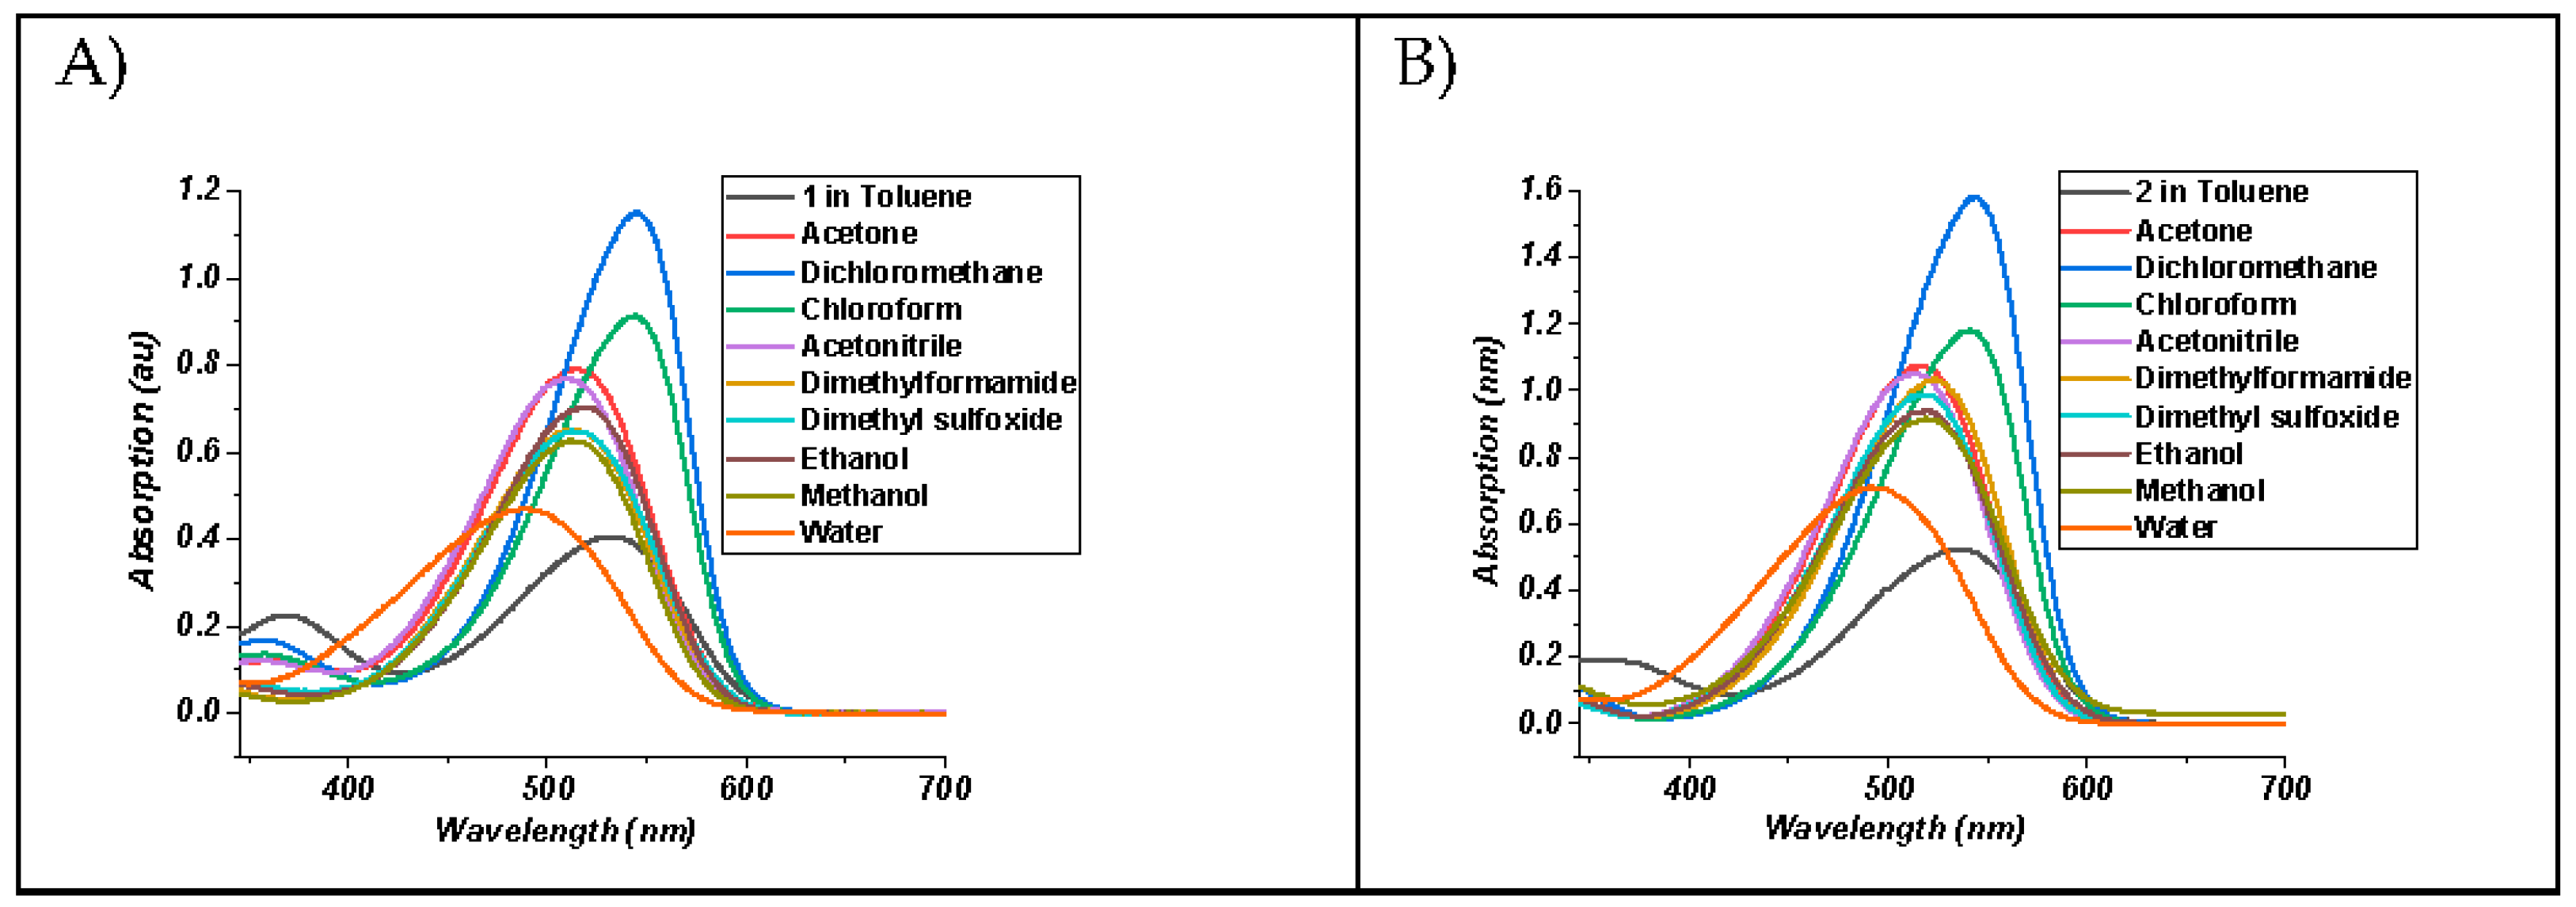
2.2.1. Comparison of the Dye 1 and Dye 2 Spectral Behavior in Solvents with Different Polarity

The UV-VIS absorption of the dyes was measured in solvents with different polarity (Figure 2). Both dyes demonstrated pronounced horizontal and vertical solvatochromism. As expected, the more hydrophobic of the two dyes (dye 2) demonstrated higher molar absorptivity in most of the solvents used compared to analogue 1.
The absorption maxima of dyes 1 and 2 in solvents with increasing polarity demonstrated a negative solvatochromic behavior. Therefore, in the excited state, the dipole moments of the solute decreased during the electronic transition. Herein, the empirical solvent polarity parameter, ET, was calculated for each dye in different solvents, according to Equation (1) [16,17,18,19].
E T = h c N A = 2.8591 = 28591 / λ
where ET is the empirical solvent polarity parameter defined as the molar electronic transition energy of the dissolved dye measured in (kcal·mol−1), h is the Planck’s constant, and is the wave number.
Table 1 exhibits the correlation of the ET of dyes 1 and 2 with MeQMBr2, the analogue of the Brooker’s Merocyanine (BM) (Figure 3) [20,21,22,23], and the εr of the solvents investigated.
Similar to the BM analogue MeQMBr2 the ET values for the new dyes 1, 2 increased with the increasing dielectric constant (Table 1). This suggests that an enhanced stability of the excited states of dyes 1, 2 in nonpolar solvents as compared to polar ones is achieved. Additionally, the better stabilization of the excited states relative to the ground states with decreasing solvent polarity results in a hypsochromic shift. This is typical for the styryl dyes’ negative solvatochromism. From the data in Table 1, a trend of increasing the molar absorptivity in all solvents can be seen for the heptyl-substituted dye (dye 2) compared to the methyl derivative 1.

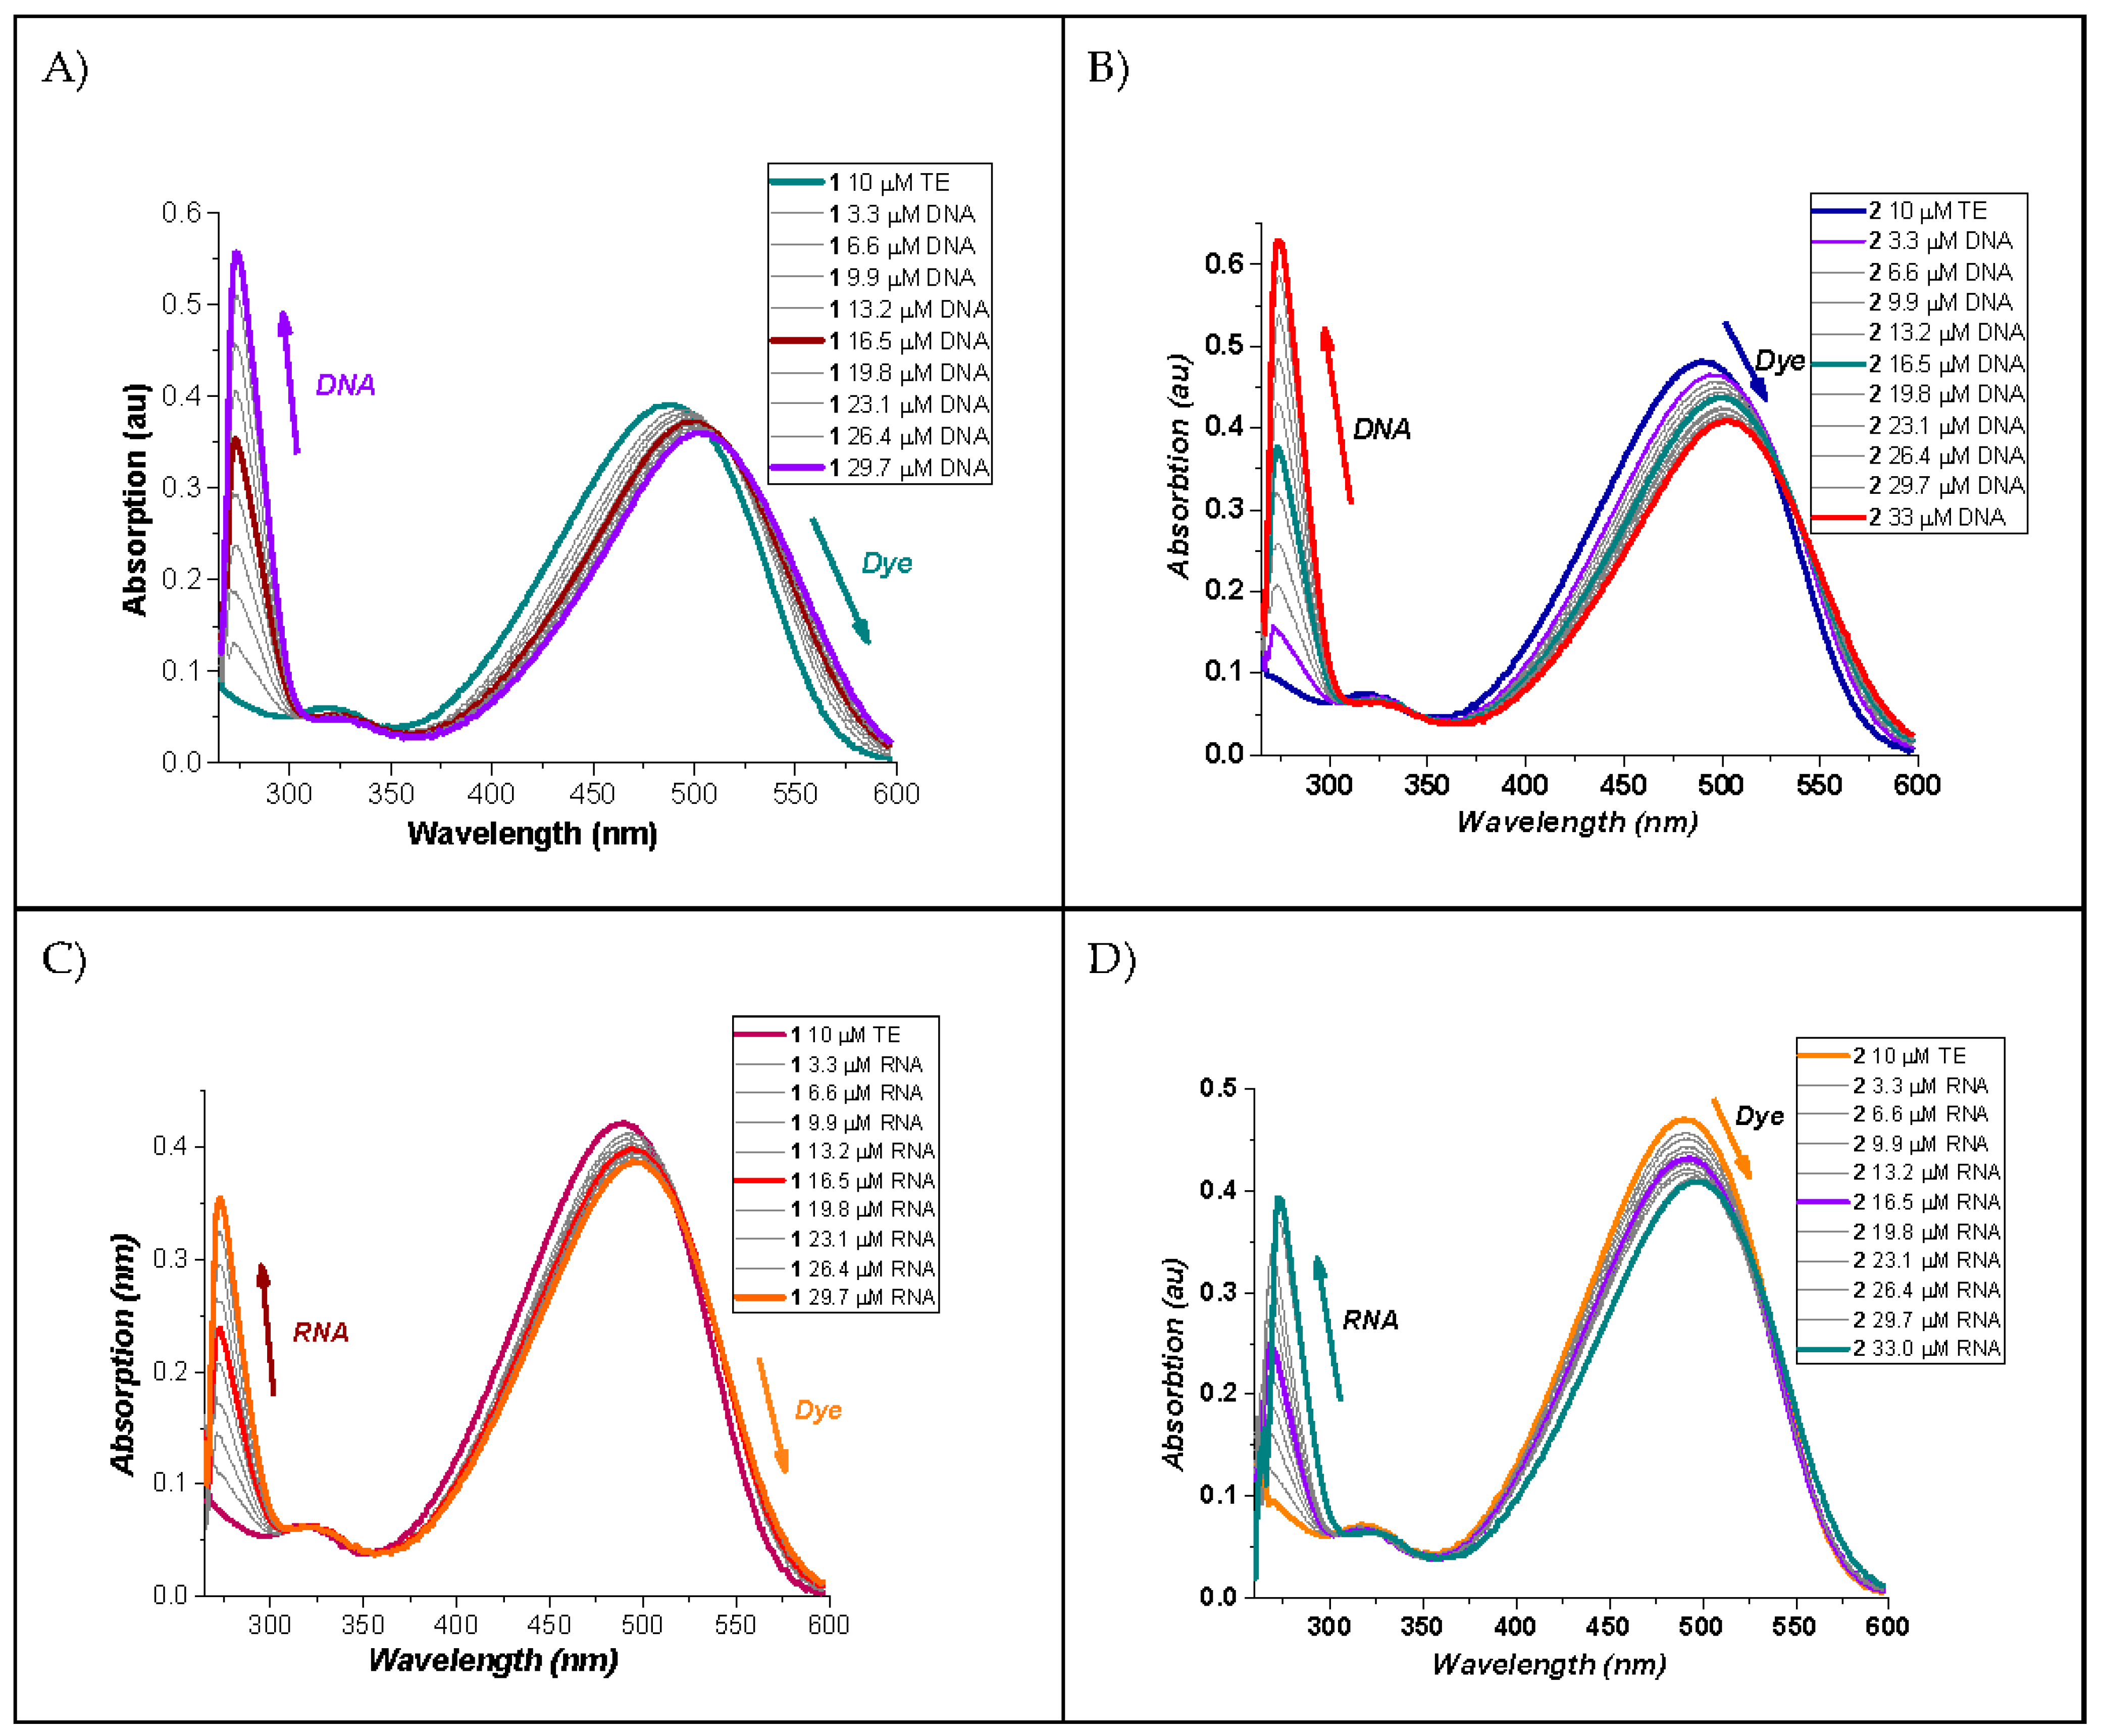
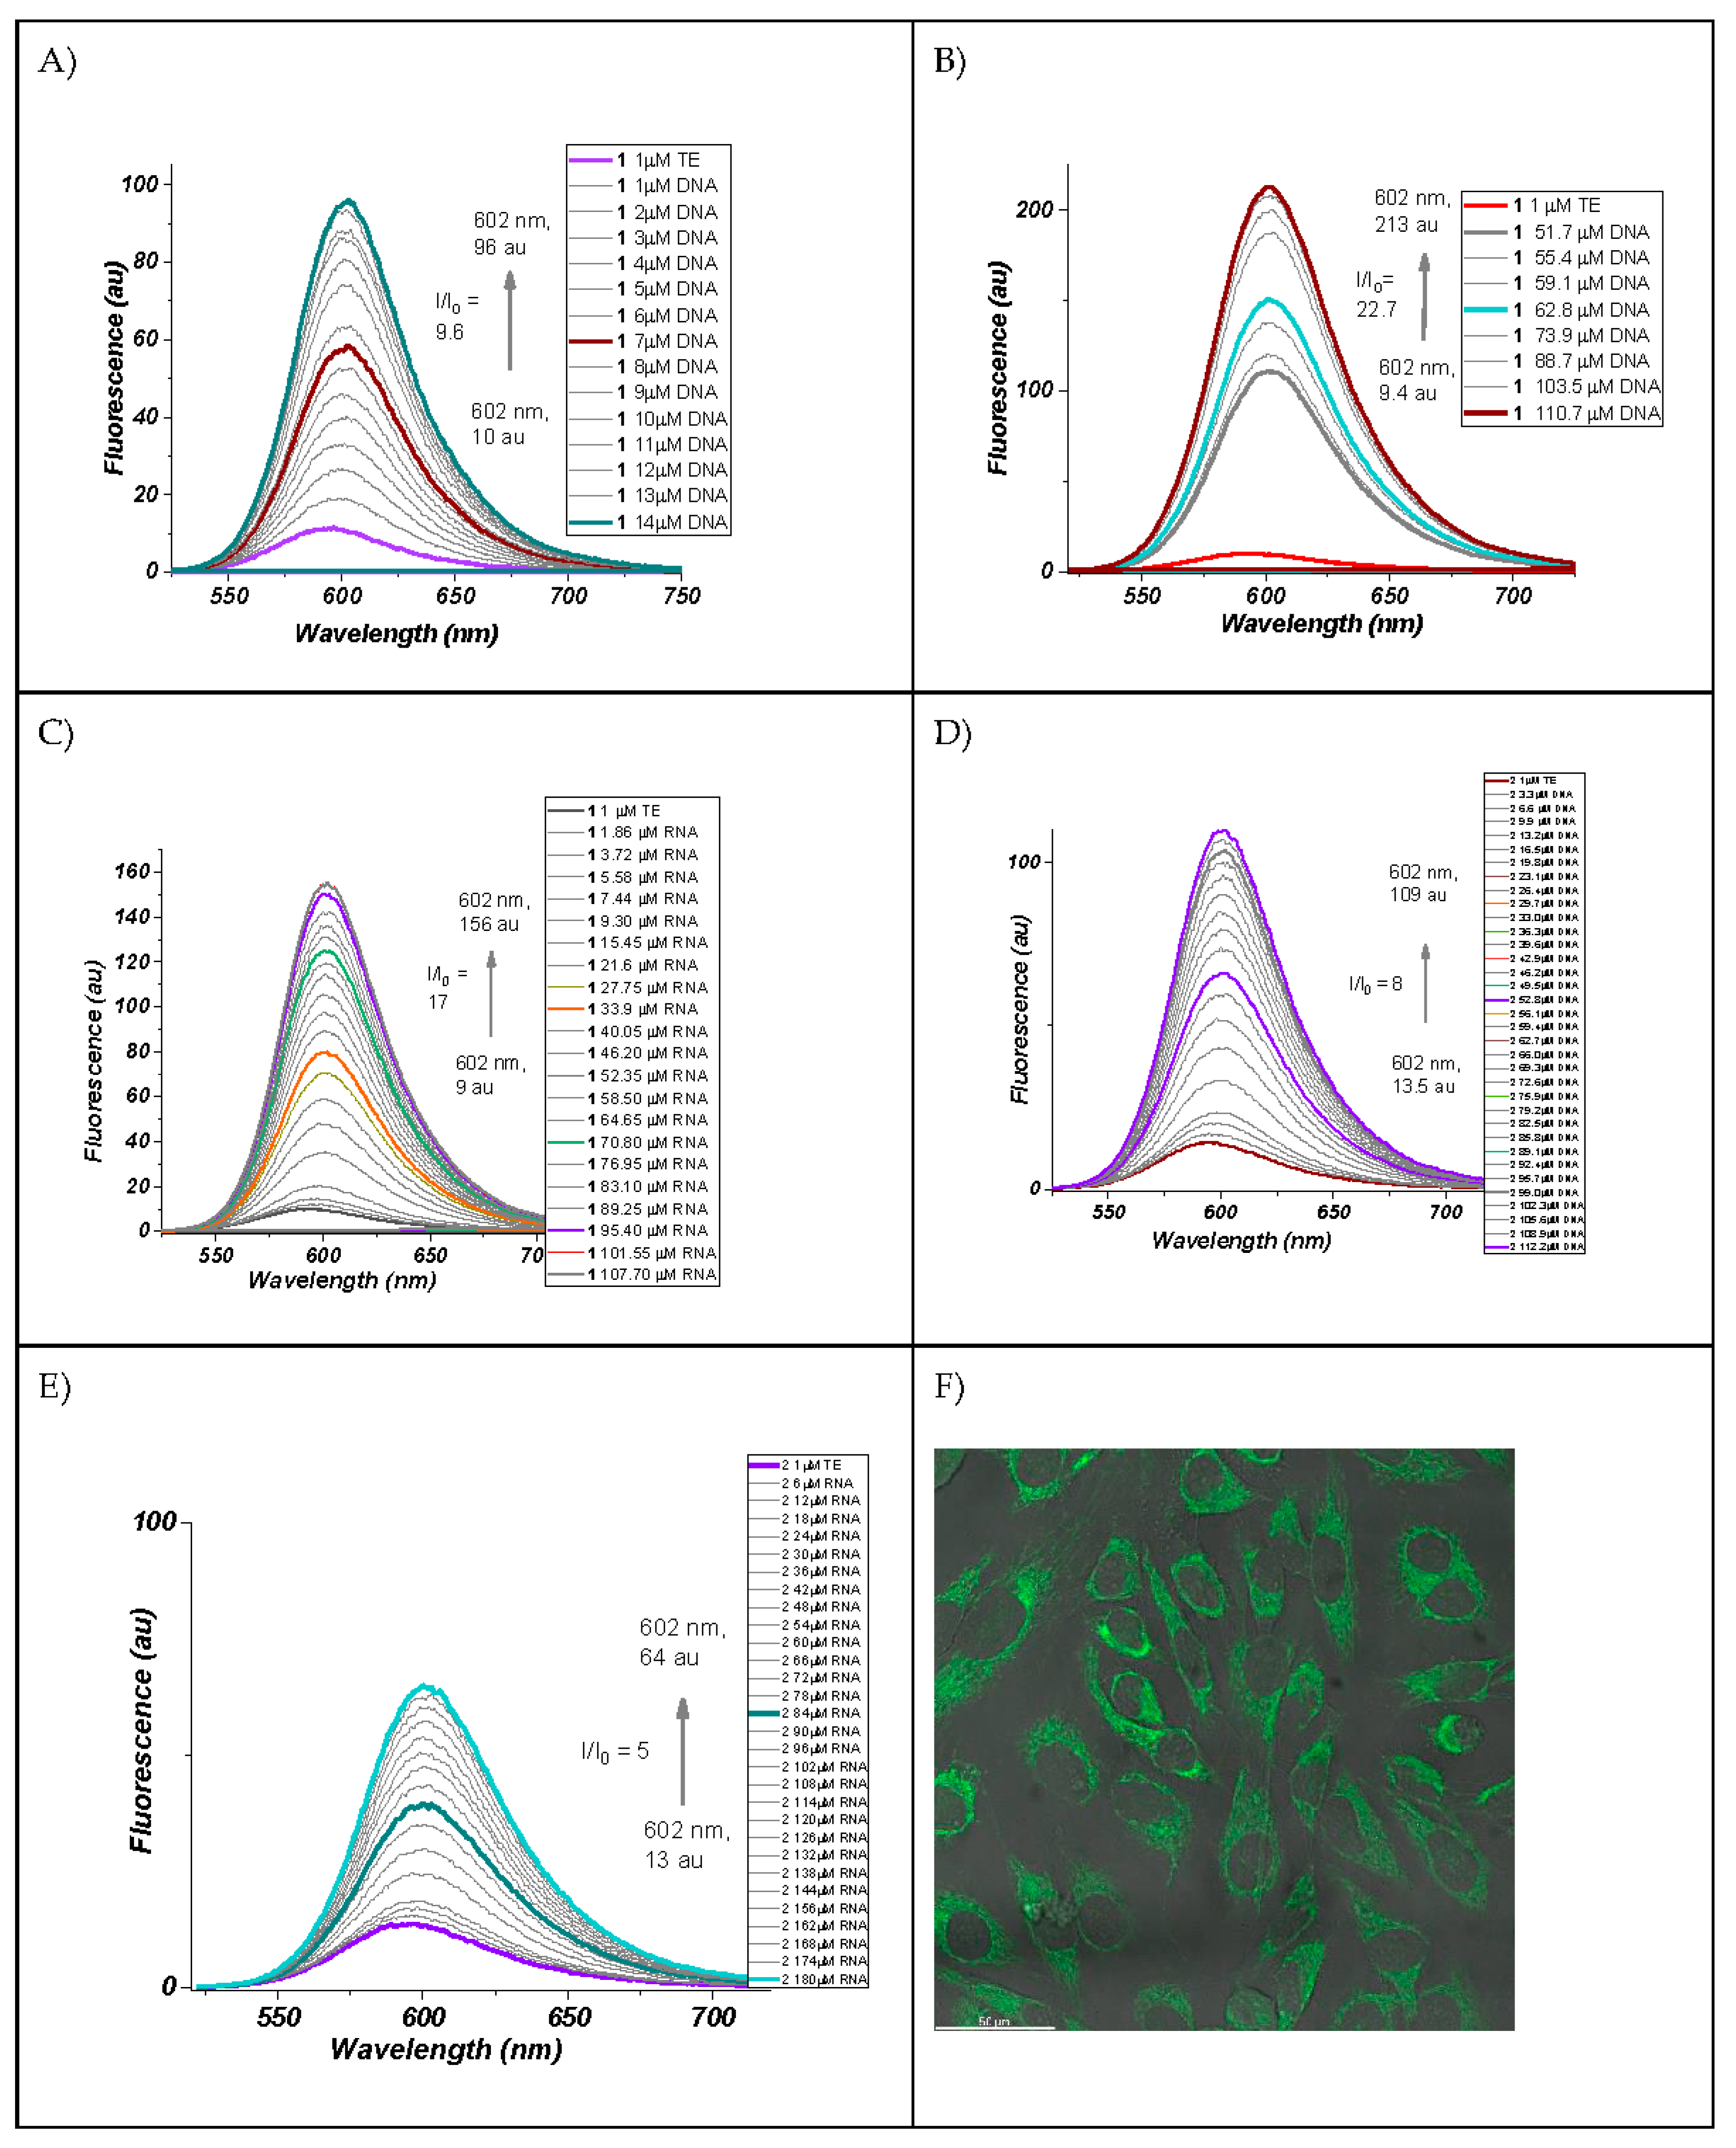
2.2.2. Comparison of the Spectral Behavior of Dye 1 and Dye 2 in the Absence and in the Presence of dsDNA or RNA

We already reported the promising photophysical properties of dye 1 and proved that it is suitable for cell nucleoli visualization [12]. We detected low intrinsic fluorescence of 1 in TE buffer and a significant increase in its fluorescence in the presence of dsDNA [12] (Figure 4). This provoked our interest in investigating its photophysical properties also with respect to RNA, as well as to compare its spectral characteristics with these of its analogue—dye 2, containing a longer alkyl chain and a more hydrophobic counterpart. In order to clarify the NA-labelling potential of fluorogenic dyes 1 and 2, we investigated their photophysical properties in aqueous buffer solutions and in the presence of DNA and RNA.
It is clear from Figure 4 that upon titration with dsDNA or RNA, with an increase in NA concentration, the maxima of the longest wavelength absorption bands changed uniformly bathochromically and hypochromically. The presence of isosbestic points is a clear indication of an established complex between the dyes investigated and the corresponding nucleic acid. According to the demonstrated change in the absorption spectra depending on the concentration of the nucleic acids, we can suppose that the indicated interaction between the dyes and NA is due to the intercalation of dye 1 in double-stranded sections of the NA macromolecules (DNA and RNA) and to partial intercalation combined with groove binding in the case of dye 2. More comprehensive information about the dyes–NA interactions can be obtained from the fluorescence spectra of the dye molecules (Figure 5).
It can be seen that dye 1 increases its fluorescence dramatically not only in the presence of dsDNA (Figure 5A,B), as we already reported [12], but also in the presence of RNA (Figure 5C), probably because of its affinity to the presumably double-stranded regions of RNA. In the case of dye 2, the interaction of the benzo[d]thiazole fragment of the chromophore is definitely hindered by the bulky heptyl residue, which prevents its intercalation, and this, in turn, is expressed in an almost 50% lower fluorescence intensity at comparable concentrations of the dye and the corresponding nucleic acids (Figure 5D,E). Nevertheless, dye 2 is valuable with its fast cellular uptake and its potential as a cell compartments binder (Figure 5F).

3. Materials and Methods

3.1. General

2-Methylbenzo[d]thiazole (3), 1-iodoheptane (4), 4-fluorobenzaldehyde, thiomorpholine, piperidine, and the solvents used are commercially available and were used as supplied. 4-Thiomorpholinobenzaldehyde (6) was synthesized following the procedure, previously published in the literature [12,24]. The course of the reactions was monitored by thin layer chromatography (TLC) ALUGRAM® SIL G/UV 254-60 Macherey-Nagel, ready-to-use plates with thickness of the silica layer at 0.2 mm. NMR spectra (1H-, 13C-DEPT-NMR) were obtained on a Bruker AVIII 300 NMR spectrometer in DMSO-d6 as a solvent (performed at the Max Plank Institute of Polymer Research, Mainz, Germany), (Supplementary Materials). The chemical shifts are given in ppm (δ) using tetramethylsilane (TMS) as an internal standard. The mass spectra of dye 2 was obtained on an Advion expression CMS mass spectrometer in a “High temperature and low fragmentation” regime and analyzed by using Advion CheMS Express software version 5.1.0.2 (performed in the Max Plank Institute of Polymer Research, Mainz, Germany). UV-VIS spectra were measured on an Evolution 350 (Thermo Scientific) UV–VIS spectrophotometer with a concentration of dye 2 C = 1 × 10⁻⁵ M, and the fluorescence spectra were obtained on a Cary Eclipse (Agilent) fluorescence spectrophotometer with slits 5 and a conc. of dye 2 C = 1 × 10⁻⁶ M in quartz cuvettes and in TE buffer (10 mM TRIS, 1 mM EDTA, pH 8) (in the Institute of Polymers, Bulgarian Academy of Sciences, Sofia, Bulgaria). The nucleic acids used are the salmon sperm dsDNA (CAS 68938-01-2) and baker’s yeast RNA (CAS 63231-63-0), which were purchased from Merck (Sigma-Aldrich, city, (state), Country) and used as received. The dye investigated was slightly soluble in redistilled water and DMSO; therefore, fresh stock solutions (1 mM) were prepared in DMF and further diluted with TE-buffer. HeLa cells were cultured in RPMI 1640 medium supplemented with 10% FBS, 100 U mL−1 penicillin, 100 mg mL−1 streptomycin, and 2 mM Glutamax. Cells were grown in a humidified incubator at 37 °C and 5% CO2. For passaging of HeLa cells, 0.25% Trypsin-EDTA was used at 37 °C and 5% CO2 for 5 min before centrifugation at 300 g for 5 min (All reagents were purchased from Thermo Fisher Scientific, Waltham, MA, USA). For cLSM analysis, 5000 cells per well were seeded in IBIDI 18 well slides (IBIDI) and incubated with the dye. In order to visualize the intracellular structures, confocal laser scanning microscopy (cLSM) was employed. Experiments were conducted on the LSM SP5 STED Leica Laser Scanning Confocal Microscope (Leica, Germany situated in Max Plank Institute of Polymer Research, Mainz, Germany), composed of an inverse fluorescence microscope DMI 6000CS equipped with a multi-laser combination using an HC PL APO CS2 63.0 × 1.20 water objective. The cells were stained with 2 using the excitation laser 514 nm, detected at 539–750 nm. For the visualization of the intracellular structures, 5 × 10³ cells in 200 μL DMEM with 10% FBS were seeded in a well polymer coverslip bottom (IBIDI). After an overnight incubation at 37 °C and 5% CO2 in the incubator, cell staining was conducted shortly before the cLSM analysis for 10 to 25 min in the dark. The maximum fluorescence intensity was obtained after 10 min. The fluorescence intensity does not change prolonging the period.

3.2. Synthesis of (E)-3-heptyl-2-(4-thiomorpholinostyryl)benzo[d]thiazol-3-ium Iodide (2)

A mixture from 2-methylbenzo[d]thiazole (3, 1.5 g, 0.01 mol) and 1-iodoheptane (4, 2.8 mL, 0.15 mol) was stirred in a sealed tube at 100 °C and under Argon for 4 h. After the end of the reaction, the mixture was cooled down to room temperature and diluted with diethyl ether/acetone mixture (4:1). The resulting N-alkylated 2-methylbenzo[d]thiazolium salt 5 obtained as a crystal precipitate was filtered, washed with the same mixture of solvents, and dried. The crude quaternary product 5, was used in the next stage without additional purification. The structure of 3-heptyl-2-methylbenzo[d]thiazol-3-ium iodide (5) was confirmed based on the structural characterization data of the final dye 2. 3-Heptyl-2-methylbenzo[d]thiazol-3-ium iodide (5, 0.231 g, 0.46 mmol), 4-thiomorpholinobenzaldehyde (6, 0.109 g, 0.52 mmol), and piperidine (0.1 mL) were dissolved in 8 mL of ethanol/ethyl acetate mixture (3:1) and were refluxed for 4 h. After the completion of the reaction, the resulting precipitate from dye 2 was filtered off, washed with the same mixture of solvents, and dried. Yield of 2: 0.290 g (91%).
1H-NMR: 0.82 (t, 3H, CH3, 3JHH = 6.6 Hz,); 1.17–1.26 (m, 4H, CH2), 1.31–1.36 (m, 2H, CH2), 1.40–1.44 (m, 2H, CH2), 1.79–1.84 (m, 2H, CH2), 2.66–2.70 (m, 4H, CH2-Thiomorpholine), 3.89–3.92 (m, 4H, CH2-Thiomorpholine), 4.84 (t, 2H, N-CH2, 3JHH = 7.2 Hz,); 7.07 (d, 2H, CH-Ph, 3JHH = 9.0 Hz), 7.69 (d, 1H, CH-St, 3JHH = 15.0 Hz), 7.71 (t, 1H, CH-Ar, 3JHH = 7.5 Hz), 7.81 (t, 1H, CH-Ar, 3JHH = 7.2 Hz), 7.94 (d, 2H, CH-Ph, 3JHH = 8.7), 8.11 (1H, CH-St, 3JHH = 15.3 Hz), 8.17 (d, 1H, CH-Ar, 3JHH = 8.1 Hz), 8.34 (d, 1H, CH-Ar, 3JHH = 7.8 Hz).13C-DEPT: 13.88 CH3, 21.95 CH2, 25.14 2CH2, 25.68 CH2, 28.27 CH2, 28.48 CH2, 31.09 CH2, 48.06 CH2, 49.48 2CH2, 107.14 CH, 113.82 2CH, 116.12 CH, 124.05 CH, 127.65 CH, 129.06 CH, 132.94 2CH, 149.99 CH. ESI-MS: Calc.: Mw m/z = 338.09 for C19H18N2S2•+, Found m/z = 338.9.

Supplementary Materials

Figure S1: 1H-NMR of dye 2 in DMSO-d6.; Figure S2: 13C-DEPT-135 spectra of dye 2 in DMSO-d6; Figure S3: ESI-MS spectra of dye 2.

Author Contributions

Conceptualization, A.A.V.; methodology, A.A.V., M.I.K. and S.B.; validation, A.A.V., M.I.K. and S.B.; formal analysis, A.A.V., M.I.K., A.K. and L.D.; investigation, A.A.V., M.I.K., A.K. and L.D.; writing—original draft preparation, A.A.V. and M.I.K.; funding acquisition, A.A.V., M.I.K. and S.B. All authors have read and agreed to the published version of the manuscript.

Funding

This work was supported by the Bulgarian National Science Fund (BNSF) and by the European UnionNextGenerationEU, through the National Recovery and Resilience Plan of the Republic of Bulgaria.

Data Availability Statement

Not applicable.

Acknowledgments

This work was supported by the Bulgarian National Science Fund (BNSF) project RNAVision (KP-06-DK1/4) from 29.03.2021“RNAVision” and by the European UnionNextGenerationEU, through the National Recovery and Resilience Plan of the Republic of Bulgaria, project № BG-RRP-2.004-0008-C01.

Conflicts of Interest

The authors declare no conflict of interest.

References

  1. Komljenovic, D.; Wiessler, M.; Waldeck, W.; Ehemann, V.; Pipkorn, R.; Schrenk, H.-H.; Debus, J.; Braun, K. NIR-Cyanine Dye Linker: A Promising Candidate for Isochronic Fluorescence Imaging in Molecular Cancer Diagnostics and Therapy Monitoring. Theranostics 2016, 6, 131–141. [Google Scholar] [CrossRef]
  2. Li, Y.; Zhou, Y.; Yue, X.; Dai, Z. Cyanine conjugates in cancer theranostics. Bioact. Mater. 2021, 6, 794–809. [Google Scholar] [CrossRef] [PubMed]
  3. Armitage, B.A. Cyanine Dye–DNA Interactions: Intercalation, Groove Binding, and Aggregation. In DNA Binders and Related Subjects; Waring, M.J., Chaires, J.B., Eds.; Springer: Berlin/Heidelberg, Germany, 2005; pp. 55–76. [Google Scholar]
  4. Glazer, A.N.; Rye, H.S. Stable dye–DNA intercalation complexes as reagents for high-sensitivity fluorescence detection. Nature 1992, 359, 859–861. [Google Scholar] [CrossRef]
  5. Rye, H.S.; Yue, S.; Wemmer, D.E.; Quesada, M.A.; Haugland, R.P.; Mathies, R.A.; Glazer, A.N. Stable fluorescent complexes of double-stranded DNA with bis-intercalating asymmetric cyanine dyes: Properties and applications. Nucleic Acids Res. 1992, 20, 2803–2812. [Google Scholar] [CrossRef]
  6. Glavaš-Obrovac, L.; Piantanida, I.; Marczi, S.; Mašić, L.; Timcheva, I.I.; Deligeorgiev, T.G. Minor structural differences of monomethine cyanine derivatives yield strong variation in their interactions with DNA, RNA as well as on their in vitro antiproliferative activity. Bioorg. Med. Chem. 2009, 17, 4747–4755. [Google Scholar] [CrossRef]
  7. Tumir, L.M.; Crnolatac, I.; Deligeorgiev, T.; Vasilev, A.; Kaloyanova, S.; Branilovic, M.G.; Tomic, S.; Piantanida, I. Kinetic Differentiation between Homo- and Alternating AT DNA by Sterically Restricted Phosphonium Dyes. Chem. Eur. J. 2012, 18, 3859–3864. [Google Scholar] [CrossRef]
  8. Rožman, A.; Crnolatac, I.; Deligeorgiev, T.; Piantanida, I. Strong impact of chloro substituent on TOTO and YOYO ds-DNA/RNA sensing. J. Lumin. 2019, 205, 87–96. [Google Scholar] [CrossRef]
  9. Vasilev, A.; Lesev, N.; Dimitrova, S.; Nedelcheva-Veleva, M.; Stoynov, S.; Angelova, S. Bright fluorescent dsDNA probes: Novel polycationic asymmetric monomethine cyanine dyes based on thiazolopyridine-quinolinium chromophore. Color. Techn. 2015, 131, 94–103. [Google Scholar] [CrossRef]
  10. Deligeorgiev, T.; Gadjev, N.; Vasilev, A.; Drexhage, K.-H.; Yarmoluk, S.M. Synthesis of novel monomeric and homodimeric cyanine dyes with thioacetyl substituents for nucleic acid detection. Dyes Pigm. 2007, 72, 28–32. [Google Scholar] [CrossRef]
  11. Deligeorgiev, T.; Vasilev, A.; Drexhage, K.-H. Synthesis of novel monomeric cyanine dyes containing 2-hydroxypropyl and 3-chloro-2-hydroxypropyl substituents—Noncovalent labels for nucleic acids. Dyes Pigm. 2007, 73, 69–75. [Google Scholar] [CrossRef]
  12. Vasilev, A.A.; Miteva, M.; Ishkitiev, N.; Dragneva, M.; Topalova, L.; Kandinska, M.I. Styryl Hemicyanine Dye (E)-3-Methyl-2-(4-thiomorpholinostyryl)benzo[d]thiazol-3-ium Iodide for Nucleic Acids and Cell Nucleoli Visualization. Molbank 2022, 2022, M1392. [Google Scholar] [CrossRef]
  13. Tyler, A.R.; Okoh, A.O.; Lawrence, C.L.; Jones, V.C.; Moffatt, C.; Smith, R.B. N-Alkylated 2,3,3-trimethylindolenines and 2-methylbenzothiazoles. Potential lead compounds in the fight against Saccharomyces cerevisiaeInfections. Eur. J. Med. Chem. 2013, 64, 222–227. [Google Scholar] [CrossRef] [PubMed]
  14. Ueji, K.; Ichimura, S.; Tamaki, Y.; Miyamura, K. Effects of alkyl chain substitution on the crystal structure of benzothiazole-derived squarylium dyes. Cryst. Eng. Comm. 2014, 16, 10139–10147. [Google Scholar] [CrossRef]
  15. Pardal, A.C.; Ramos, S.S.; Santos, P.F.; Reis, L.V.; Almeida, P. Synthesis and Spectroscopic Characterisation of N-Alkyl Quaternary Ammonium Salts Typical Precursors of Cyanines. Molecules 2002, 7, 320–330. [Google Scholar] [CrossRef]
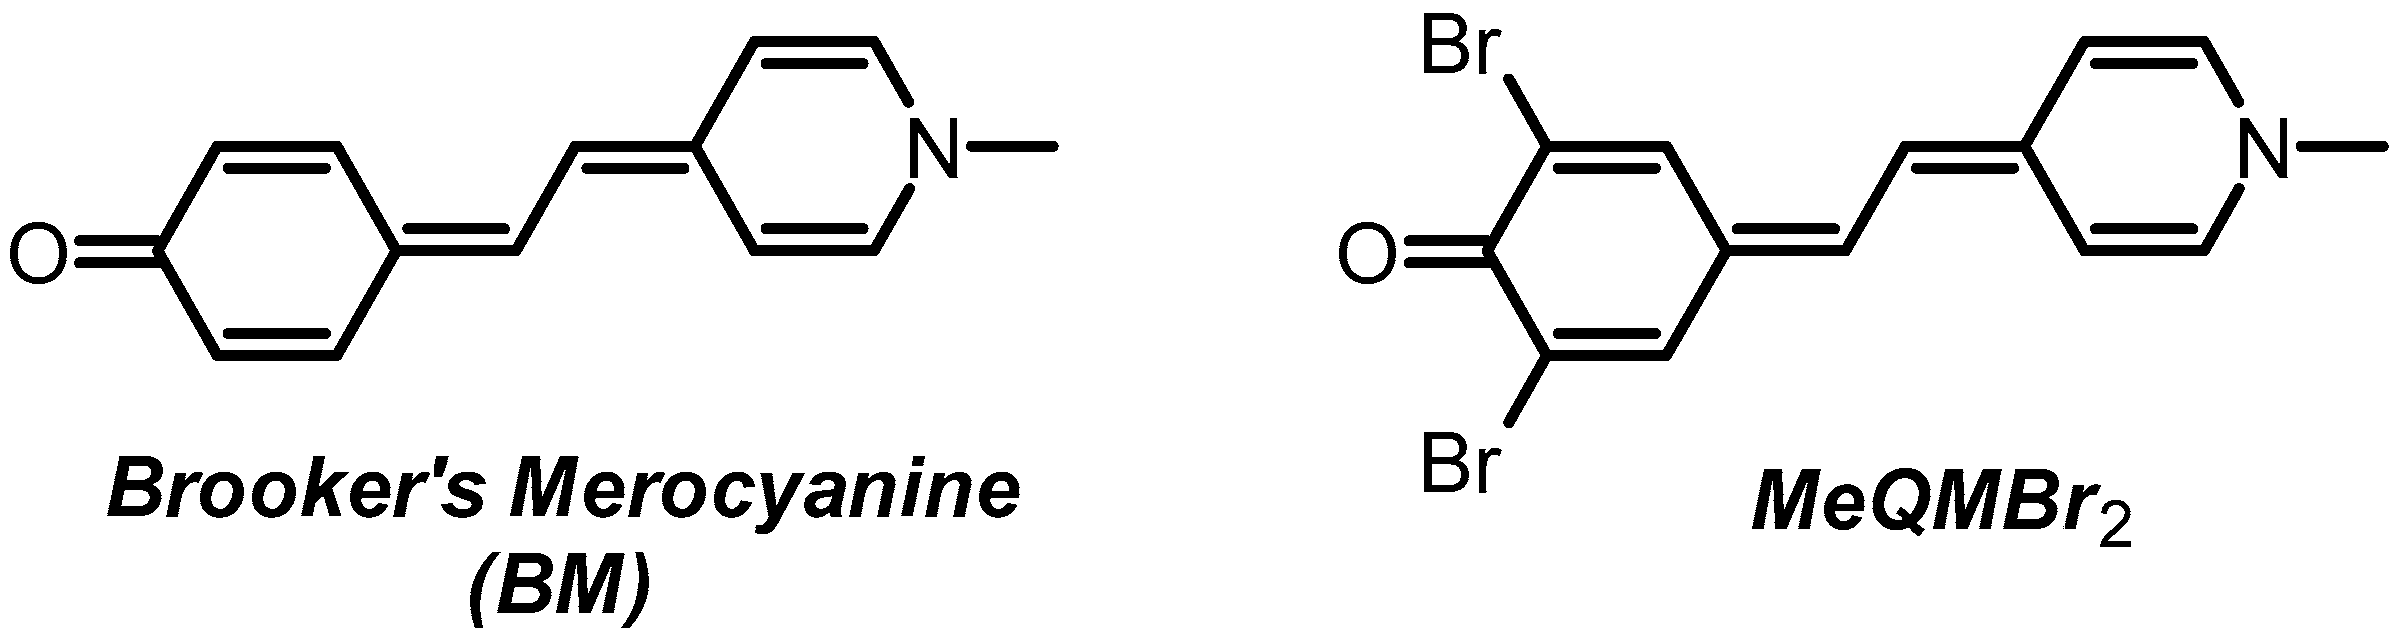
  16. Dimroth, K.; Reichardt, C.; Siepmann, T.; Bohlmann, F. Über Pyridinium-N-phenol-betaine und ihre Verwendung zur Charakterisierung der Polarität von Lösungsmitteln. Justus. Liebigs. Ann. Chem. 1963, 661, 1–37. [Google Scholar] [CrossRef]
  17. Brooker, L.G.S.; Craig, A.C.; Heseltine, D.W.; Jenkins, P.W.; Lincoln, L.L. Color and constitution. XIII. 1 Merocyanines as solvent property indicators2. J. Am. Chem. Soc. 1965, 87, 2443–2450. [Google Scholar] [CrossRef]
  18. Reichardt, C. Solvents and Solvent Effects in Organic Chemistry, 3rd ed.; Wiley-VCH: Weinheim, Germany, 2002. [Google Scholar]
  19. Reichardt, C. Solvatochromism, thermochromism, piezochromism, halochromism, and chiro-solvatochromism of pyridinium N-phenoxide betaine dyes. Chem. Soc. Rev. 1992, 21, 147–153. [Google Scholar] [CrossRef]
  20. Da Silva, D.; Ricken, I.; Silva, R.; Machado, V. Solute–solvent and solvent–solvent interactions in the preferential solvation of Brooker’s merocyanine in binary solvent mixtures. J. Phys. Org. Chem. 2002, 15, 420–427. [Google Scholar] [CrossRef]
  21. Morley, J.O.; Morley, R.M.; Docherty, R.; Charlton, M.H. Fundamental studies on Brooker’s merocyanine. J. Am. Chem. Soc. 1997, 119, 10192–10202. [Google Scholar] [CrossRef]
  22. Benson, H.G.; Murrell, J.N. Some studies of benzenoid-quinonoid resonance. Part 2. The effect of solvent polarity on the structure and properties of merocyanine dyes. J. Chem. Soc. Faraday Trans. II 1972, 68, 137–143. [Google Scholar] [CrossRef]
  23. Cavalli, V.; Da Silva, D.C.; Machado, C.; Machado, V.G.; Soldi, V. The fluorosolvatochromism of Brooker’s merocyanine in pure and in mixed solvents. J. Fluoresc. 2006, 16, 77–86. [Google Scholar] [CrossRef] [PubMed]
  24. Zhang, J.; Poongavanam, V.; Kang, D.; Bertagnin, C.; Lu, H.; Kong, X.; Ju, H.; Lu, X.; Gao, P.; Tian, Y.; et al. Optimization of N-Substituted Oseltamivir Derivatives as Potent Inhibitors of Group-1 and -2 Influenza A Neuraminidases, Including a Drug-Resistant Variant. J. Med. Chem. 2018, 61, 6379–6397. [Google Scholar] [CrossRef] [PubMed]
Figure 1. Chemical structure of (E)-3-Methyl-2-(4-thiomorpholinostyryl)benzo[d]thiazol-3-ium iodide (1).
Molbank 2023 m1727 g001
Scheme 1. Synthetic pathway for the preparation of the (E)-3-heptyl-2-(4-thiomorpholinostyryl)benzo[d]thiazol-3-ium iodide dye (2).
Molbank 2023 m1727 sch001
Figure 2. (A) UV-VIS absorption spectra of the 20 μM dye 1 in solvents with different polarities; (B) UV-VIS absorption spectra of 20 μM dye 2 in solvents with different polarities.
Molbank 2023 m1727 g002
Figure 3. Chemical structures of the reference solvatochromic dye BM and its analogue MeQMBr2.
Molbank 2023 m1727 g003
Figure 4. (A) UV-VIS absorption spectra of dye 1 neat and in presence of dsDNA; (B) UV-VIS absorption spectra of dye 2 neat and in presence of dsDNA; (C) UV-VIS absorption spectra of dye 1 neat and in the presence of RNA; (D) UV-VIS absorption spectra of dye 2 neat and in the presence of RNA.
Molbank 2023 m1727 g004
Figure 5. (A) Fluorescence spectra of dye 1 neat and in the presence of dsDNA; (B) fluorescence spectra of dye 1 neat and in the presence of a larger concentration of dsDNA; (C) fluorescence spectra of dye 1 neat and in the presence of RNA UV-VIS absorption spectra of dye 2 neat and in the presence of dsDNA; (D) fluorescence spectra of dye 2 neat and in the presence of dsDNA; (E) fluorescence spectra of dye 2 neat and in the presence of RNA; (F) fluorescent confocal microscope picture of HeLa cells incubated with dye 2 for 10 min.
Molbank 2023 m1727 g005
Table 1. Solvent polarity (εr), longest absorption maxima λmax1 (nm) of dye 1, molar absorbtivity of dye 1 ε1 (L. mol−1.cm−1), longest absorption maxima of dye 2 λmax2 (nm), molar absorbtivity of dye 2 ε2 (L. mol−1.cm−1), ET (kcal.mol−1).
Solvent (εr)λmax1ε1λmax2ε2ET
12MeQMBr2
Toluene (2.38)53320,25053726,18053.653.240.9
Chloroform (4.81)54445,73554458,95752.652.641.6
Dichloromethane (8.93)54557,50054479,08552.552.642.6
Acetone (20.7)51138,44051653,65756.055.4no data
Ethanol (24.55)51935,20051946,98455.155.148.4
Methanol (32.7)51531,17051945,82555.555.151.1
DMF (36.71)51232,44052451,81155.854.645.4
Acetonitrile (37.5)51038,42751452,45856.055.6no data
DMSO (46.68)51232,43951949,40055.855.145.7
Water (80.1)49023,46949235,50958.358.1no data
Disclaimer/Publisher’s Note: The statements, opinions and data contained in all publications are solely those of the individual author(s) and contributor(s) and not of MDPI and/or the editor(s). MDPI and/or the editor(s) disclaim responsibility for any injury to people or property resulting from any ideas, methods, instructions or products referred to in the content.

