
Construction of Genetic Map and QTL Mapping for Seed Size and Quality Traits in Soybean (Glycine max L.)


Abstract
:1. Introduction
2. Results
2.1. Trait Phenotype Analysis
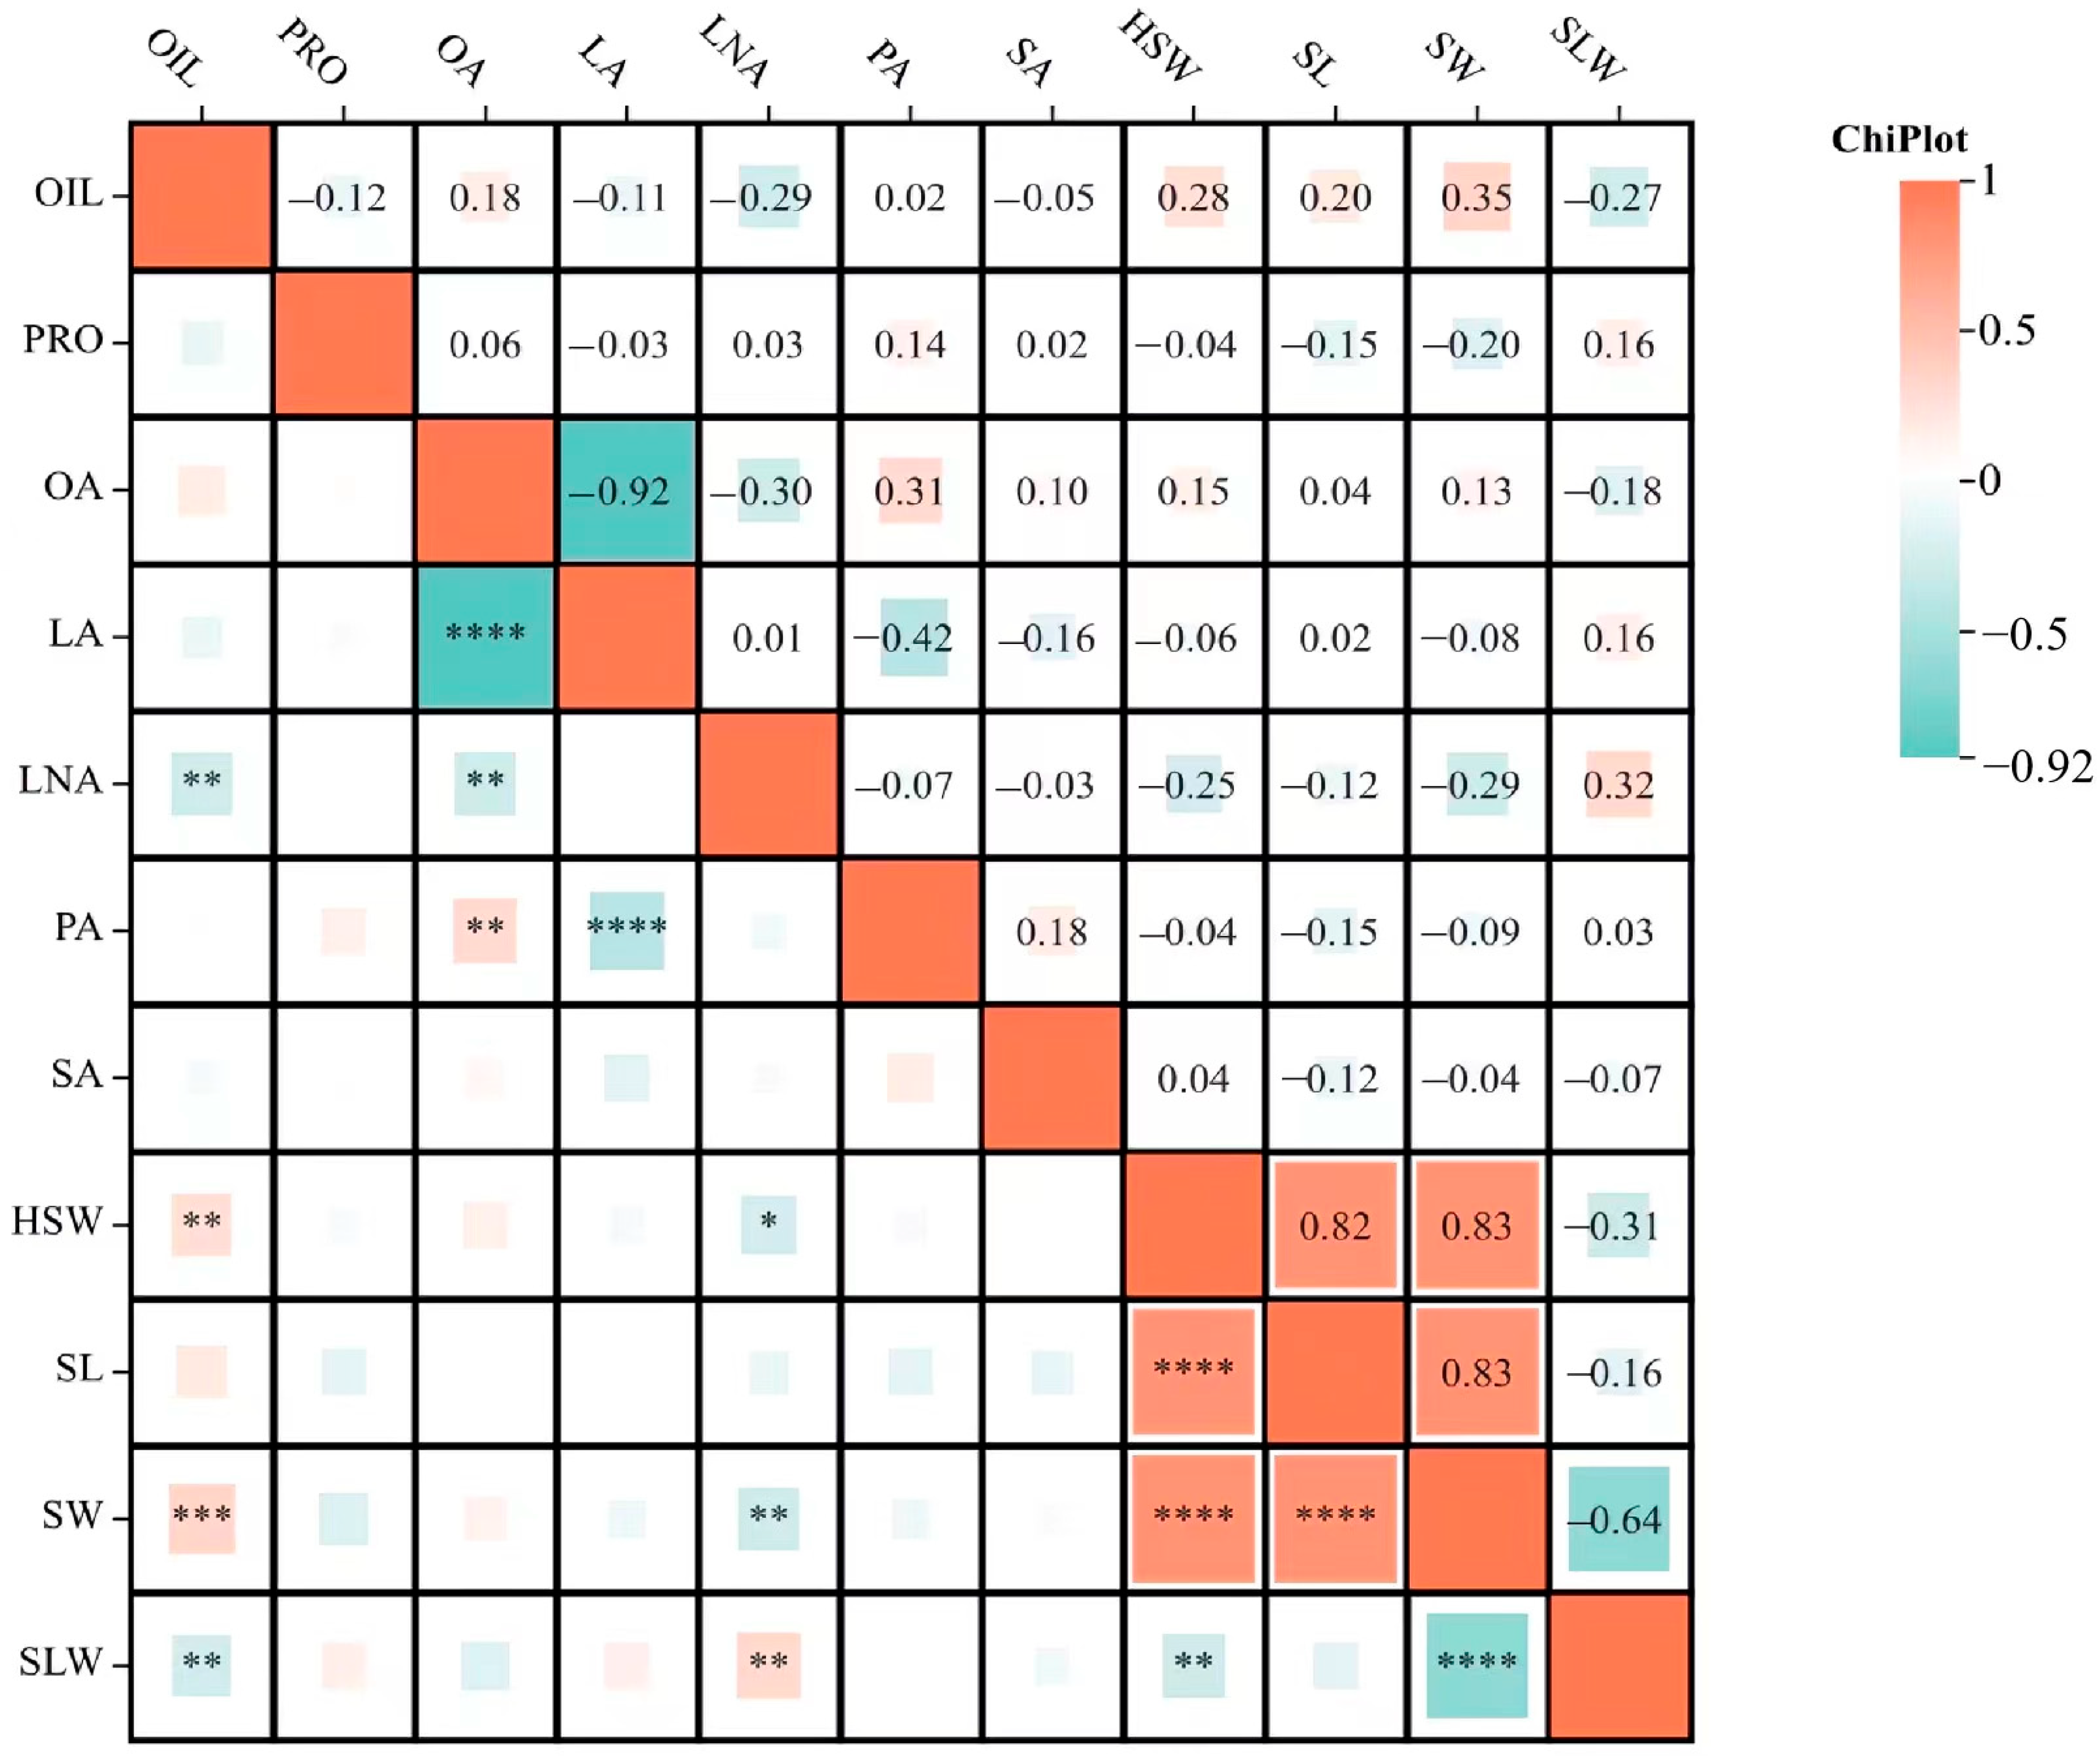
2.2. Correlation Analysis of Seed Size Traits and Quality Traits
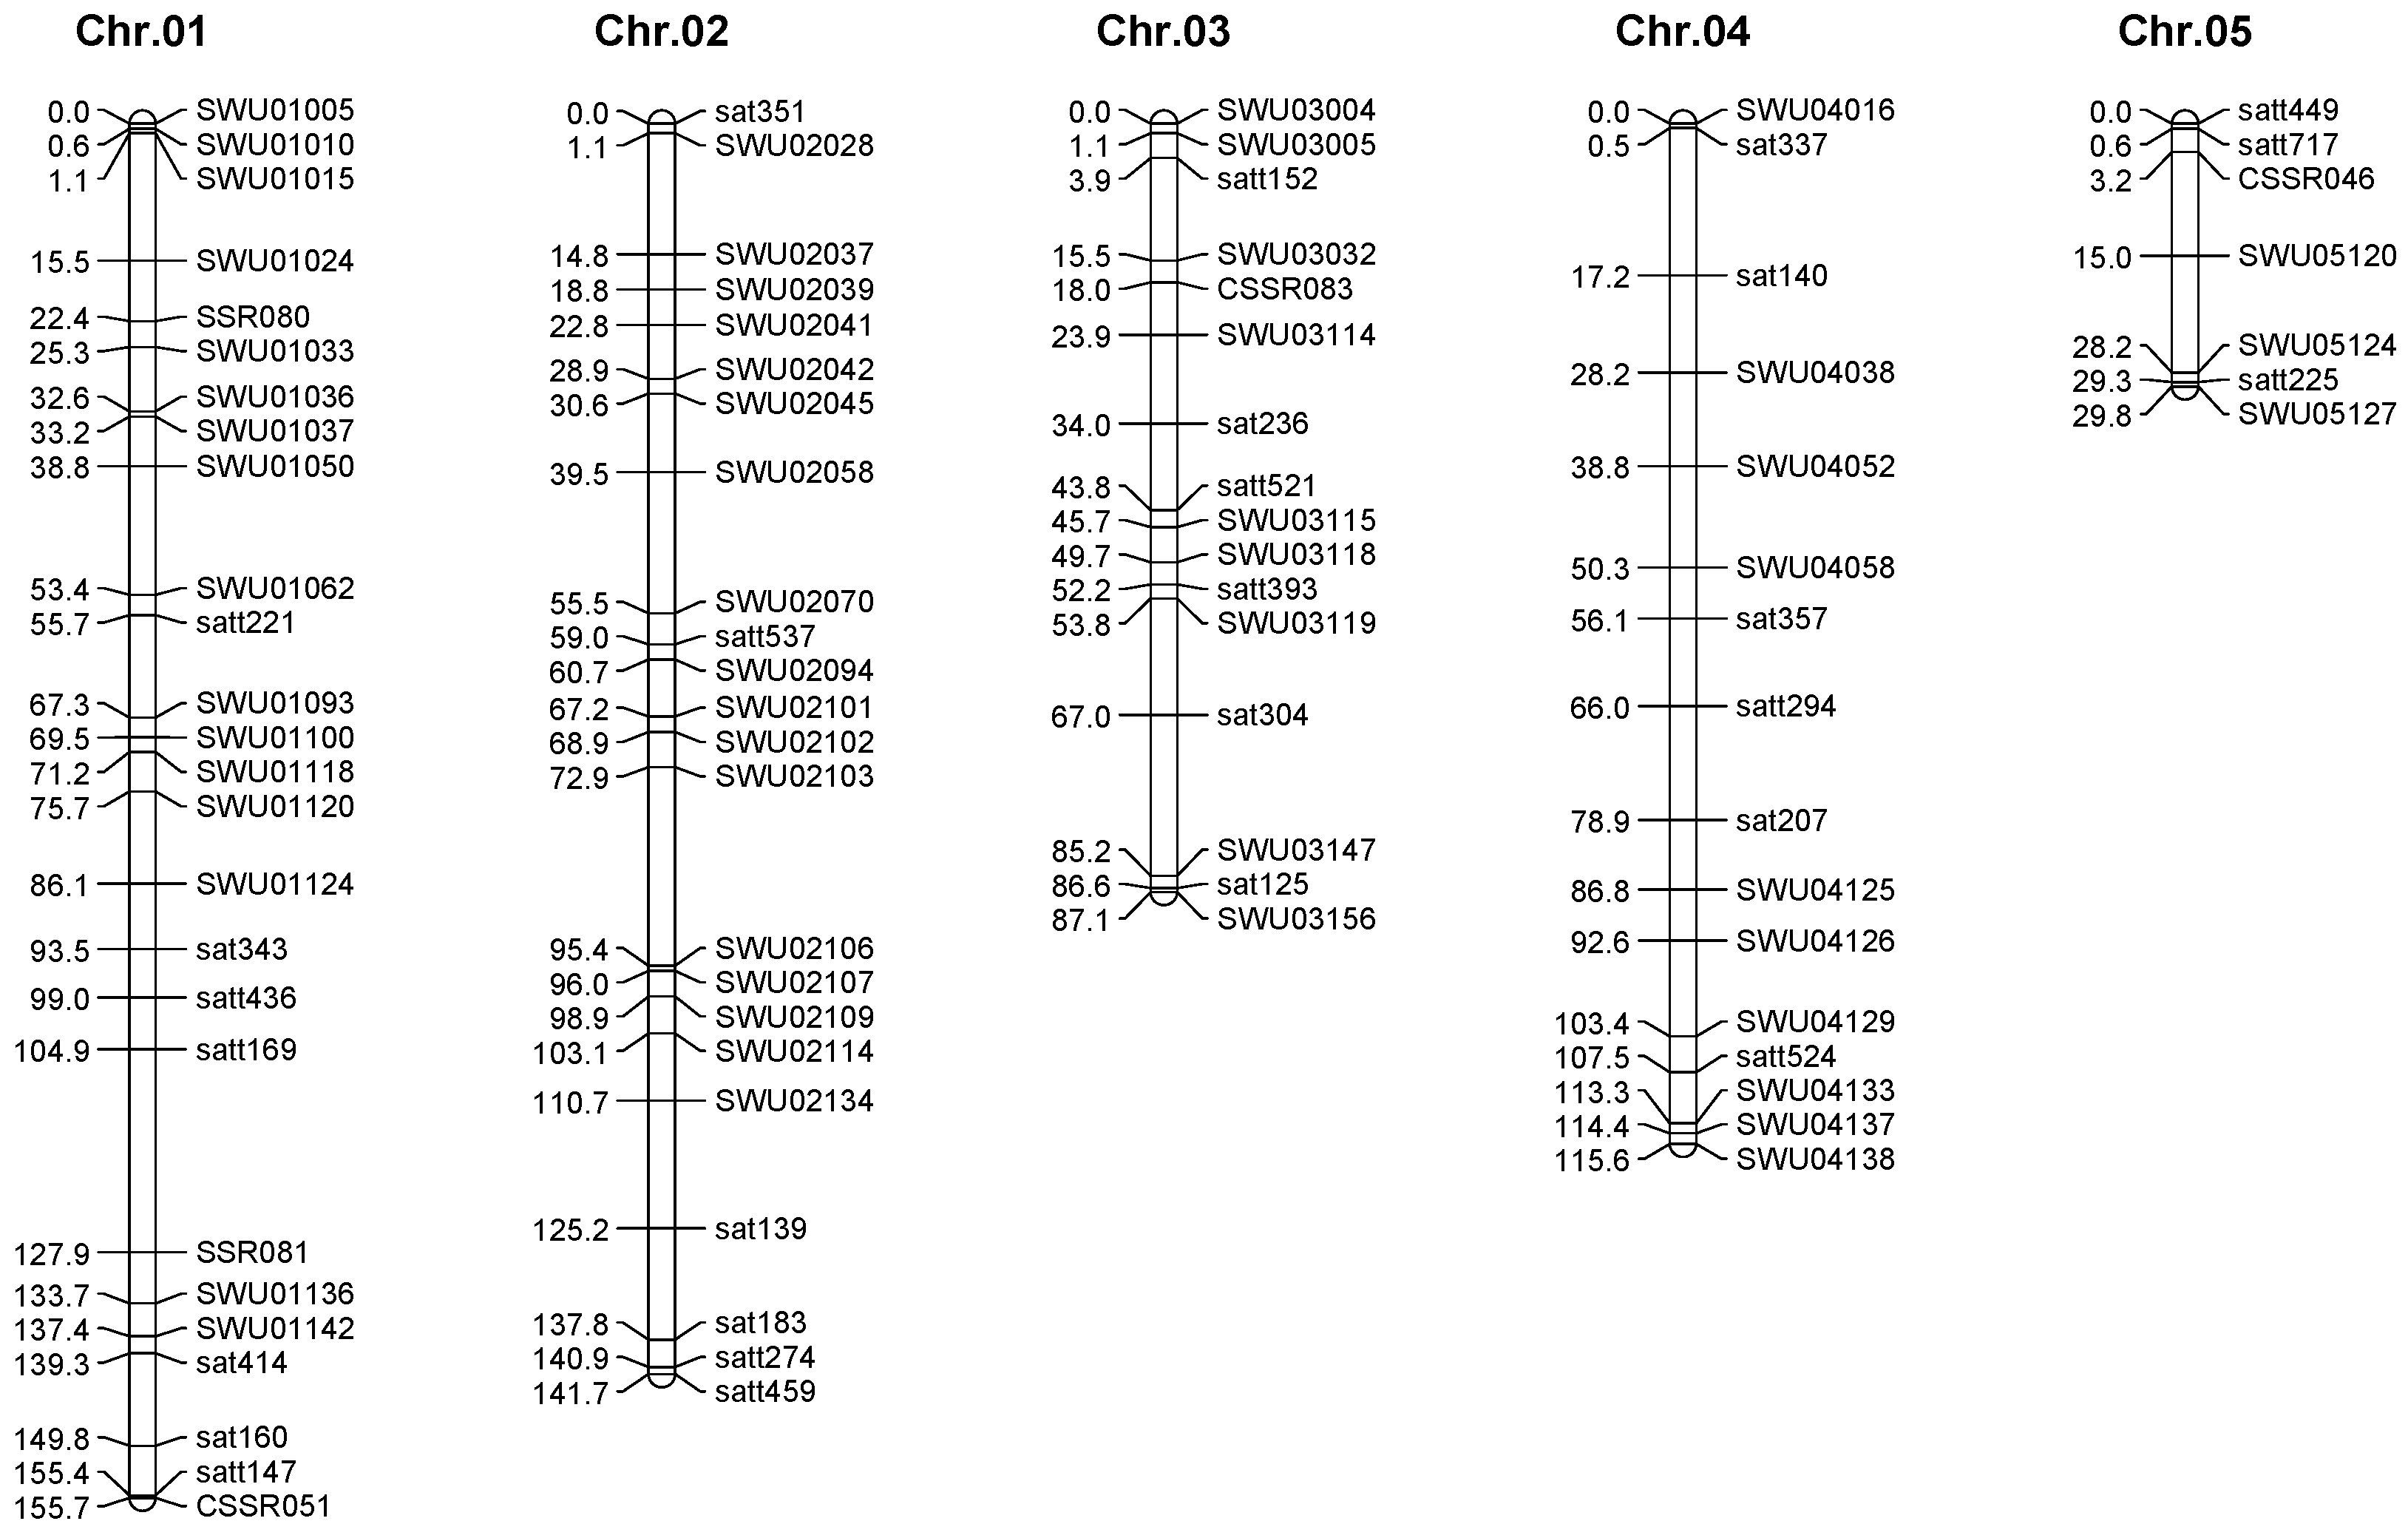
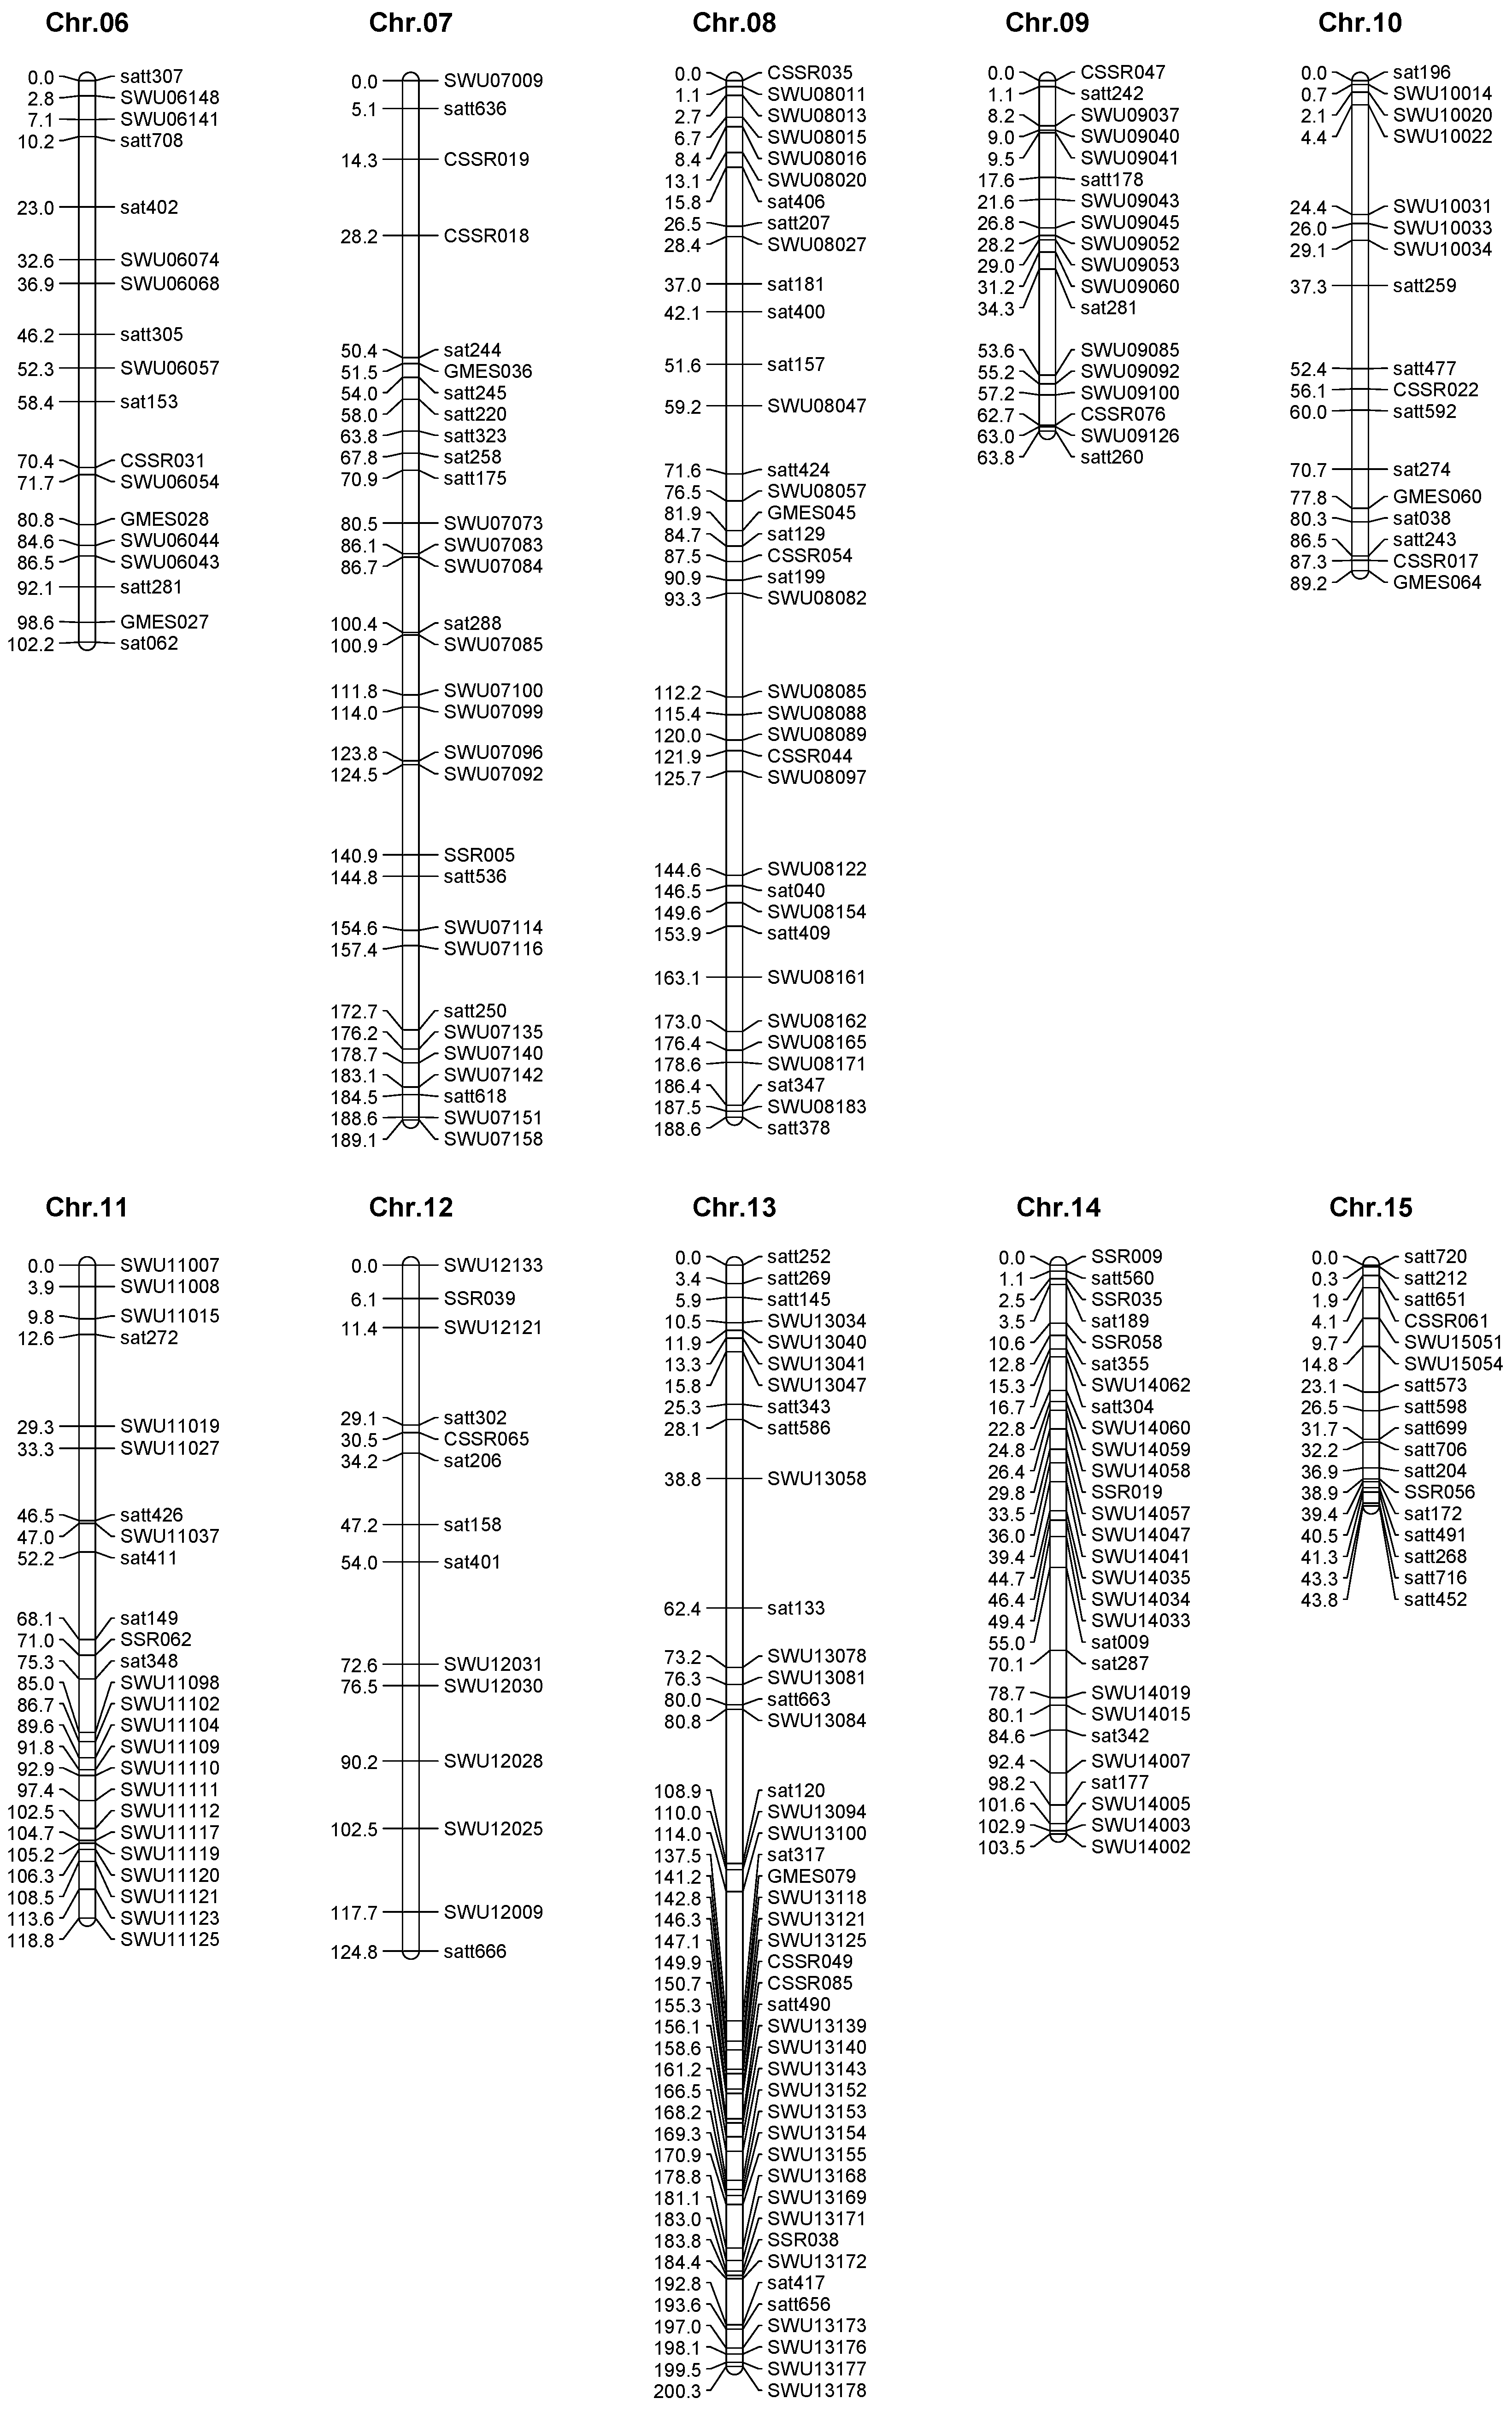
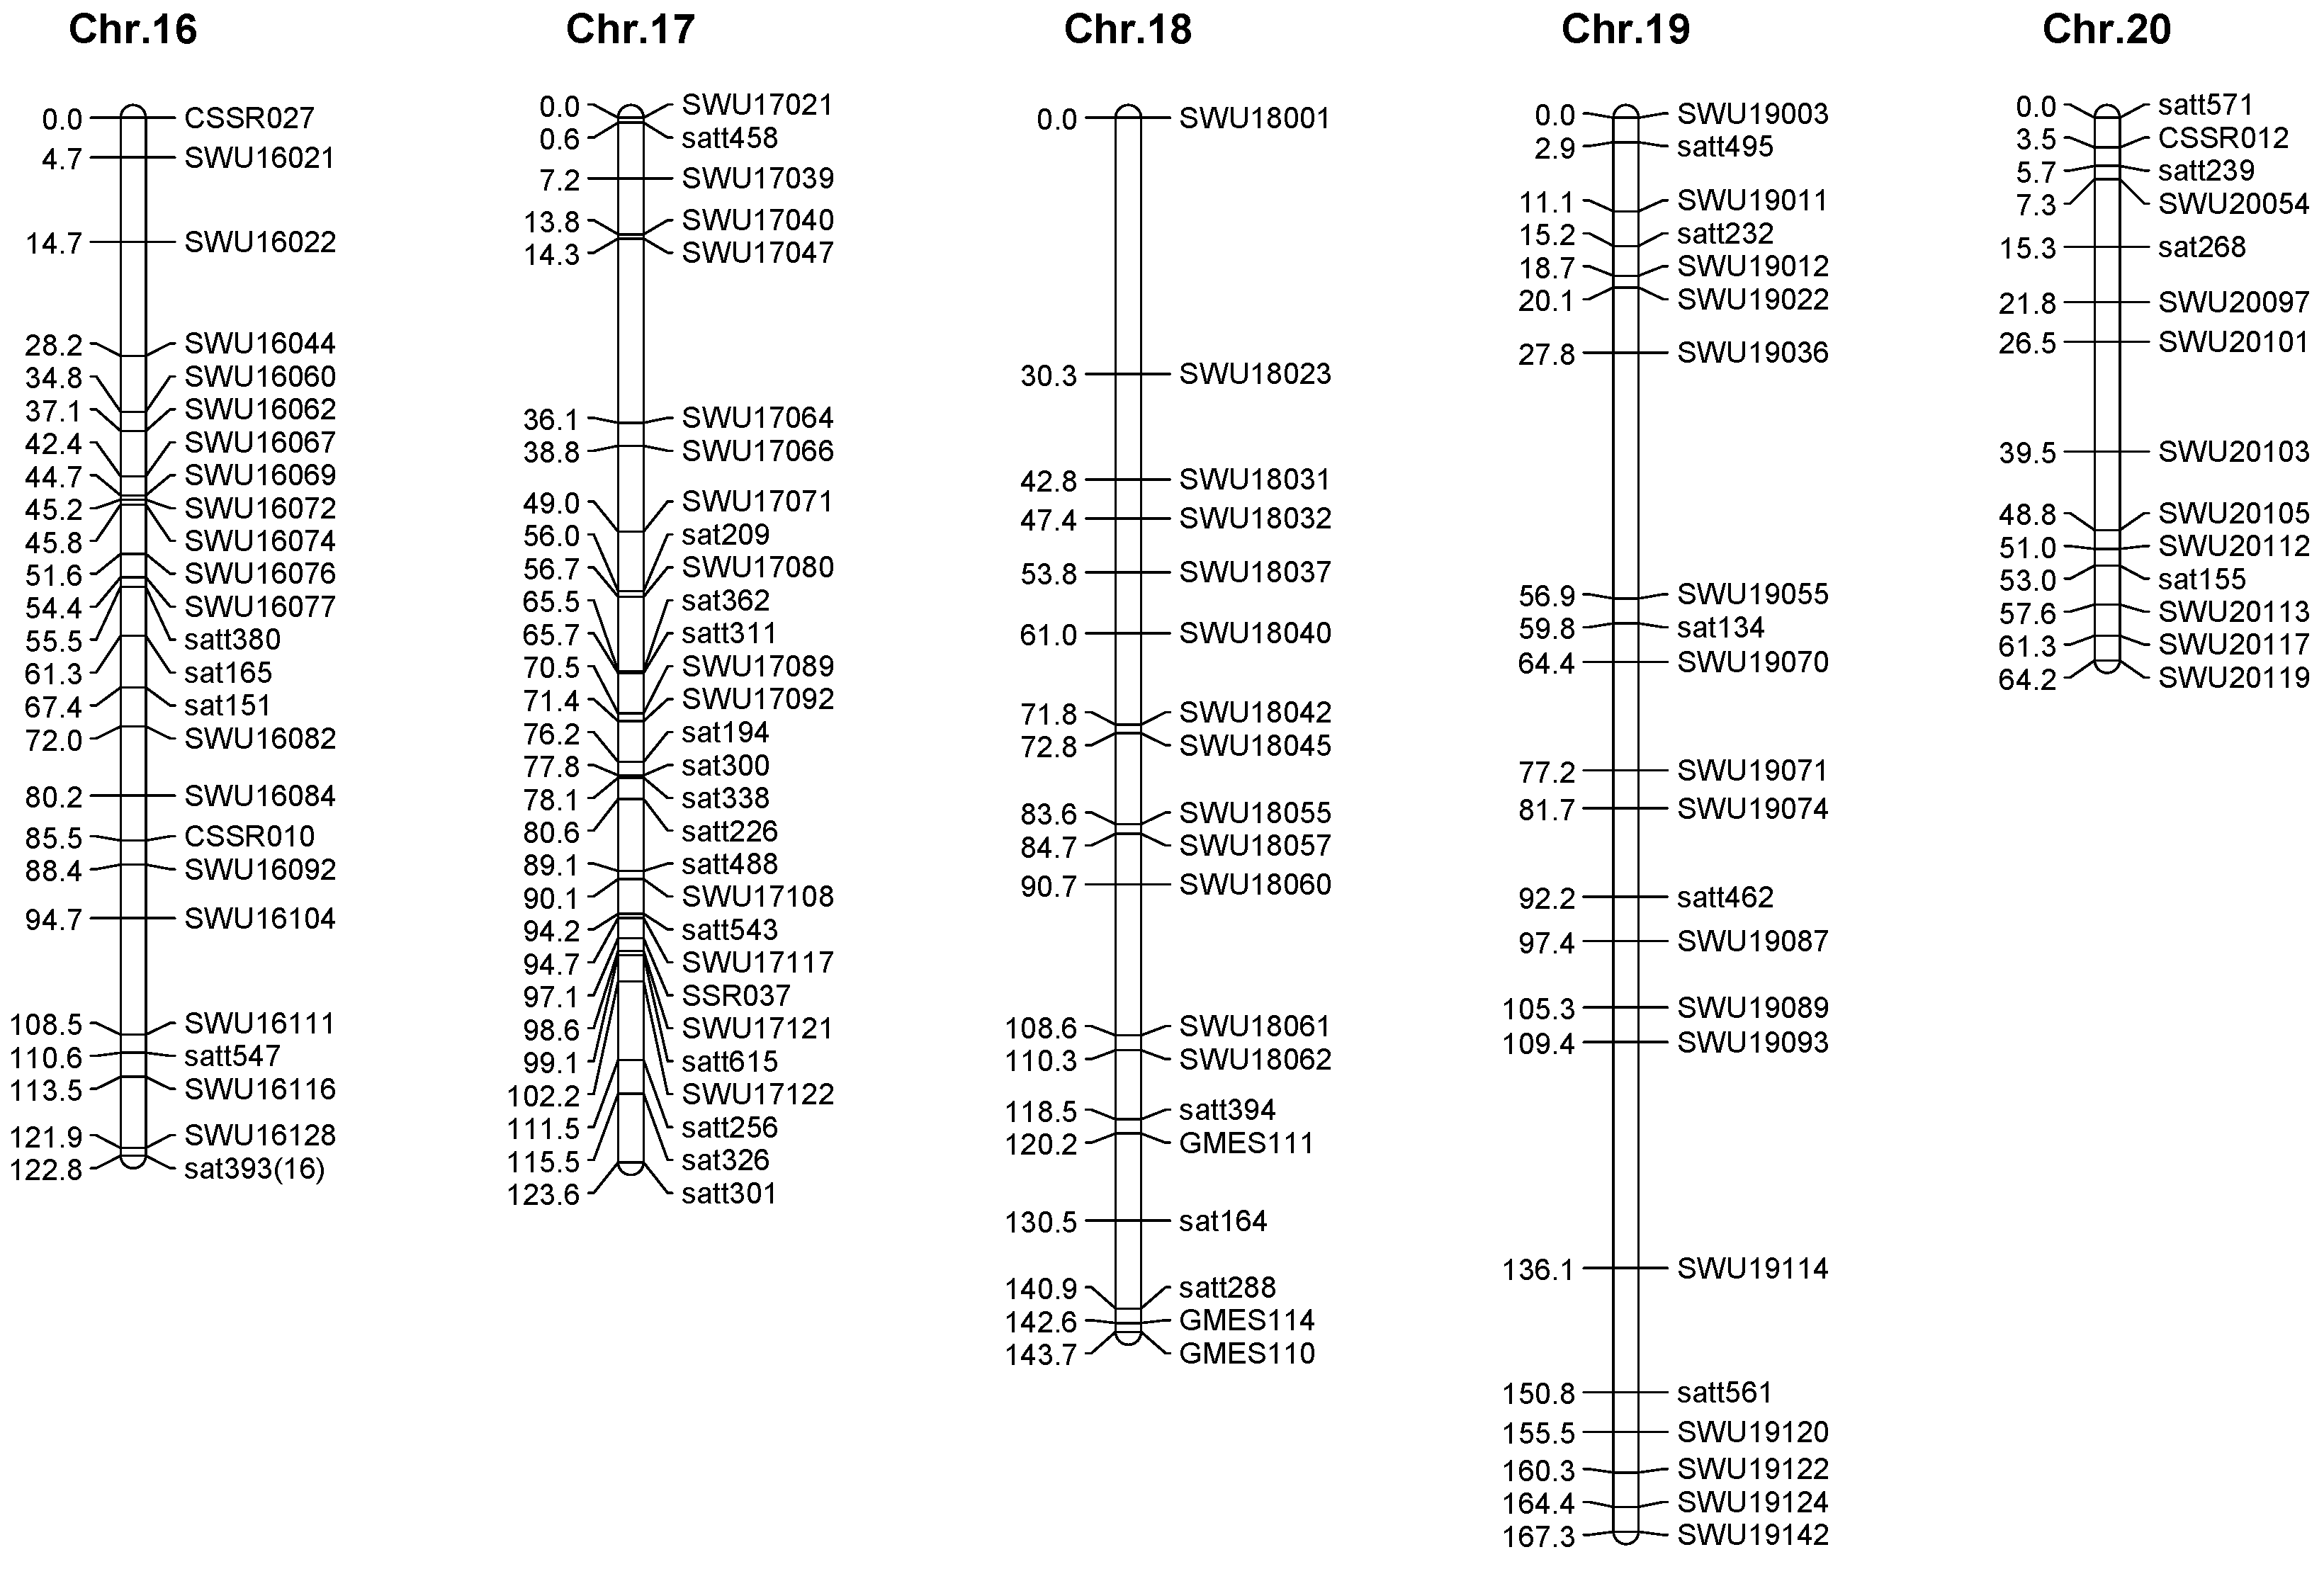
2.3. Genetic Map Construction
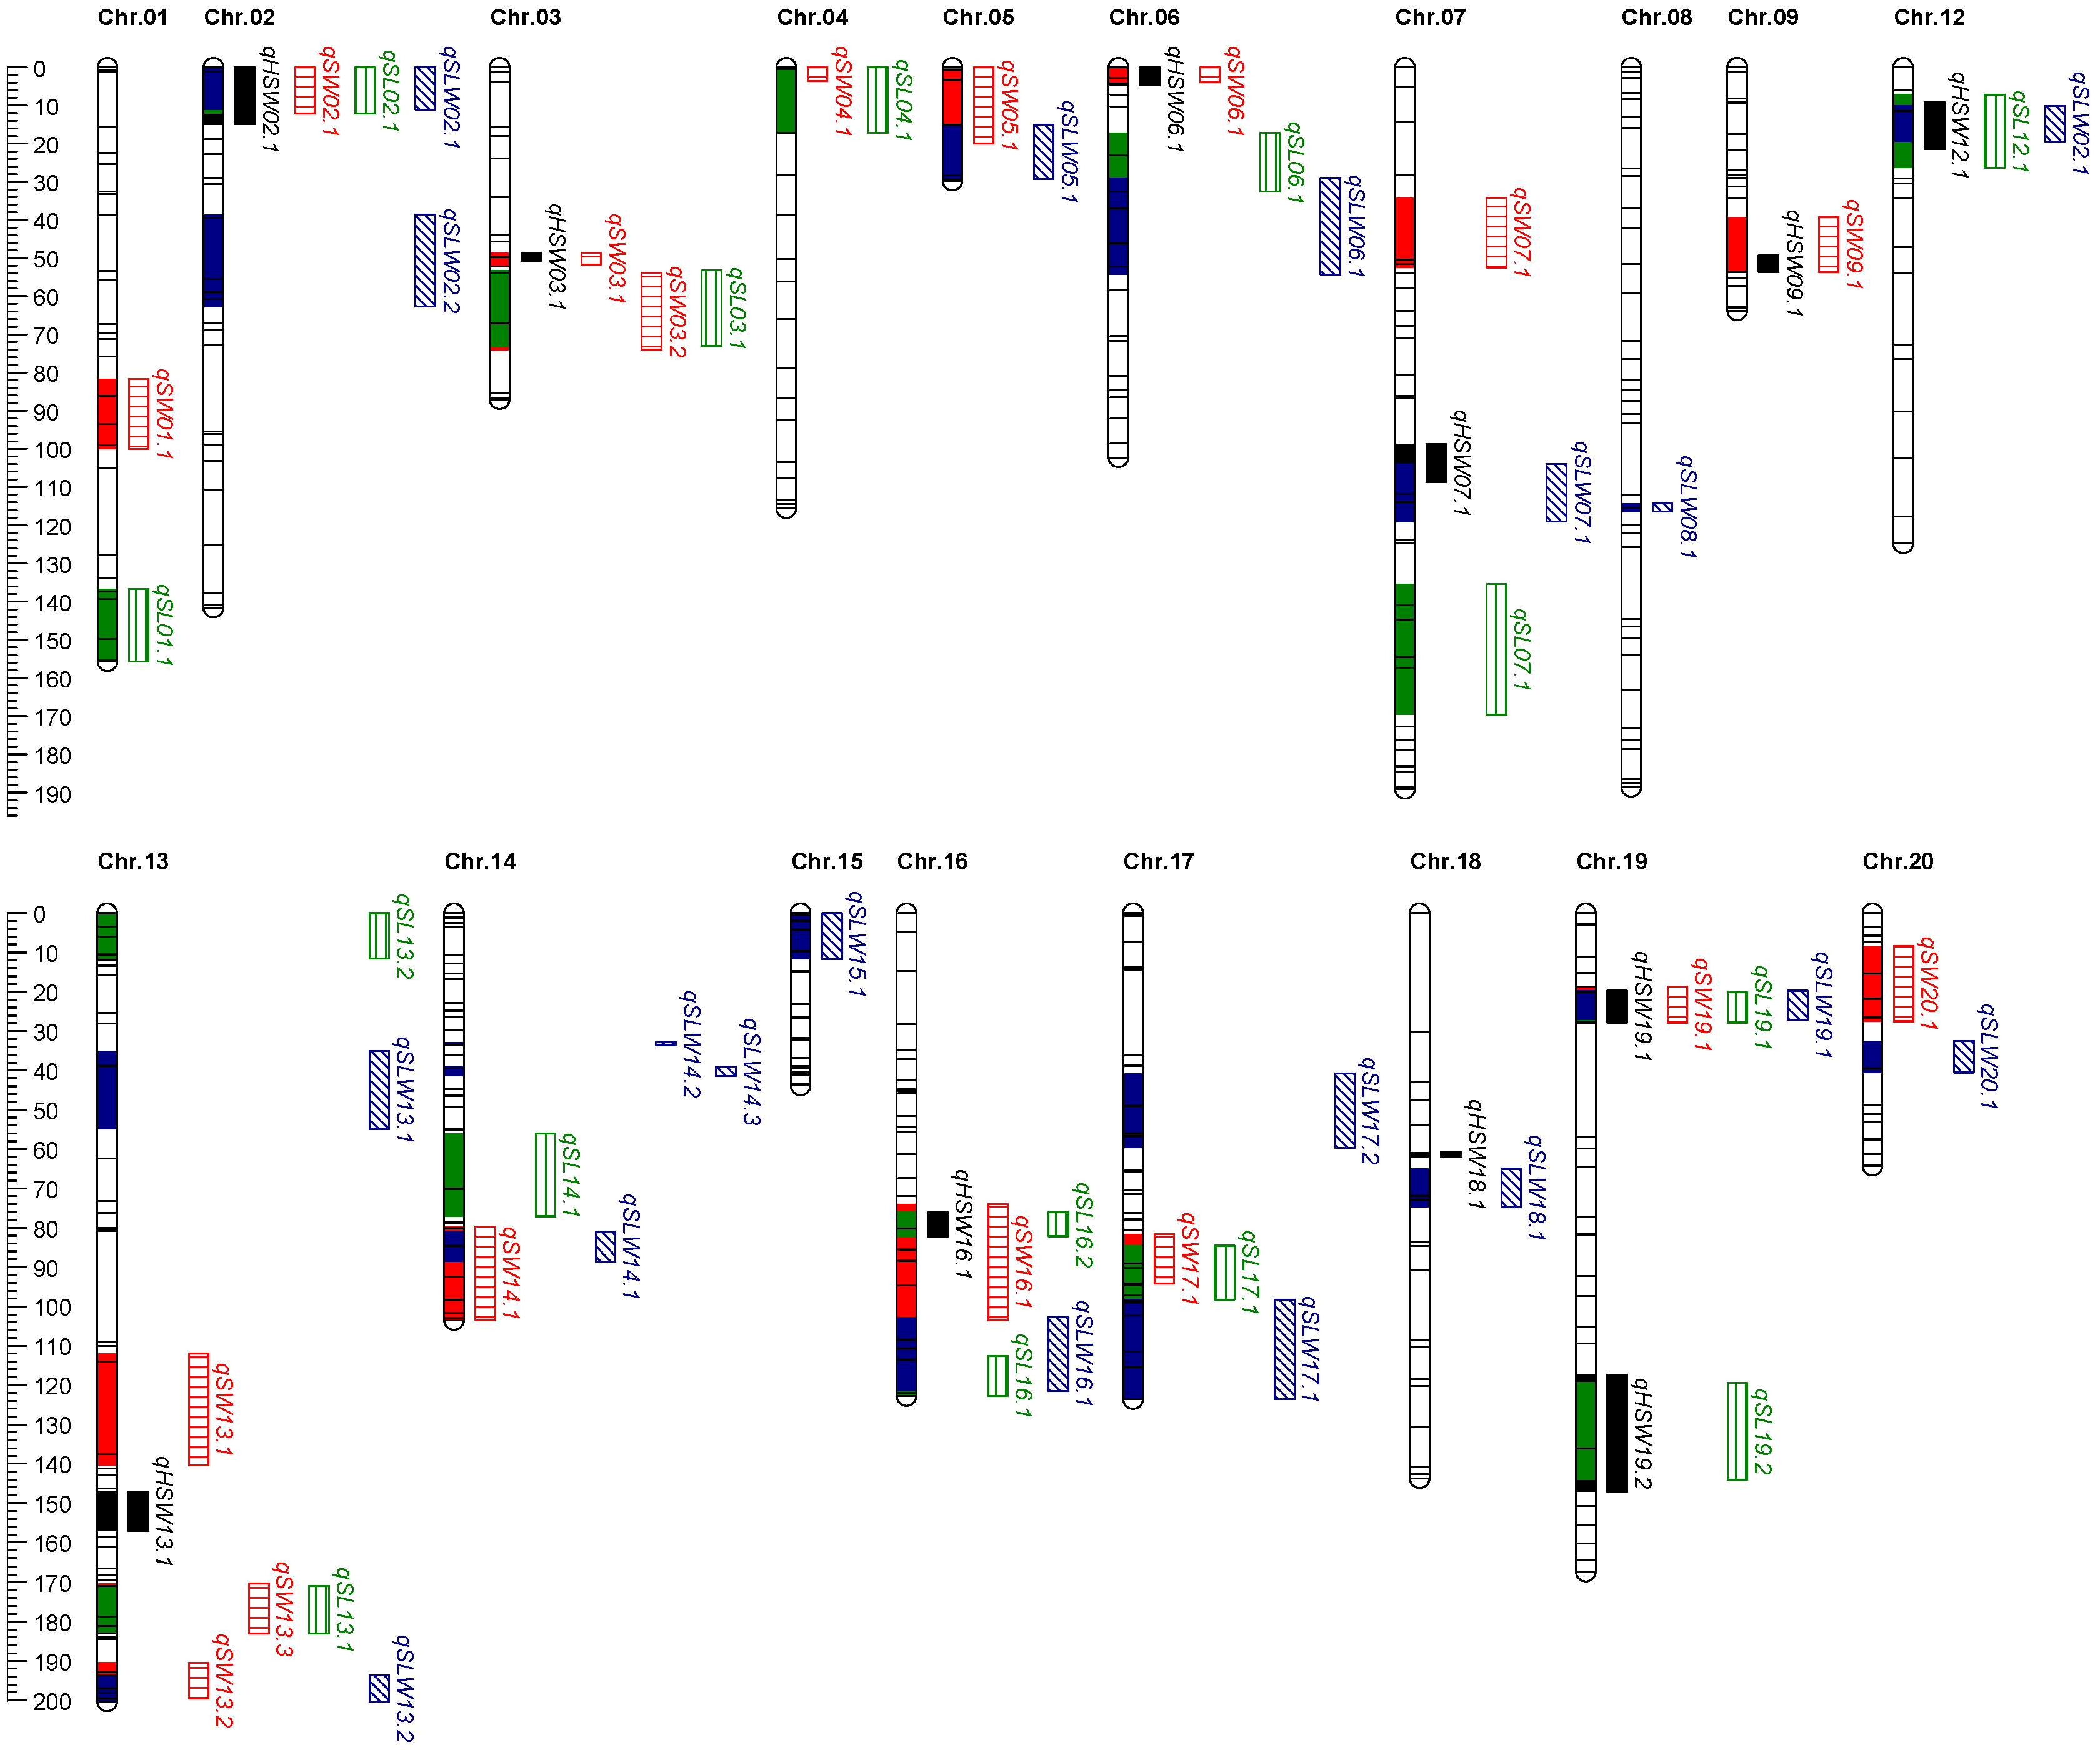
2.4. QTL Mapping for Seed Size Traits
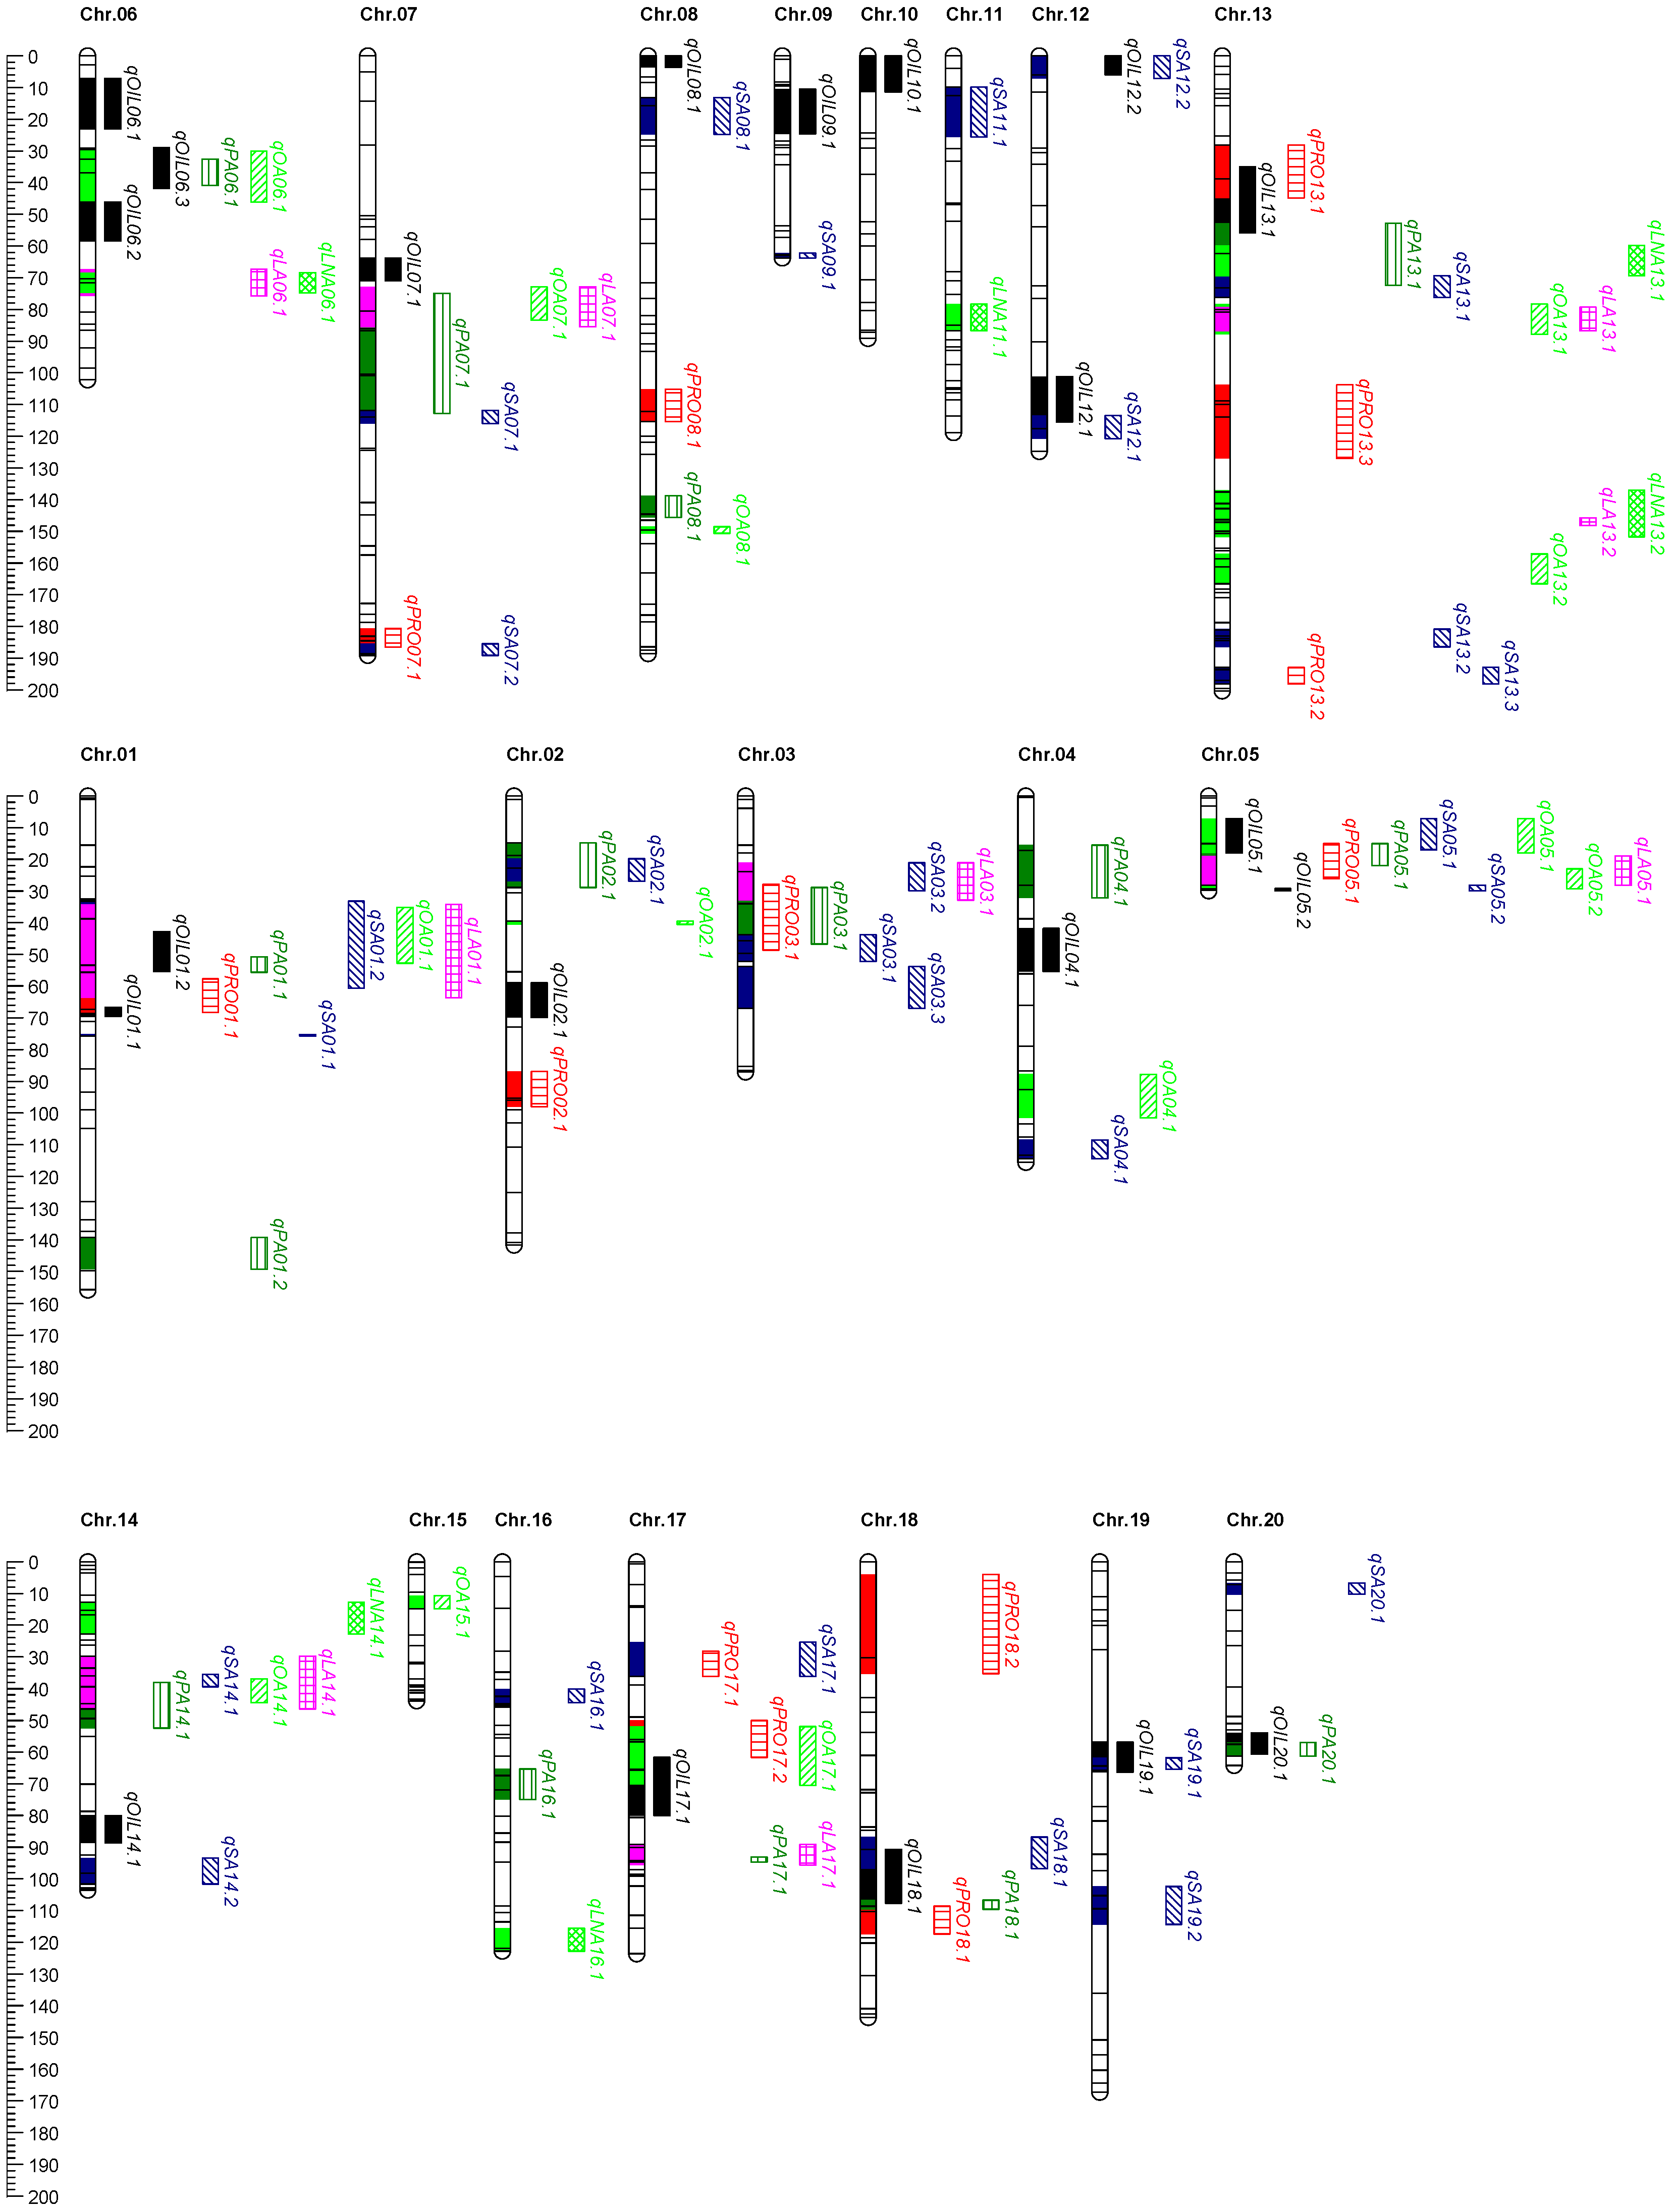
2.5. QTL Mapping for Seed Quality Traits
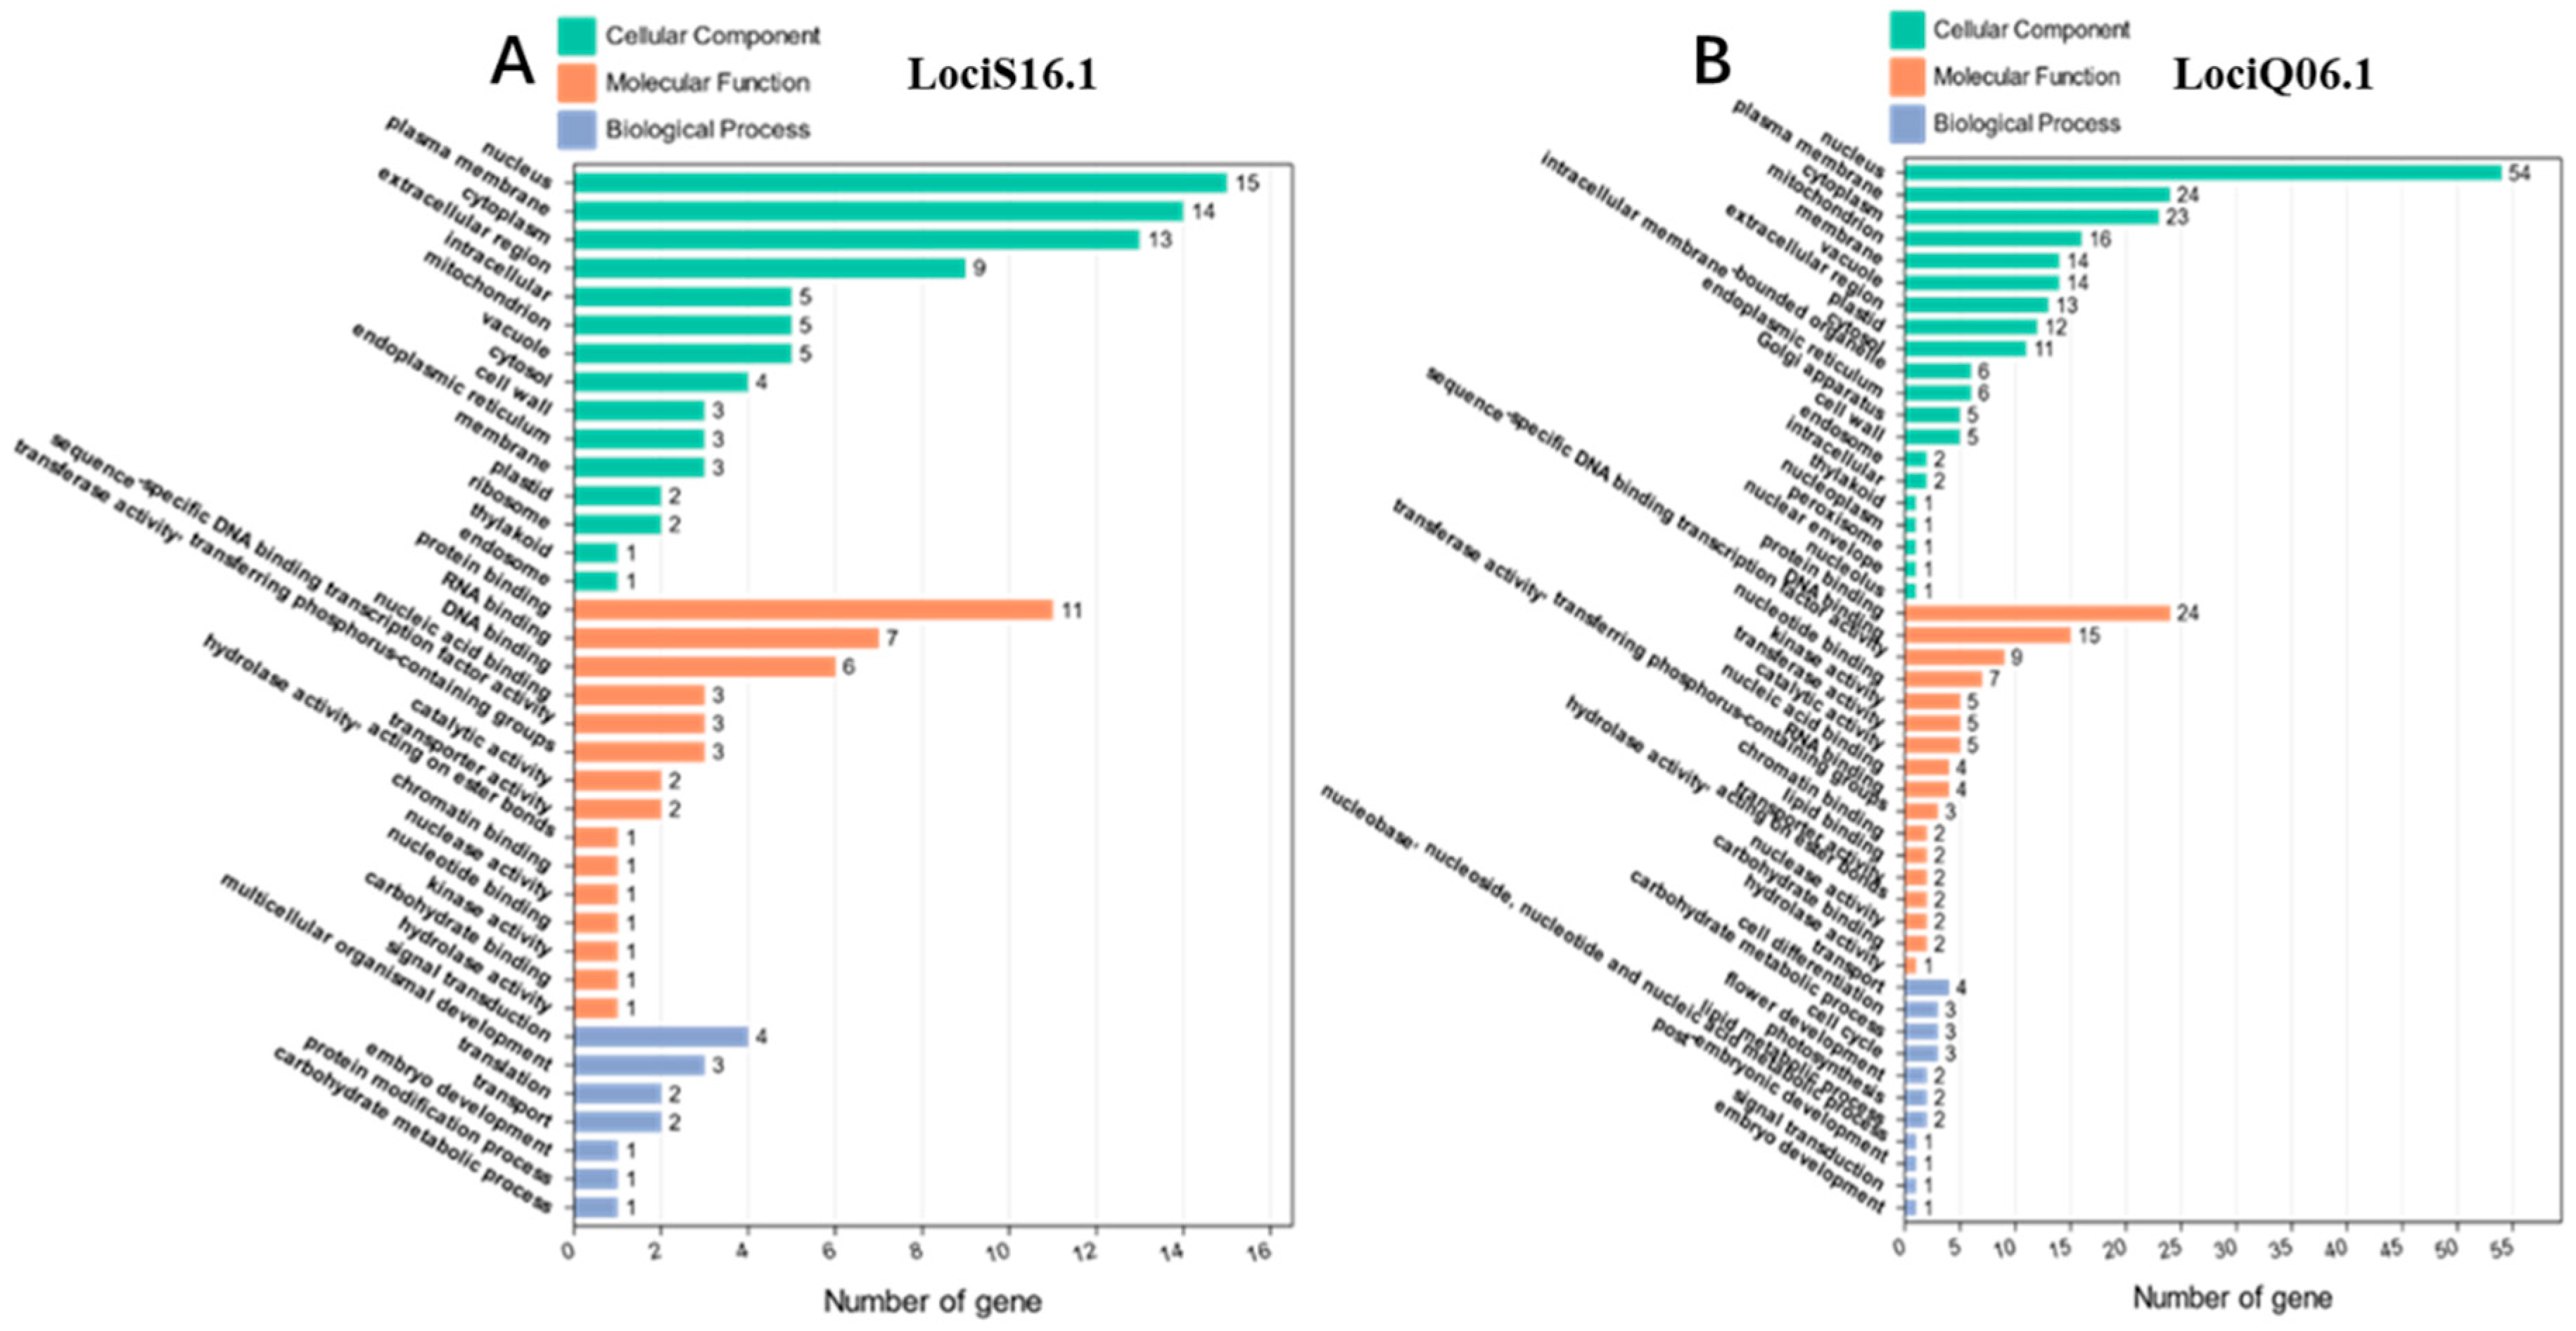
2.6. Identification and Analysis of QTL Clusters
2.7. Candidate Gene Prediction
3. Discussion
4. Materials and Methods
4.1. Plant Materials
4.2. DNA Extraction and SSR Genotyping
4.3. Determination of Traits
4.3.1. Size Traits
4.3.2. Quality Traits
4.4. Map Construction and QTL Detection
4.5. QTL Clusters Identification
4.6. Candidate Gene Prediction
Supplementary Materials
Author Contributions
Funding
Institutional Review Board Statement
Informed Consent Statement
Data Availability Statement
Conflicts of Interest
References
- Pei, R.; Zhang, J.; Tian, L.; Zhang, S.; Han, F.; Yan, S.; Wang, L.; Li, B.; Sun, J. Identification of novel QTL associated with soybean isoflavone content. Crop J. 2018, 6, 244–252. [Google Scholar] [CrossRef]
- Seo, J.H.; Kim, K.S.; Ko, J.M.; Choi, M.S.; Kang, B.K.; Kwon, S.W.; Jun, T.H. Quantitative trait locus analysis for soybean (Glycine max) seed protein and oil concentrations using selected breeding populations. Plant Breed. 2019, 138, 95–104. [Google Scholar] [CrossRef]
- Liu, J.; Jiang, A.; Ma, R.; Gao, W.; Tan, P.; Li, X.; Du, C.; Zhang, J.; Zhang, X.; Zhang, L.; et al. QTL Mapping for Seed Quality Traits under Multiple Environments in Soybean (Glycine max L.). Agronomy 2023, 13, 2382. [Google Scholar] [CrossRef]
- Brzostowski, L.F.; Diers, B.W. Agronomic evaluation of a high protein allele from PI407788A on chromosome 15 across two soybean backgrounds. Crop Sci. 2017, 57, 2972–2978. [Google Scholar] [CrossRef]
- Luo, S.; Jia, J.; Liu, R.; Wei, R.; Guo, Z.; Cai, Z.; Chen, B.; Liang, F.; Xia, Q.; Nian, H.; et al. Identification of major QTLs for soybean seed size and seed weight traits using a RIL population in different environments. Front. Plant Sci. 2023, 13, 1094112. [Google Scholar] [CrossRef]
- Tzen, J.T.; Cao, Y.Z.; Laurent, P.; Ratnayake, C.; Huang, A.H.C. Lipids, proteins, and structure of seed oil bodies from diverse species. Plant Physiol. 1993, 101, 267–276. [Google Scholar] [CrossRef] [PubMed]
- Sulistyo, A.; PurwantoroMejaya, M.J.; Nugrahaeni, N. Determination of genetic parameters of seed characteristics in edible soybean. Legume Res. 2021, 44, 522–526. [Google Scholar] [CrossRef]
- Li, N.; Xu, R.; Li, Y. Molecular networks of seed size control in plants. Annu. Rev. Plant Biol. 2019, 70, 435–463. [Google Scholar] [CrossRef]
- Liu, S.; Liu, Z.; Hou, X.; Li, X. Genetic mapping and functional genomics of soybean seed protein. Mol. Breed. 2023, 43, 29. [Google Scholar] [CrossRef]
- Jiang, A.; Liu, J.; Gao, W.; Ma, R.; Tan, P.; Liu, F.; Zhang, J. Construction of a genetic map and QTL mapping of seed size traits in soybean. Front. Genet. 2023, 14, 1248315. [Google Scholar] [CrossRef]
- Li, M.; Liu, Y.; Wang, C.; Yang, X.; Li, D.; Zhang, X.; Xu, C.; Zhang, Y.; Li, W.; Zhao, L. Identification of traits contributing to high and stable yields in different soybean varieties across three chinese latitudes. Front. Plant Sci. 2022, 10, 1642. [Google Scholar] [CrossRef] [PubMed]
- Li, R.; Jiang, H.; Zhang, Z.; Zhao, Y.; Xie, J.; Wang, Q.; Zheng, H.; Hou, L.; Xiong, X.; Xin, D.; et al. Combined linkage mapping and BSA to identify QTL and candidate genes for plant height and the number of nodes on the main stem in soybean. Int. J. Mol. Sci. 2019, 21, 42. [Google Scholar] [CrossRef] [PubMed]
- Salas, P.; Oyarzo-Llaipen, J.C.; Wang, D.; Chase, K.; Mansur, L. Genetic mapping of seed shape in three populations of recombinant inbred lines of soybean (Glycine max (L.) merr.). Theor. Appl. Genet. 2006, 113, 1459–1466. [Google Scholar] [CrossRef] [PubMed]
- Xu, Y.; Li, H.N.; Li, G.J.; Wang, X.; Cheng, L.G.; Zhang, Y.M. Mapping quantitative trait loci for seed size traits in soybean (Glycine max (L.) merr). Theor. Appl. Genet. 2011, 122, 581–594. [Google Scholar] [CrossRef] [PubMed]
- Liang, H.; Xu, L.; Yu, Y.; Yang, H.; Dong, W.; Zhang, H. Identification of QTLs with main, epistatic and QTL by environment interaction effects for seed shape and hundred-seed weight in soybean across multiple years. J. Genet. 2016, 95, 475–477. [Google Scholar] [CrossRef] [PubMed]
- Zhang, J.; Song, Q.; Cregan, P.B.; Nelson, R.L.; Wang, X.; Wu, J.; Jiang, G.L. Genome-wide association study for flowering time, maturity dates and plant height in early maturing soybean (Glycine max) germplasm. BMC Genom. 2015, 16, 217–228. [Google Scholar] [CrossRef] [PubMed]
- Phansak, P.; Soonsuwon, W.; Hyten, D.L.; Song, Q.; Cregan, P.B.; Graef, G.L.; Specht, J.E. Multi-population selective genotyping to identify soybean [Glycine max (L.) Merr.] seed protein and oil QTLs. G3 2016, 6, 1635–1648. [Google Scholar] [CrossRef]
- Sedivy, E.J.; Wu, F.Q.; Hanzawa, Y. Soybean domestication: The origin, genetic architecture and molecular bases. New Phytol. 2017, 214, 539–553. [Google Scholar] [CrossRef]
- Patil, G.; Mian, R.; Vuong, T.; Pantalone, V.; Song, Q.; Chen, P.; Shannon, G.J.; Carter, T.C.; Nguyen, H.T. Molecular mapping and genomics of soybean seed protein: A review and perspective for the future. Theor. Appl. Genet. 2017, 130, 1975–1991. [Google Scholar] [CrossRef]
- Qi, Z.M.; Wu, Q.; Han, X.; Sun, Y.N.; Du, X.Y.; Liu, C.Y.; Chen, Q.S. Soybean oil content QTL mapping and integrating with meta-analysis method for mining genes. Euphytic 2011, 179, 499–514. [Google Scholar] [CrossRef]
- Mao, T.; Jiang, Z.; Han, Y.; Teng, W.; Zhao, X.; Li, W. Identification of quantitative trait loci underlying seed protein and oil contents of soybean across multi-genetic backgrounds and environments. Plant Breed. 2013, 132, 630–641. [Google Scholar] [CrossRef]
- Karikari, B.; Chen, S.; Xiao, Y.; Chang, F.; Zhou, Y.; Kong, J.; Bhat, J.A.; Zhao, T. Utilization of interspecific high-density genetic map of RIL population for the QTL detection and candidate gene mining for 100-seed weight in soybean. Front. Plant Sci. 2019, 10, 1001. [Google Scholar] [CrossRef]
- Zhu, X.; Leiser, W.L.; Hahn, V.; Würschum, T. Identification of seed protein and oil related QTL in 944 RILs from a diallel of early-maturing European soybean. Crop J. 2021, 9, 238–247. [Google Scholar] [CrossRef]
- Hong, H.; Najafabadi, M.Y.; Torkamaneh, D.; Rajcan, I. Identification of quantitative trait loci associated with seed quality traits between Canadian and Ukrainian mega-environments using genome-wide association study. Theor. Appl. Genet. 2022, 135, 2515–2530. [Google Scholar] [CrossRef] [PubMed]
- Kulkarni, K.P.; Asekova, S.; Lee, D.; Bilyeu, K.; Song, J.T.; Lee, J. Mapping QTLs for 100-seed weight in an interspecific soybean cross of williams 82 (Glycine max) and PI 366121 (Glycine soja). Crop Pasture Sci. 2017, 68, 148–155. [Google Scholar] [CrossRef]
- Kumar, R.; Saini, M.; Taku, M.; Debbarma, P.; Mahto, R.K.; Ramlal, A.; Sharma, D.; Rajendran, R.; Gaikwad, K.; Lal, S.K.; et al. Identification of quantitative trait loci (QTLs) and candidate genes for seed shape and 100-seed weight in soybean [Glycine max (L) Merr]. Front. Plant Sci. 2023, 4, 1074245. [Google Scholar] [CrossRef] [PubMed]
- Akond, M.; Yuan, J.; Liu, S.; Kantartzi, S.K.; Meksem, K.; Bellaloui, N.; Lightfoot, D.A.; Kassem, M.A. Detection of QTL underlying seed quality components in soybean [Glycine max (L.) Merr.]. Can. J. Plant Sci. 2018, 98, 881–888. [Google Scholar] [CrossRef]
- Sun, Y.Q.; Tian, R.; Shao, Z.Q.; Chen, S.L.; Zhang, H.; Jin, Y.; Li, W.; Kong, Y.; Du, H.; Li, X.; et al. Mining of quantitative trait loci and candidate genes for seed size and shape across multiple environments in soybean (Glycine max). Plant Breed. 2021, 140, 1058–1069. [Google Scholar] [CrossRef]
- Yao, D.; Zhao, Q.Z.; Li, T.T.; Wang, J.X.; Wang, L.X.; Liu, Y.X.; Hao, W.Y.; Liu, H.J. Genetic Analysis and Quantitative Trait Locus Mapping using the Major Gene Plus Polygene Model for Soybean [Glycine max (L.) Merr.] Main Quality Trait. Legume Res. 2023, 46, 18–24. [Google Scholar] [CrossRef]
- Wu, D.; Li, C.; Jing, Y.; Wang, J.; Zhao, X.; Han, Y. Identification of quantitative trait loci underlying soybean (Glycine max) 100-seed weight under different levels of phosphorus fertilizer application. Plant Breed. 2020, 139, 959–968. [Google Scholar] [CrossRef]
- Zhang, H.; Hao, D.; Sitoe, H.M.; Yin, Z.; Hu, Z.; Zhang, G.; Yu, D. Genetic dissection of the relationship between plant architecture and yield component traits in soybean (Glycine max) by association analysis across multiple environments. Plant Breed. 2015, 134, 564–572. [Google Scholar] [CrossRef]
- Hu, Z.; Zhang, D.; Zhang, G.; Kan, G.; Hong, D.; Yu, D. Association mapping of yield-related traits and SSR markers in wild soybean (Glycine soja Sieb. and Zucc.). Breed. Sci. 2014, 63, 441–449. [Google Scholar] [CrossRef] [PubMed]
- Hina, A.; Cao, Y.; Song, S.; Li, S.; Sharmin, R.A.; Elattar, M.A.; Bhat, J.A.; Zhao, T. High-resolution mapping in two ril populations refines major “QTL Hotspot” regions for seed size and shape in soybean (Glycine max L.). Int. J. Mol. Sci. 2020, 21, 1040. [Google Scholar] [CrossRef] [PubMed]
- Li, Y.H.; Reif, J.C.; Ma, Y.S.; Hong, H.L.; Liu, Z.X.; Chang, R.Z.; Qiu, L.J. Targeted association mapping demonstrating the complex molecular genetics of fatty acid formation in soybean. BMC Genomics 2015, 16, 841. [Google Scholar] [CrossRef] [PubMed]
- Whiting, R.M.; Torabi, S.; Lukens, L.; Eskandari, M. Genomic regions associated with important seed quality traits in food-grade soybeans. BMC Plant Biol. 2020, 20, 485. [Google Scholar] [CrossRef]
- Bandillo, N.; Jarquin, D.; Song, Q.; Nelson, R.; Cregan, P.; Specht, J.; Lorenz, A. A population structure and genome-wide association analysis on the USDA soybean germplasm collection. Plant Genome 2015, 8, 1–13. [Google Scholar] [CrossRef] [PubMed]
- Yao, Y.; You, Q.; Duan, G.; Ren, J.; Chu, S.; Zhao, J.; Li, X.; Zhou, X.; Jiao, Y. Quantitative trait loci analysis of seed oil content and composition of wild and cultivated soybean. BMC Plant Biol. 2020, 20, 51. [Google Scholar] [CrossRef]
- Priolli, R.H.G.; Campos, J.B.; Stabellini, N.S.; Pinheiro, J.B.; Vello, N.A. Association mapping of oil content and fatty acid components in soybean. Euphytica 2015, 203, 83–96. [Google Scholar] [CrossRef]
- Liu, X.; Zhou, Y.; Chen, K.; Xiao, Z.; Liang, X.; Lu, D. Phosphorylation status of CPK28 affects its ubiquitination and protein stability. New Phytol. 2023, 237, 1270–1284. [Google Scholar] [CrossRef]
- Waidmann, S.; Kusenda, B.; Mayerhofer, J.; Mechtler, K.; Jonak, C. A DEK domain-containing protein modulates chromatin structure and function in Arabidopsis. Plant Cell 2014, 26, 4328–4344. [Google Scholar] [CrossRef]
- Xu, D.; Liu, Q.; Chen, G.; Yan, Z.; Hu, H. Aldehyde dehydrogenase ALDH3F1 involvement in flowering time regulation through histone acetylation modulation on FLOWERING LOCUS C. J. Integr. Plant Biol. 2020, 62, 1080–1092. [Google Scholar] [CrossRef] [PubMed]
- Stahl, E.; Fernandez Martin, A.; Glauser, G.; Guillou, M.C.; Aubourg, S.; Renou, J.P.; Reymond, P. The MIK2SCOOP signaling system contributes to Arabidopsis resistance against herbivory by modulating Jasmonate and indole Glucosinolate biosynthesis. Front. Plant Sci. 2022, 13, 852808. [Google Scholar] [CrossRef] [PubMed]
- Bach-Pages, M.; Homma, F.; Kourelis, J.; Kaschani, F.; Mohammed, S.; Kaiser, M.; van der Hoorn, R.A.L.; Castello, A.; Preston, G.M. Discovering the RNA-Binding Proteome of Plant Leaves with an Improved RNA Interactome Capture Method. Biomolecules 2020, 10, 661. [Google Scholar] [CrossRef] [PubMed]
- Depuydt, T.; Vandepoele, K. Multi-omics network-based functional annotation of unknown Arabidopsis genes. Plant J. 2021, 108, 1193–1212. [Google Scholar] [CrossRef]
- McBride, Z.; Chen, D.; Reick, C.; Xie, J.; Szymanski, D.B. Global Analysis of Membrane-associated Protein Oligomerization Using Protein Correlation Profiling. Mol. Cell Proteom. 2017, 16, 1972–1989. [Google Scholar] [CrossRef] [PubMed]
- Kwon, Y.; Shen, J.B.; Lee, M.H.; Geem, K.R.; Jiang, L.W.; Hwang, I. AtCAP2 is crucial for lytic vacuole biogenesis during germination by positively regulating vacuolar protein trafficking. Proc. Natl. Acad. Sci. USA 2018, 115, E1675–E1683. [Google Scholar] [CrossRef]
- Mi, L.; Mo, A.; Yang, J.; Liu, H.; Ren, D.; Chen, W.; Long, H.; Jiang, N.; Zhang, T.; Lu, P. Arabidopsis Novel Microgametophyte Defective Mutant 1 is required for pollen viability via influencing intine development in Arabidopsis. Front. Plant Sci. 2022, 12, 814870. [Google Scholar] [CrossRef]
- Bruscalupi, G.; Di Micco, P.; Failla, C.M.; Pascarella, G.; Morea, V.; Saliola, M.; De Paolis, A.; Venditti, S.; Mauro, M.L. Arabidopsis thaliana Sirtuins Control Proliferation and Glutamate Dehydrogenase Activity. Plant Physiol. Biochem. 2023, 194, 236–245. [Google Scholar] [CrossRef]
- Peng, H.; Neff, M.M. Two ATAF transcription factors ANAC102 and ATAF1 contribute to the suppression of cytochrome P450-mediated brassinosteroid catabolism in Arabidopsis. Physiol. Plantarum. 2021, 172, 1493–1505. [Google Scholar] [CrossRef]
- Huh, S.U. PopP2 interacts with PAD4 in an acetyltransferase activity-dependent manner and affects plant immunity. Plant Signal Behav. 2022, 16, 236–245. [Google Scholar] [CrossRef]
- Wang, L.; Wang, Y.; Chang, H.; Ren, H.; Wu, X.; Wen, J.; Guan, Z.; Ma, L.; Qiu, L.; Yan, J.; et al. RUP2 facilitates UVR8 redimerization via two interfaces. Plant Commun. 2023, 4, 100428. [Google Scholar] [CrossRef] [PubMed]
- Lee, T.A.; Bailey-Serres, J. Integrative analysis from the epigenome to translatome uncovers patterns of dominant nuclear regulation during transient stress. Plant Cell 2019, 31, 2573–2595. [Google Scholar] [CrossRef]
- Zhang, X.; Wu, S.; Liu, S.; Takano, T. The Arabidopsis sucrose non-fermenting-1-related protein kinase AtSnRK2.4 interacts with a transcription factor, AtMYB21, that is involved in salt tolerance. Plant Sci. 2021, 303, 110685. [Google Scholar] [CrossRef] [PubMed]
- Zhu, P.; Lister, C.; Dean, C. Cold-induced Arabidopsis FRIGIDA nuclear condensates for FLC repression. Nature 2021, 599, 657–661. [Google Scholar] [CrossRef] [PubMed]
- Liu, Z.; Guo, C.; Wu, R.; Hu, Y.; Zhou, Y.; Wang, J.; Yu, X.; Zhang, Y.; Bawa, G.; Sun, X. FLS2-RBOHD-PIF4 module regulates plant response to drought and salt stress. Int. J. Mol. Sci. 2022, 23, 1080. [Google Scholar] [CrossRef]
- McWhite, C.D.; Papoulas, O.; Drew, K.; Cox, R.M.; June, V.; Dong, O.X.; Kwon, T.; Wan, C.; Salmi, M.L.; Roux, S.J.; et al. A pan-plant protein complex map reveals deep conservation and novel assemblies. Cell 2020, 181, 460–474.e14. [Google Scholar] [CrossRef]
- Zhang, Z.S.; Xiao, Y.H.; Luo, M.; Li, X.B.; Luo, X.Y.; Hou, L.; Li, D.M.; Pei, Y. Construction of a genetic linkage map and QTL analysis of fiber-related traits in upland cotton (Gossypium hirsutum L). Euphytica 2005, 144, 91–99. [Google Scholar] [CrossRef]
- Song, Q.; Jia, G.; Zhu, Y.; Grant, D.; Nelson, R.T.; Hwang, E.Y.; Hyten, D.L.; Cregan, P.B. Abundance of SSR motifs and development of candidate polymorphic SSR markers (BARCSOYSSR_1.0) in soybean. Crop Sci. 2010, 50, 1950–1960. [Google Scholar] [CrossRef]
- Zhang, J.; Guo, W.; Zhang, T. Molecular linkage map of allotetraploid cotton (Gossypium hirsutum L. × Gossypium barbadense L.) with a haploid population. Theor. Appl. Genet. 2002, 105, 1166–1174. [Google Scholar] [CrossRef]
- Zhong, Q.; Zhou, P.; Yao, Q.; Mao, K. A novel segmentation algorithm for clustered slender-particles. Comput. Electron. Agric. 2009, 69, 118–127. [Google Scholar] [CrossRef]
- Kosambi, D.D. The estimation of map distance from recombination values. Ann. Eugen. 1944, 12, 172–175. [Google Scholar] [CrossRef]
- Voorrips, R.E. MapChart: Software for the Graphical Presentation of Linkage Maps and QTLs. J. Hered. 2002, 93, 77–78. [Google Scholar] [CrossRef]
- Said, J.I.; Song, M.; Wang, H.; Lin, Z.; Zhang, X.; Fang, D.D.; Zhang, J. A comparative meta-analysis of QTL between intraspecific Gossypium hirsutum and interspecific G. hirsutum × G. barbadense populations. Mol. Genet. Genom. 2015, 290, 1003–1025. [Google Scholar] [CrossRef]


| Traits | Env. | Parent | Population | ||||||||
|---|---|---|---|---|---|---|---|---|---|---|---|
| CJC2 | YSX2 | Mean | Min | Max | SD | Variance | CV (%) | Skewness | Kurtosis | ||
| HSW | 21CQ | 24.31 | 30.88 | 27.43 | 18.20 | 33.29 | 2.57 | 6.63 | 9.39 | 0.96 | −0.55 |
| 22CQ | 25.91 | 31.47 | 20.63 | 17.08 | 32.52 | 2.36 | 5.59 | 11.46 | −0.03 | −0.44 | |
| 22YN | 19.57 | 25.47 | 20.14 | 15.50 | 26.57 | 2.33 | 5.42 | 11.56 | −0.14 | 0.33 | |
| 23CQ | 26.25 | 32.73 | 27.37 | 16.71 | 36.50 | 4.93 | 24.31 | 18.01 | −1.17 | −0.13 | |
| SL | 21CQ | 9.71 | 8.82 | 10.13 | 8.58 | 11.82 | 0.53 | 0.28 | 5.20 | 1.31 | −0.17 |
| 22CQ | 9.70 | 8.98 | 9.13 | 7.66 | 11.03 | 0.57 | 0.32 | 6.22 | 1.02 | 0.32 | |
| 22YN | 8.13 | 7.59 | 8.02 | 7.14 | 8.78 | 0.36 | 0.13 | 4.49 | −0.53 | −0.12 | |
| 23CQ | 10.14 | 10.59 | 9.33 | 6.81 | 11.96 | 1.36 | 1.85 | 14.59 | −1.36 | −0.32 | |
| SW | 21CQ | 7.96 | 8.18 | 8.34 | 6.84 | 8.97 | 0.32 | 0.10 | 3.82 | 4.72 | −1.31 |
| 22CQ | 7.99 | 8.41 | 7.57 | 6.85 | 8.16 | 0.24 | 0.06 | 3.23 | 0.34 | −0.38 | |
| 22YN | 6.77 | 7.81 | 7.04 | 6.28 | 7.93 | 0.33 | 0.11 | 4.70 | −0.17 | 0.13 | |
| 23CQ | 8.12 | 9.16 | 7.71 | 5.14 | 9.14 | 1.15 | 1.33 | 14.94 | −1.37 | −0.52 | |
| SLW | 21CQ | 1.22 | 1.08 | 1.23 | 1.10 | 1.45 | 0.06 | 0.00 | 4.94 | 2.00 | 0.86 |
| 22CQ | 1.22 | 1.19 | 1.21 | 1.11 | 1.44 | 0.06 | 0.00 | 4.98 | 1.09 | 0.80 | |
| 22YN | 1.20 | 1.11 | 1.15 | 1.07 | 1.22 | 0.03 | 0.00 | 2.73 | −0.55 | 0.08 | |
| 23CQ | 1.25 | 1.16 | 1.27 | 1.15 | 1.53 | 0.10 | 0.01 | 7.76 | 0.22 | 1.01 | |
| OIL | 21CQ | 21.10 | 19.02 | 20.01 | 18.07 | 22.21 | 1.04 | 1.08 | 5.19 | −0.31 | 0.26 |
| 22CQ | 20.35 | 17.72 | 19.22 | 15.15 | 22.92 | 1.83 | 3.34 | 9.51 | −0.63 | 0.09 | |
| 22YN | 19.55 | 17.02 | 17.18 | 13.58 | 22.73 | 2.05 | 4.20 | 11.92 | −0.23 | 0.49 | |
| 23CQ | 22.19 | 20.55 | 21.03 | 19.20 | 23.61 | 0.81 | 0.66 | 3.85 | 0.95 | 0.42 | |
| PRO | 21CQ | 44.00 | 40.79 | 40.62 | 37.21 | 45.12 | 1.20 | 1.44 | 2.95 | 0.12 | 0.09 |
| 22CQ | 43.58 | 40.90 | 39.40 | 37.71 | 46.77 | 3.54 | 12.51 | 8.98 | 1.12 | −0.49 | |
| 22YN | 43.08 | 41.11 | 43.21 | 38.10 | 46.00 | 1.96 | 3.86 | 4.55 | −0.02 | −0.54 | |
| 23CQ | 43.70 | 41.61 | 44.37 | 41.24 | 45.76 | 1.15 | 1.33 | 2.59 | −0.06 | −0.25 | |
| OA | 21CQ | 38.12 | 23.56 | 35.49 | 19.70 | 56.91 | 8.20 | 67.16 | 23.09 | −0.39 | 0.14 |
| 22CQ | 33.26 | 25.90 | 31.80 | 19.61 | 44.87 | 4.82 | 23.19 | 15.15 | 0.37 | 0.02 | |
| 22YN | 24.49 | 20.23 | 20.64 | 17.23 | 31.58 | 2.37 | 5.60 | 11.47 | 4.46 | 1.55 | |
| 23CQ | 38.42 | 30.42 | 35.08 | 27.17 | 49.57 | 4.05 | 16.38 | 11.54 | 1.54 | 0.90 | |
| LA | 21CQ | 45.88 | 53.72 | 46.01 | 20.78 | 64.43 | 9.55 | 91.23 | 20.76 | −0.37 | −0.18 |
| 22CQ | 48.97 | 54.21 | 49.94 | 35.26 | 62.67 | 5.33 | 28.41 | 10.67 | 0.19 | −0.11 | |
| 22YN | 48.16 | 52.67 | 53.12 | 43.22 | 56.34 | 1.84 | 3.39 | 3.47 | 13.24 | −2.90 | |
| 23CQ | 41.43 | 48.02 | 43.40 | 32.58 | 48.30 | 2.68 | 7.17 | 6.17 | 2.38 | −1.02 | |
| LNA | 21CQ | 5.79 | 3.99 | 4.36 | 2.66 | 6.96 | 0.90 | 0.80 | 20.53 | 0.17 | 0.66 |
| 22CQ | 4.68 | 3.82 | 4.12 | 2.98 | 5.33 | 0.41 | 0.17 | 9.99 | 0.76 | 0.04 | |
| 22YN | 9.42 | 7.96 | 10.23 | 7.62 | 13.51 | 1.37 | 1.87 | 13.36 | −0.53 | 0.26 | |
| 23CQ | 9.69 | 8.60 | 10.61 | 7.82 | 13.73 | 1.18 | 1.39 | 11.12 | −0.10 | −0.13 | |
| PA | 21CQ | 12.25 | 12.00 | 11.64 | 9.68 | 13.49 | 0.85 | 0.72 | 7.27 | −0.48 | −0.18 |
| 22CQ | 11.32 | 11.22 | 11.75 | 10.15 | 12.78 | 0.46 | 0.21 | 3.94 | 0.93 | −0.55 | |
| 22YN | 11.62 | 11.35 | 12.26 | 11.04 | 13.77 | 0.65 | 0.43 | 5.32 | −0.77 | 0.22 | |
| 23CQ | 14.79 | 14.40 | 14.85 | 13.69 | 16.43 | 0.52 | 0.27 | 3.52 | −0.05 | 0.33 | |
| SA | 21CQ | 2.98 | 2.17 | 2.42 | 2.00 | 3.14 | 0.25 | 0.06 | 10.21 | −0.04 | 0.67 |
| 22CQ | 2.57 | 2.05 | 2.21 | 1.80 | 2.67 | 0.19 | 0.04 | 8.77 | −0.33 | 0.04 | |
| 22YN | 4.31 | 2.88 | 3.64 | 2.73 | 5.77 | 0.53 | 0.28 | 14.43 | 2.81 | 1.02 | |
| 23CQ | 4.57 | 2.91 | 3.86 | 2.08 | 7.47 | 0.85 | 0.73 | 22.09 | 2.88 | 1.10 | |
| Chromosome | Groups | Makers | Total Interval (cM) | Average Interval (cM) | Minimum Interval (cM) |
|---|---|---|---|---|---|
| 1 | 1 | 26 | 155.7 | 5.99 | 0.3 |
| 2 | 1 | 23 | 141.7 | 6.16 | 0.6 |
| 3 | 1 | 16 | 87.1 | 5.44 | 0.5 |
| 4 | 1 | 16 | 115.6 | 7.23 | 0.5 |
| 5 | 1 | 7 | 29.8 | 4.26 | 0.5 |
| 6 | 1 | 18 | 102.2 | 5.68 | 1.3 |
| 7 | 1 | 31 | 189.1 | 6.10 | 0.5 |
| 8 | 1 | 36 | 188.6 | 5.24 | 1.1 |
| 9 | 1 | 18 | 63.8 | 3.54 | 0.3 |
| 10 | 1 | 17 | 89.2 | 5.25 | 0.8 |
| 11 | 1 | 25 | 118.8 | 4.75 | 0.5 |
| 12 | 1 | 14 | 124.8 | 8.91 | 1.4 |
| 13 | 1 | 44 | 200.3 | 4.55 | 0.8 |
| 14 | 1 | 28 | 103.5 | 3.70 | 0.6 |
| 15 | 1 | 17 | 43.8 | 2.58 | 0.3 |
| 16 | 1 | 25 | 122.8 | 4.91 | 0.5 |
| 17 | 1 | 29 | 123.6 | 4.26 | 0.2 |
| 18 | 1 | 19 | 143.7 | 7.56 | 1 |
| 19 | 1 | 22 | 167.3 | 7.60 | 1.4 |
| 20 | 1 | 14 | 64.2 | 4.59 | 1.6 |
| QTL | Env. a | Chr. | Nearest Marker | Interval (cM) | LOD | PVE (%) b | Additive | Dominance |
|---|---|---|---|---|---|---|---|---|
| HSW02.1 | 23CQ | 2 | SWU02028 | 0–14.83 | 4.11 | 9.70 | −2.06 | 2.53 |
| HSW03.1 | 22YN | 3 | SWU03118 | 48.73–50.67 | 3.25 | 7.70 | −0.65 | −0.88 |
| HSW06.1 | 22YN | 6 | SWU06148 | 0–4.85 | 5.34 | 12.40 | −1.15 | 1.04 |
| HSW07.1 | 21CQ | 7 | SWU07085 | 98.67–108.68 | 5.34 | 12.40 | −1.37 | 0.85 |
| HSW09.1 | 22YN | 9 | SWU09085 | 49.26–53.59 | 3.41 | 8.10 | −0.42 | −1.40 |
| HSW12.1 | 22CQ | 12 | SWU12121 | 9.13–21.38 | 5.95 | 13.70 | 1.30 | −0.57 |
| HSW13.1 | 22CQ | 13 | SWU13152 | 147.09–157.11 | 3.86 | 9.10 | 1.10 | 0.42 |
| 23CQ | 13 | satt490 | 147.09–157.11 | 4.35 | 10.20 | 2.51 | 3.06 | |
| HSW16.1 | 22YN | 16 | SWU16092 | 75.96–82.16 | 5.23 | 12.10 | 1.25 | −0.98 |
| 23CQ | 16 | SWU16084 | 75.96–82.16 | 3.89 | 9.20 | −2.50 | −0.03 | |
| HSW18.1 | 22CQ | 18 | SWU18040 | 60.78–61.97 | 3.09 | 7.40 | −0.26 | −1.29 |
| HSW19.1 | 23CQ | 19 | SWU19022 | 19.68–27.80 | 7.51 | 17.00 | −4.45 | 5.69 |
| HSW19.2 | 23CQ | 19 | SWU19114 | 117.40–147.10 | 3.78 | 8.90 | 1.27 | 2.48 |
| SW01.1 | 23CQ | 1 | SWU01124 | 81.74–100.00 | 3.59 | 8.50 | −0.24 | 0.61 |
| SW02.1 | 23CQ | 2 | SWU02028 | 0–12.09 | 4.22 | 9.90 | −0.53 | 0.53 |
| SW03.1 | 22YN | 3 | SWU03118 | 48.73–51.70 | 3.54 | 8.40 | −0.07 | −0.16 |
| SW03.2 | 23CQ | 3 | sat304 | 53.84–73.95 | 3.49 | 8.30 | 0.01 | 1.08 |
| SW04.1 | 22YN | 4 | Sat337 | 0–3.54 | 3.03 | 7.20 | 0.11 | 0.06 |
| SW05.1 | 22CQ | 5 | SWU05120 | 0–29.85 | 3.89 | 9.20 | −0.11 | 0.04 |
| SW06.1 | 21CQ | 6 | Sat402 | 0–3.85 | 4.74 | 11.10 | −0.13 | 0.20 |
| 22YN | 6 | SWU06148 | 0–3.85 | 4.08 | 9.60 | −0.16 | 0.10 | |
| SW07.1 | 22CQ | 7 | Sat224 | 34.22–52.45 | 3.18 | 7.60 | 0.11 | 0.41 |
| SW09.1 | 22YN | 9 | SWU09085 | 39.26–53.59 | 4.54 | 10.60 | −0.06 | −0.23 |
| SW13.1 | 22CQ | 13 | SWU13100 | 111.98–140.48 | 3.71 | 8.80 | 0.14 | −0.04 |
| SW13.2 | 22YN | 13 | satt656 | 190.37–199.50 | 4.96 | 11.60 | −0.08 | −0.26 |
| SW13.3 | 23CQ | 13 | SWU13171 | 170.28–183.00 | 4.49 | 10.50 | 0.51 | 0.59 |
| SW14.1 | 21CQ | 14 | Sat177 | 79.69–103.47 | 3.54 | 8.40 | −0.11 | −0.01 |
| 23CQ | 14 | sat342 | 79.69–103.47 | 3.68 | 8.70 | 0.60 | 0.83 | |
| SW16.1 | 22YN | 16 | SWU16092 | 73.96–84.16 | 4.88 | 11.40 | 0.15 | −0.18 |
| 23CQ | 16 | SWU16084 | 73.96–84.16 | 4.49 | 10.50 | −0.61 | −0.05 | |
| SW17.1 | 22YN | 17 | SWU17108 | 81.57–94.16 | 3.84 | 9.10 | 0.15 | −0.05 |
| SW19.1 | 23CQ | 19 | SWU19022 | 18.68–27.80 | 9.07 | 20.10 | −1.17 | 1.39 |
| SW20.1 | 21CQ | 20 | SWU20097 | 8.33–27.47 | 3.82 | 9.00 | −0.07 | 0.18 |
| SL01.1 | 22YN | 1 | SWU01142 | 136.71–155.66 | 3.55 | 8.40 | −0.16 | −0.03 |
| SL02.1 | 23CQ | 2 | SWU02028 | 0–12.09 | 4.16 | 9.80 | −0.60 | 0.59 |
| SL03.1 | 23CQ | 3 | sat304 | 53.20–72.95 | 3.48 | 8.30 | 0.00 | 1.23 |
| SL04.1 | 22YN | 4 | SWU04016 | 0–17.21 | 3.68 | 8.70 | 0.12 | 0.08 |
| SL06.1 | 22YN | 6 | sat402 | 17.24–32.59 | 3.47 | 8.20 | −0.18 | 0.16 |
| SL07.1 | 22YN | 7 | SWU07116 | 135.46–169.63 | 3.83 | 9.00 | 0.17 | 0.06 |
| SL12.1 | 22CQ | 12 | SWU12121 | 7.13–26.38 | 5.01 | 11.70 | 0.31 | 0.03 |
| SL13.1 | 21CQ | 13 | SWU13169 | 170.94–183.00 | 3.15 | 7.50 | −0.20 | 0.09 |
| 23CQ | 13 | SWU13171 | 170.94–183.00 | 4.38 | 10.30 | 0.60 | 0.62 | |
| SL13.2 | 22CQ | 13 | satt145 | 0–11.53 | 3.21 | 7.60 | 0.27 | 0.04 |
| SL14.1 | 22CQ | 14 | sat287 | 55.99–77.10 | 3.58 | 8.50 | −0.31 | −0.30 |
| SL16.1 | 22CQ | 16 | sat393(16) | 112.63–122.80 | 5.09 | 11.80 | 0.47 | 0.01 |
| SL16.2 | 22YN | 16 | Sat165 | 75.96–82.16 | 5.14 | 12.00 | 0.20 | 0.07 |
| 23CQ | 16 | SWU16084 | 75.96–82.16 | 4.01 | 9.50 | −0.66 | −0.04 | |
| SL17.1 | 22YN | 17 | SWU17108 | 84.57–98.17 | 3.92 | 9.20 | 0.17 | −0.07 |
| SL19.1 | 23CQ | 19 | SWU19022 | 20.10–27.80 | 6.63 | 15.10 | −1.15 | 1.39 |
| SL19.2 | 23CQ | 19 | SWU19114 | 119.40–144.10 | 5.35 | 12.40 | 0.44 | 0.71 |
| SLW2.1 | 23CQ | 2 | SWU02028 | 0–11.09 | 3.57 | 8.50 | 0.05 | −0.04 |
| SLW2.2 | 22YN | 2 | SWU02070 | 38.59–62.68 | 4.02 | 9.50 | −0.02 | 0.00 |
| SLW5.1 | 22YN | 5 | SWU05124 | 15.03–29.30 | 3.52 | 8.30 | 0.01 | 0.01 |
| SLW6.1 | 22CQ | 6 | SWU06068 | 28.95–54.29 | 4.80 | 11.20 | 0.04 | 0.01 |
| SLW7.1 | 22CQ | 7 | SWU07099 | 103.86–119.01 | 5.04 | 11.70 | −0.03 | −0.01 |
| SLW8.1 | 23CQ | 8 | SWU08088 | 114.24–116.38 | 3.35 | 8.00 | 0.01 | −0.07 |
| SLW12.1 | 22CQ | 12 | SWU12121 | 10.13–19.38 | 3.29 | 7.80 | 0.03 | 0.00 |
| SLW13.1 | 22YN | 13 | SWU13058 | 35.10–54.76 | 3.84 | 9.10 | −0.01 | 0.00 |
| SLW13.2 | 22YN | 13 | SWU13177 | 193.57–200.33 | 5.46 | 12.60 | 0.01 | 0.02 |
| SLW14.1 | 23CQ | 14 | sat342 | 81.06–88.62 | 3.63 | 8.60 | −0.05 | −0.08 |
| SLW14.2 | 22CQ | 14 | SWU14057 | 32.82–33.53 | 3.09 | 7.40 | −0.02 | −0.02 |
| SLW14.3 | 22CQ | 14 | SWU14041 | 39.03–41.42 | 3.04 | 7.30 | −0.02 | −0.01 |
| SLW15.1 | 21CQ | 15 | SWU15051 | 0–11.66 | 5.92 | 13.60 | 0.01 | −0.04 |
| SLW16.1 | 22YN | 16 | SWU16116 | 102.66–121.54 | 4.42 | 10.40 | 0.01 | 0.02 |
| 22CQ | 16 | SWU16116 | 102.66–121.54 | 4.74 | 11.10 | 0.04 | 0.02 | |
| SLW17.1 | 23CQ | 17 | satt615 | 98.15–123.61 | 3.39 | 8.00 | 0.05 | −0.03 |
| SLW17.2 | 22YN | 17 | SWU17071 | 40.76–59.74 | 4.57 | 10.70 | −0.01 | 0.02 |
| SLW18.1 | 22YN | 18 | SWU18042 | 64.97–74.84 | 4.03 | 9.50 | 0.00 | 0.02 |
| SLW19.1 | 23CQ | 19 | SWU19022 | 19.68–27.10 | 7.92 | 17.80 | 0.11 | −0.12 |
| SLW20.1 | 22YN | 20 | SWU20103 | 32.47–40.49 | 3.74 | 8.90 | −0.01 | 0.02 |
| QTL | Env. a | Chr. | Nearest Maker | Interval (cM) | LOD | PVE (%) b | Additive | Dominance |
|---|---|---|---|---|---|---|---|---|
| qOIL01.1 | 22CQ | 1 | SWU01100 | 66.68–69.54 | 3.68 | 8.70 | 0.60 | 0.30 |
| qOIL01.2 | 23CQ | 1 | SWU01062 | 42.80–55.42 | 7.58 | 17.10 | 0.45 | 0.33 |
| qOIL02.1 | 22CQ | 2 | SWU02101 | 59.00–69.90 | 4.32 | 10.10 | −0.86 | −0.18 |
| qOIL04.1 | 21CQ | 4 | SWU04058 | 41.77–50.32 | 3.42 | 10.80 | −0.40 | −0.36 |
| 22YN | 4 | SWU04058 | 48.77–55.32 | 3.29 | 8.10 | −0.31 | 1.02 | |
| qOIL05.1 | 21CQ | 5 | SWU05120 | 7.22–18.03 | 5.17 | 15.80 | −0.63 | 0.28 |
| qOIL05.2 | 22CQ | 5 | SWU05127 | 29.21–29.85 | 3.75 | 8.90 | −0.83 | −0.70 |
| qOIL06.1 | 22YN | 6 | satt708 | 7.14–22.95 | 4.70 | 11.30 | 0.09 | 1.68 |
| qOIL06.2 | 22CQ | 6 | SWU06057 | 46.16–58.44 | 5.68 | 13.10 | −0.66 | 0.75 |
| qOIL06.3 | 23CQ | 6 | SWU06068 | 28.95–41.88 | 3.72 | 8.80 | −0.47 | −0.09 |
| qOIL07.1 | 22CQ | 7 | sat258 | 63.78–70.85 | 3.81 | 9.00 | −1.19 | −0.01 |
| qOIL08.1 | 22YN | 8 | SWU08013 | 0–3.68 | 3.05 | 7.50 | −0.69 | 1.08 |
| qOIL09.1 | 23CQ | 9 | SWU09043 | 10.54–24.61 | 3.26 | 7.70 | 0.27 | −0.22 |
| qOIL10.1 | 22CQ | 10 | SWU10022 | 0–11.43 | 4.15 | 9.80 | −0.41 | −0.96 |
| qOIL12.1 | 22CQ | 12 | SWU12025 | 101.22–115.48 | 4.45 | 10.40 | 0.67 | 0.42 |
| qOIL12.2 | 23CQ | 12 | SWU12133 | 0–6.00 | 3.65 | 8.60 | 0.16 | −0.53 |
| qOIL13.1 | 22CQ | 13 | SWU13058 | 35.10–55.76 | 4.45 | 10.40 | 0.38 | 1.06 |
| qOIL14.1 | 22CQ | 14 | sat342 | 80.06–88.62 | 6.71 | 15.30 | 0.62 | 1.83 |
| qOIL17.1 | 22CQ | 17 | SWU17092 | 61.74–80.09 | 3.92 | 9.20 | −0.23 | 1.02 |
| qOIL18.1 | 22YN | 18 | SWU18060 | 90.66–107.66 | 3.64 | 8.90 | 0.10 | 1.20 |
| qOIL19.1 | 22YN | 19 | SWU19070 | 56.90–66.42 | 4.35 | 10.50 | −0.73 | 1.11 |
| qOIL20.1 | 21CQ | 20 | SWU20113 | 53.96–60.56 | 3.33 | 10.50 | −0.39 | 0.42 |
| qPRO01.1 | 22CQ | 1 | SWU01093 | 57.68–68.28 | 3.23 | 8.20 | 0.79 | −1.89 |
| qPRO02.1 | 23CQ | 2 | SWU02107 | 86.85–98.01 | 3.87 | 9.10 | 0.15 | 0.77 |
| qPRO03.1 | 23CQ | 3 | satt521 | 27.86–48.73 | 5.13 | 11.90 | 0.42 | 0.88 |
| qPRO05.1 | 22YN | 5 | SWU05120 | 15.03–26.03 | 3.01 | 7.90 | −0.53 | −1.06 |
| qPRO07.1 | 22CQ | 7 | SWU07142 | 180.73–186.49 | 3.48 | 8.80 | −0.71 | −2.00 |
| qPRO08.1 | 22YN | 8 | SWU08085 | 105.28–115.38 | 3.46 | 9.00 | −0.37 | −0.94 |
| qPRO13.1 | 22YN | 13 | SWU13058 | 28.10–44.76 | 4.83 | 12.40 | −0.82 | −0.60 |
| qPRO13.2 | 22CQ | 13 | SWU13176 | 193.02–198.13 | 3.32 | 8.40 | 0.48 | −2.17 |
| qPRO13.3 | 23CQ | 13 | SWU13100 | 103.77–126.97 | 7.85 | 17.70 | 0.87 | 0.63 |
| qPRO17.1 | 22CQ | 17 | SWU17064 | 28.32–36.09 | 3.58 | 9.00 | 1.75 | 0.62 |
| qPRO17.2 | 23CQ | 17 | SWU17080 | 49.96–61.74 | 4.52 | 10.60 | 0.59 | 0.10 |
| qPRO18.1 | 22CQ | 18 | SWU18062 | 108.60–117.26 | 4.72 | 11.70 | −0.38 | −2.51 |
| qPRO18.2 | 23CQ | 18 | SWU18023 | 4.00–35.26 | 3.00 | 7.20 | 0.55 | 0.55 |
| qPA01.1 | 22CQ | 1 | SWU01062 | 50.80–55.68 | 3.17 | 7.50 | −0.07 | 0.26 |
| qPA01.2 | 22YN | 1 | sat414 | 139.34–149.34 | 3.56 | 9.10 | −0.48 | −0.05 |
| qPA02.1 | 22YN | 2 | SWU02041 | 14.83–28.85 | 4.01 | 10.20 | −0.48 | −0.06 |
| qPA03.1 | 23CQ | 3 | satt521 | 28.86–46.73 | 4.27 | 10.00 | −0.11 | −0.40 |
| qPA04.1 | 22CQ | 4 | SWU04038 | 17.21–32.18 | 3.87 | 9.10 | 0.17 | 0.10 |
| 22YN | 4 | sat140 | 15.54–28.18 | 4.34 | 11.00 | −0.03 | 0.85 | |
| qPA05.1 | 22CQ | 5 | SWU05120 | 15.03–22.03 | 3.45 | 8.20 | −0.19 | 0.07 |
| qPA06.1 | 22CQ | 6 | SWU06068 | 32.59–40.88 | 5.64 | 13.00 | −0.29 | 0.08 |
| qPA07.1 | 23CQ | 7 | SWU07100 | 74.85–112.84 | 4.83 | 11.30 | 0.17 | −0.28 |
| qPA08.1 | 22CQ | 8 | SWU08122 | 138.70–145.64 | 3.58 | 8.50 | 0.19 | −0.21 |
| qPA13.1 | 21CQ | 13 | sat133 | 52.76–72.39 | 5.45 | 12.60 | 0.18 | 0.96 |
| qPA14.1 | 21CQ | 14 | SWU14035 | 38.03–52.44 | 3.77 | 8.90 | −0.08 | 0.68 |
| qPA16.1 | 23CQ | 16 | SWU16082 | 65.28–74.96 | 3.39 | 8.00 | −0.15 | −0.16 |
| qPA17.1 | 22YN | 17 | SWU17117 | 93.10–94.66 | 3.53 | 9.00 | 0.42 | −0.45 |
| qPA18.1 | 22YN | 18 | SWU18061 | 106.66–109.60 | 3.49 | 8.90 | 0.00 | 0.58 |
| qPA20.1 | 23CQ | 20 | SWU20113 | 56.96–61.31 | 5.87 | 13.50 | 0.18 | −0.33 |
| qSA01.1 | 22CQ | 1 | SWU01120 | 75.18–75.74 | 3.27 | 7.80 | 0.07 | 0.01 |
| qSA01.2 | 23CQ | 1 | SWU01062 | 33.22–60.68 | 3.84 | 9.10 | 0.12 | 0.53 |
| qSA02.1 | 22CQ | 2 | SWU02041 | 19.81–26.85 | 4.99 | 11.60 | 0.10 | 0.01 |
| qSA03.1 | 22YN | 3 | SWU03118 | 43.81–52.20 | 4.60 | 11.60 | 0.26 | −0.06 |
| qSA03.2 | 23CQ | 3 | SWU03114 | 21.05–29.86 | 6.52 | 14.90 | −0.51 | −0.26 |
| qSA03.2 | 22CQ | 3 | SWU03119 | 53.84–66.95 | 3.60 | 8.50 | 0.02 | −0.11 |
| qSA04.1 | 22CQ | 4 | SWU04133 | 108.48–114.42 | 4.10 | 9.70 | 0.02 | −0.13 |
| qSA05.1 | 21CQ | 5 | SWU05120 | 7.22–17.03 | 6.34 | 14.50 | −0.15 | 0.06 |
| qSA05.2 | 22YN | 5 | SWU05127 | 28.21–29.85 | 6.96 | 17.00 | 0.26 | −0.38 |
| qSA07.1 | 22CQ | 7 | SWU07099 | 111.84–116.01 | 3.55 | 8.40 | −0.04 | −0.10 |
| qSA07.2 | 22CQ | 7 | SWU07158 | 185.49–189.10 | 5.04 | 11.70 | −0.05 | −0.11 |
| qSA08.1 | 22YN | 8 | sat406 | 13.07–24.83 | 5.60 | 13.90 | 0.24 | −0.32 |
| qSA09.1 | 22YN | 9 | SWU09126 | 62.18–63.81 | 3.42 | 8.70 | 0.25 | −0.19 |
| qSA11.1 | 22YN | 11 | sat272 | 9.79–25.57 | 4.72 | 11.90 | −0.07 | −0.38 |
| qSA12.1 | 22CQ | 12 | SWU12009 | 113.48–120.74 | 3.61 | 8.60 | 0.08 | −0.05 |
| qSA12.2 | 23CQ | 12 | SWU12133 | 0–7.13 | 3.01 | 7.20 | −0.01 | −0.54 |
| qSA13.1 | 21CQ | 13 | SWU13078 | 69.39–76.17 | 3.30 | 7.80 | 0.02 | 0.13 |
| qSA13.2 | 22YN | 13 | SWU13169 | 180.83–186.37 | 6.34 | 15.60 | 0.35 | −0.11 |
| qSA13.3 | 22CQ | 13 | SWU13176 | 192.75–198.13 | 4.77 | 11.10 | 0.01 | −0.14 |
| qSA14.1 | 22YN | 14 | SWU14047 | 35.53–39.42 | 4.15 | 10.50 | 0.18 | −0.29 |
| qSA14.2 | 21CQ | 14 | SWU14005 | 95.38–101.56 | 3.95 | 9.30 | −0.01 | 0.18 |
| 22CQ | 14 | sat177 | 93.38–101.56 | 3.96 | 9.30 | 0.08 | −0.10 | |
| qSA16.1 | 22YN | 16 | SWU16067 | 40.12–44.39 | 4.10 | 10.40 | −0.23 | −0.11 |
| qSA17.1 | 22CQ | 17 | SWU17064 | 25.32–36.06 | 3.19 | 7.60 | 0.09 | 0.02 |
| qSA18.1 | 22YN | 18 | SWU18060 | 86.75–96.66 | 4.89 | 12.30 | −0.21 | −0.21 |
| qSA19.1 | 22CQ | 19 | SWU19070 | 61.82–65.42 | 3.54 | 8.40 | 0.04 | −0.11 |
| qSA19.2 | 22YN | 19 | SWU19089 | 102.43–114.40 | 6.70 | 16.40 | 0.10 | 0.35 |
| qSA20.1 | 22YN | 20 | SWU20054 | 6.65–10.33 | 6.31 | 15.50 | 0.33 | 0.05 |
| qOA01.1 | 23CQ | 1 | SWU01050 | 35.22–52.80 | 4.49 | 10.50 | 1.48 | 1.70 |
| qOA02.1 | 22CQ | 2 | SWU02058 | 39.49–40.49 | 3.13 | 7.50 | 2.57 | −2.32 |
| qOA04.1 | 22YN | 4 | SWU04126 | 91.774–100.61 | 3.69 | 9.40 | 0.24 | 1.42 |
| 23CQ | 4 | SWU04126 | 87.774–101.61 | 3.80 | 9.00 | 1.69 | 1.06 | |
| qOA05.1 | 21CQ | 5 | SWU05120 | 7.22–18.03 | 3.55 | 8.40 | −3.85 | −3.06 |
| qOA05.2 | 22CQ | 5 | SWU05124 | 23.027–29.304 | 4.88 | 11.40 | −2.55 | −1.09 |
| qOA06.1 | 21CQ | 6 | SWU06074 | 29.954–36.592 | 3.06 | 7.30 | 2.59 | 0.89 |
| 22CQ | 6 | SWU06068 | 34.592–46.162 | 3.35 | 8.00 | −2.47 | −0.33 | |
| qOA07.1 | 21CQ | 7 | SWU07073 | 72.85–83.506 | 3.12 | 7.40 | −0.81 | −4.65 |
| qOA08.1 | 22YN | 8 | SWU08154 | 148.482–150.584 | 3.52 | 9.00 | 1.18 | −0.57 |
| qOA13.1 | 22CQ | 13 | SWU13084 | 78.271–87.767 | 4.21 | 9.90 | 2.56 | −1.18 |
| qOA13.2 | 21CQ | 13 | SWU13152 | 157.105–166.515 | 3.44 | 8.20 | 2.73 | 1.70 |
| qOA14.1 | 21CQ | 14 | SWU14041 | 37.025–44.423 | 4.11 | 9.70 | 1.35 | 4.17 |
| qOA15.1 | 22YN | 15 | SWU15054 | 10.651–14.841 | 3.29 | 8.40 | −1.59 | 0.47 |
| qOA17.1 | 23CQ | 17 | SWU17080 | 51.964–70.539 | 3.34 | 7.90 | 1.59 | 1.17 |
| qLA01.1 | 23CQ | 1 | satt221 | 34.218–63.678 | 3.44 | 8.20 | −0.23 | −1.87 |
| qLA03.1 | 23CQ | 3 | SWU03114 | 21.047–32.864 | 3.84 | 9.10 | 1.28 | 0.45 |
| qLA05.1 | 22CQ | 5 | SWU05124 | 19.027–28.209 | 4.37 | 10.30 | 2.68 | 1.13 |
| qLA06.1 | 22YN | 6 | SWU06054 | 67.436–75.728 | 3.47 | 8.90 | −1.17 | −0.33 |
| qLA07.1 | 21CQ | 7 | SWU07073 | 72.85–82.506 | 3.03 | 7.20 | 0.88 | 5.40 |
| 22YN | 7 | SWU07073 | 74.85–85.506 | 4.08 | 10.40 | −0.96 | 0.59 | |
| qLA13.1 | 21CQ | 13 | SWU13084 | 80.767–93.767 | 3.73 | 8.80 | −0.14 | −5.67 |
| 22CQ | 13 | satt663 | 79.27–86.77 | 3.32 | 7.90 | −2.58 | 1.58 | |
| qLA13.2 | 22YN | 13 | SWU13121 | 145.83–148.09 | 3.98 | 10.10 | 0.08 | −1.20 |
| qLA14.1 | 21CQ | 14 | SWU14035 | 29.82–46.35 | 4.44 | 10.40 | −1.46 | −5.24 |
| qLA17.1 | 22YN | 17 | SWU17117 | 89.09–95.66 | 4.77 | 12.00 | −0.79 | 1.16 |
| qLNA06.1 | 23CQ | 6 | SWU06054 | 68.44–74.73 | 3.04 | 7.30 | −0.59 | −0.49 |
| qLNA11.1 | 22CQ | 11 | SWU11098 | 78.32–86.67 | 4.01 | 9.50 | −0.22 | 0.06 |
| qLNA13.1 | 21CQ | 13 | sat133 | 59.76–69.39 | 3.24 | 7.70 | −0.18 | 0.71 |
| qLNA13.2 | 22CQ | 13 | SWU13125 | 147.09–149.90 | 4.29 | 10.10 | 0.21 | −0.01 |
| 23CQ | 13 | SWU13121 | 136.97–151.72 | 4.28 | 10.10 | −0.29 | −0.84 | |
| qLNA14.1 | 21CQ | 14 | satt304 | 12.79–22.84 | 3.54 | 8.40 | 0.18 | 0.39 |
| qLNA16.1 | 22CQ | 16 | sat393 | 118.54–122.80 | 3.22 | 7.70 | −0.28 | 0.07 |
| 23CQ | 16 | SWU16128 | 115.54–122.80 | 3.29 | 7.80 | 0.69 | −0.62 |
| Cluster | Chromosome | Contained QTL | Environment. | Interval (cM) | LOD |
|---|---|---|---|---|---|
| LociS06.1 | 6 | HSW06.1 | 22YN | 0–4.85 | 5.34 |
| SW06.1 | 21CQ | 0–3.85 | 4.74 | ||
| 22YN | 0–3.85 | 4.08 | |||
| LociS13.1 | 13 | SW13.3 | 23CQ | 170.28–183.00 | 4.49 |
| SL13.1 | 21CQ | 170.94–183.00 | 3.15 | ||
| 23CQ | 170.94–183.00 | 4.38 | |||
| LociS16.1 | 16 | HSW16.1 | 22YN | 75.96–82.16 | 5.23 |
| 23CQ | 75.96–82.16 | 3.89 | |||
| SW16.1 | 22YN | 73.96–84.16 | 4.88 | ||
| 23CQ | 73.96–84.16 | 4.49 | |||
| SL16.2 | 22YN | 75.96–82.16 | 5.14 | ||
| 23CQ | 75.96–82.16 | 4.01 | |||
| SLW16.1 | 23CQ | 71.96–84.16 | 3.63 | ||
| LociS16.2 | 16 | SL16.1 | 22CQ | 112.63–122.80 | 5.09 |
| SLW16.1 | 22YN | 102.66–121.54 | 4.42 | ||
| 22CQ | 102.66–121.54 | 4.74 | |||
| LociQ06.1 | 6 | qOIL06.3 | 23CQ | 28.95–41.88 | 3.72 |
| qPA06.1 | 22CQ | 32.59–40.88 | 5.64 | ||
| qOA06.1 | 21CQ | 29.95–36.59 | 3.06 | ||
| 22CQ | 34.59–46.16 | 3.35 | |||
| LociQ07.1 | 7 | qOA07.1 | 21CQ | 72.85–83.51 | 3.12 |
| qLA07.1 | 21CQ | 72.85–82.501 | 3.03 | ||
| 22YN | 74.85–85.501 | 4.08 | |||
| LociQ13.1 | 13 | qOA13.1 | 22CQ | 78.27–87.77 | 4.21 |
| qLA13.1 | 21CQ | 80.77–93.77 | 3.73 | ||
| 22CQ | 79.27–86.77 | 3.32 |
| Gene ID | GO ID | Gene Functional Annotation |
|---|---|---|
| Glyma.16g133300 | GO:0005622 | intracellular |
| Glyma.16g128600 | GO:0006468 | protein phosphorylation |
| Glyma.16g129700 | GO:0006412 | translation |
| Glyma.16g127200 | GO:0006355 | regulation of transcription, DNA-templated |
| Glyma.16g127400 | GO:0005634 | nucleus |
| Glyma.16g127500 | GO:0006412 | translation |
| Glyma.16g129700 | GO:0002181 | cytoplasmic translation |
| Glyma.16g129800 | GO:0055114 | oxidation-reduction process |
| Glyma.16g129900 | GO:0000413 | protein peptidyl-prolyl isomerization |
| Glyma.16g130400 | GO:0006468 | protein phosphorylation |
| Glyma.16g131200 | GO:0009809 | lignin biosynthetic process |
| Glyma.16g131500 | GO:0005515 | protein binding |
| Glyma.16g131700 | GO:0006081 | cellular aldehyde metabolic process |
| Glyma.16g131800 | GO:0005975 | carbohydrate metabolic process |
| Glyma.06g155800 | GO:0007034 | vacuolar transport |
| Glyma.06g155900 | GO:0006355 | regulation of transcription, DNA-templated |
| Glyma.06g156000 | GO:0006471 | protein ADP-ribosylation |
| Glyma.06g156300 | GO:0006629 | lipid metabolic process |
| Glyma.06g156400 | GO:0007165 | signal transduction |
| Glyma.06g157400 | GO:0006351 | transcription, DNA-templated |
| Glyma.06g157800 | PTHR11527 | small heat-shock protein(HSP20) family |
| Glyma.06g158100 | PF05911 | plant protein of unknown function (DUF869) |
| Glyma.06g160100 | GO:0006468 | protein phosphorylation |
| Glyma.06g160500 | GO:0006357 | regulation of transcription by RNA polymerase II |
| Glyma.06g161200 | GO:0006468 | protein phosphorylation |
| Glyma.06g162100 | GO:0007275 | multicellular organism development |
| Glyma.06g162300 | GO:0055114 | oxidation-reduction process |
| Glyma.06g163600 | GO:0006355 | regulation of transcription, DNA-templated |
| Glyma.06g163700 | GO:0006351 | transcription, DNA-templated |
| Glyma.06g164300 | GO:0016020 | membrane |
| Glyma.06g164600 | GO:0045737 | positive regulation of cyclin-dependent protein serine |
| Glyma.06g164900 | GO:0006351 | transcription, DNA-templated |
| Glyma.06g165000 | GO:0046983 | protein dimerization activity |
| Glyma.06g165200 | GO:0006355 | regulation of transcription, DNA-templated |
| Glyma.06g165700 | GO:0046983 | protein dimerization activity |
| Glyma.06g166500 | GO:0006351 | transcription, DNA-templated |
Disclaimer/Publisher’s Note: The statements, opinions and data contained in all publications are solely those of the individual author(s) and contributor(s) and not of MDPI and/or the editor(s). MDPI and/or the editor(s) disclaim responsibility for any injury to people or property resulting from any ideas, methods, instructions or products referred to in the content. |
© 2024 by the authors. Licensee MDPI, Basel, Switzerland. This article is an open access article distributed under the terms and conditions of the Creative Commons Attribution (CC BY) license (https://creativecommons.org/licenses/by/4.0/).
Share and Cite
Gao, W.; Ma, R.; Li, X.; Liu, J.; Jiang, A.; Tan, P.; Xiong, G.; Du, C.; Zhang, J.; Zhang, X.; et al. Construction of Genetic Map and QTL Mapping for Seed Size and Quality Traits in Soybean (Glycine max L.). Int. J. Mol. Sci. 2024, 25, 2857. https://doi.org/10.3390/ijms25052857
Gao W, Ma R, Li X, Liu J, Jiang A, Tan P, Xiong G, Du C, Zhang J, Zhang X, et al. Construction of Genetic Map and QTL Mapping for Seed Size and Quality Traits in Soybean (Glycine max L.). International Journal of Molecular Sciences. 2024; 25(5):2857. https://doi.org/10.3390/ijms25052857
Chicago/Turabian StyleGao, Weiran, Ronghan Ma, Xi Li, Jiaqi Liu, Aohua Jiang, Pingting Tan, Guoxi Xiong, Chengzhang Du, Jijun Zhang, Xiaochun Zhang, and et al. 2024. "Construction of Genetic Map and QTL Mapping for Seed Size and Quality Traits in Soybean (Glycine max L.)" International Journal of Molecular Sciences 25, no. 5: 2857. https://doi.org/10.3390/ijms25052857