
5′-Isoforms of miR-1246 Have Distinct Targets and Stronger Functional Impact Compared with Canonical miR-1246 in Colorectal Cancer Cells In Vitro
 , , , and
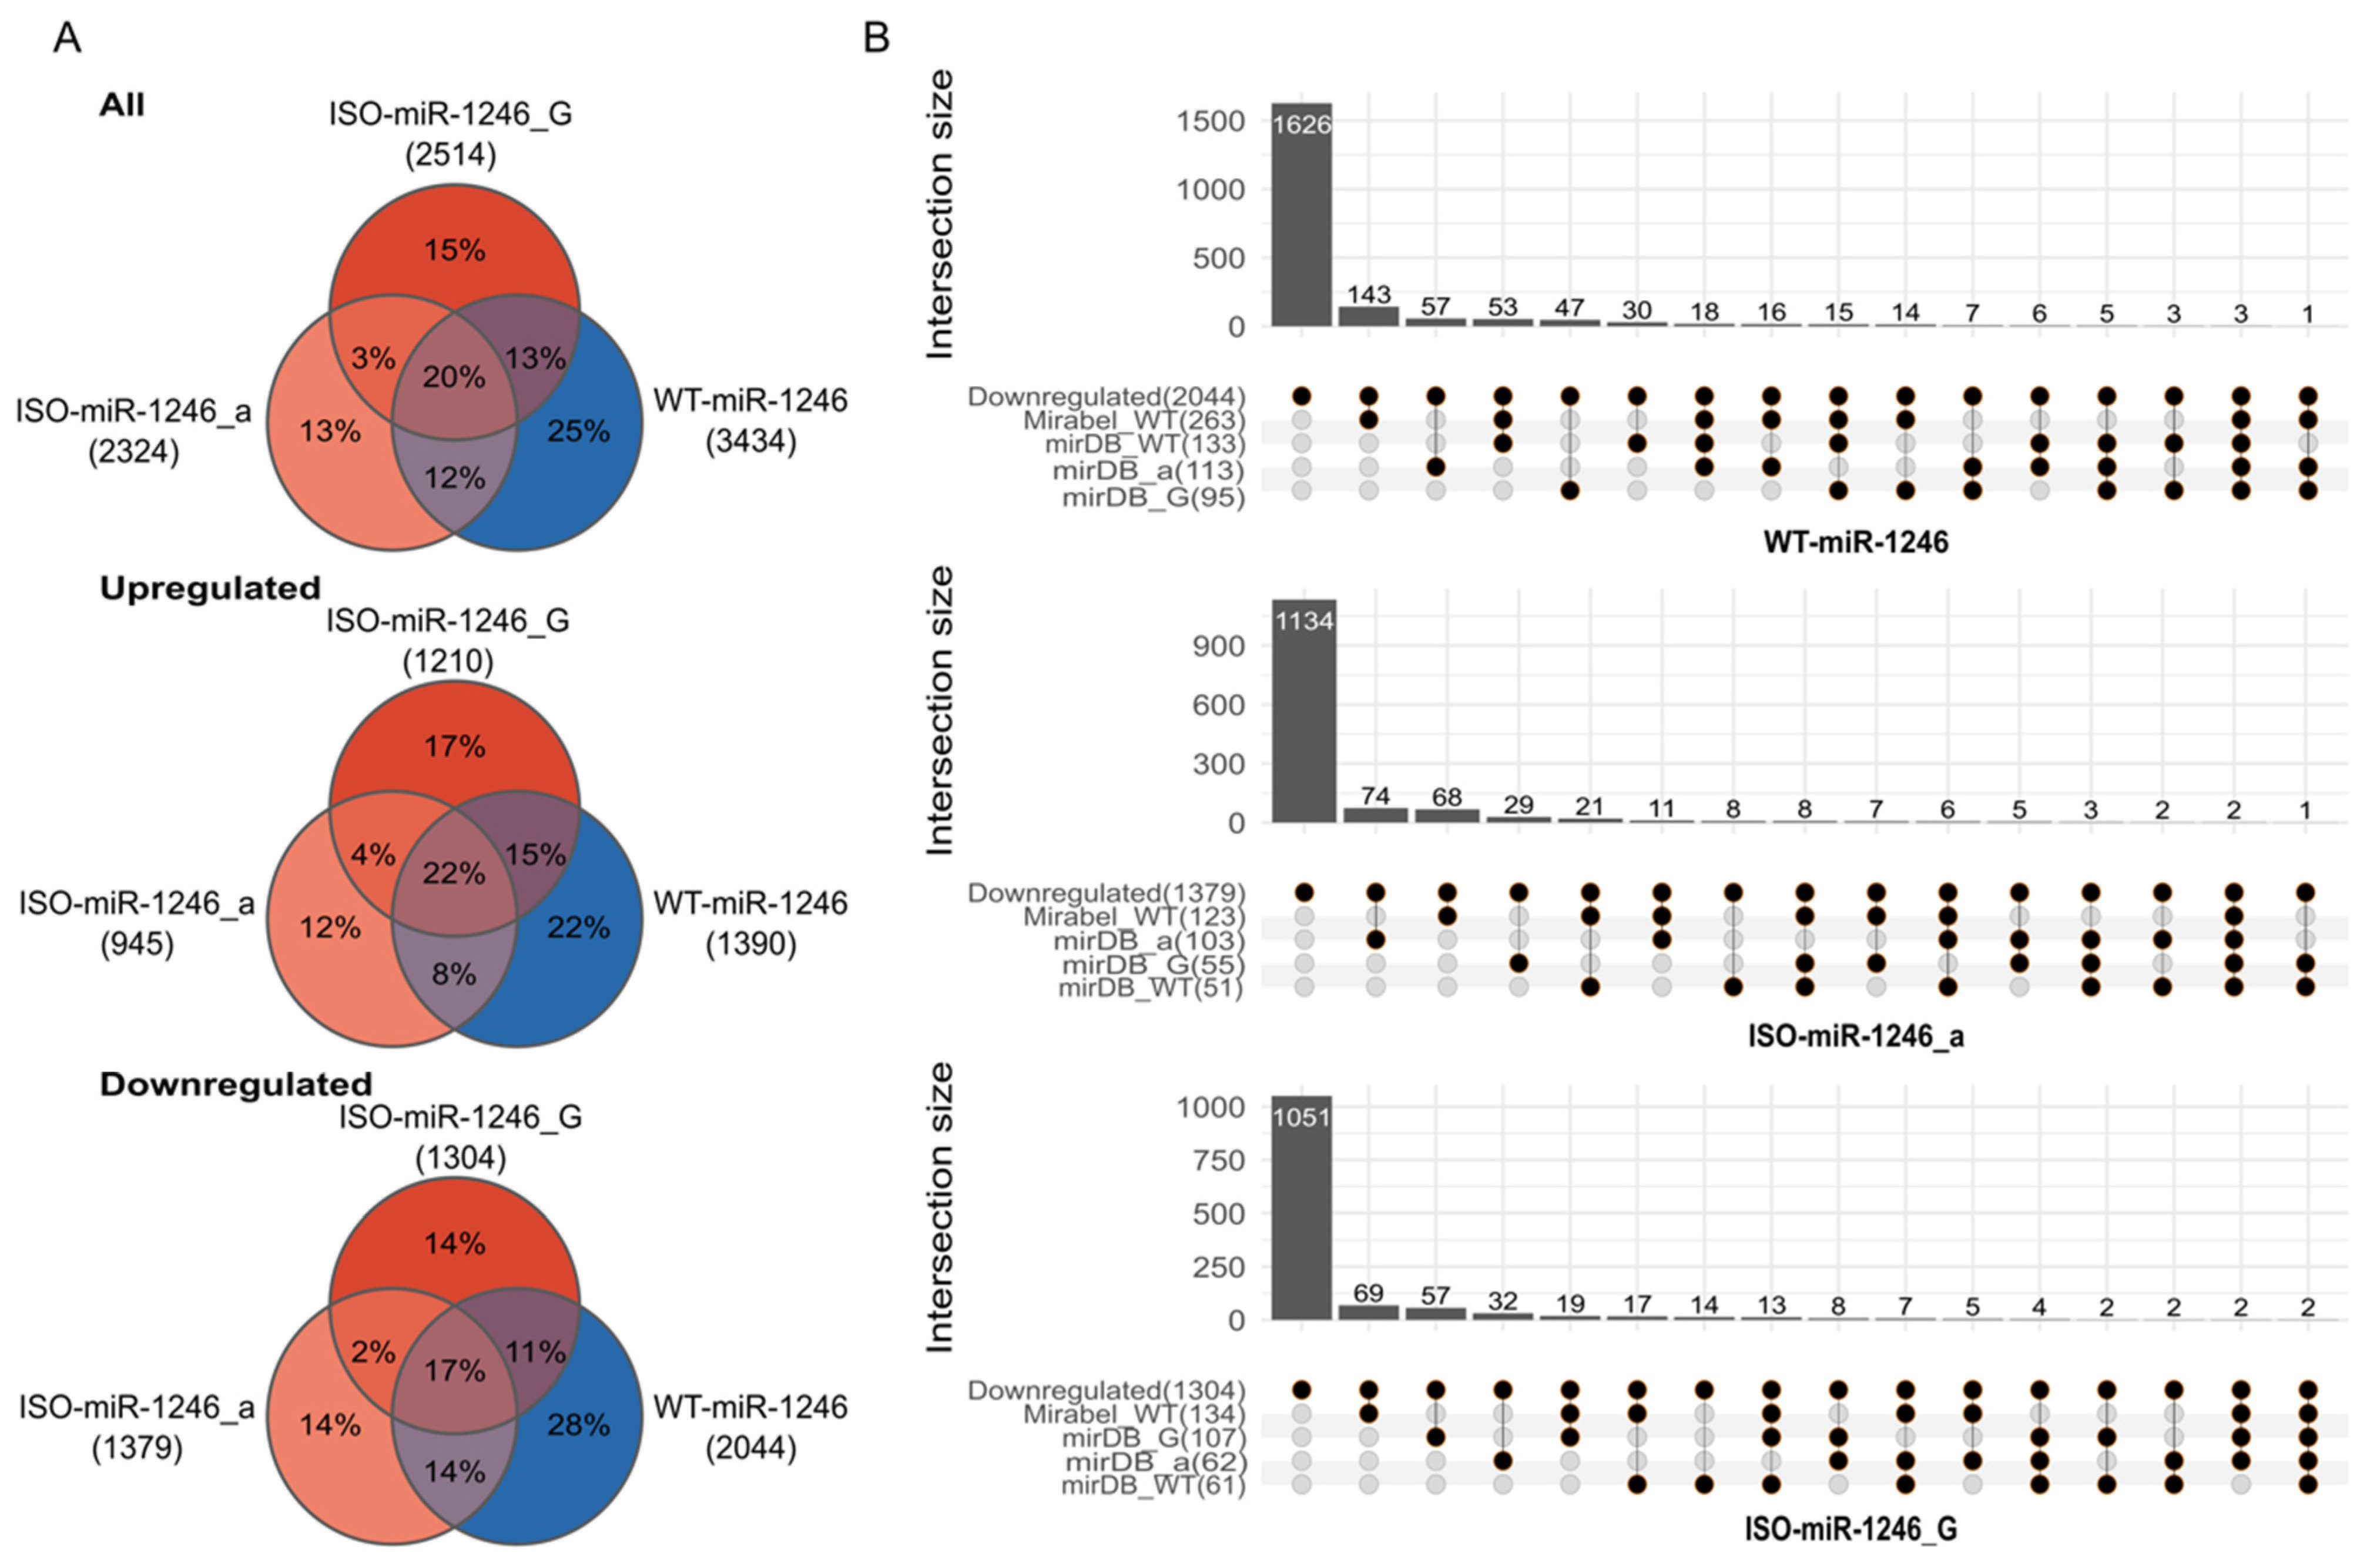
Abstract
:1. Introduction
2. Results
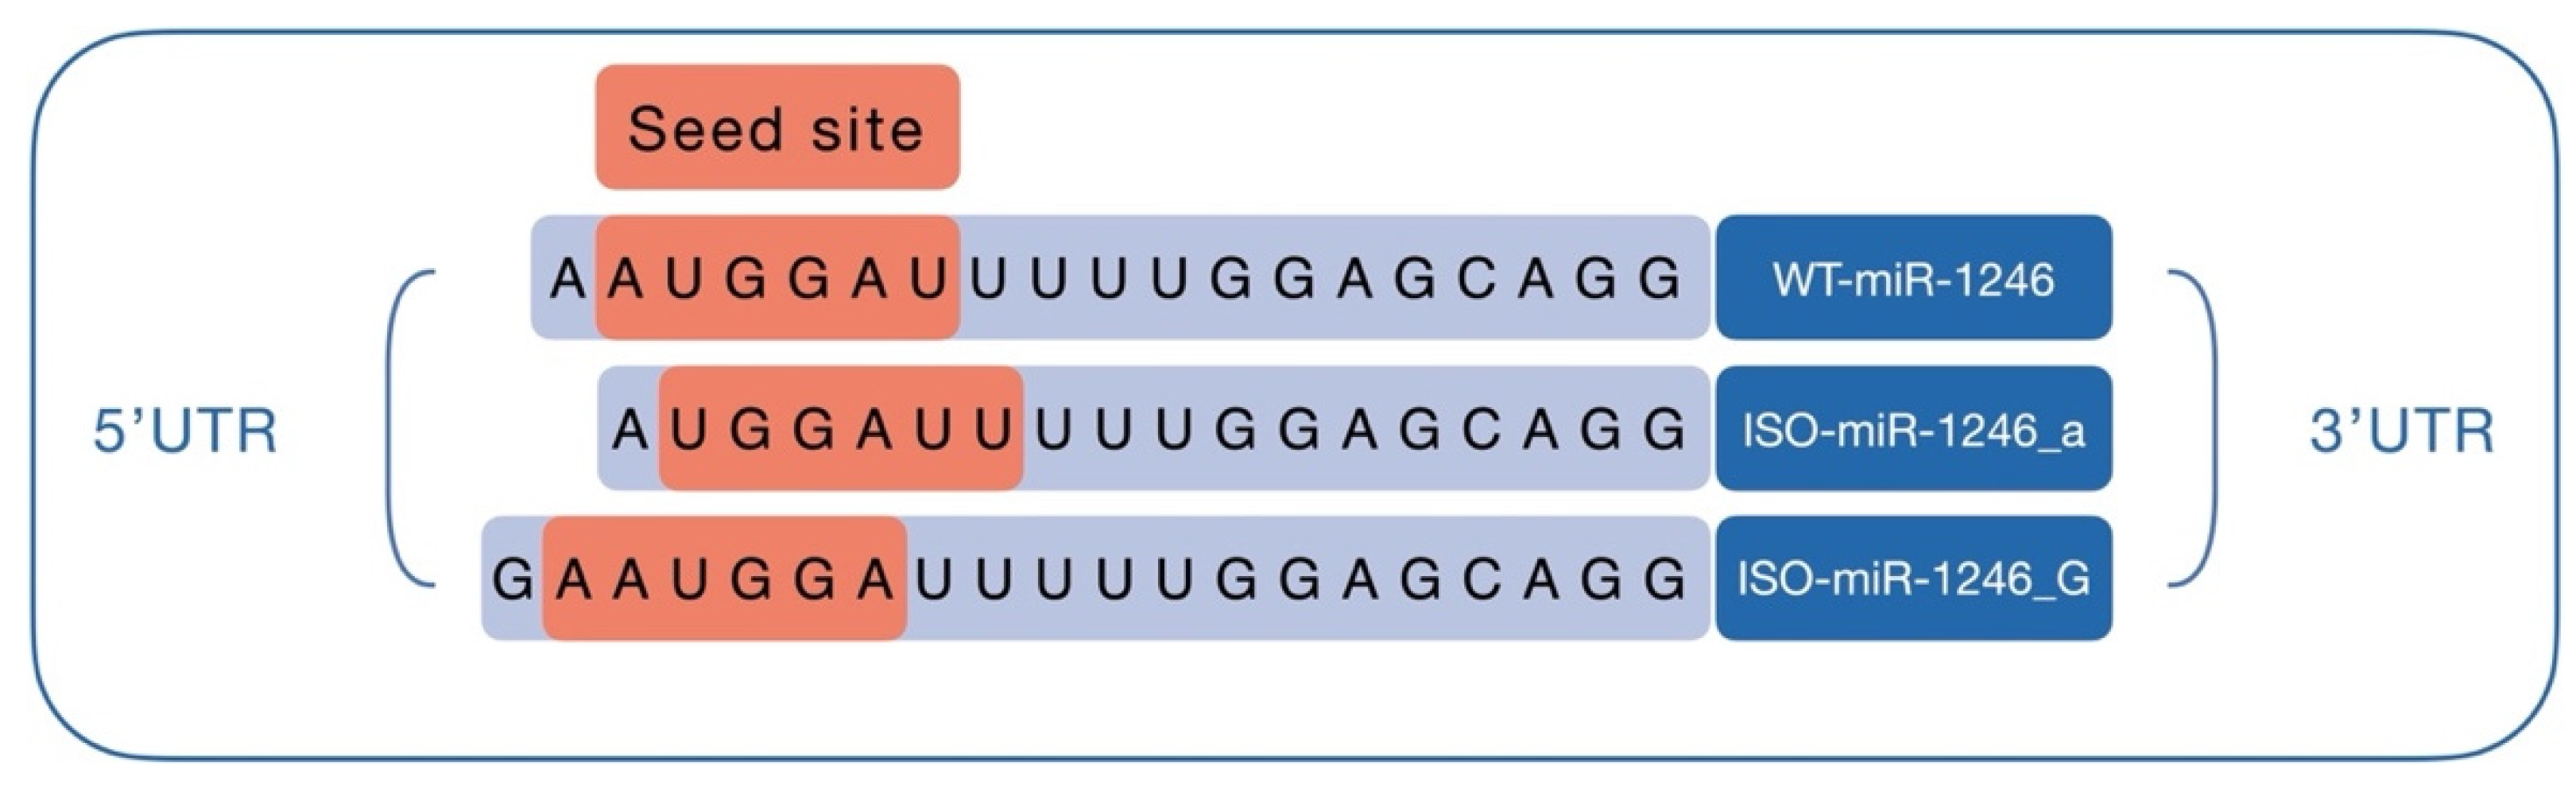
2.1. 5′-Isoforms Dominate in miR-1246 Fraction and Have Different Targetomes
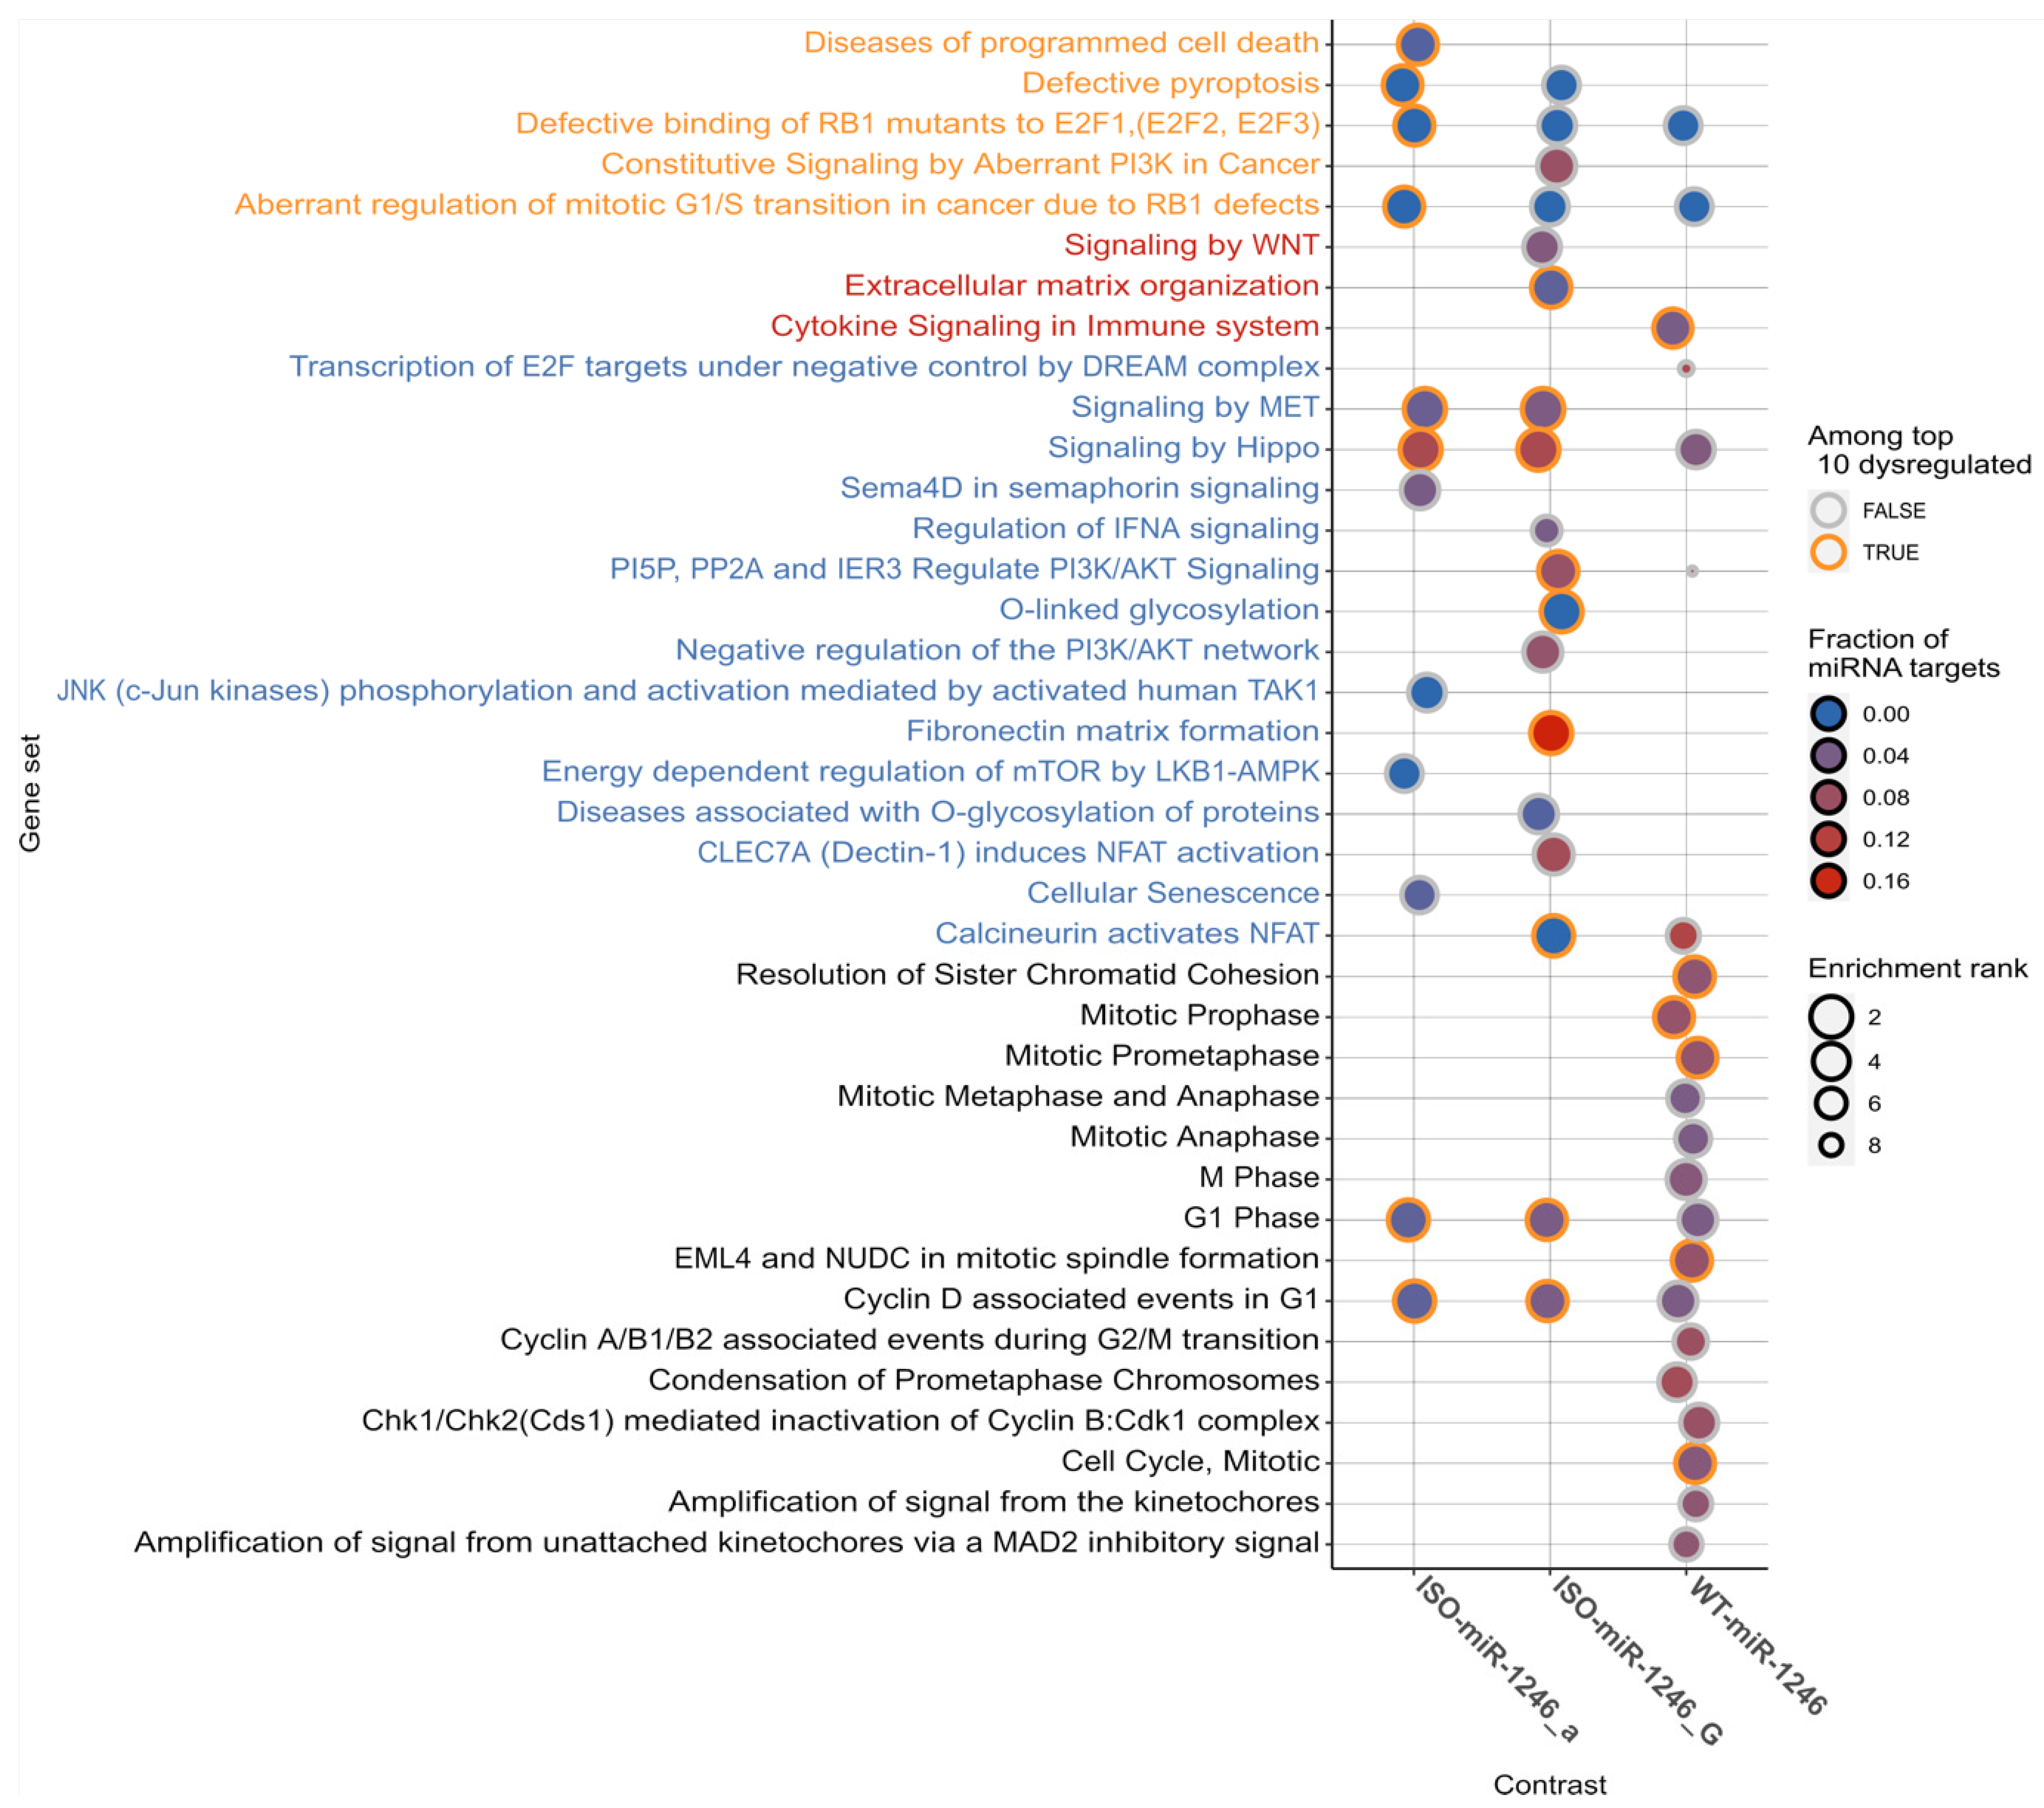
2.2. Transcriptome-Based Targetome Analysis Reveals Differential Enrichment of Signaling Pathways between WT-miR-1246 and Its 5′-Isoforms
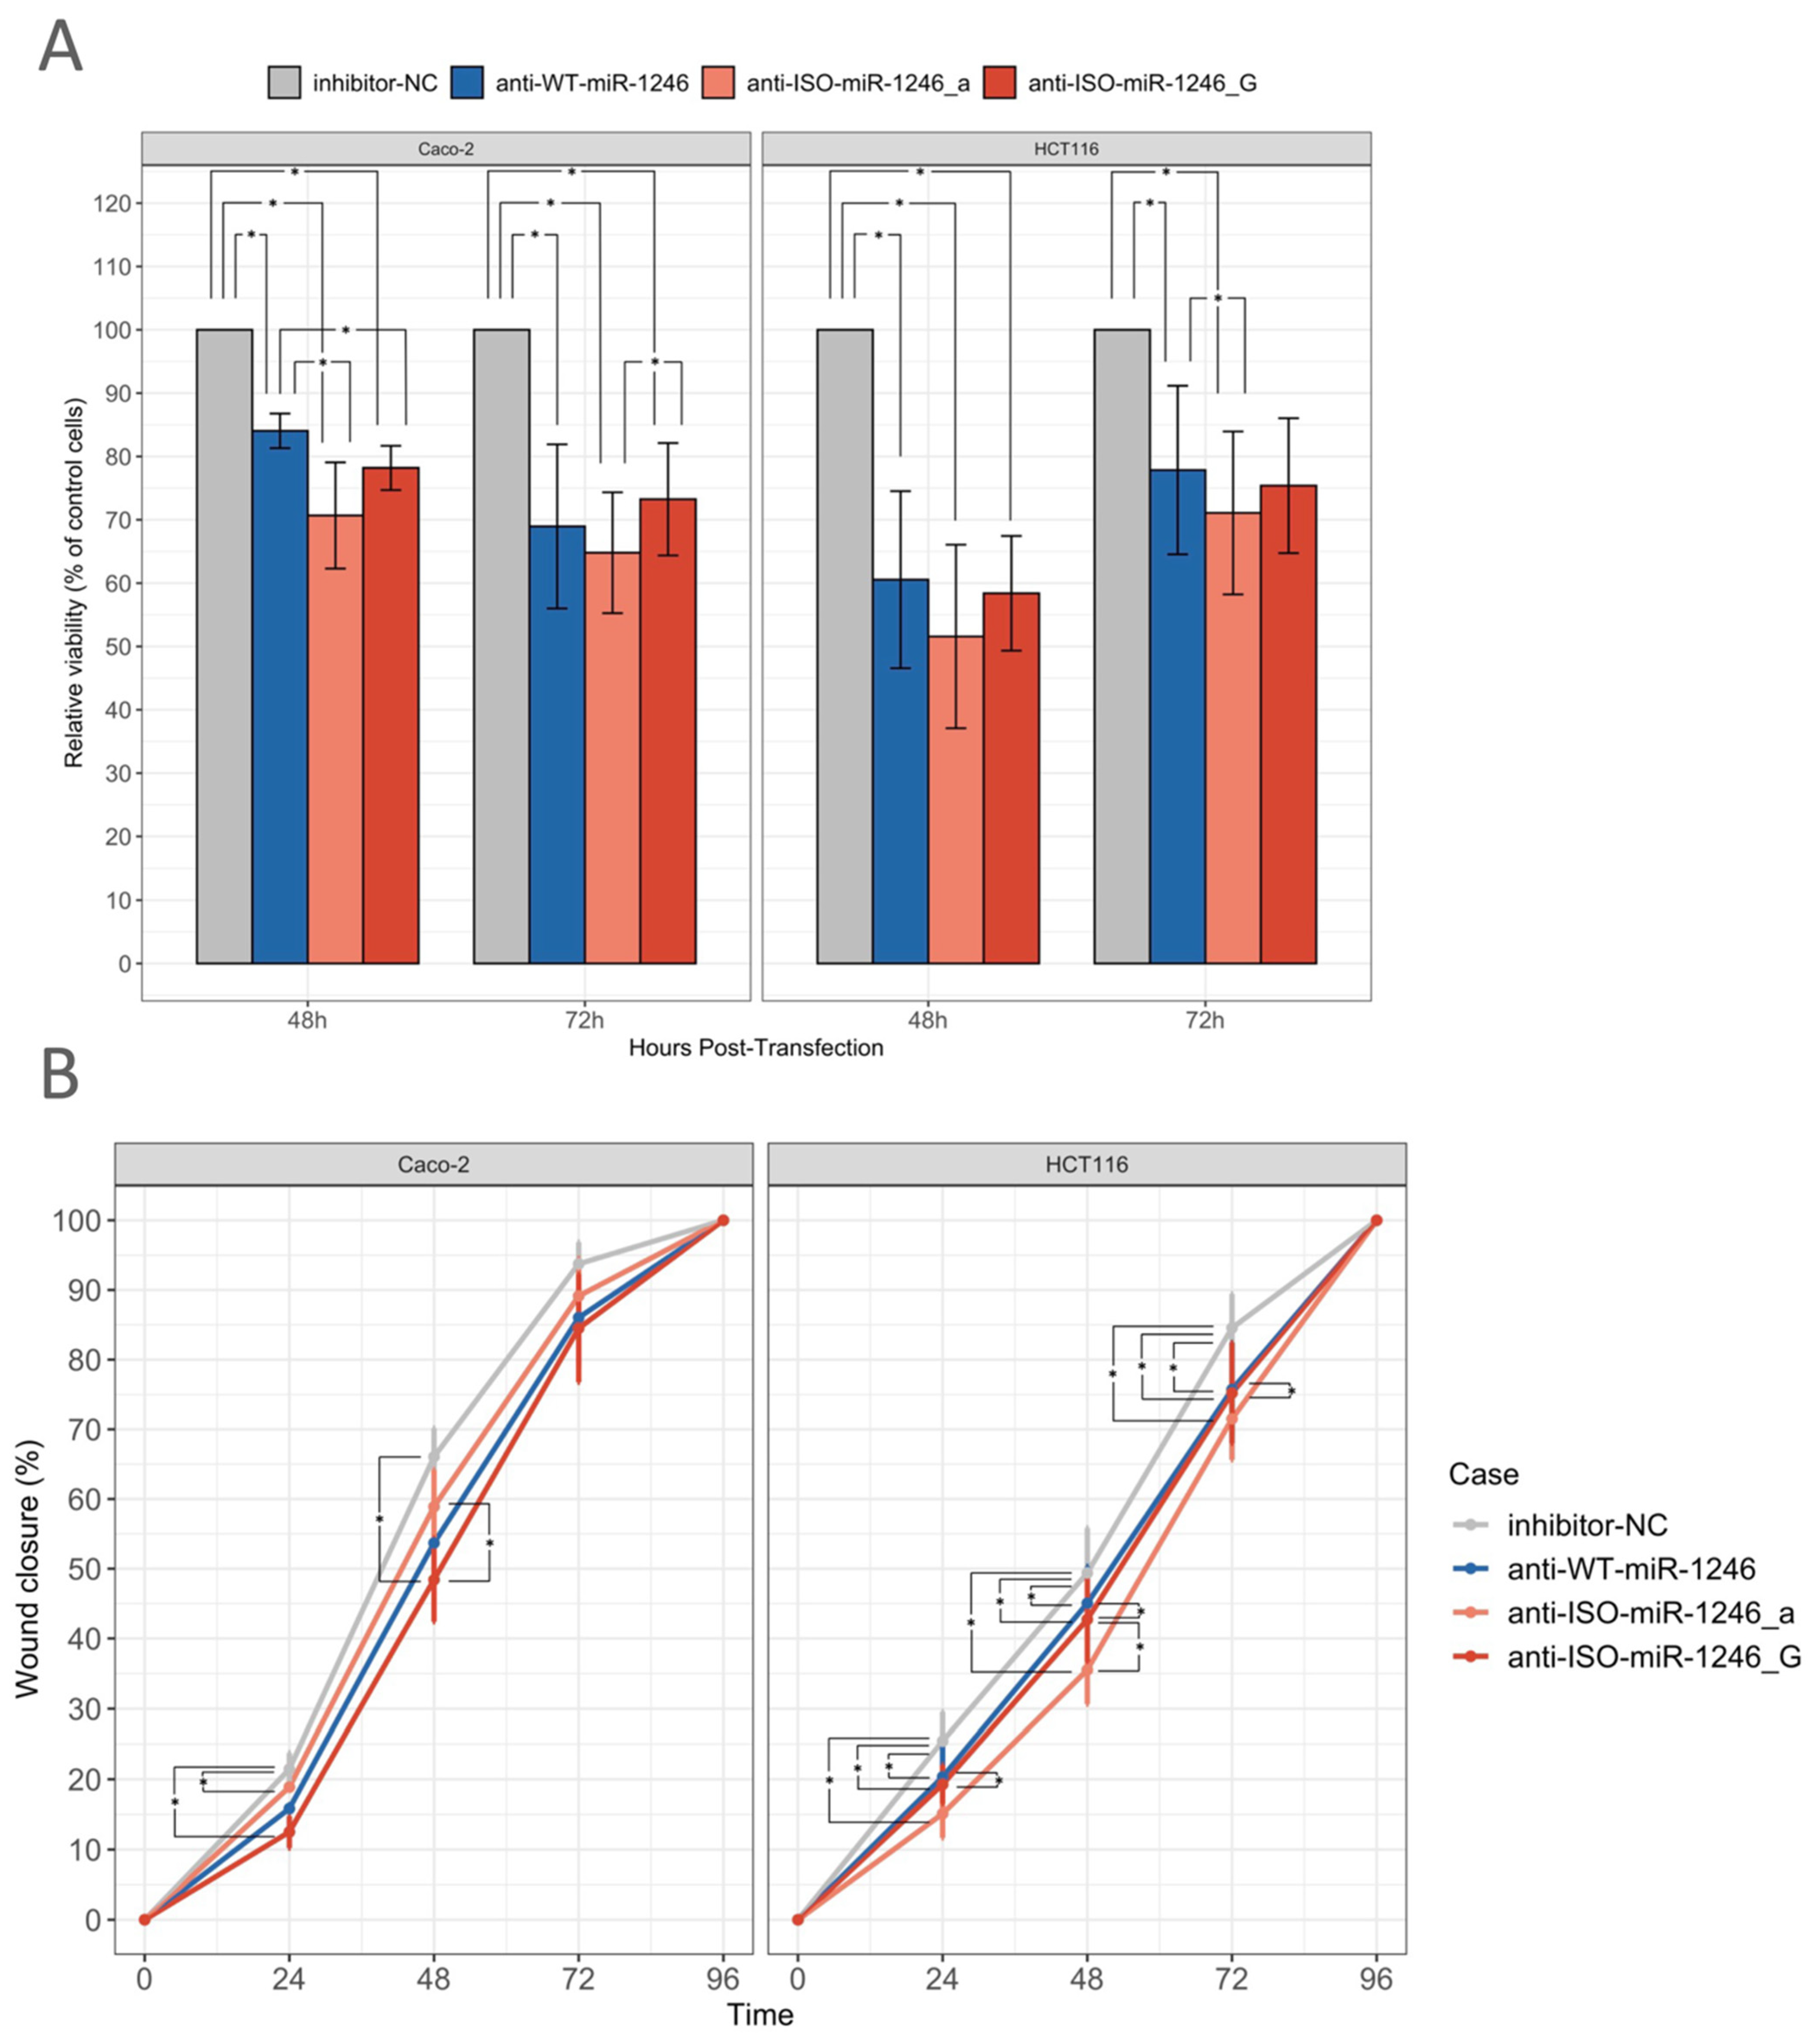
2.3. Inhibition of WT-miR-1246 and Its 5′-Isoforms Reduces Cell Viability
2.4. Inhibition of WT-miR-1246 and Its 5′-Isoforms Slows Gap Closure in Wound Healing Assay
2.5. Inhibition of ISO-miR-1246_G Affects Rates of Early Apoptosis in SW620 Cells
2.6. Inhibition of WT-miR-1246 and Its Isoforms Does Not Affect Cell Proliferation
2.7. Inhibition of WT-miR-1246 and Its 5′-Isoforms Does Not Affect Colony Formation Rate
3. Discussion
4. Materials and Methods
4.1. Cell Cultures
4.2. Transfection of Cell Cultures
4.3. RNA Isolation, Preparation of RNA Libraries, and Next-Generation Sequencing
4.4. Poly(A) RNA Sequencing and Small RNA Sequencing Data Analysis
4.5. In Silico Target Prediction of microRNAs
4.6. Pathway Enrichment Analysis
4.7. MTT Assay
4.8. Wound Healing Assay
4.9. Clonogenic Assay
4.10. Cell Proliferation Assay
4.11. Apoptosis Assay
4.12. Statistical Analysis of Loss of Function Experiments
5. Conclusions
Supplementary Materials
Author Contributions
Funding
Institutional Review Board Statement
Informed Consent Statement
Data Availability Statement
Conflicts of Interest
References
- Bartel, D.P. MicroRNAs: Target recognition and regulatory functions. Cell 2009, 136, 215–233. [Google Scholar] [CrossRef] [PubMed]
- Vasudevan, S.; Tong, Y.; Steitz, J.A. Switching from repression to activation: MicroRNAs can up-regulate translation. Science 2007, 318, 1931–1934. [Google Scholar] [CrossRef] [PubMed]
- Kasinski, A.L.; Slack, F.J. MicroRNAs en route to the clinic: Progress in validating and targeting microRNAs for cancer therapy. Nat. Rev. Cancer 2011, 11, 849–864. [Google Scholar] [CrossRef]
- Esteller, M. Non-coding RNAs in human disease. Nat. Rev. Genet. 2011, 12, 861–874. [Google Scholar] [CrossRef] [PubMed]
- Link, A.; Kupcinskas, J. MicroRNAs as non-invasive diagnostic biomarkers for gastric cancer: Current insights and future perspectives. World J. Gastroenterol. 2018, 24, 3313–3329. [Google Scholar] [CrossRef]
- Neilsen, C.T.; Goodall, G.J.; Bracken, C.P. IsomiRs—The overlooked repertoire in the dynamic microRNAome. Trends Genet. 2012, 28, 544–549. [Google Scholar] [CrossRef]
- Kozomara, A.; Griffiths-Jones, S. miRBase: Annotating high confidence microRNAs using deep sequencing data. Nucleic Acids Res. 2014, 42, D68–D73. [Google Scholar] [CrossRef]
- Ameres, S.L.; Zamore, P.D. Diversifying microRNA sequence and function. Nat. Rev. Mol. Cell Biol. 2013, 14, 475–488. [Google Scholar] [CrossRef]
- Cloonan, N.; Wani, S.; Xu, Q.; Gu, J.; Lea, K.; Heater, S.; Barbacioru, C.; Steptoe, A.L.; Martin, H.C.; Nourbakhsh, E.; et al. MicroRNAs and their isomiRs function cooperatively to target common biological pathways. Genome Biol. 2011, 12, R126. [Google Scholar] [CrossRef]
- Zelli, V.; Compagnoni, C.; Capelli, R.; Corrente, A.; Cornice, J.; Vecchiotti, D.; Di Padova, M.; Zazzeroni, F.; Alesse, E.; Tessitore, A. Emerging Role of isomiRs in Cancer: State of the Art and Recent Advances. Genes 2021, 12, 1447. [Google Scholar] [CrossRef]
- Hinton, A.; Hunter, S.E.; Afrikanova, I.; Jones, G.A.; Lopez, A.D.; Fogel, G.B.; Hayek, A.; King, C.C. SRNA-seq analysis of human embryonic stem cells and definitive endoderm reveals differentially expressed micrornas and novel isomirs with distinct targets. Stem Cells 2014, 32, 2360–2372. [Google Scholar] [CrossRef] [PubMed]
- Humphreys, D.T.; Hynes, C.J.; Patel, H.R.; Wei, G.H.; Cannon, L.; Fatkin, D.; Suter, C.M.; Clancy, J.L.; Preiss, T. Complexity of murine cardiomyocyte miRNA biogenesis, sequence variant expression and function. PLoS ONE 2012, 7, e30933. [Google Scholar] [CrossRef]
- Tan, G.C.; Chan, E.; Molnar, A.; Sarkar, R.; Alexieva, D.; Isa, I.M.; Robinson, S.; Zhang, S.; Ellis, P.; Langford, C.F.; et al. 5′ isomiR variation is of functional and evolutionary importance. Nucleic Acids Res. 2014, 42, 9424–9435. [Google Scholar] [CrossRef]
- Telonis, A.G.; Loher, P.; Jing, Y.; Londin, E.; Rigoutsos, I. Beyond the one-locus-one-miRNA paradigm: MicroRNA isoforms enable deeper insights into breast cancer heterogeneity. Nucleic Acids Res. 2015, 43, 9158–9175. [Google Scholar] [CrossRef]
- Manzano, M.; Forte, E.; Raja, A.N.; Schipma, M.J.; Gottwein, E. Divergent target recognition by coexpressed 5′-isomiRs of miR-142-3p and selective viral mimicry. RNA 2015, 21, 1606–1620. [Google Scholar] [CrossRef]
- Siegel, R.L.; Miller, K.D.; Goding Sauer, A.; Fedewa, S.A.; Butterly, L.F.; Anderson, J.C.; Cercek, A.; Smith, R.A.; Jemal, A. Colorectal cancer statistics, 2020. CA. Cancer J. Clin. 2020, 70, 145–164. [Google Scholar] [CrossRef]
- Serra-Sutton, V.; Serrano, C.B.; Carreras, M.E. Quality indicators to assess a colorectal cancer prevention program. Int. J. Technol. Assess. Health Care 2013, 29, 166. [Google Scholar] [CrossRef]
- Schee, K.; Fodstad, Ø.; Flatmark, K. MicroRNAs as Biomarkers in Colorectal Cancer. Am. J. Pathol. 2010, 177, 1592–1599. [Google Scholar] [CrossRef] [PubMed]
- Lukosevicius, R.; Juzenas, S.; Salteniene, V.; Kulokiene, U.; Aristikyte, J.; Hemmrich-stanisak, G.; Franke, A.; Link, A.; Ruzgys, P.; Satkauskas, S.; et al. miRNome Profiling and Functional Analysis Reveal Involvement of hsa-miR-1246 in Colon Adenoma-Carcinoma Transition by Targeting AXIN2 and CFTR. Int. J. Mol. Sci. 2022, 23, 2107. [Google Scholar] [CrossRef]
- Sun, Z.; Meng, C.; Wang, S.; Zhou, N.; Guan, M.; Bai, C.; Lu, S.; Han, Q.; Zhao, R.C. MicroRNA-1246 enhances migration and invasion through CADM1 in hepatocellular carcinoma. BMC Cancer 2014, 14, 616. [Google Scholar] [CrossRef] [PubMed]
- Wang, S.; Zeng, Y.; Zhou, J.-M.; Nie, S.-L.; Peng, Q.; Gong, J.; Huo, J.-R. MicroRNA-1246 promotes growth and metastasis of colorectal cancer cells involving CCNG2 reduction. Mol. Med. Rep. 2016, 13, 273–280. [Google Scholar] [CrossRef]
- Peng, W.; Li, J.; Chen, R.; Gu, Q.; Yang, P.; Qian, W.; Ji, D.; Wang, Q.; Zhang, Z.; Tang, J.; et al. Upregulated METTL3 promotes metastasis of colorectal Cancer via miR-1246/SPRED2/MAPK signaling pathway. J. Exp. Clin. Cancer Res. 2019, 38, 393. [Google Scholar] [CrossRef]
- Babapoor, S.; Fleming, E.; Wu, R.; Dadras, S.S. A novel mir-451a isomir, associated with amelanotypic phenotype, acts as a tumor suppressor in melanoma by retarding cell migration and invasion. PLoS ONE 2014, 9, e120. [Google Scholar] [CrossRef]
- Li, S.C.; Liao, Y.L.; Ho, M.R.; Tsai, K.W.; Lai, C.H.; Lin, W.C. MiRNA arm selection and isomiR distribution in gastric cancer. BMC Genom. 2012, 13 (Suppl. S1), S13. [Google Scholar] [CrossRef]
- Naturally Existing Isoforms of miR-222 Have Distinct Functions—PubMed. Available online: https://pubmed.ncbi.nlm.nih.gov/28981911/ (accessed on 28 May 2020).
- Wu, C.W.; Evans, J.M.; Huang, S.; Mahoney, D.W.; Dukek, B.A.; Taylor, W.R.; Yab, T.C.; Smyrk, T.C.; Jen, J.; Kisiel, J.B.; et al. A Comprehensive Approach to Sequence-oriented IsomiR annotation (CASMIR): Demonstration with IsomiR profiling in colorectal neoplasia. BMC Genom. 2018, 19, 401. [Google Scholar] [CrossRef] [PubMed]
- Loher, P.; Londin, E.R.; Rigoutsos, I. IsomiR expression profiles in human lymphoblastoid cell lines exhibit population and gender dependencies. Oncotarget 2014, 5, 8790–8802. [Google Scholar] [CrossRef] [PubMed]
- Van der Kwast, R.V.C.T.; Woudenberg, T.; Quax, P.H.A.; Nossent, A.Y. MicroRNA-411 and Its 5′-IsomiR Have Distinct Targets and Functions and Are Differentially Regulated in the Vasculature under Ischemia. Mol. Ther. 2019, 28, 157–170. [Google Scholar] [CrossRef]
- Gong, L.B.; Wen, T.; Li, Z.; Xin, X.; Che, X.F.; Wang, J.; Liu, Y.P.; Qu, X.J. DYNC1I1 Promotes the Proliferation and Migration of Gastric Cancer by Up-Regulating IL-6 Expression. Front. Oncol. 2019, 9, 491. [Google Scholar] [CrossRef] [PubMed]
- Harvey, K.F.; Zhang, X.; Thomas, D.M. The Hippo pathway and human cancer. Nat. Rev. Cancer 2013, 13, 246–257. [Google Scholar] [CrossRef]
- He, C.; Lv, X.; Huang, C.; Hua, G.; Ma, B.; Chen, X.; Angeletti, P.C.; Dong, J.; Zhou, J.; Wang, Z.; et al. YAP1-LATS2 feedback loop dictates senescent or malignant cell fate to maintain tissue homeostasis. EMBO Rep. 2019, 20, e44948. [Google Scholar] [CrossRef]
- McPherson, J.P.; Tamblyn, L.; Elia, A.; Migon, E.; Shehabeldin, A.; Matysiak-Zablocki, E.; Lemmers, B.; Salmena, L.; Hakem, A.; Fish, J.; et al. Lats2/Kpm is required for embryonic development, proliferation control and genomic integrity. EMBO J. 2004, 23, 3677–3688. [Google Scholar] [CrossRef]
- Visser, S.; Yang, X. LATS tumor suppressor: A new governor of cellular homeostasis. Cell Cycle 2010, 9, 3892–3903. [Google Scholar] [CrossRef]
- Moroishi, T.; Park, H.W.; Qin, B.; Chen, Q.; Meng, Z.; Plouffe, S.W.; Taniguchi, K.; Yu, F.X.; Karin, M.; Pan, D.; et al. A YAP/TAZ-induced feedback mechanism regulates Hippo pathway homeostasis. Genes Dev. 2015, 29, 1271–1284. [Google Scholar] [CrossRef] [PubMed]
- Li, J.; Chen, X.; Ding, X.; Cheng, Y.; Zhao, B.; Lai, Z.C.; AlHezaimi, K.; Hakem, R.; Guan, K.L.; Wang, C.Y. LATS2 suppresses oncogenic Wnt signaling by disrupting β-catenin/BCL9 interaction. Cell Rep. 2013, 5, 1650–1663. [Google Scholar] [CrossRef]
- Sun, Z.; Zhang, Q.; Yuan, W.; Li, X.; Chen, C.; Guo, Y.; Shao, B.; Dang, Q.; Zhou, Q.; Wang, Q.; et al. MiR-103a-3p promotes tumour glycolysis in colorectal cancer via hippo/YAP1/HIF1A axis. J. Exp. Clin. Cancer Res. 2020, 39, 250. [Google Scholar] [CrossRef] [PubMed]
- Du, Y.L.; Liang, Y.; Shi, G.Q.; Cao, Y.; Qiu, J.; Yuan, L.; Yong, Z.; Liu, L.; Li, J. LINC00689 participates in proliferation, chemoresistance and metastasis via miR-31-5p/YAP/β-catenin axis in colorectal cancer. Exp. Cell Res. 2020, 395, 112176. [Google Scholar] [CrossRef]
- Chen, X.; Wang, A.L.; Liu, Y.Y.; Zhao, C.X.; Zhou, X.; Liu, H.L.; Lin, M. Bin MiR-429 Involves in the Pathogenesis of Colorectal Cancer via Directly Targeting LATS2. Oxid. Med. Cell. Longev. 2020, 2020, 5316276. [Google Scholar] [CrossRef]
- He, Y.; Sun, M.M.; Zhang, G.G.; Yang, J.; Chen, K.S.; Xu, W.W.; Li, B. Targeting PI3K/Akt signal transduction for cancer therapy. Signal Transduct. Target. Ther. 2021, 6, 425. [Google Scholar] [CrossRef] [PubMed]
- Efferth, T. Signal transduction pathways of the epidermal growth factor receptor in colorectal cancer and their inhibition by small molecules. Curr. Med. Chem. 2012, 19, 5735–5744. [Google Scholar] [CrossRef]
- Depaoli-Roach, A.A.; Park, I.K.; Cerovsky, V.; Csortos, C.; Durbin, S.D.; Kuntz, M.J.; Sitikov, A.; Tang, P.M.; Verin, A.; Zolnierowicz, S. Serine/threonine protein phosphatases in the control of cell function. Adv. Enzym. Regul. 1994, 34, 199–224. [Google Scholar] [CrossRef]
- Cristóbal, I.; Manso, R.; Rincón, R.; Caramés, C.; Senin, C.; Borrero, A.; Martínez-Useros, J.; Rodriguez, M.; Zazo, S.; Aguilera, O.; et al. PP2A inhibition is a common event in colorectal cancer and its restoration using FTY720 shows promising therapeutic potential. Mol. Cancer Ther. 2014, 13, 938–947. [Google Scholar] [CrossRef]
- Yong, L.; YuFeng, Z.; Guang, B. Association between PPP2CA expression and colorectal cancer prognosis tumor marker prognostic study. Int. J. Surg. 2018, 59, 80–89. [Google Scholar] [CrossRef] [PubMed]
- Narayan, S.; Raza, A.; Mahmud, I.; Koo, N.; Garrett, T.J.; Law, M.E.; Law, B.K.; Sharma, A.K. Sensitization of FOLFOX-resistant colorectal cancer cells via the modulation of a novel pathway involving protein phosphatase 2A. iScience 2022, 25, 104518. [Google Scholar] [CrossRef]
- Bott, A.; Erdem, N.; Lerrer, S.; Hotz-Wagenblatt, A.; Breunig, C.; Abnaof, K.; Wörner, A.; Wilhelm, H.; Münstermann, E.; Ben-Baruch, A.; et al. miRNA-1246 induces pro-inflammatory responses in mesenchymal stem/stromal cells by regulating PKA and PP2A. Oncotarget 2017, 8, 43897–43914. [Google Scholar] [CrossRef]
- Kongstorp, M.; Schjølberg, T.; Jacobsen, D.P.; Haugen, F.; Gjerstad, J. Epiregulin is released from intervertebral disks and induces spontaneous activity in pain pathways. PAIN Rep. 2019, 4, e718. [Google Scholar] [CrossRef]
- Qu, X.; Sandmann, T.; Frierson, H.; Fu, L.; Fuentes, E.; Walter, K.; Okrah, K.; Rumpel, C.; Moskaluk, C.; Lu, S.; et al. Integrated genomic analysis of colorectal cancer progression reveals activation of EGFR through demethylation of the EREG promoter. Oncogene 2016, 35, 6403. [Google Scholar] [CrossRef]
- Sunaga, N.; Kaira, K.; Imai, H.; Shimizu, K.; Nakano, T.; Shames, D.S.; Girard, L.; Soh, J.; Sato, M.; Iwasaki, Y.; et al. Oncogenic KRAS-induced epiregulin overexpression contributes to aggressive phenotype and is a promising therapeutic target in non-small-cell lung cancer. Oncogene 2013, 32, 4034–4042. [Google Scholar] [CrossRef] [PubMed]
- Khambata-Ford, S.; Garrett, C.R.; Meropol, N.J.; Basik, M.; Harbison, C.T.; Wu, S.; Wong, T.W.; Huang, X.; Takimoto, C.H.; Godwin, A.K.; et al. Expression of epiregulin and amphiregulin and K-ras mutation status predict disease control in metastatic colorectal cancer patients treated with cetuximab. J. Clin. Oncol. 2007, 25, 3230–3237. [Google Scholar] [CrossRef]
- He, M.; Jin, Q.; Chen, C.; Liu, Y.; Ye, X.; Jiang, Y.; Ji, F.; Qian, H.; Gan, D.; Yue, S.; et al. The miR-186-3p/EREG axis orchestrates tamoxifen resistance and aerobic glycolysis in breast cancer cells. Oncogene 2019, 38, 5551–5565. [Google Scholar] [CrossRef]
- Chen, S.; Yue, T.; Huang, Z.; Zhu, J.; Bu, D.; Wang, X.; Pan, Y.; Liu, Y.; Wang, P. Inhibition of hydrogen sulfide synthesis reverses acquired resistance to 5-FU through miR-215-5p-EREG/TYMS axis in colon cancer cells. Cancer Lett. 2019, 466, 49–60. [Google Scholar] [CrossRef]
- Bueno, M.J.; Malumbres, M. MicroRNAs and the cell cycle. Biochim. Biophys. Acta Mol. Basis Dis. 2011, 1812, 592–601. [Google Scholar] [CrossRef] [PubMed]
- Shen, T.; Huang, S. The role of Cdc25A in the regulation of cell proliferation and apoptosis. Anti-Cancer Agents Med. Chem. 2012, 12, 631–639. [Google Scholar] [CrossRef] [PubMed]
- Wlodarchak, N.; Xing, Y. PP2A as a master regulator of the cell cycle. Crit. Rev. Biochem. Mol. Biol. 2016, 51, 162–184. [Google Scholar] [CrossRef] [PubMed]
- Cai, L.; Zhang, Q.; Du, L.; Zheng, F. Silencing of miR-1246 Induces Cell Cycle Arrest and Apoptosis in Cisplatin-Resistant Ovarian Cancer Cells by Promoting ZNF23 Transcription. Cytogenet. Genome Res. 2021, 161, 488–500. [Google Scholar] [CrossRef]
- Chai, S.; Ng, K.Y.; Tong, M.; Lau, E.Y.; Lee, T.K.; Chan, K.W.; Yuan, Y.F.; Cheung, T.T.; Cheung, S.T.; Wang, X.Q.; et al. Octamer 4/microRNA-1246 signaling axis drives Wnt/β-catenin activation in liver cancer stem cells. Hepatology 2016, 64, 2062–2076. [Google Scholar] [CrossRef]
- Yamada, N.; Tsujimura, N.; Kumazaki, M.; Shinohara, H.; Taniguchi, K.; Nakagawa, Y.; Naoe, T.; Akao, Y. Colorectal cancer cell-derived microvesicles containing microRNA-1246 promote angiogenesis by activating Smad 1/5/8 signaling elicited by PML down-regulation in endothelial cells. Biochim. Biophys. Acta Gene Regul. Mech. 2014, 1839, 1256–1272. [Google Scholar] [CrossRef]
- Xu, Y.F.; Hannafon, B.N.; Khatri, U.; Gin, A.; Ding, W.Q. The origin of exosomal miR-1246 in human cancer cells. RNA Biol. 2019, 16, 770–784. [Google Scholar] [CrossRef]
- Mallory, A.; Vaucheret, H. Form, Function, and Regulation of ARGONAUTE Proteins. Plant Cell 2010, 22, 3879. [Google Scholar] [CrossRef]
- Kanematsu, S.; Tanimoto, K.; Suzuki, Y.; Sugano, S. Screening for possible miRNA-mRNA associations in a colon cancer cell line. Gene 2014, 533, 520–531. [Google Scholar] [CrossRef]
- Yang, A.; Bofill-De Ros, X.; Stanton, R.; Shao, T.J.; Villanueva, P.; Gu, S. TENT2, TUT4, and TUT7 selectively regulate miRNA sequence and abundance. Nat. Commun. 2022, 13, 5260. [Google Scholar] [CrossRef]
- Shigematsu, M.; Honda, S.; Kirino, Y. Dumbbell-PCR for Discriminative Quantification of a Small RNA Variant. Methods Mol. Biol. 2018, 1680, 65–73. [Google Scholar]
- Kechin, A.; Boyarskikh, U.; Kel, A.; Filipenko, M. CutPrimers: A New Tool for Accurate Cutting of Primers from Reads of Targeted Next Generation Sequencing. J. Comput. Biol. 2017, 24, 1138–1143. [Google Scholar] [CrossRef] [PubMed]
- Pantano, L.; Estivill, X.; Martí, E. SeqBuster, a bioinformatic tool for the processing and analysis of small RNAs datasets, reveals ubiquitous miRNA modifications in human embryonic cells. Nucleic Acids Res. 2009, 38, e34. [Google Scholar] [CrossRef]
- Guo, L.; Liang, T.; Yu, J.; Zou, Q. A comprehensive analysis of miRNA/isomiR expression with gender difference. PLoS ONE 2016, 11, e0154955. [Google Scholar] [CrossRef] [PubMed]
- BBMap Download|SourceForge.net. Available online: https://sourceforge.net/projects/bbmap/ (accessed on 9 December 2022).
- Dobin, A.; Davis, C.A.; Schlesinger, F.; Drenkow, J.; Zaleski, C.; Jha, S.; Batut, P.; Chaisson, M.; Gingeras, T.R. STAR: Ultrafast universal RNA-seq aligner. Bioinformatics 2013, 29, 15–21. [Google Scholar] [CrossRef]
- Love, M.I.; Huber, W.; Anders, S. Moderated estimation of fold change and dispersion for RNA-seq data with DESeq2. Genome Biol. 2014, 15, 550. [Google Scholar] [CrossRef]
- Stephens, M. False discovery rates: A new deal. Biostatistics 2017, 18, 275–294. [Google Scholar] [CrossRef]
- Chen, Y.; Wang, X. MiRDB: An online database for prediction of functional microRNA targets. Nucleic Acids Res. 2020, 48, D127–D131. [Google Scholar] [CrossRef]
- Quillet, A.; Saad, C.; Ferry, G.; Anouar, Y.; Vergne, N.; Lecroq, T.; Dubessy, C. Improving Bioinformatics Prediction of microRNA Targets by Ranks Aggregation. Front. Genet. 2020, 10, 1330. [Google Scholar] [CrossRef] [PubMed]
- Geistlinger, L.; Csaba, G.; Küffner, R.; Mulder, N.; Zimmer, R. From sets to graphs: Towards a realistic enrichment analysis of transcriptomic systems. Bioinformatics 2011, 27, i366–i373. [Google Scholar] [CrossRef]
- Dutta, B.; Wallqvist, A.; Reifman, J. PathNet: A tool for pathway analysis using topological information. Source Code Biol. Med. 2012, 7, 10. [Google Scholar] [CrossRef]
- Geistlinger, L.; Csaba, G.; Zimmer, R. Bioconductor’s EnrichmentBrowser: Seamless navigation through combined results of set- & network-based enrichment analysis. BMC Bioinform. 2016, 17, 45. [Google Scholar] [CrossRef]
- Fisher, R.A. Statistical Methods for Research Workers; Springer: New York, NY, USA, 1992; pp. 66–70. [Google Scholar] [CrossRef]
- Gyvyte, U.; Lukosevicius, R.; Inciuraite, R.; Streleckiene, G.; Gudoityte, G.; Bekampyte, J.; Valentini, S.; Salteniene, V.; Ruzgys, P.; Satkauskas, S.; et al. The role of MiR-375-3p and MiR-200b-3p in gastrointestinal stromal tumors. Int. J. Mol. Sci. 2020, 21, 5151. [Google Scholar] [CrossRef]
- Hellstern, M.; Ma, J.; Yue, K.; Shojaie, A. netgsa: Fast computation and interactive visualization for topology-based pathway enrichment analysis. PLoS Comput. Biol. 2021, 17, e1008979. [Google Scholar] [CrossRef] [PubMed]
- Draghici, S.; Khatri, P.; Tarca, A.L.; Amin, K.; Done, A.; Voichita, C.; Georgescu, C.; Romero, R. A systems biology approach for pathway level analysis. Genome Res. 2007, 17, 1537–1545. [Google Scholar] [CrossRef] [PubMed]
- Signorelli, M.; Vinciotti, V.; Wit, E.C. NEAT: An efficient network enrichment analysis test. BMC Bioinform. 2016, 17, 352. [Google Scholar] [CrossRef]
- Jacob, L.; Neuvial, P.; Dudoit, S. More power via graph-structured tests for differential expression of gene networks. Ann. Appl. Stat. 2012, 6, 561–600. [Google Scholar] [CrossRef]
- Ma, J.; Shojaie, A.; Michailidis, G. A comparative study of topology-based pathway enrichment analysis methods. BMC Bioinform. 2019, 20, 546. [Google Scholar] [CrossRef]
- nf-core/smrnaseq: v2.2.1—2023-05-12 Carmine Mercury Borzoi. Available online: https://zenodo.org/records/7930043 (accessed on 2 January 2024).
- Bioconductor—Fgsea. Available online: https://bioconductor.org/packages/release/bioc/html/fgsea.html (accessed on 2 January 2024).


Disclaimer/Publisher’s Note: The statements, opinions and data contained in all publications are solely those of the individual author(s) and contributor(s) and not of MDPI and/or the editor(s). MDPI and/or the editor(s) disclaim responsibility for any injury to people or property resulting from any ideas, methods, instructions or products referred to in the content. |
© 2024 by the authors. Licensee MDPI, Basel, Switzerland. This article is an open access article distributed under the terms and conditions of the Creative Commons Attribution (CC BY) license (https://creativecommons.org/licenses/by/4.0/).
Share and Cite
Lukosevicius, R.; Alzbutas, G.; Varkalaite, G.; Salteniene, V.; Tilinde, D.; Juzenas, S.; Kulokiene, U.; Janciauskas, D.; Poskiene, L.; Adamonis, K.; et al. 5′-Isoforms of miR-1246 Have Distinct Targets and Stronger Functional Impact Compared with Canonical miR-1246 in Colorectal Cancer Cells In Vitro. Int. J. Mol. Sci. 2024, 25, 2808. https://doi.org/10.3390/ijms25052808
Lukosevicius R, Alzbutas G, Varkalaite G, Salteniene V, Tilinde D, Juzenas S, Kulokiene U, Janciauskas D, Poskiene L, Adamonis K, et al. 5′-Isoforms of miR-1246 Have Distinct Targets and Stronger Functional Impact Compared with Canonical miR-1246 in Colorectal Cancer Cells In Vitro. International Journal of Molecular Sciences. 2024; 25(5):2808. https://doi.org/10.3390/ijms25052808
Chicago/Turabian StyleLukosevicius, Rokas, Gediminas Alzbutas, Greta Varkalaite, Violeta Salteniene, Deimante Tilinde, Simonas Juzenas, Ugne Kulokiene, Dainius Janciauskas, Lina Poskiene, Kestutis Adamonis, and et al. 2024. "5′-Isoforms of miR-1246 Have Distinct Targets and Stronger Functional Impact Compared with Canonical miR-1246 in Colorectal Cancer Cells In Vitro" International Journal of Molecular Sciences 25, no. 5: 2808. https://doi.org/10.3390/ijms25052808