

Nicotinamide Mononucleotide (NMN) Works in Type 2 Diabetes through Unexpected Effects in Adipose Tissue, Not by Mitochondrial Biogenesis

 , ,
, ,
Abstract
:
1. Introduction
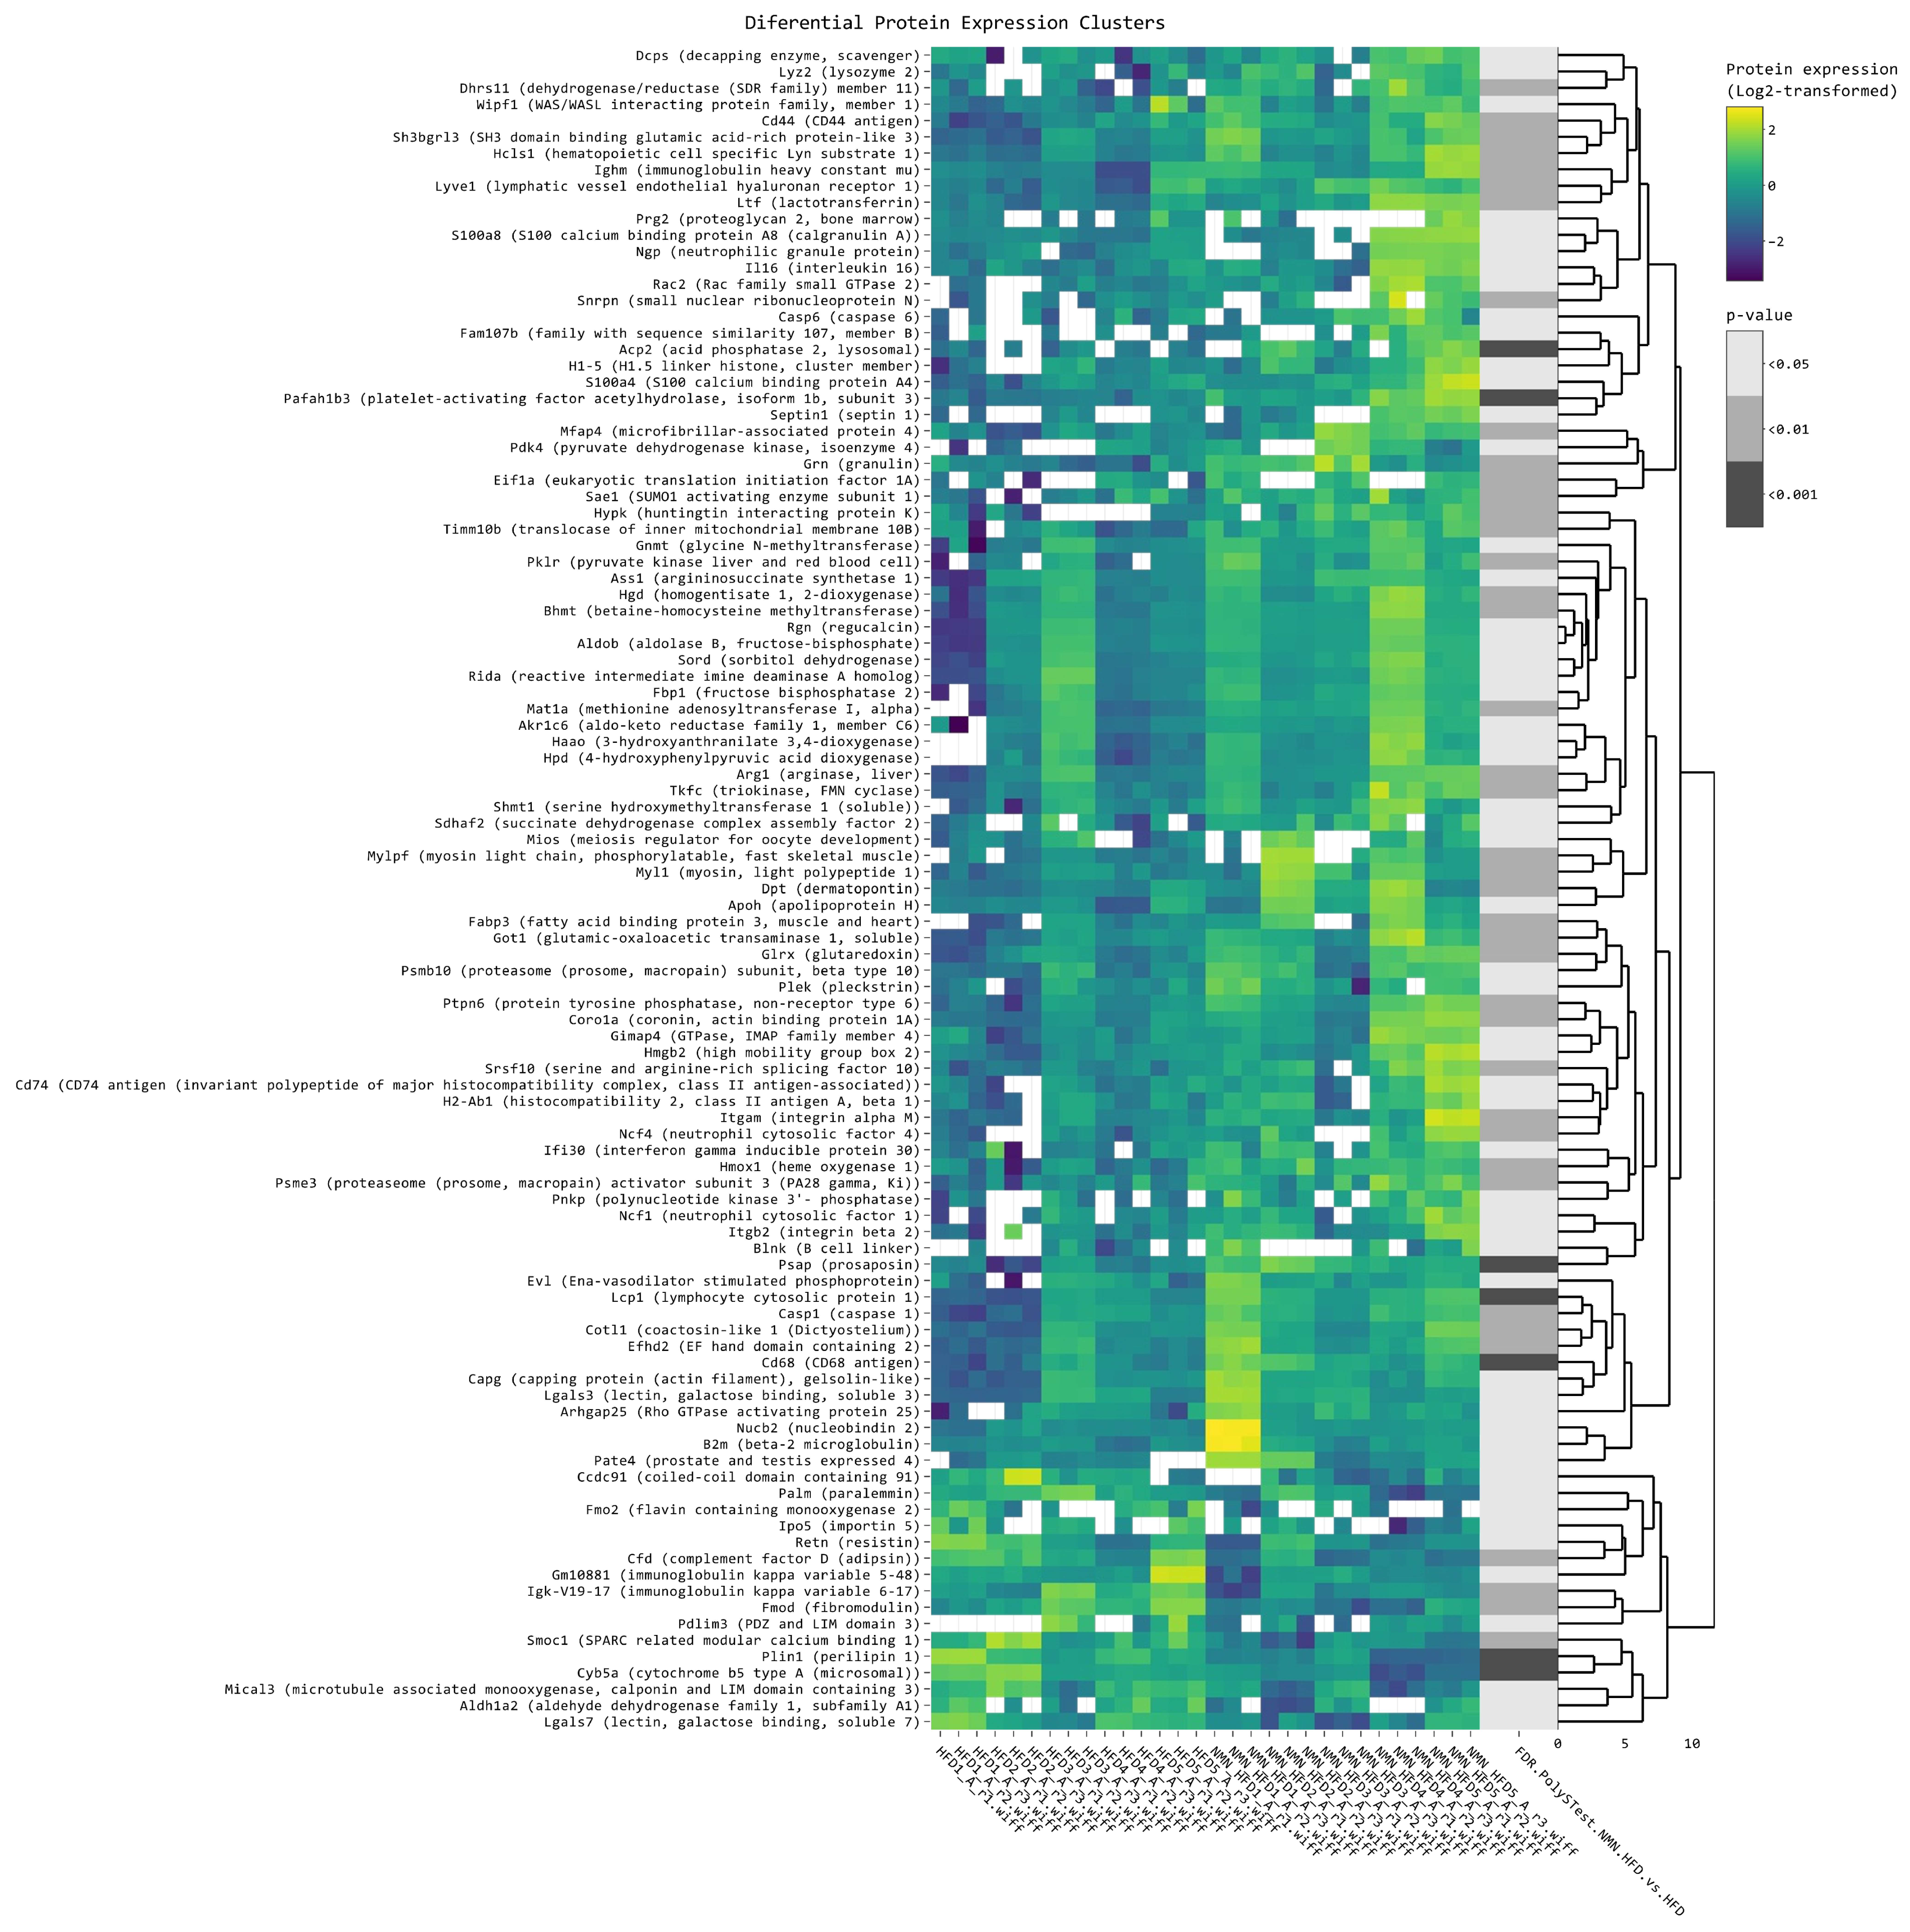
2. Results
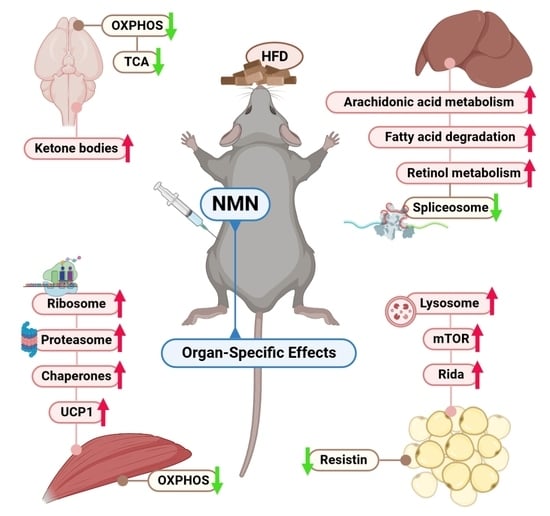
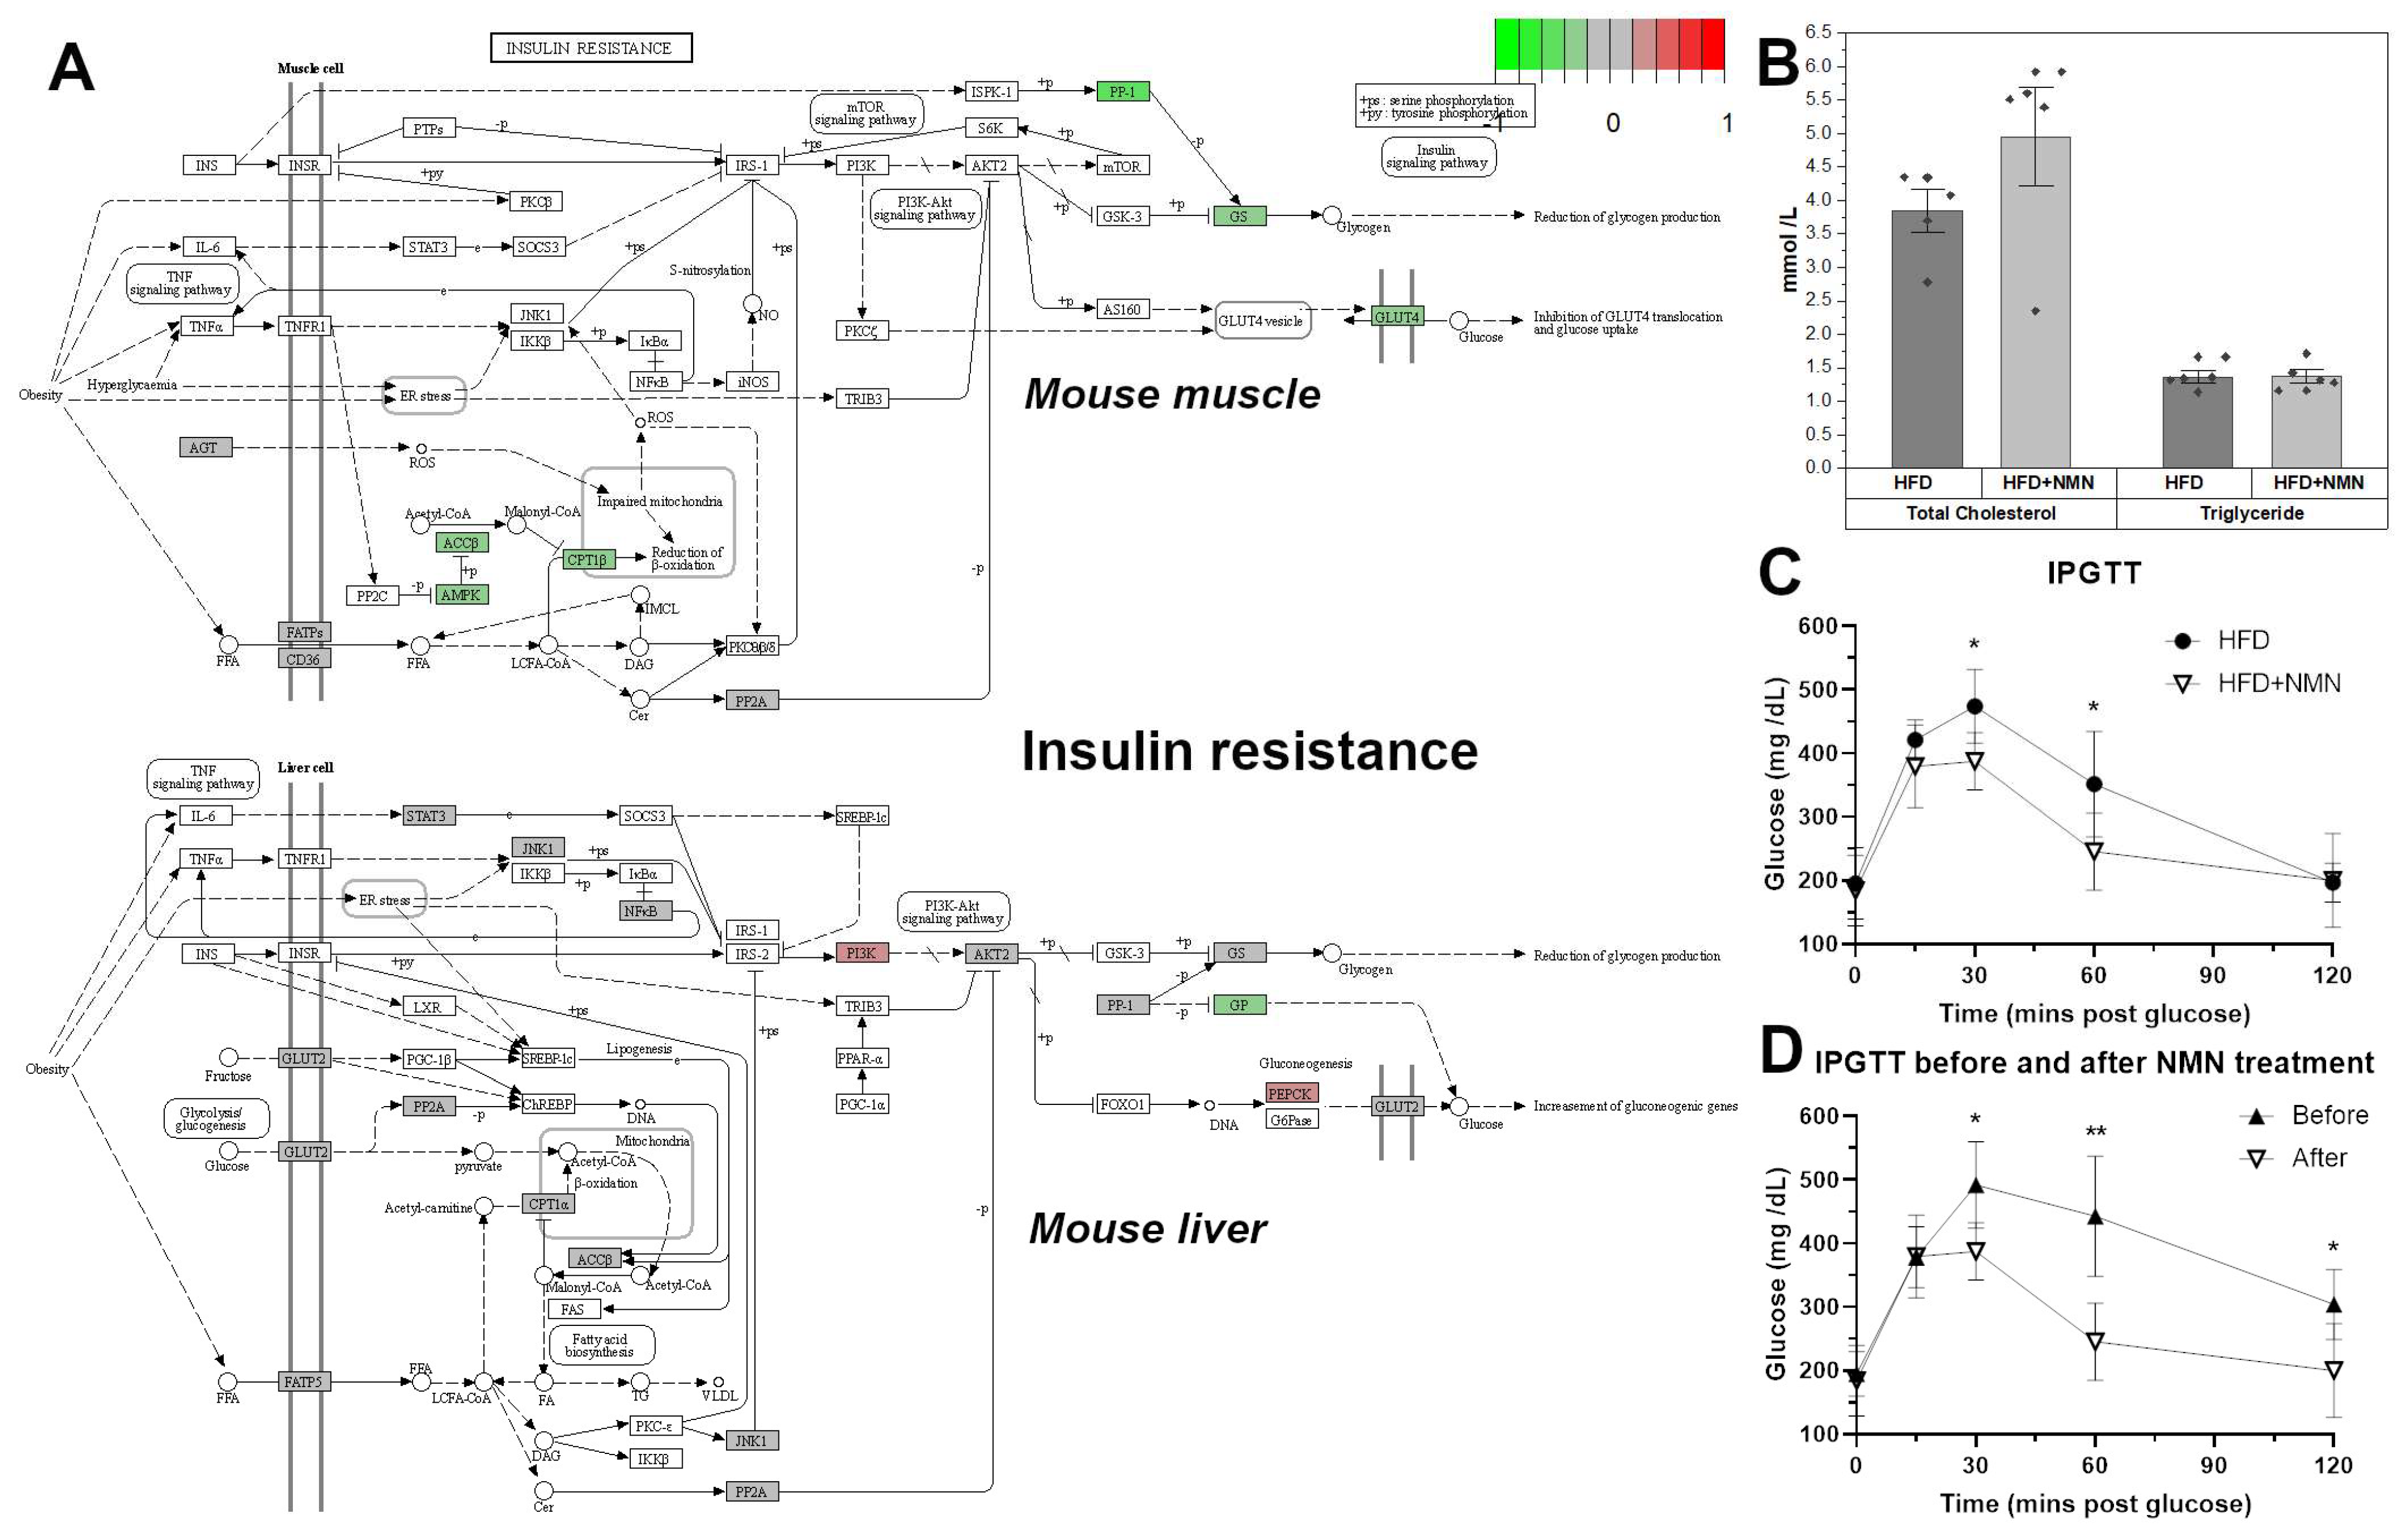
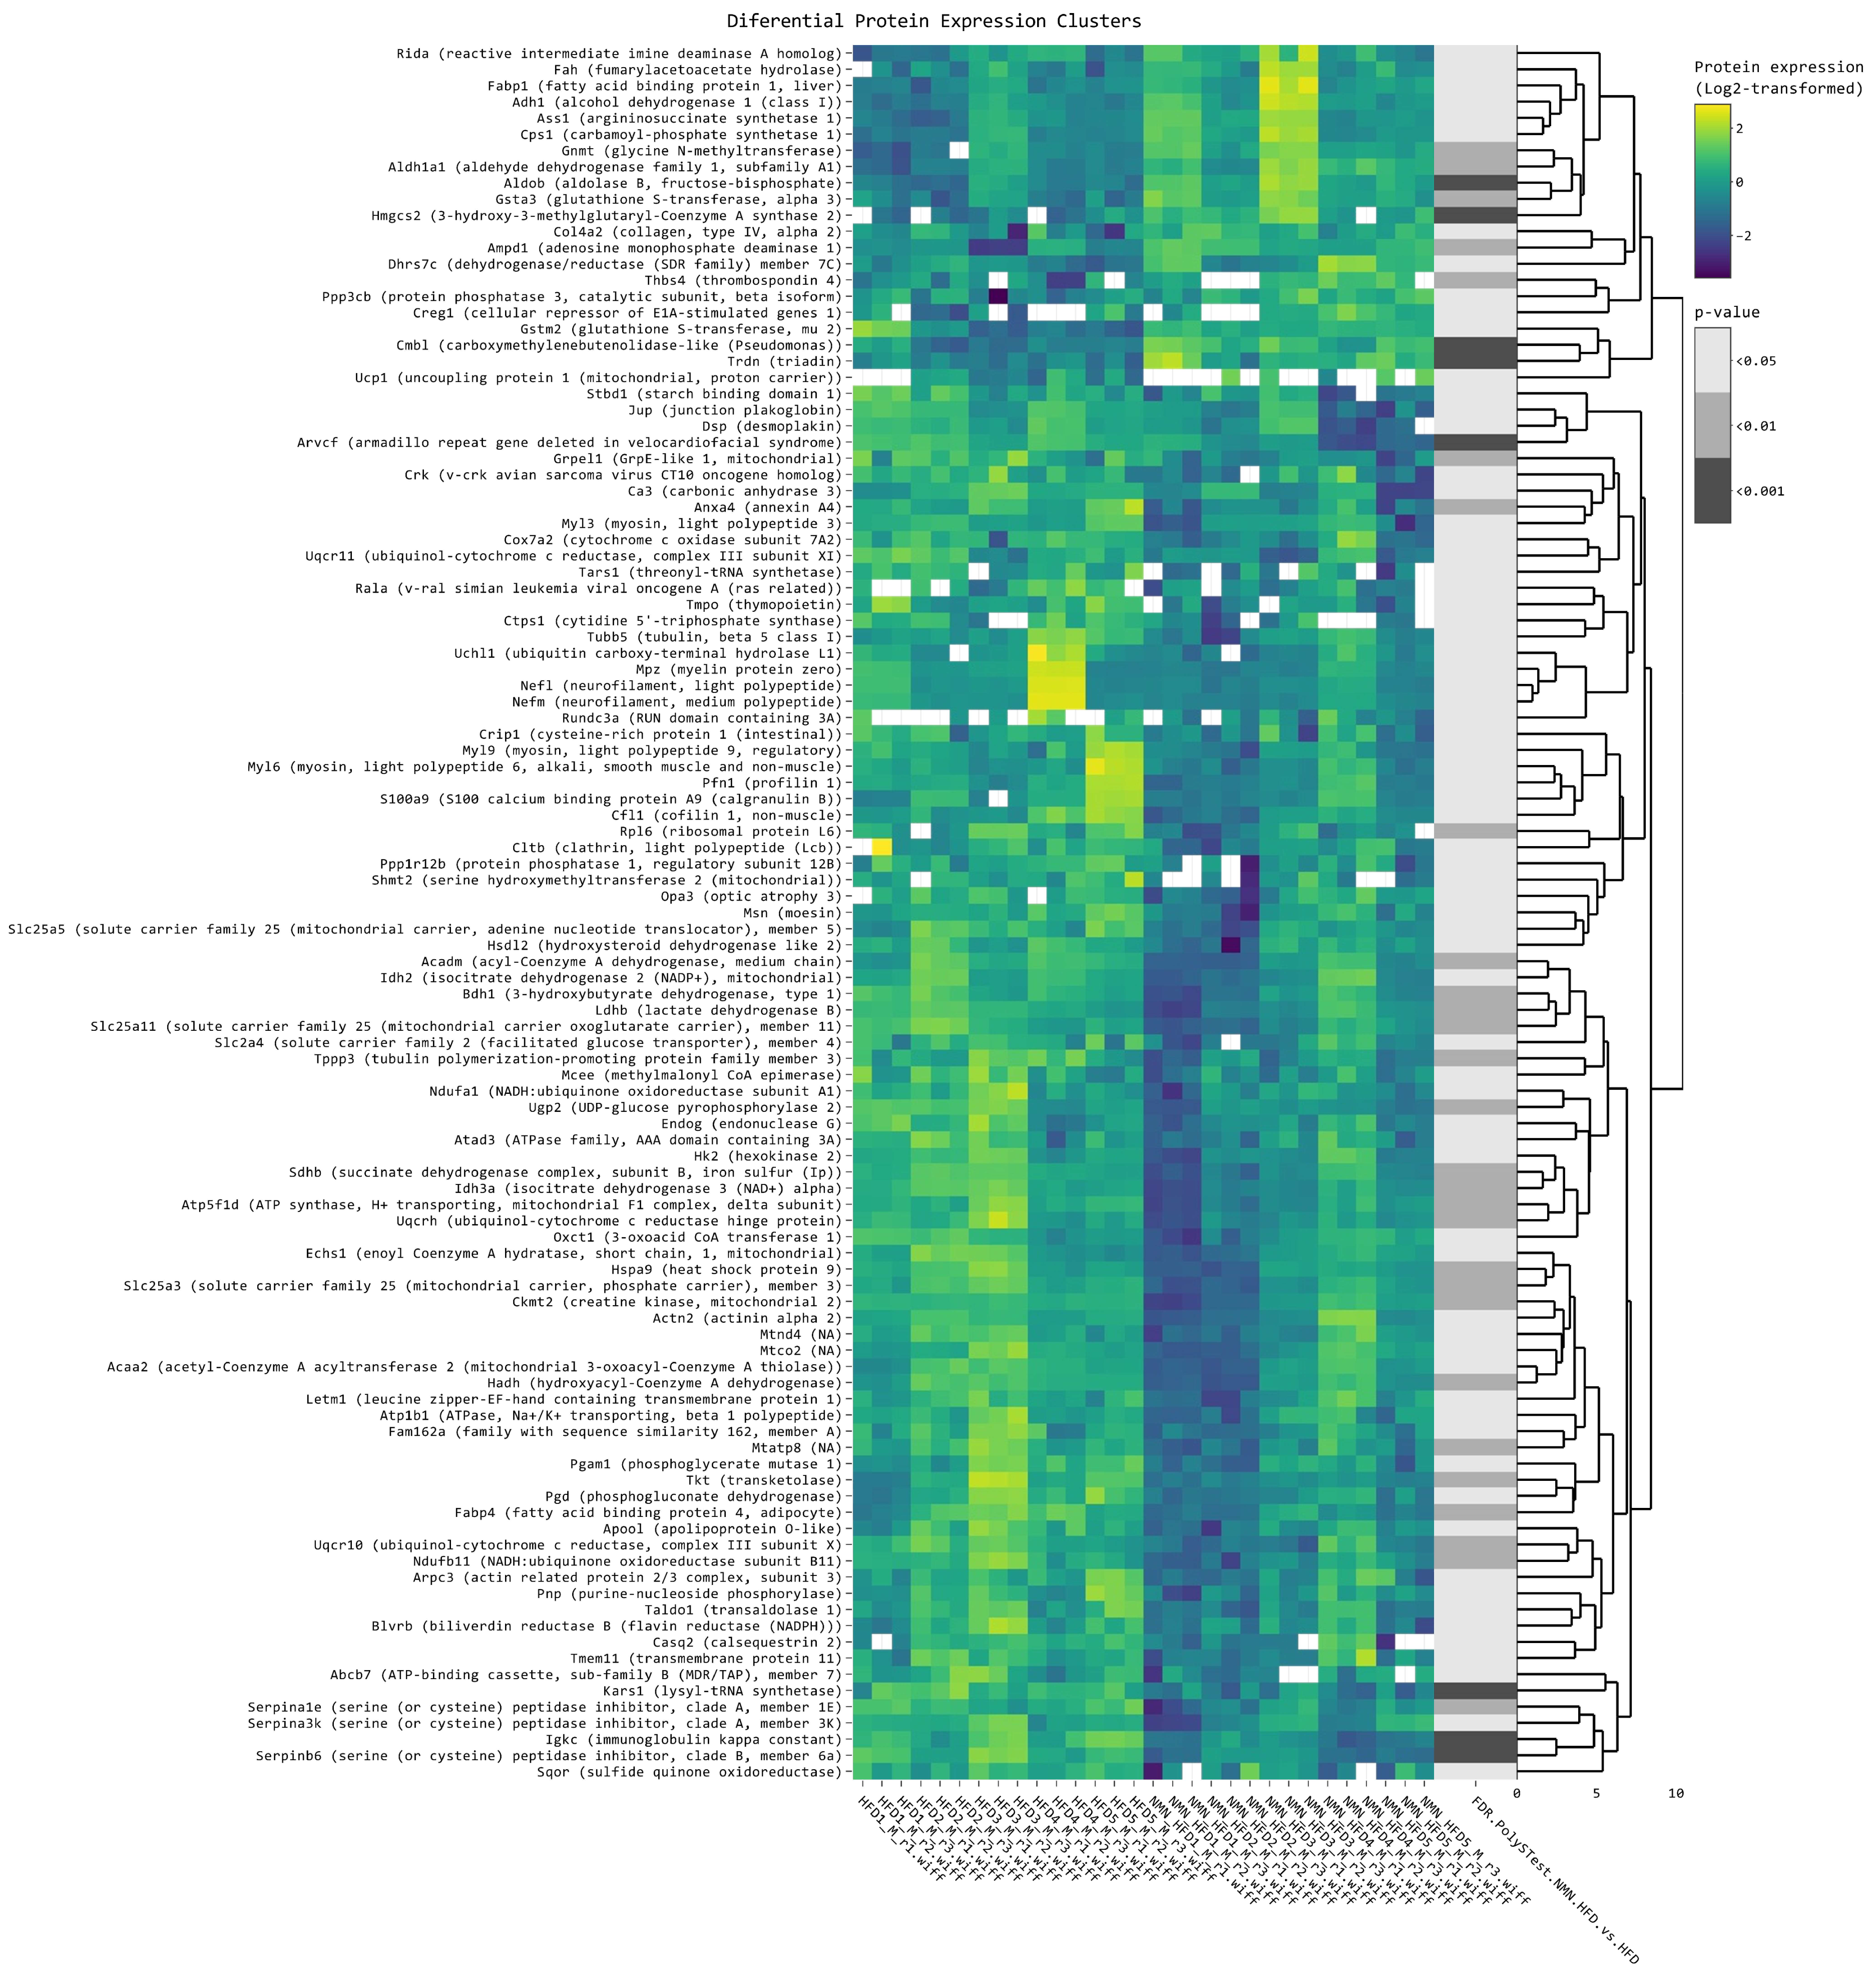
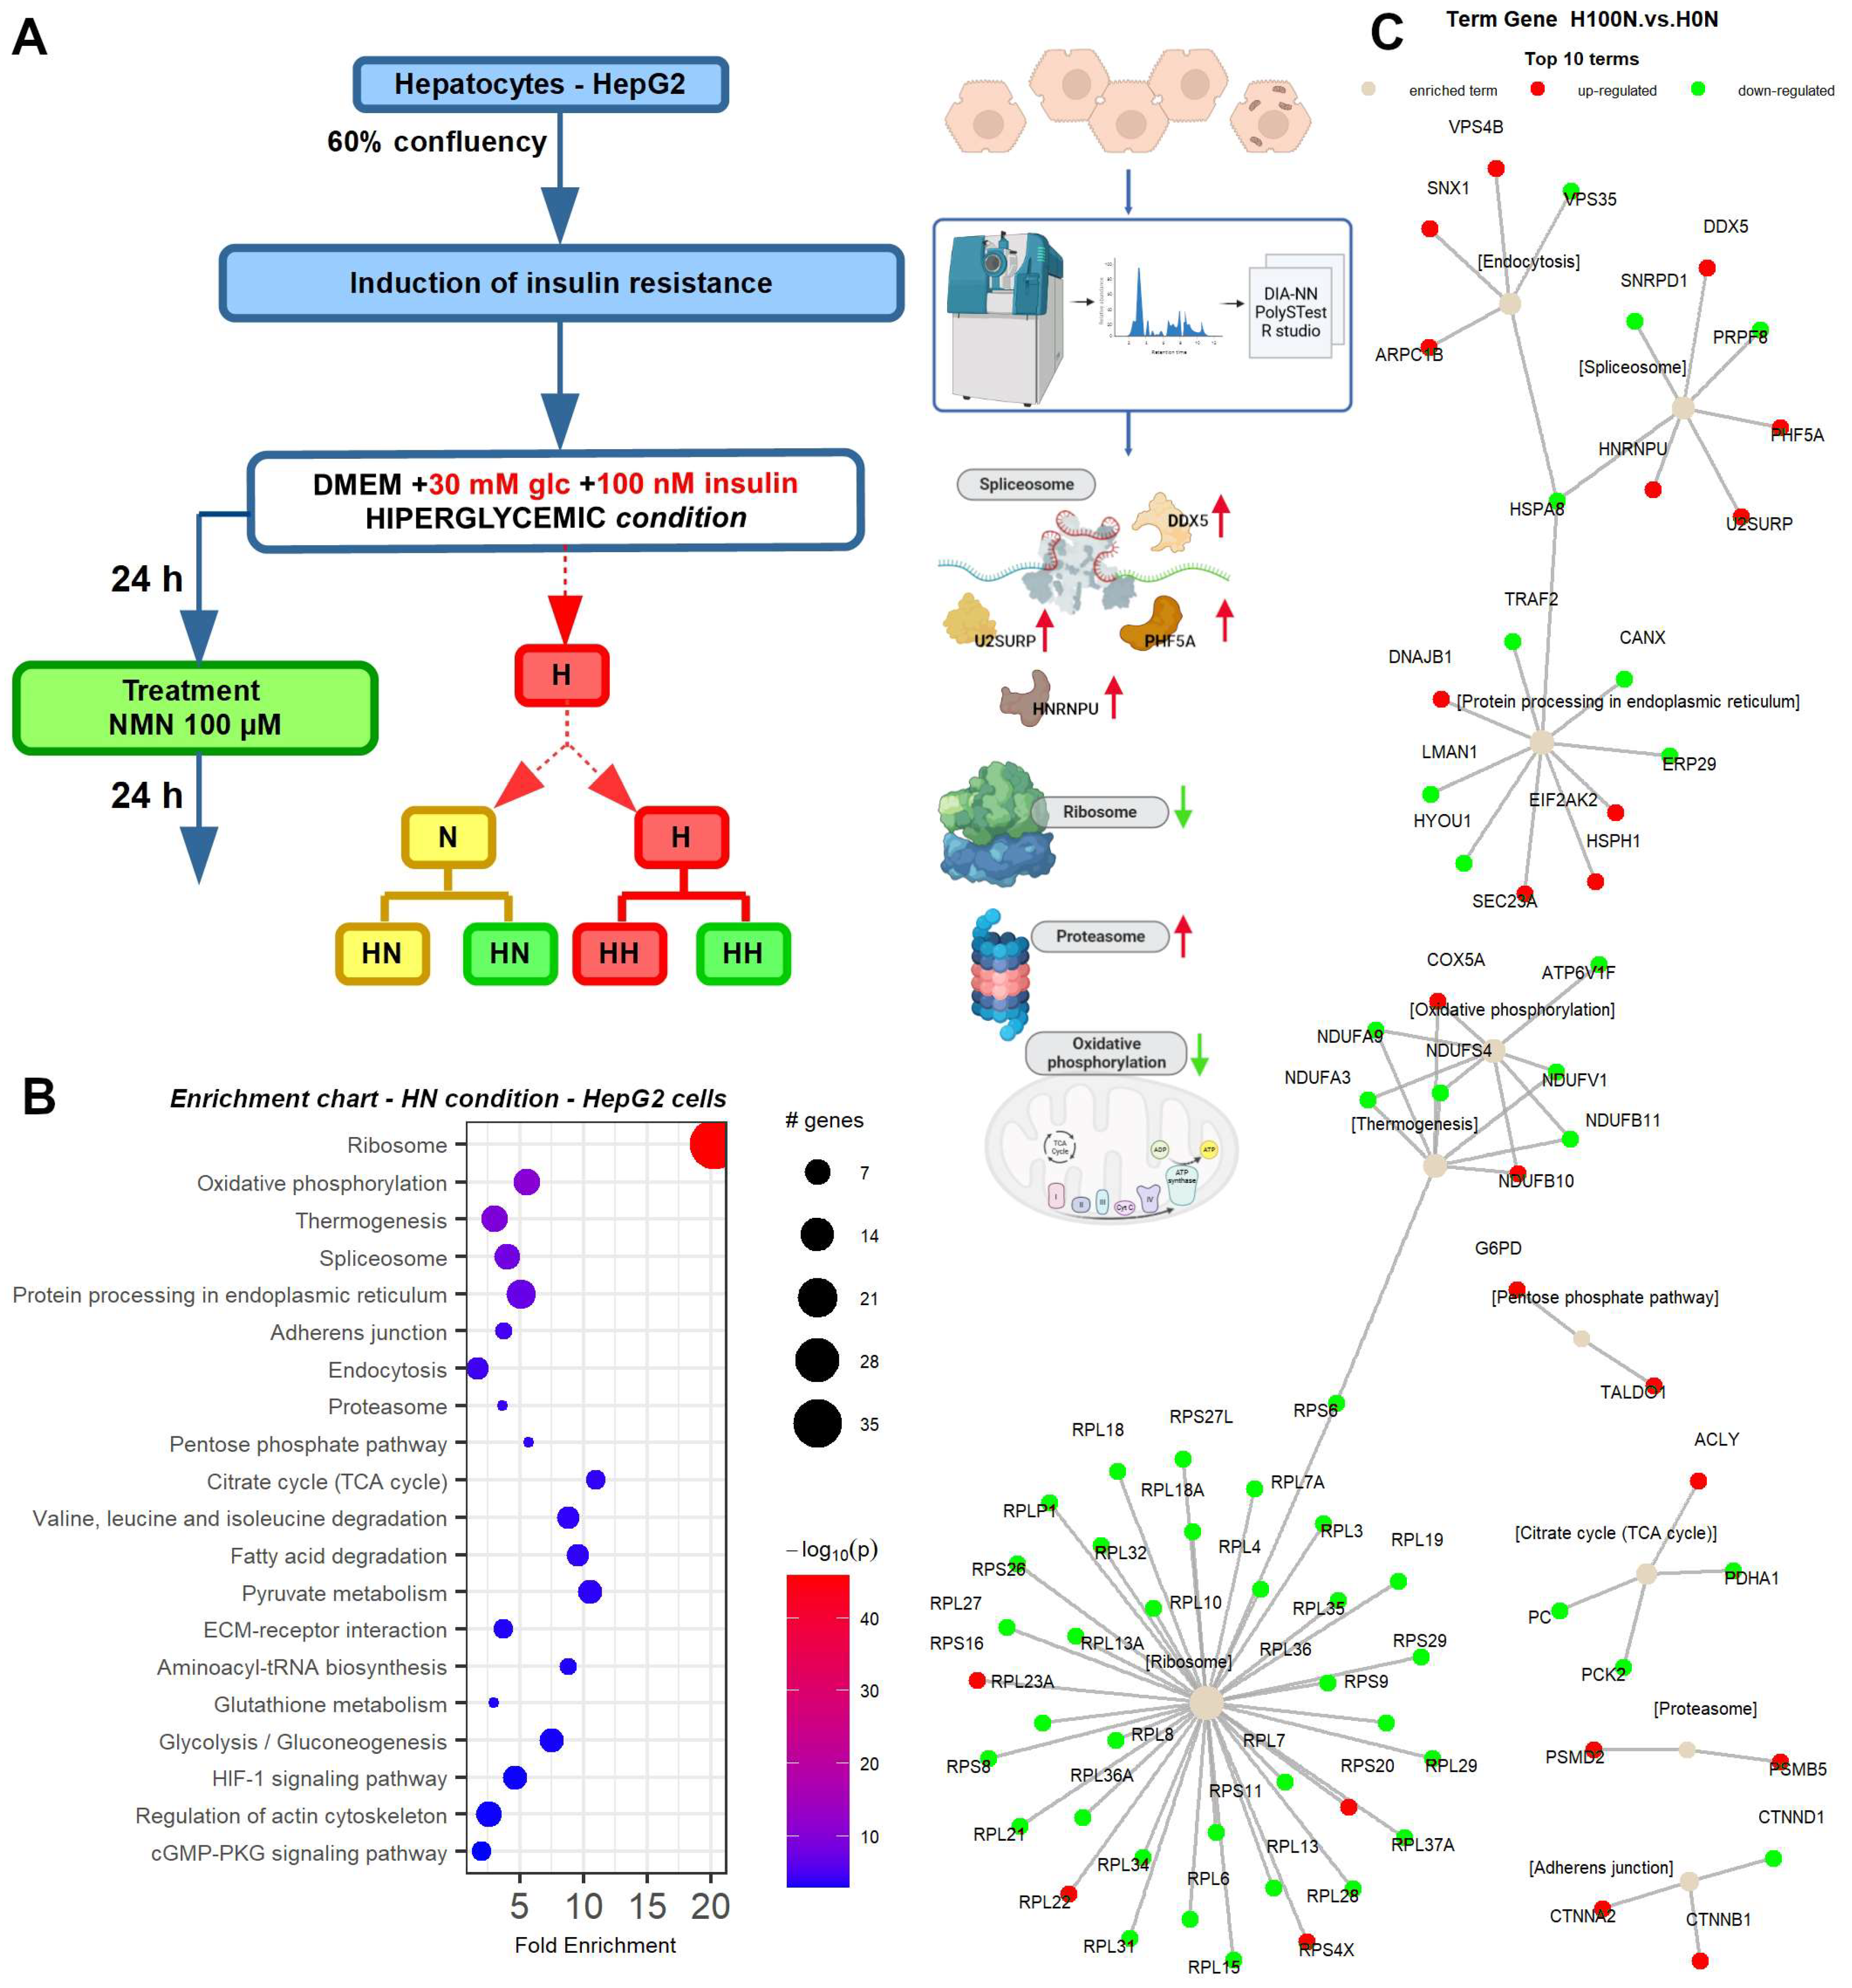
2.1. NMN Significantly Improved Glucose Uptake from Bloodstream in HFD Mice, But Not through Insulin Resistance Effects in Muscle or Liver
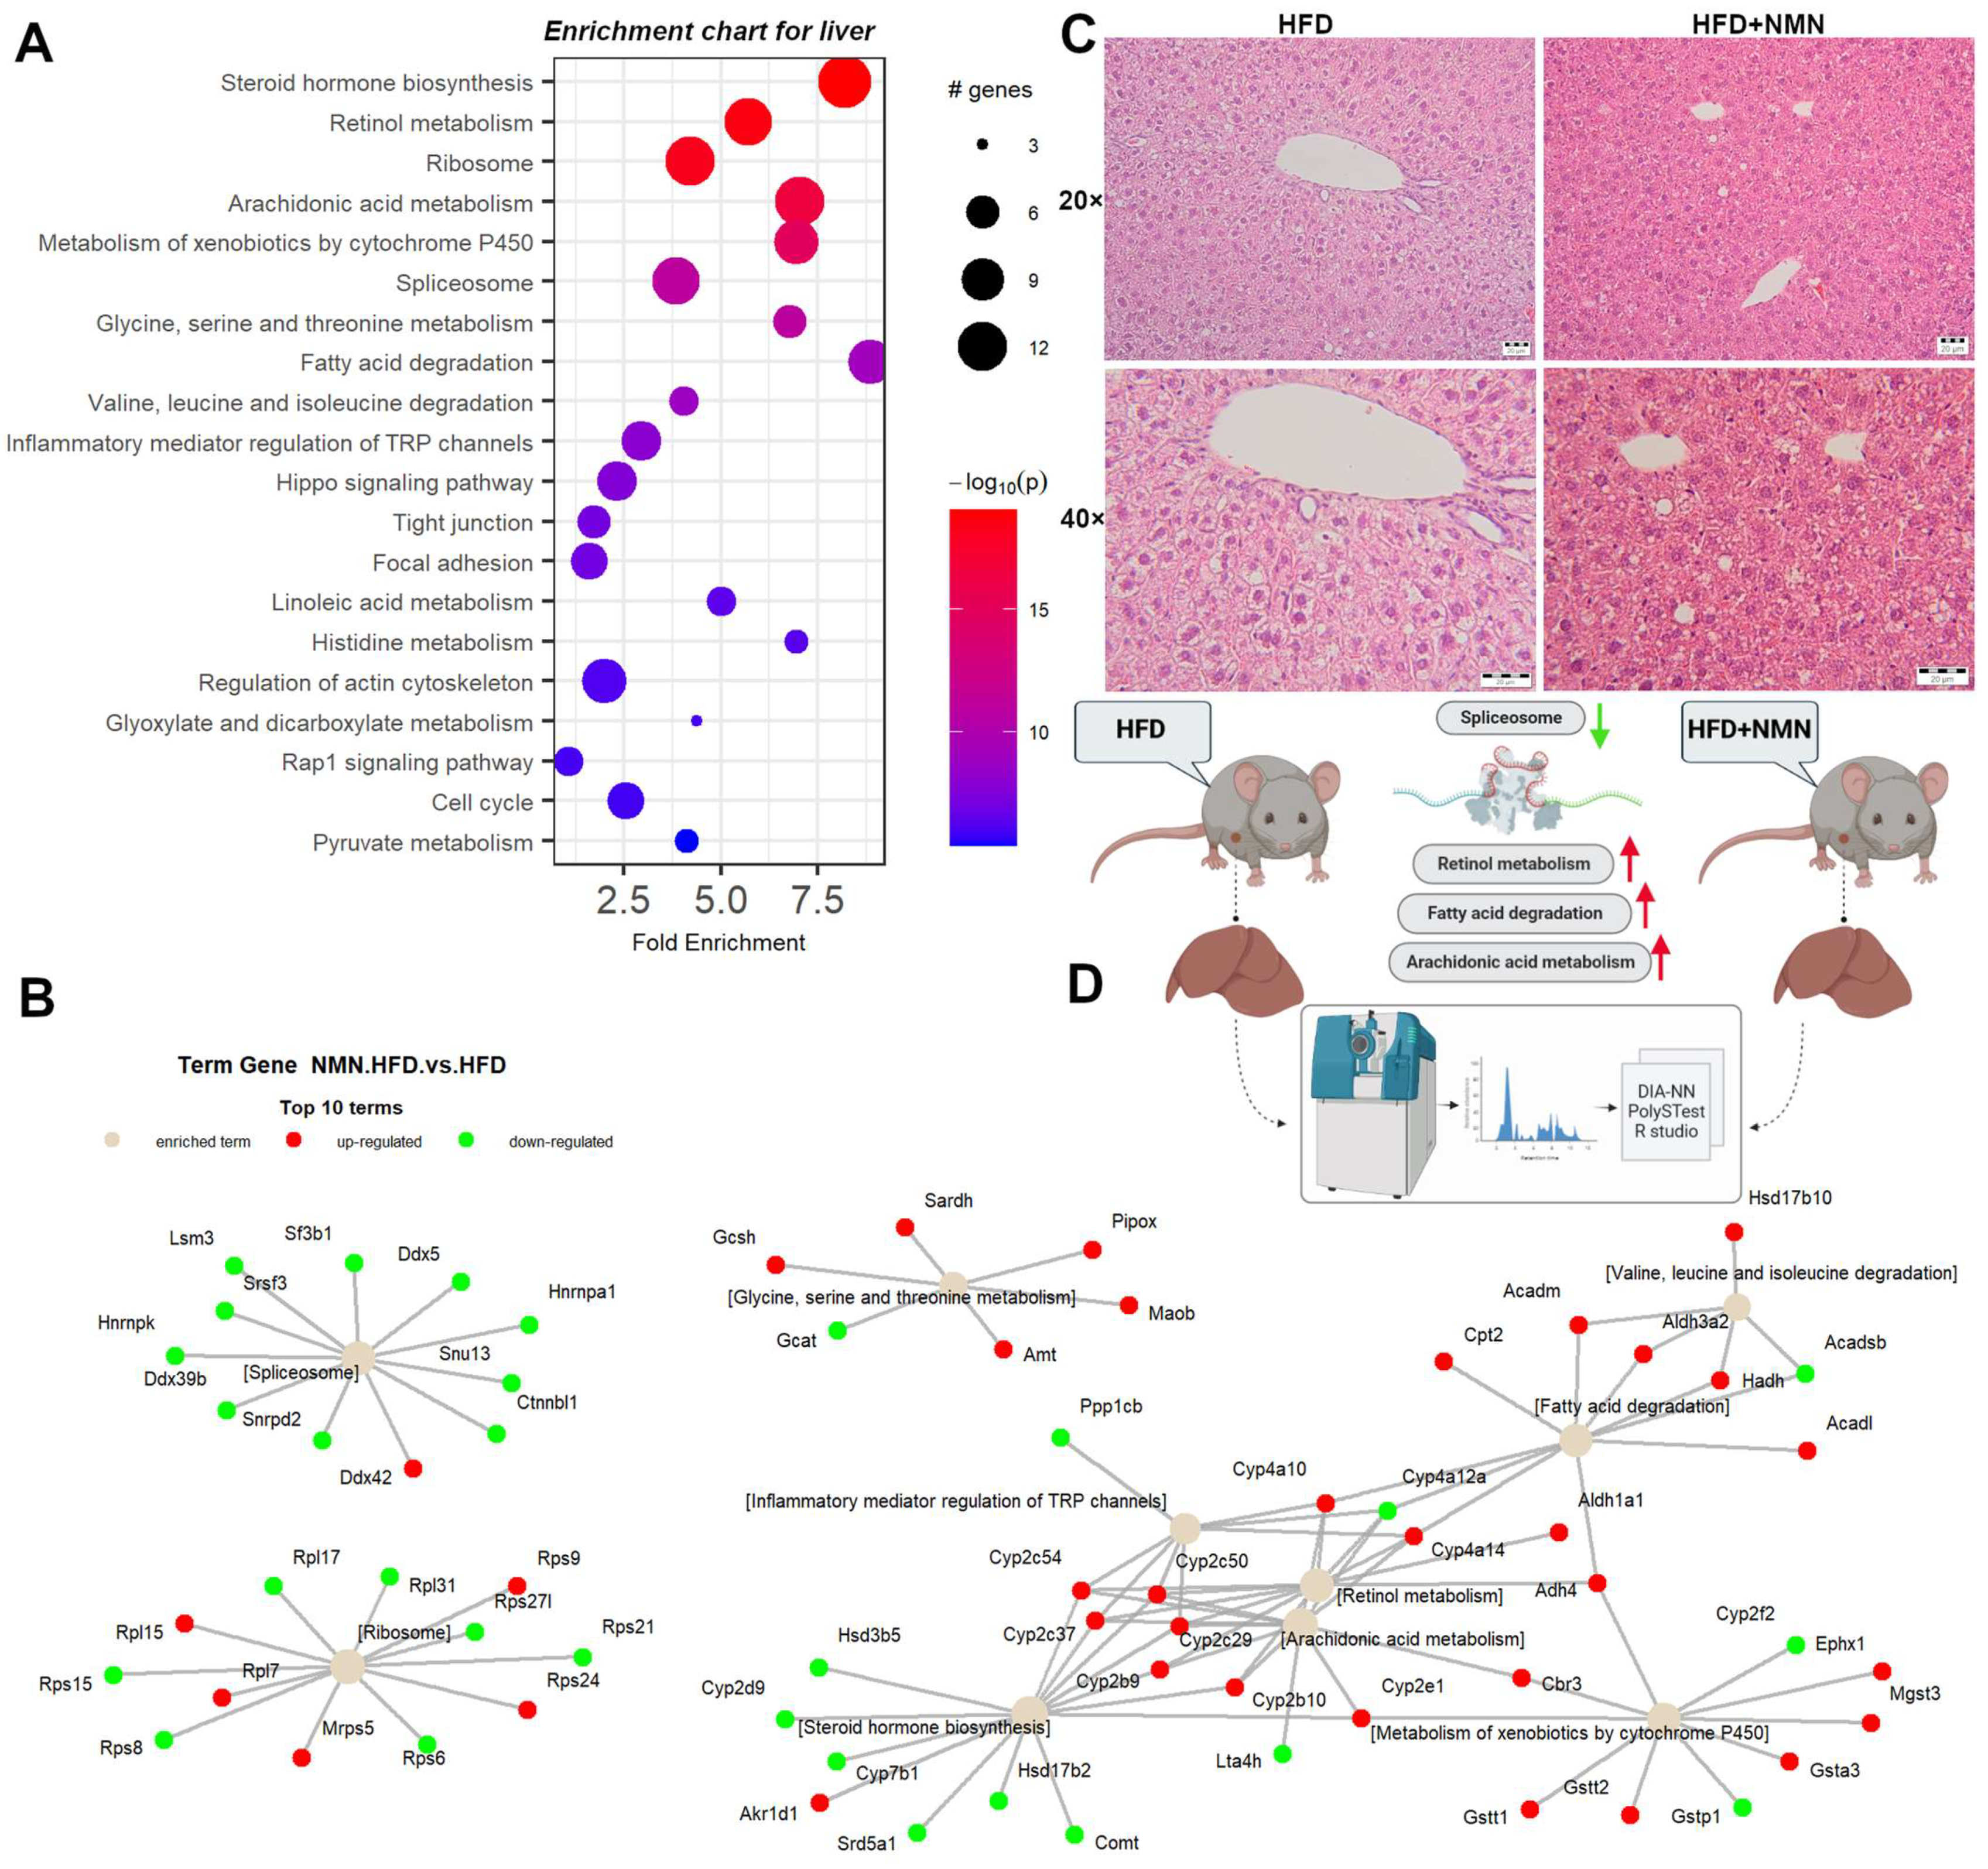
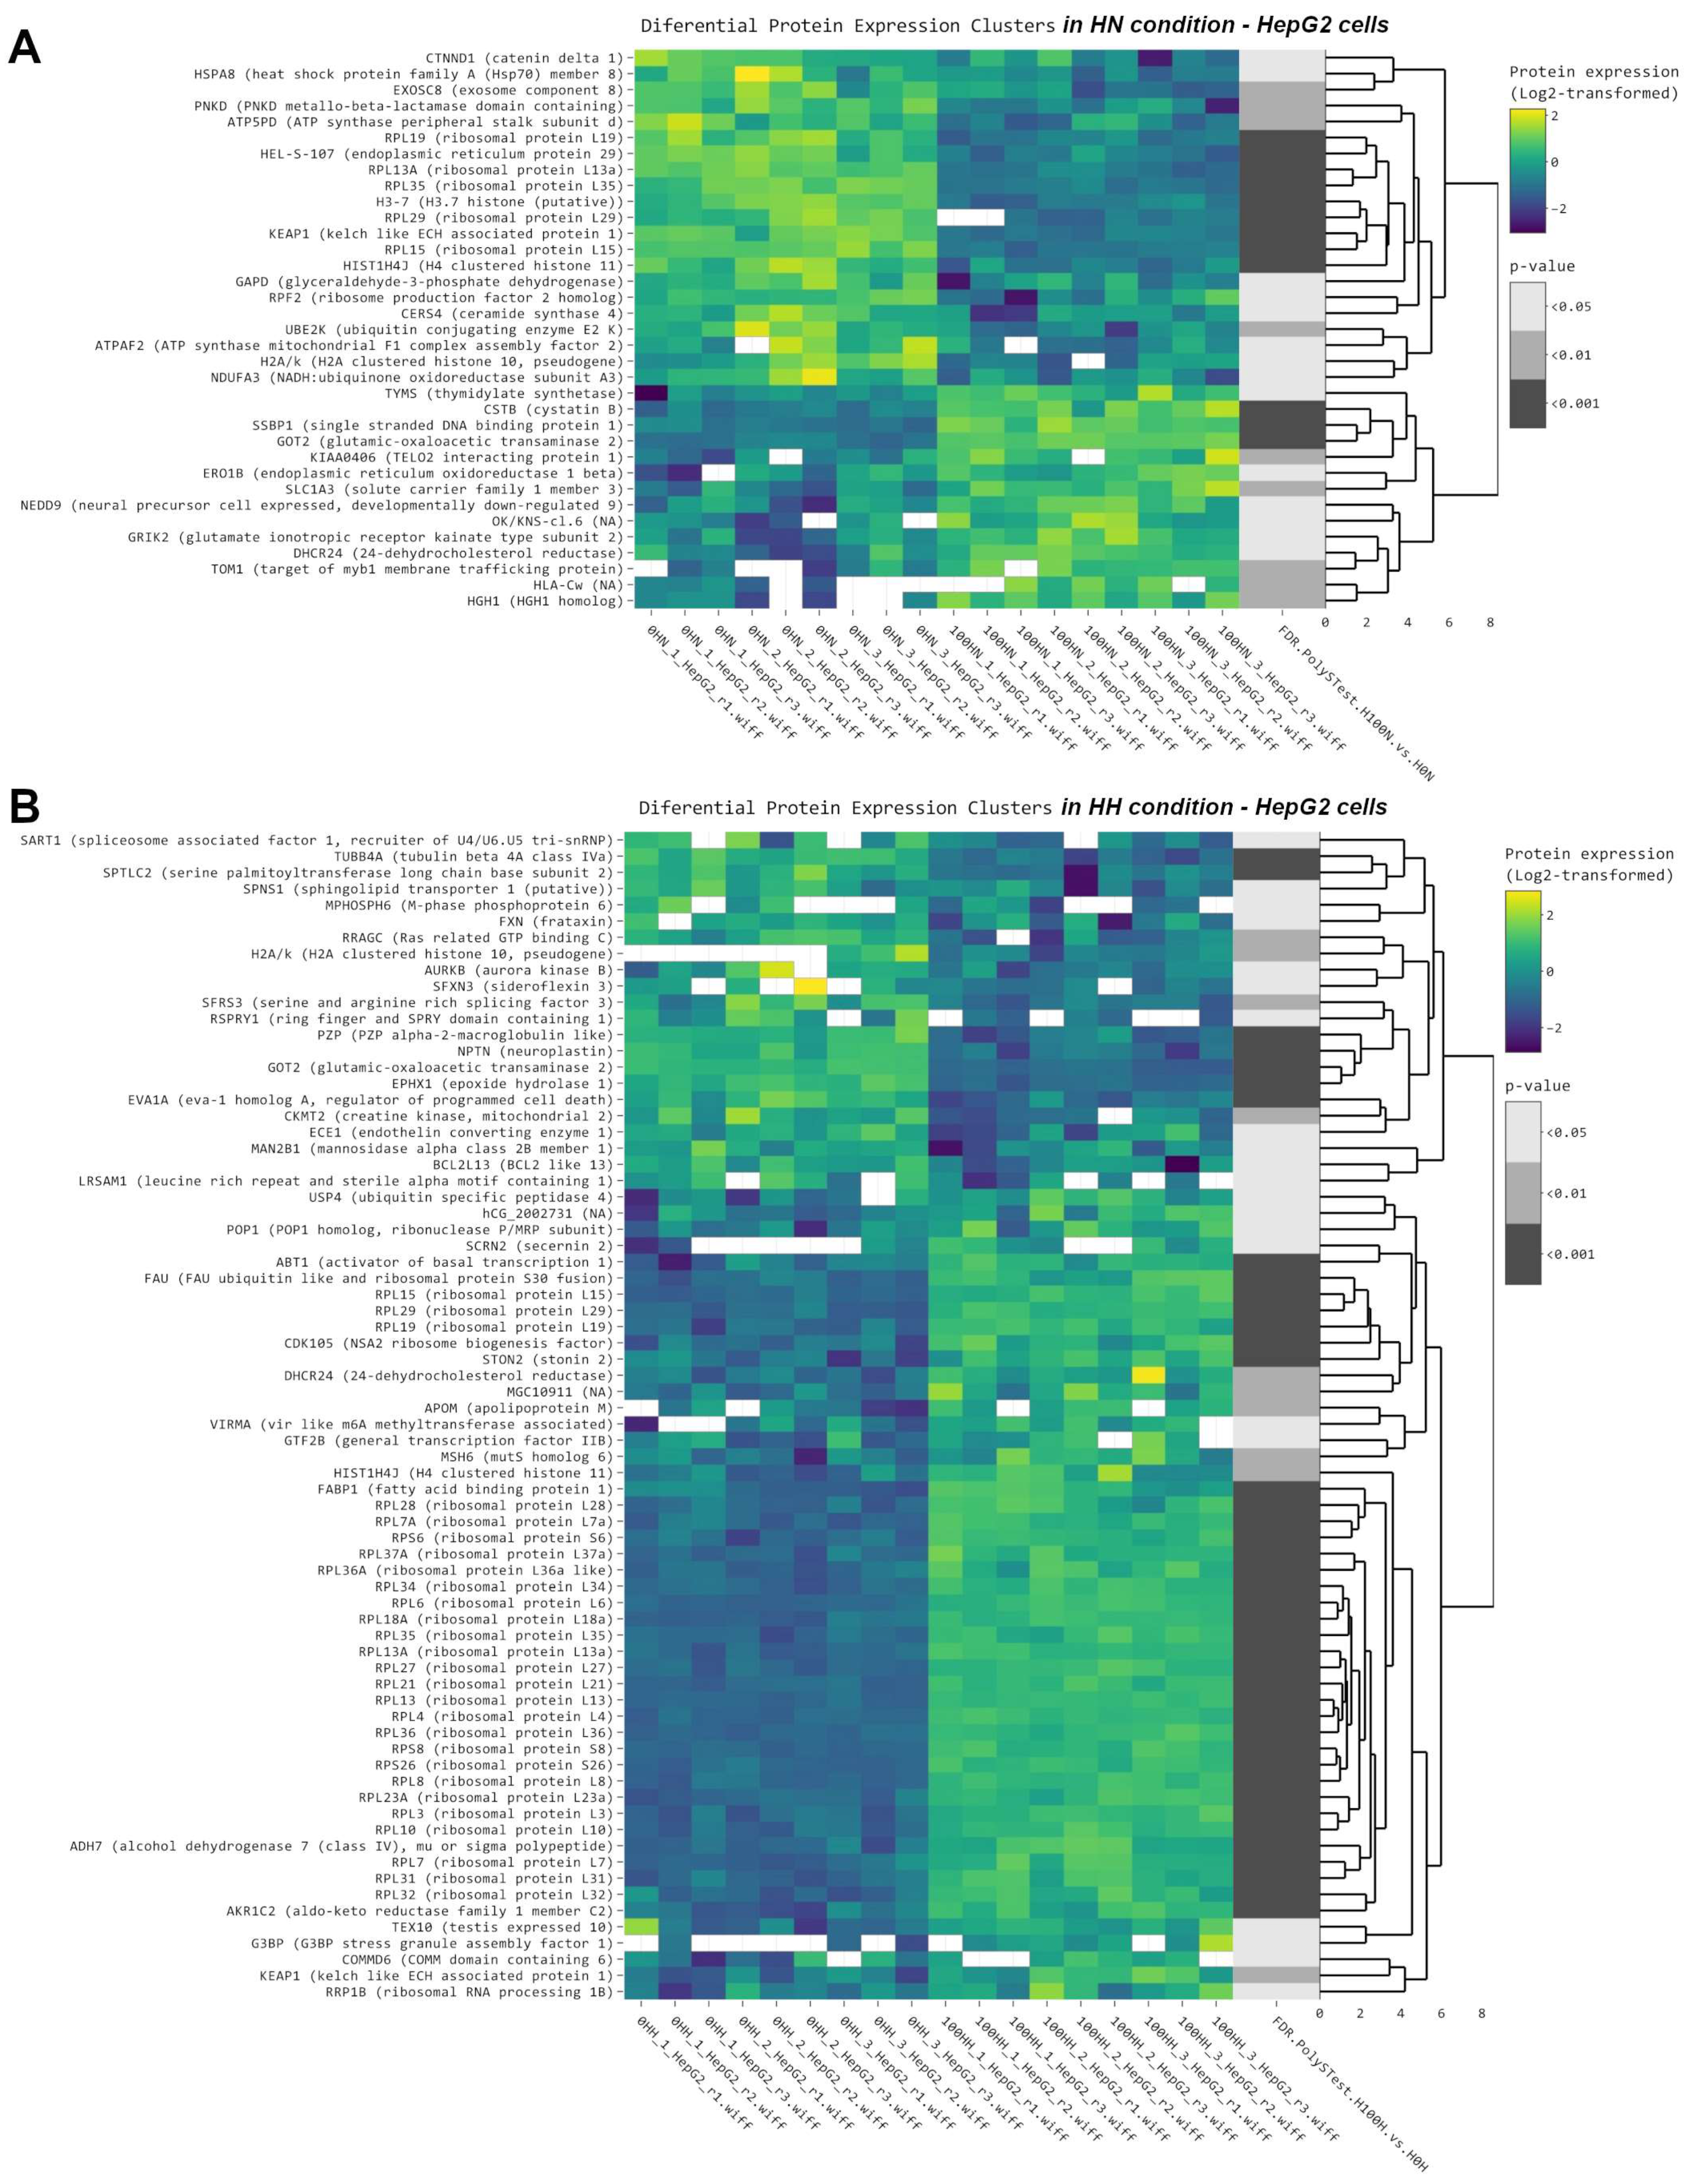
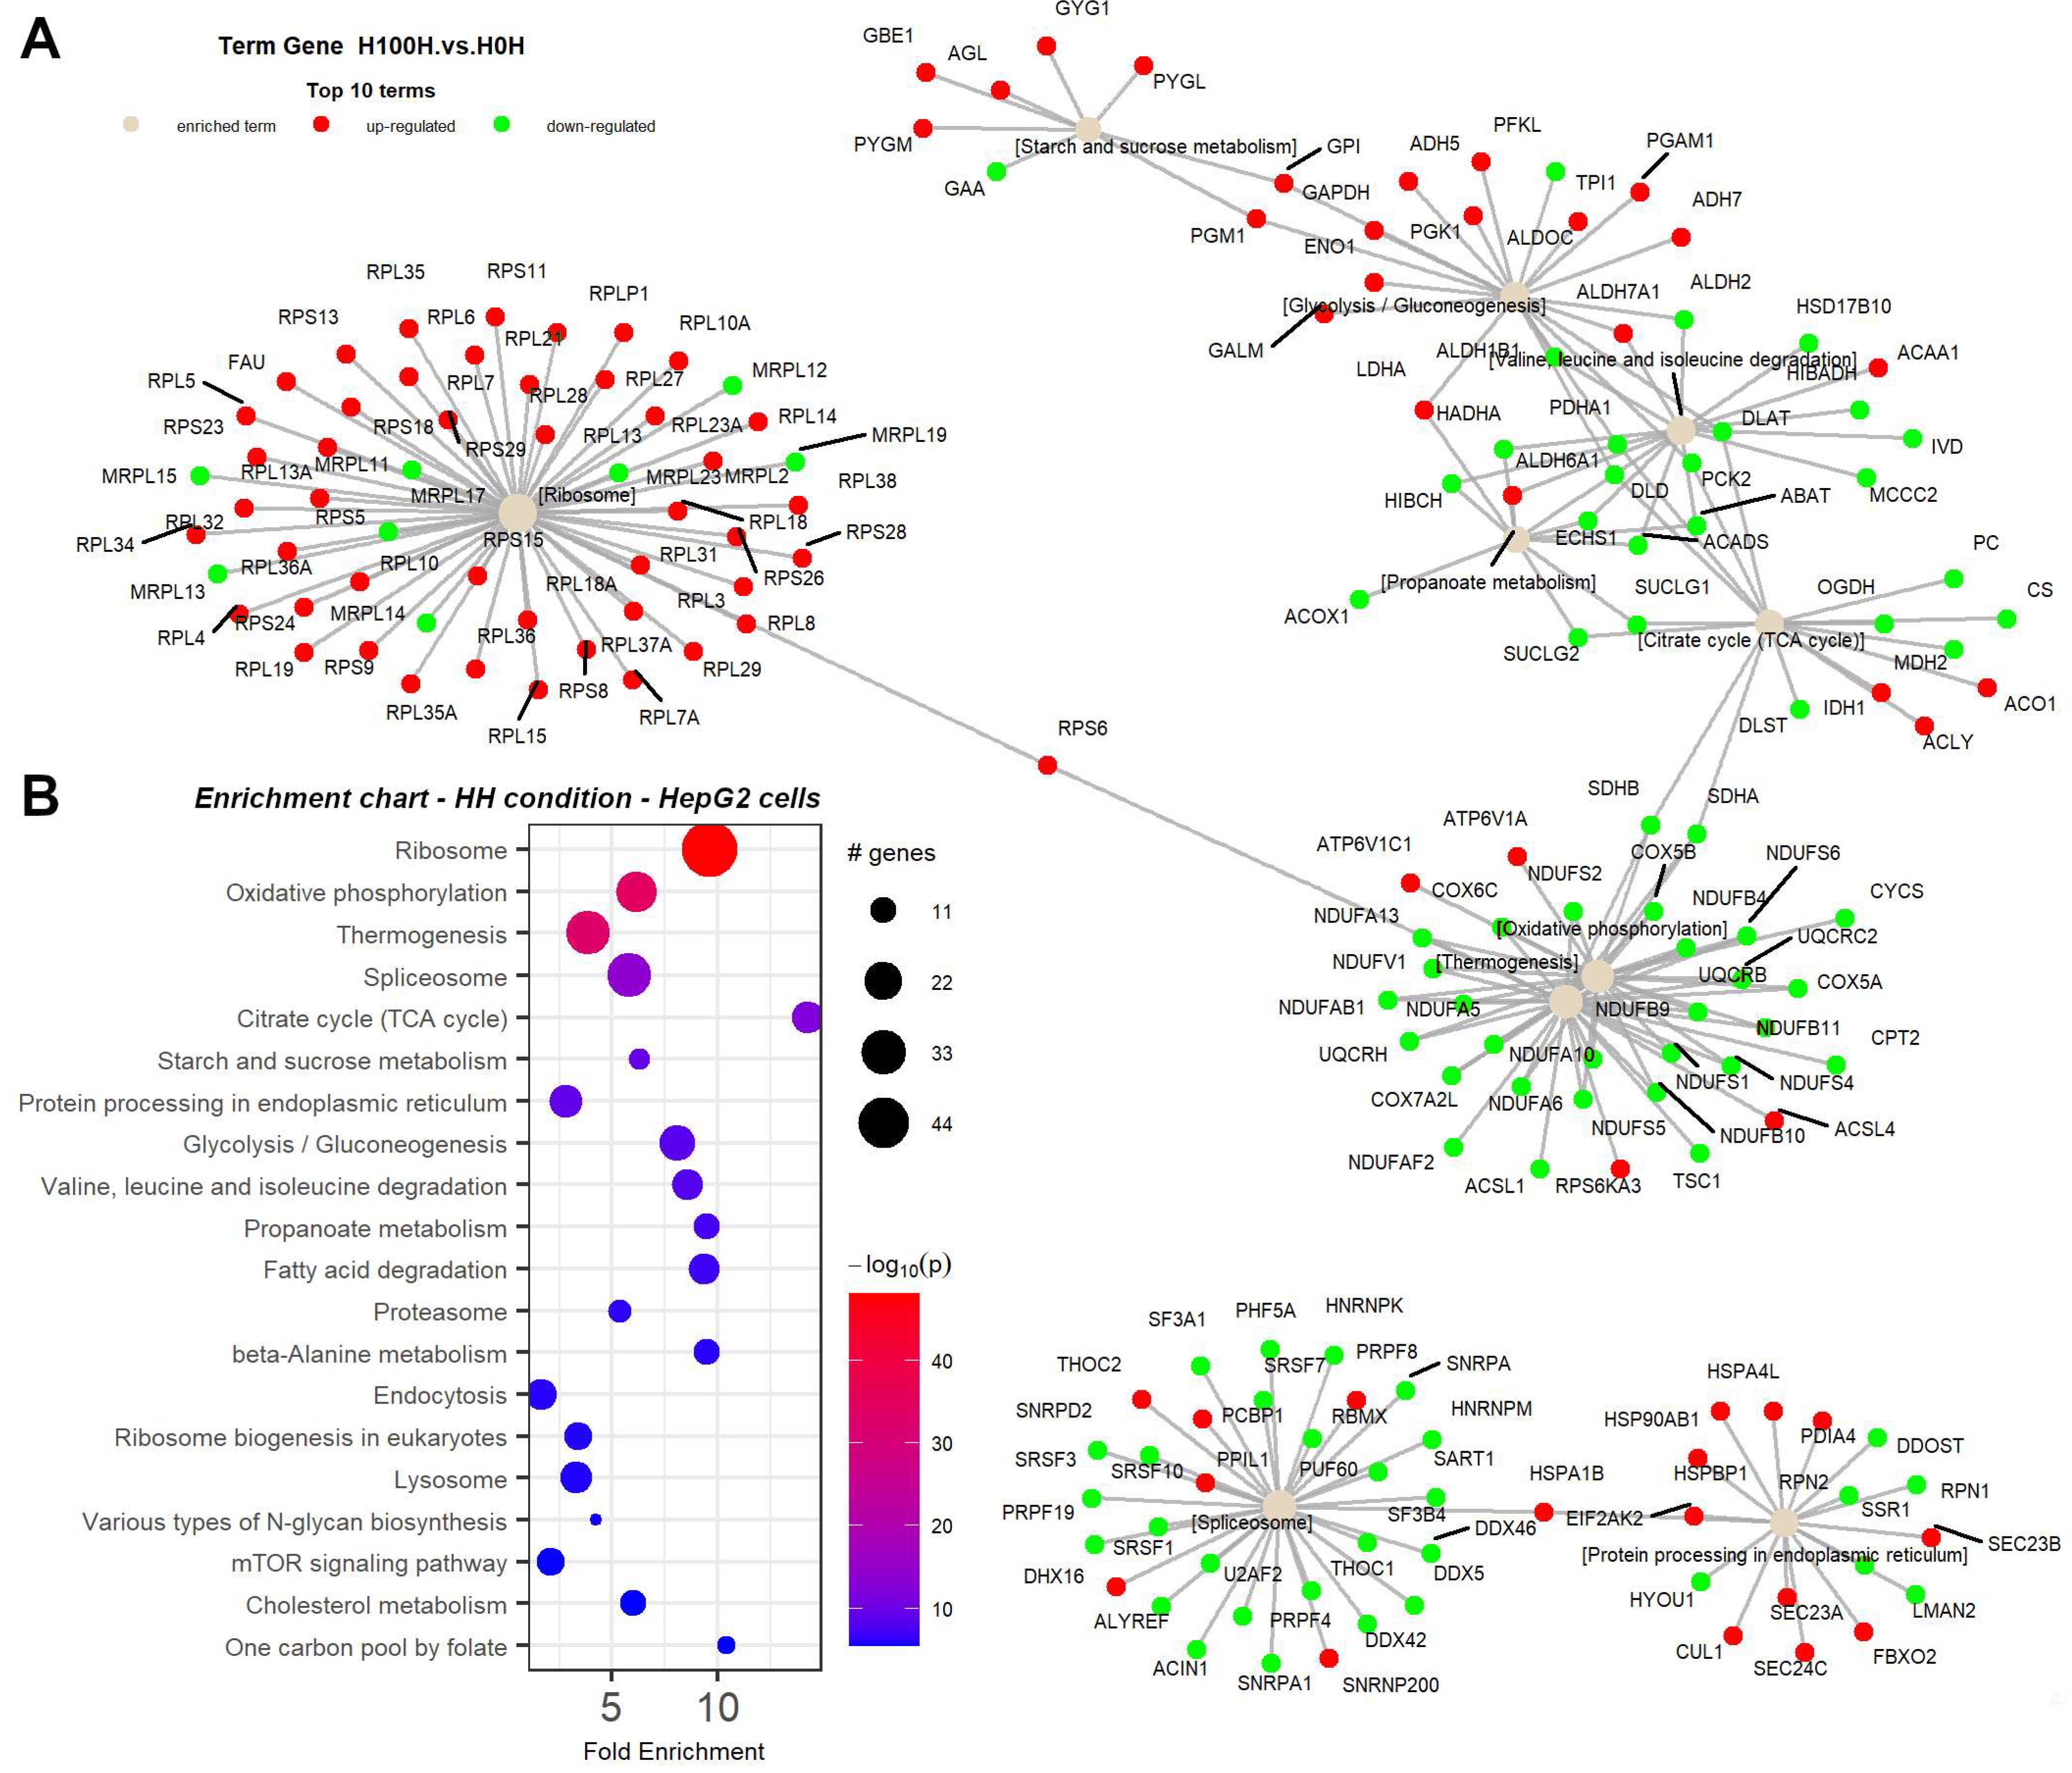
2.2. Protein Synthesis Is Mildly Impaired by NMN through Spliceosome Downregulation in HFD Mouse Liver
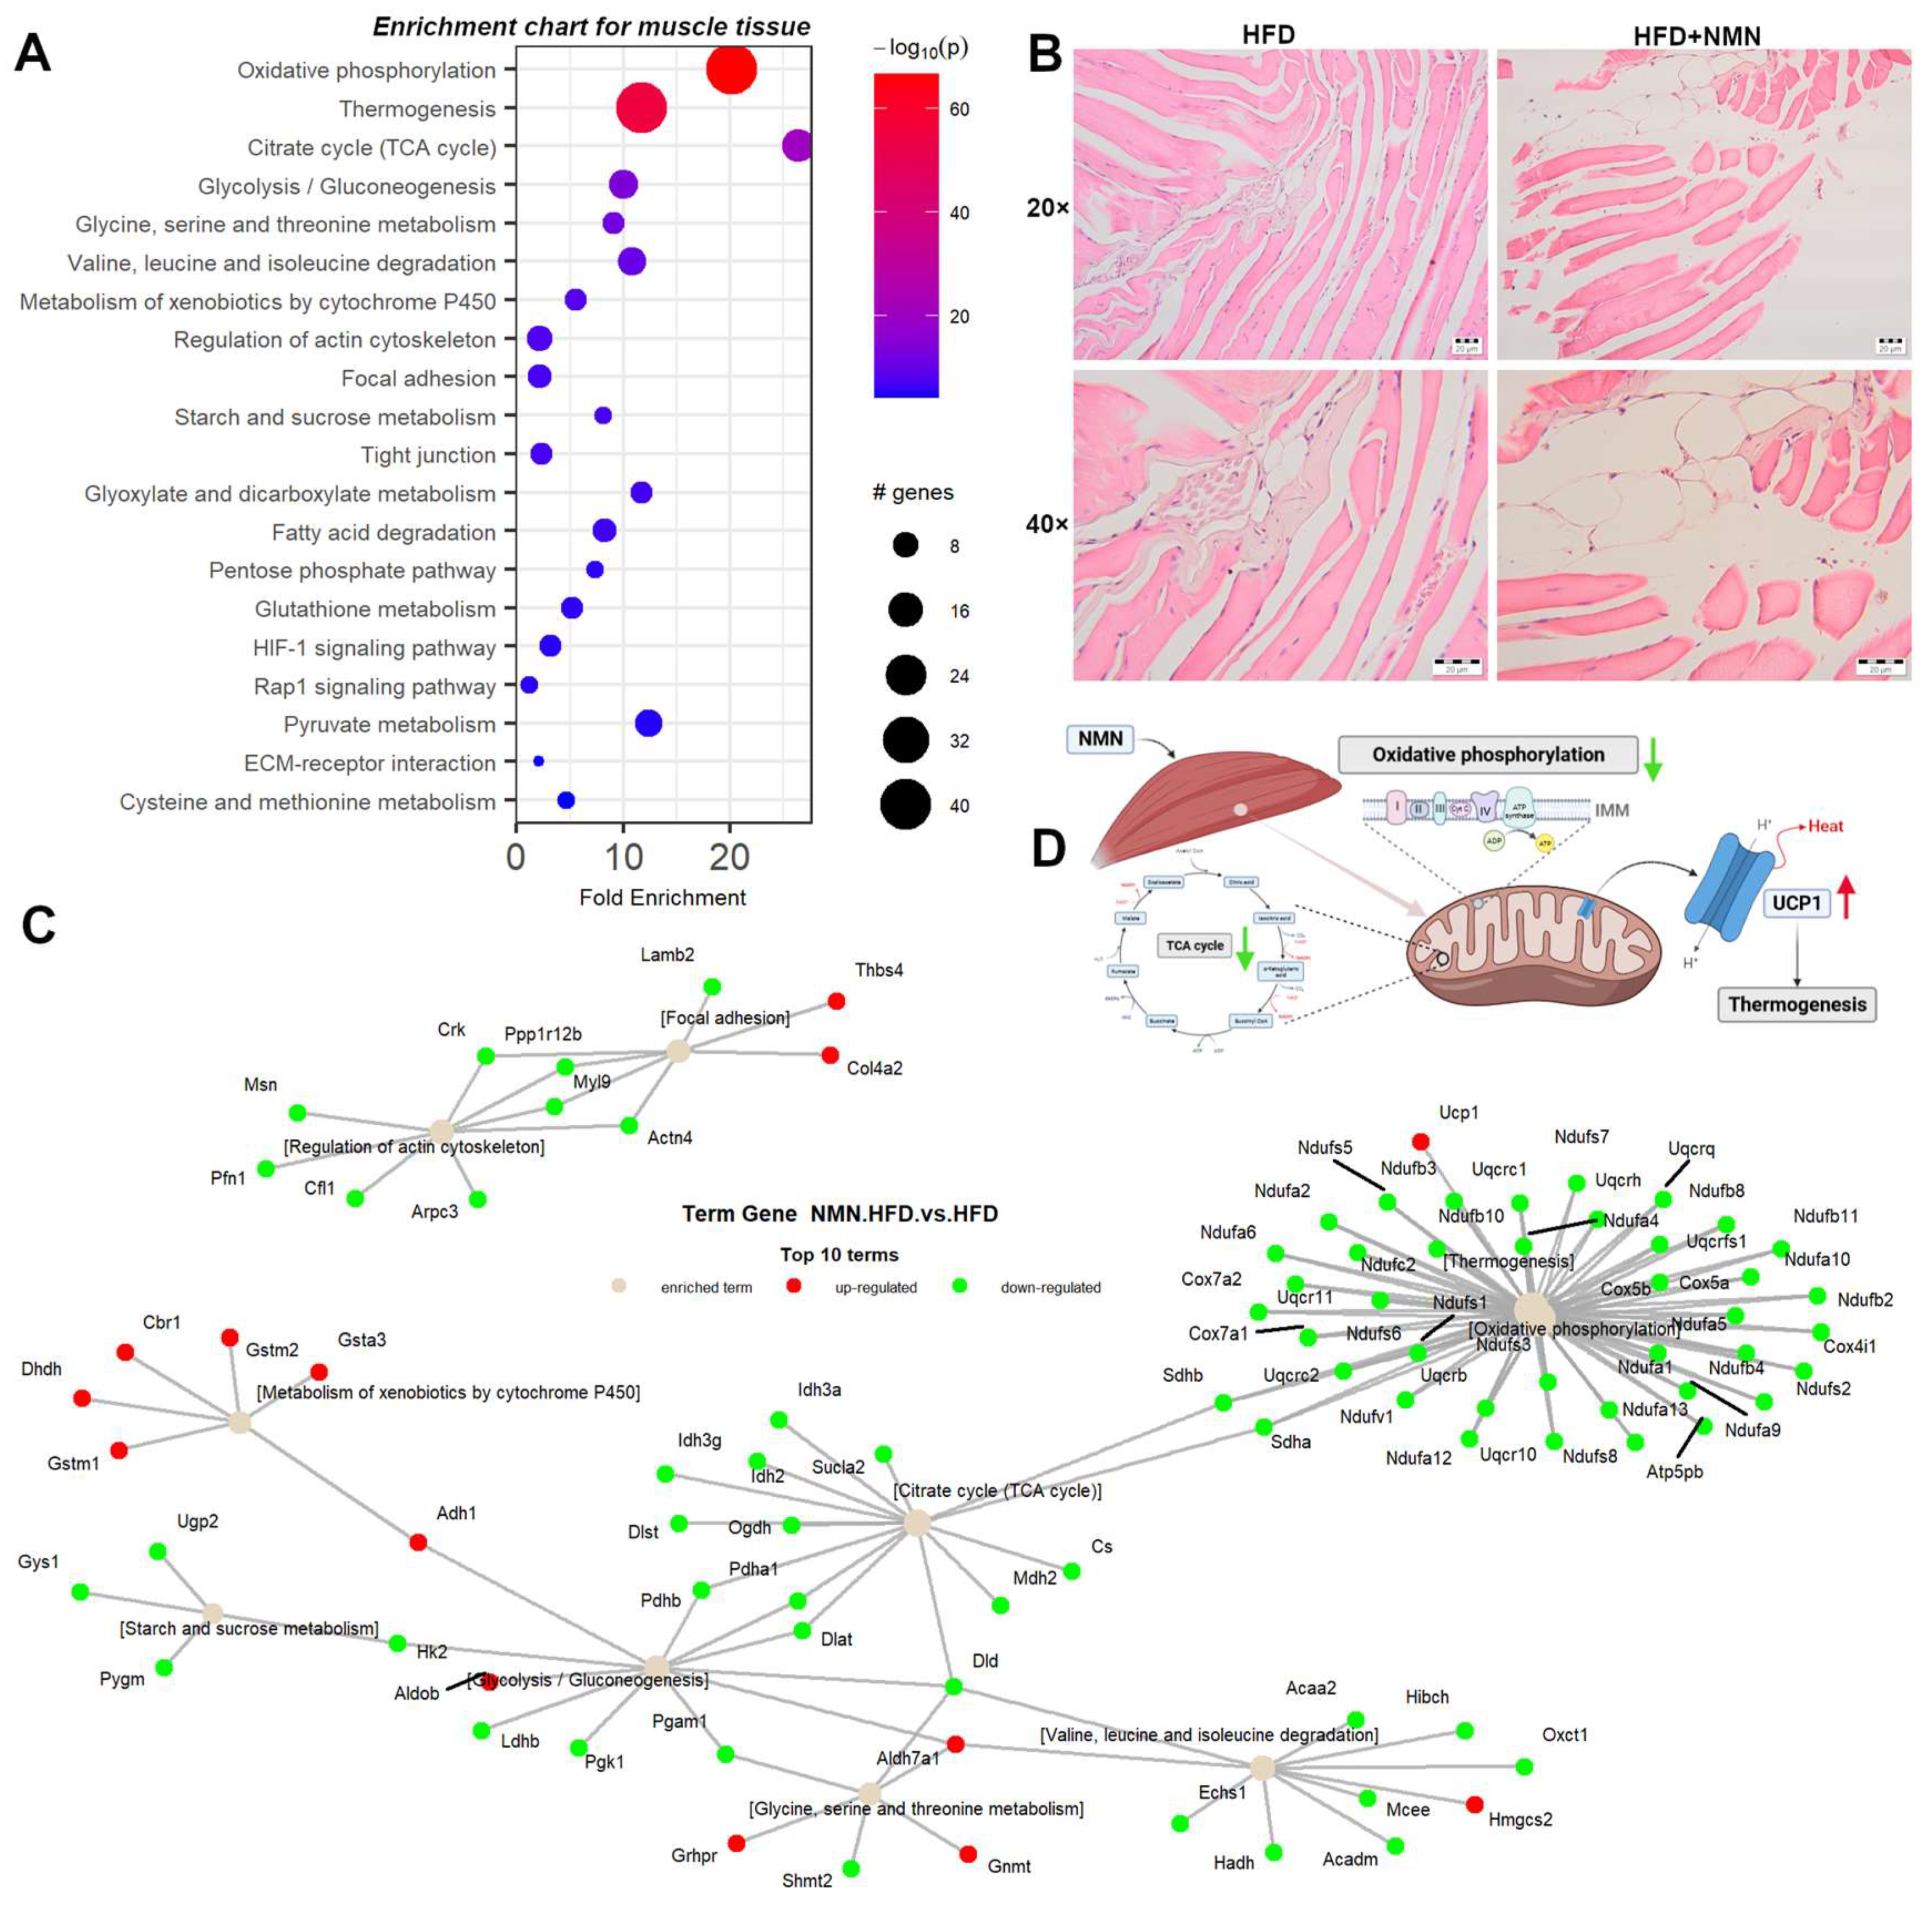
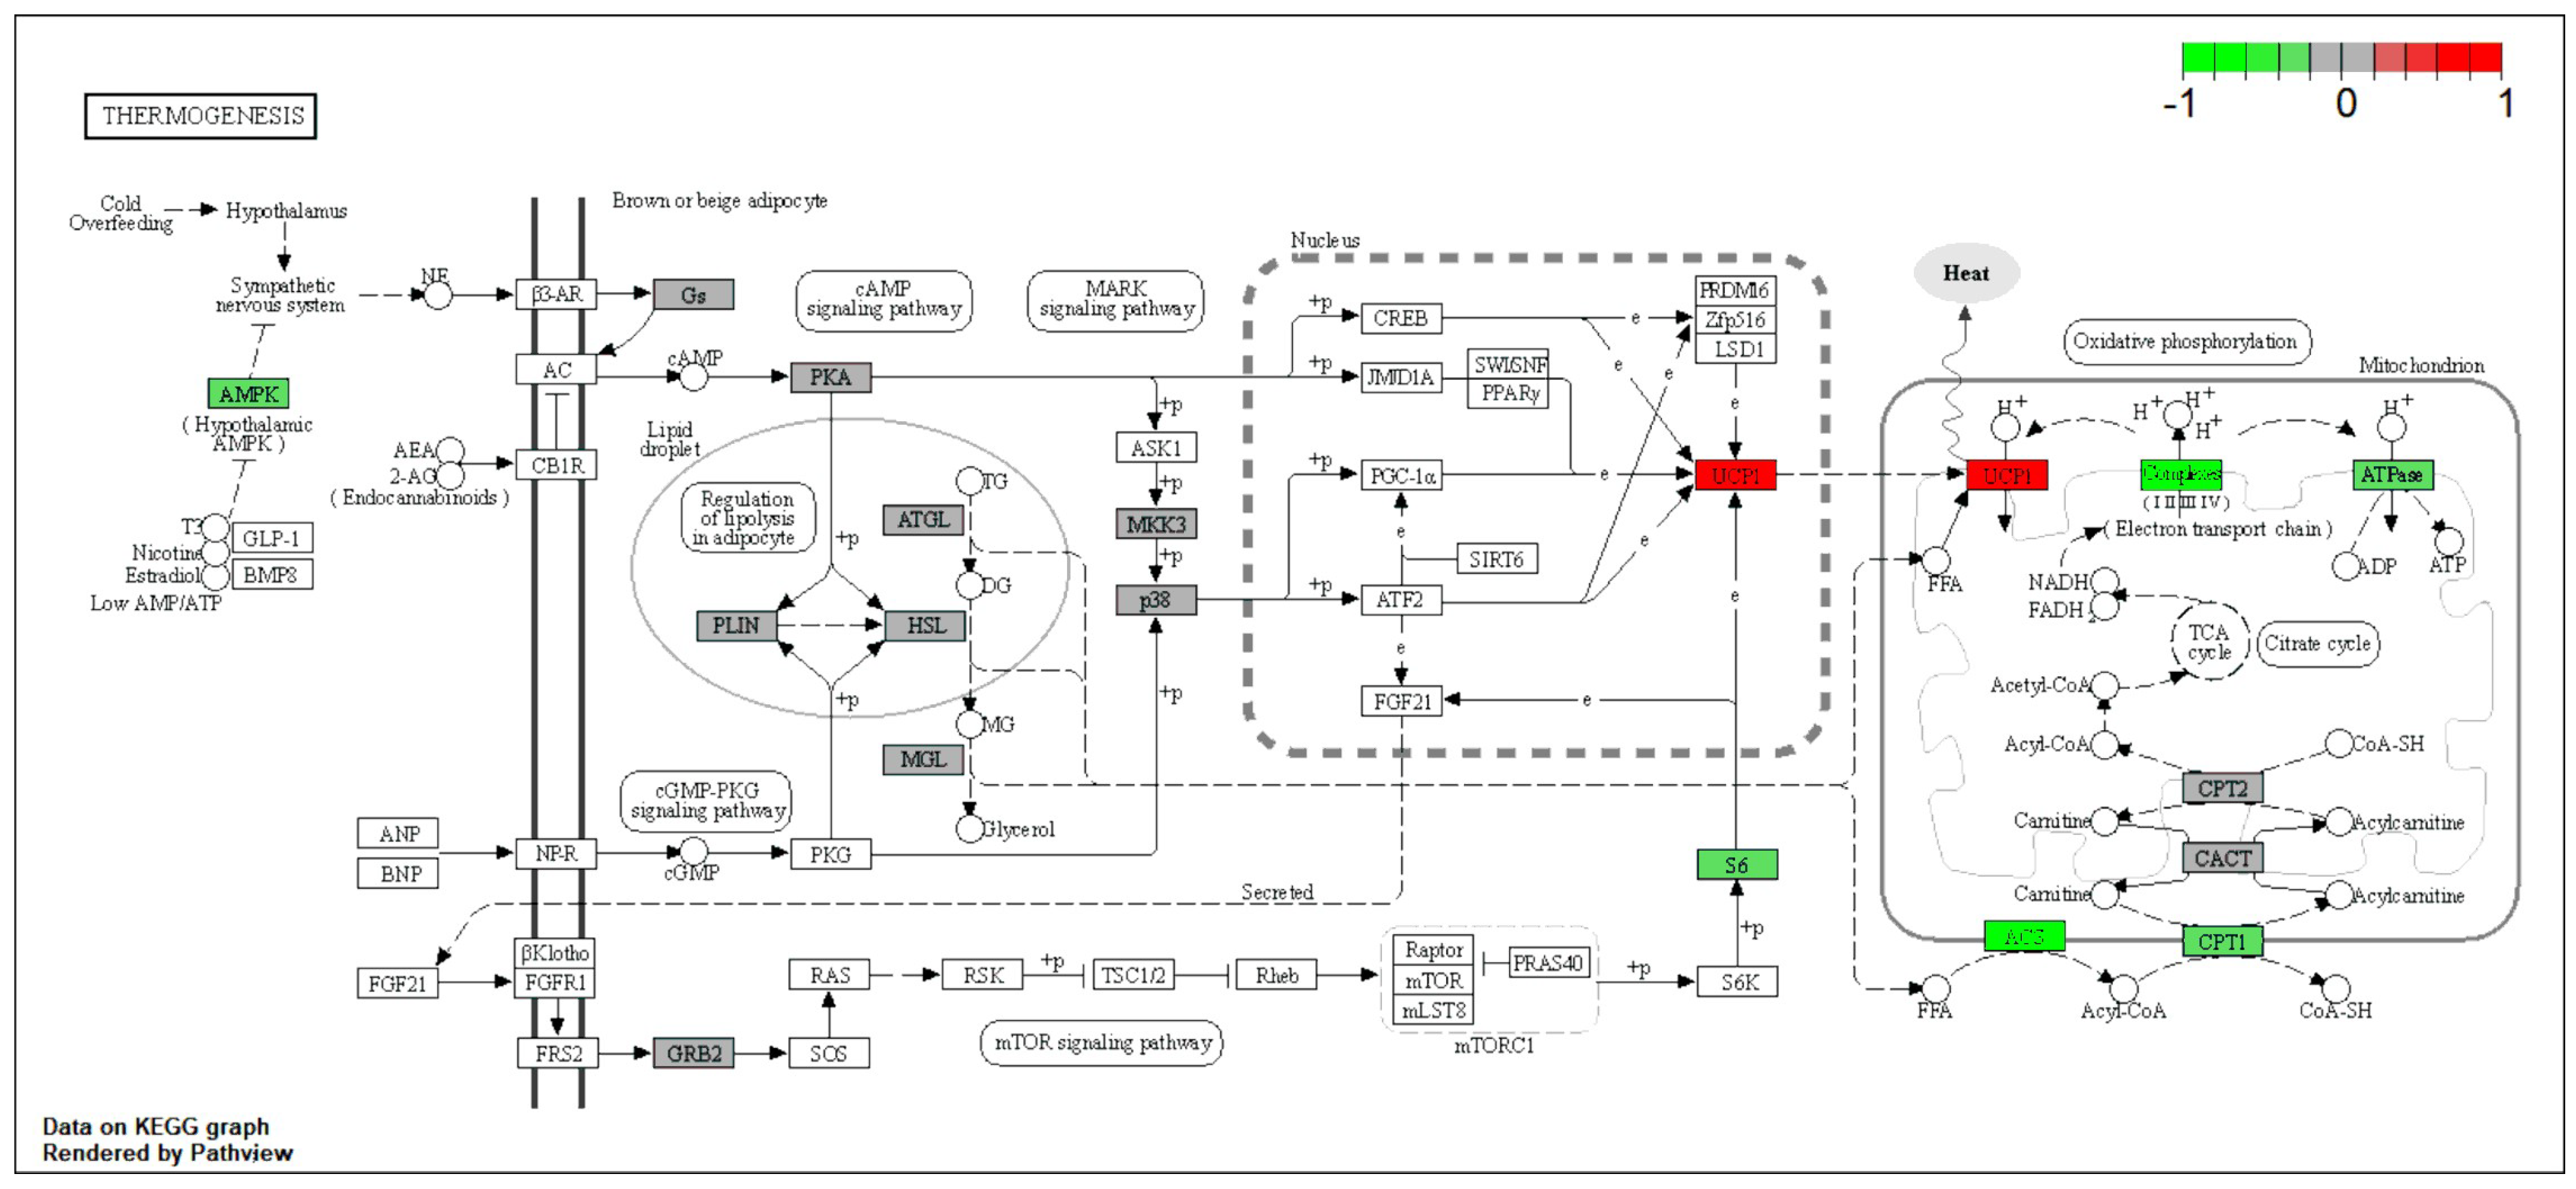
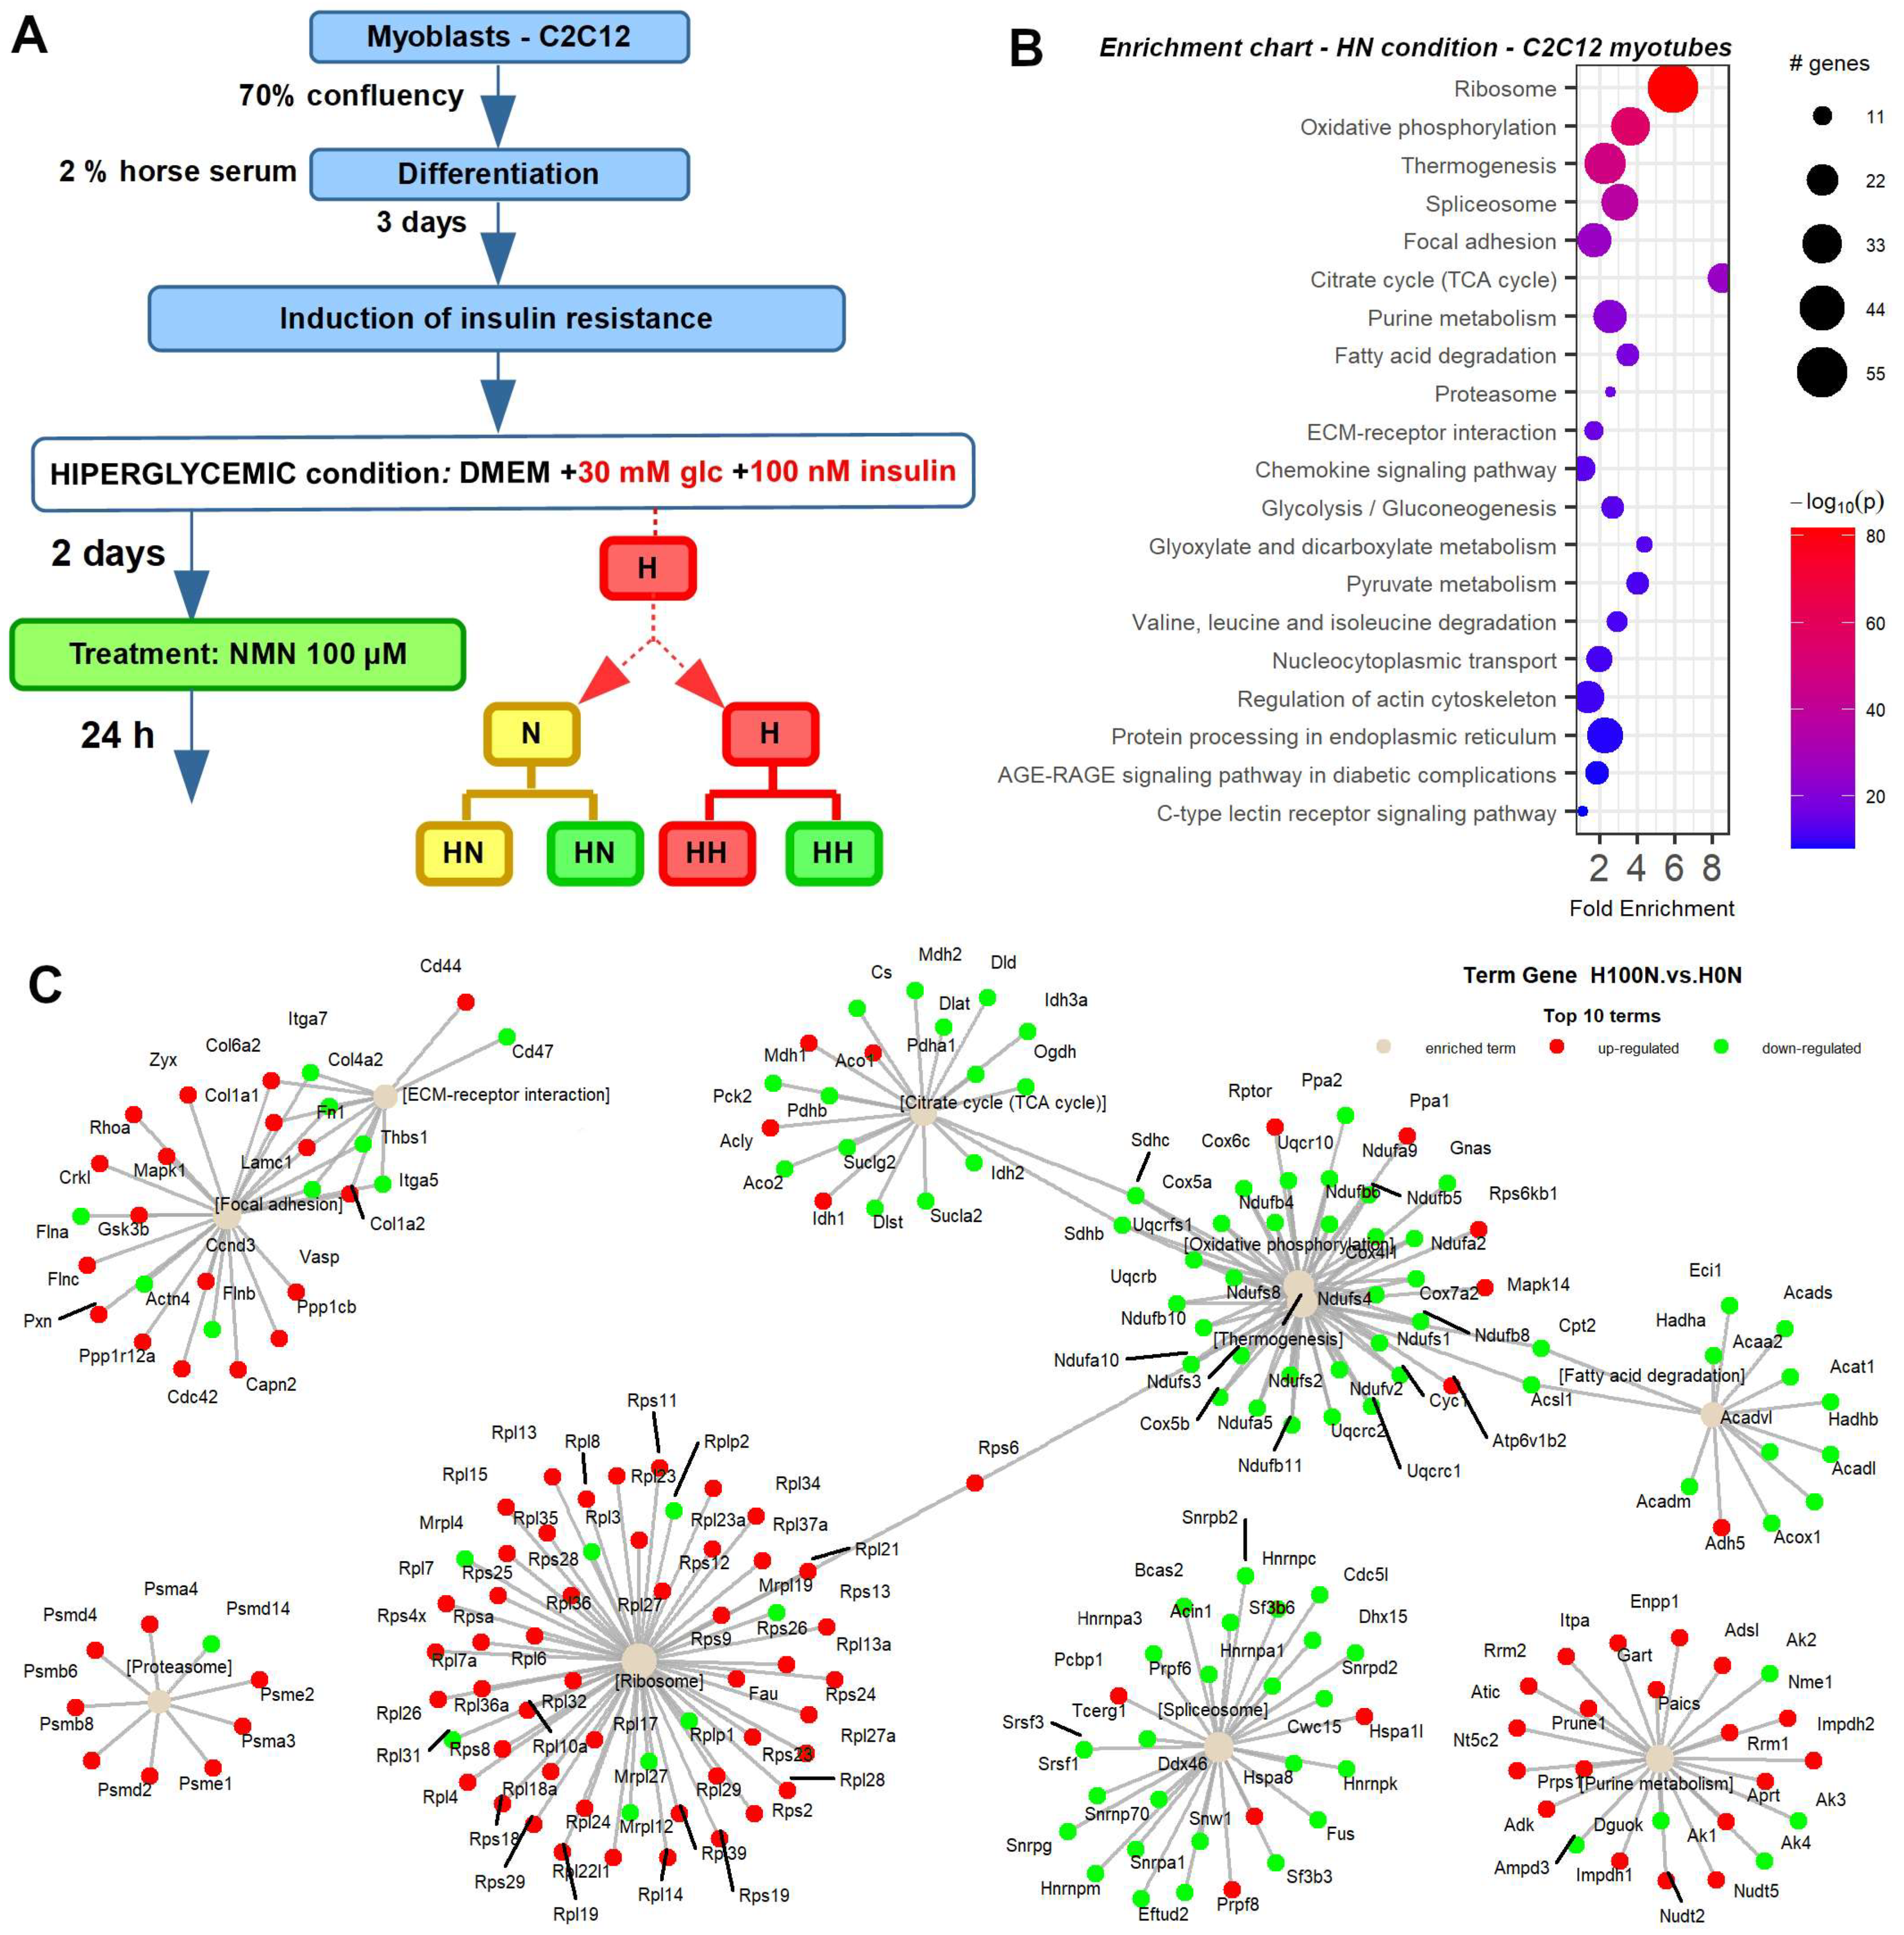
2.3. Thermogenesis Pathway Is Upregulated by NMN in Muscle Tissue
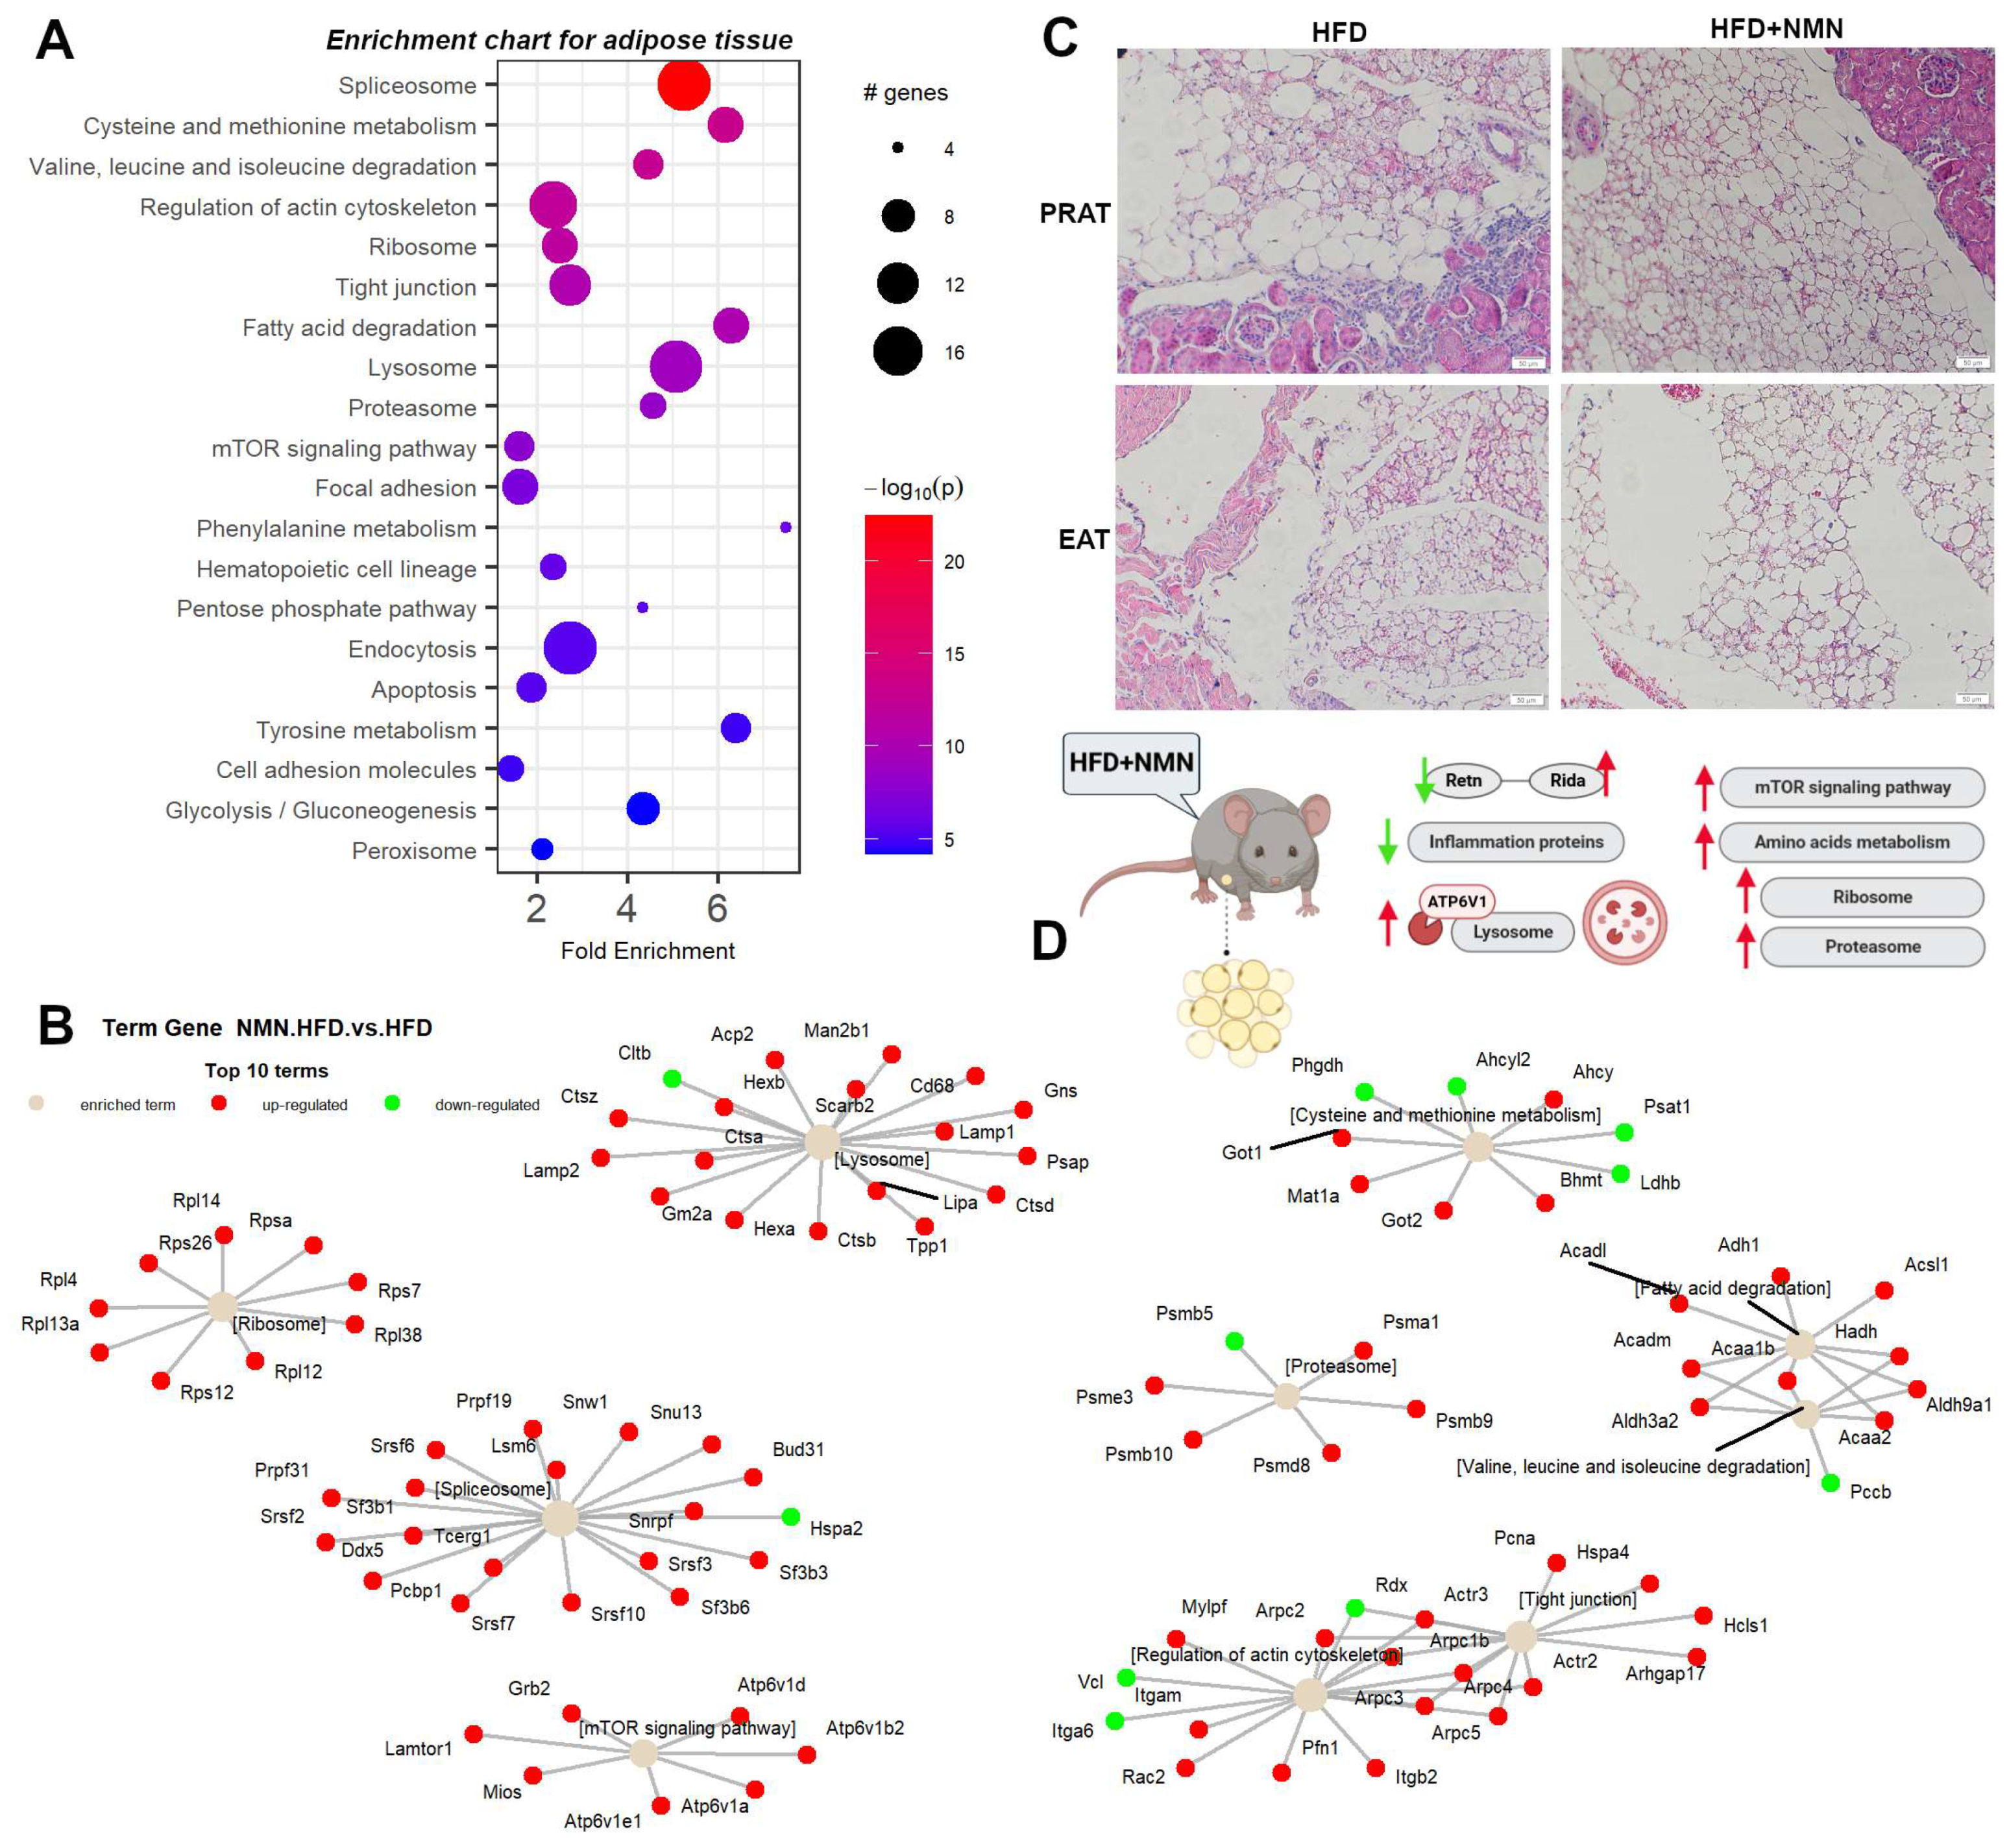
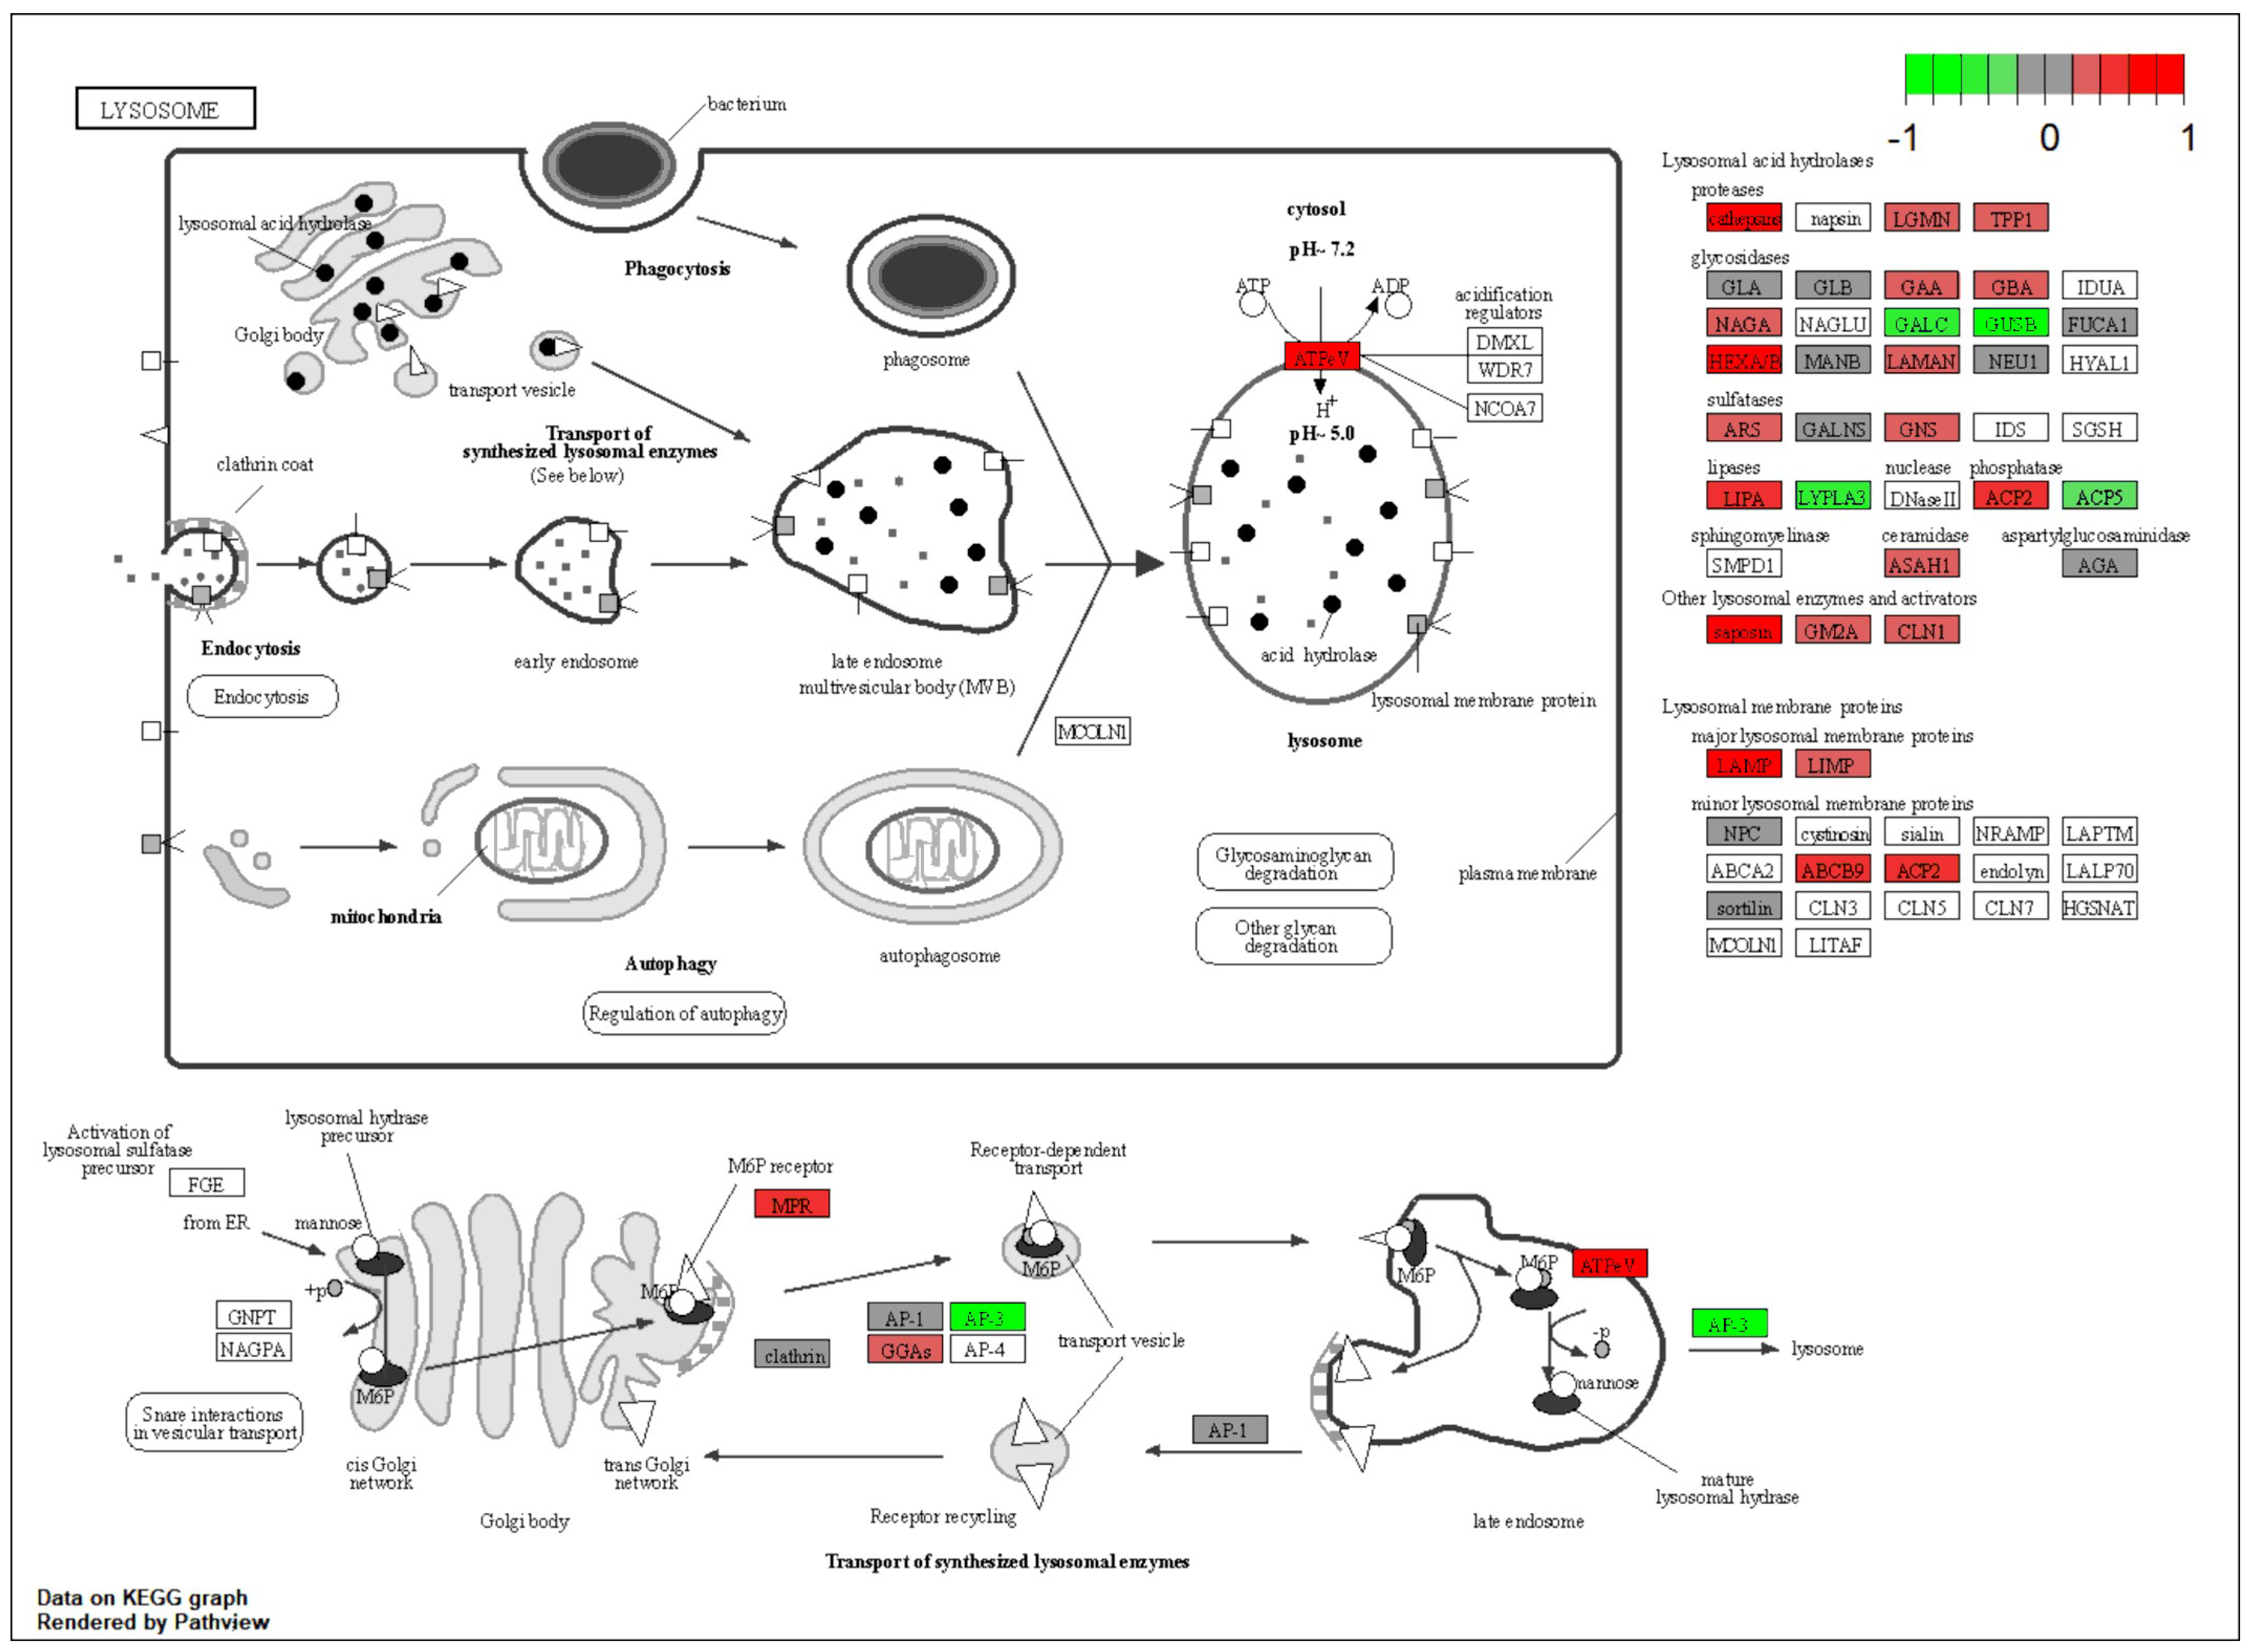
2.4. NMN Stimulates Adipose Cell Proliferation by Upregulating mTOR Pathway
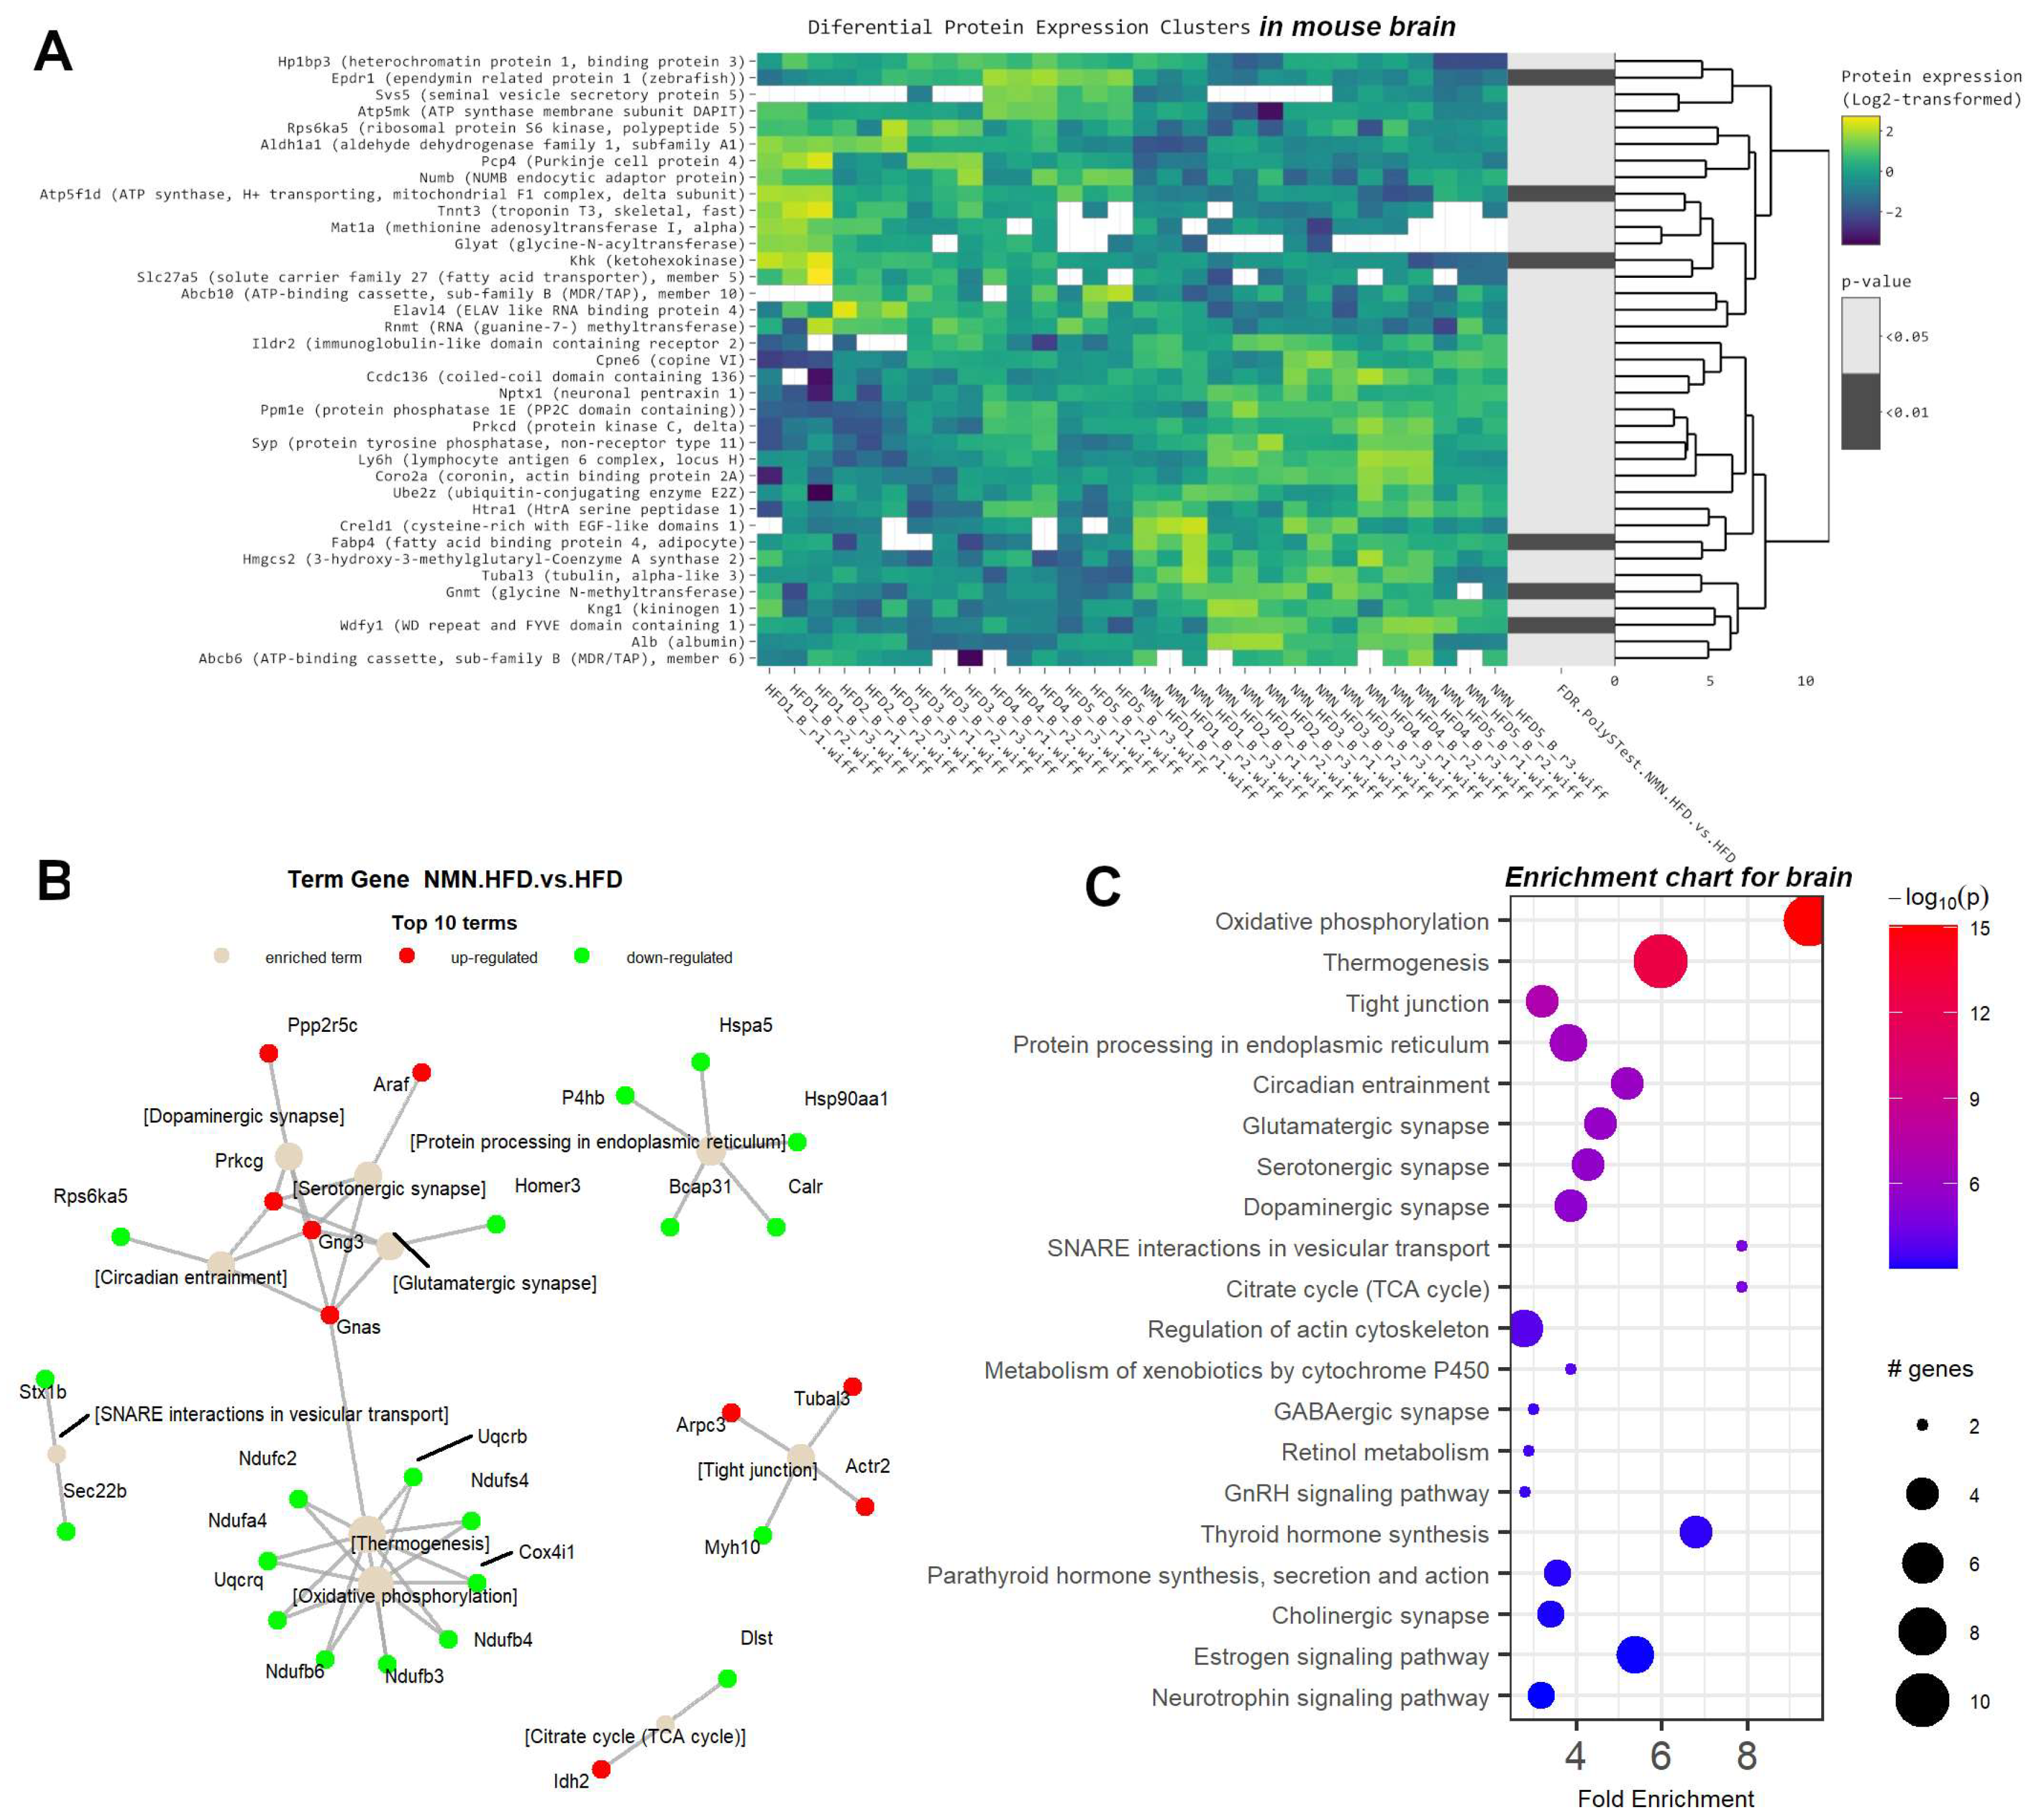
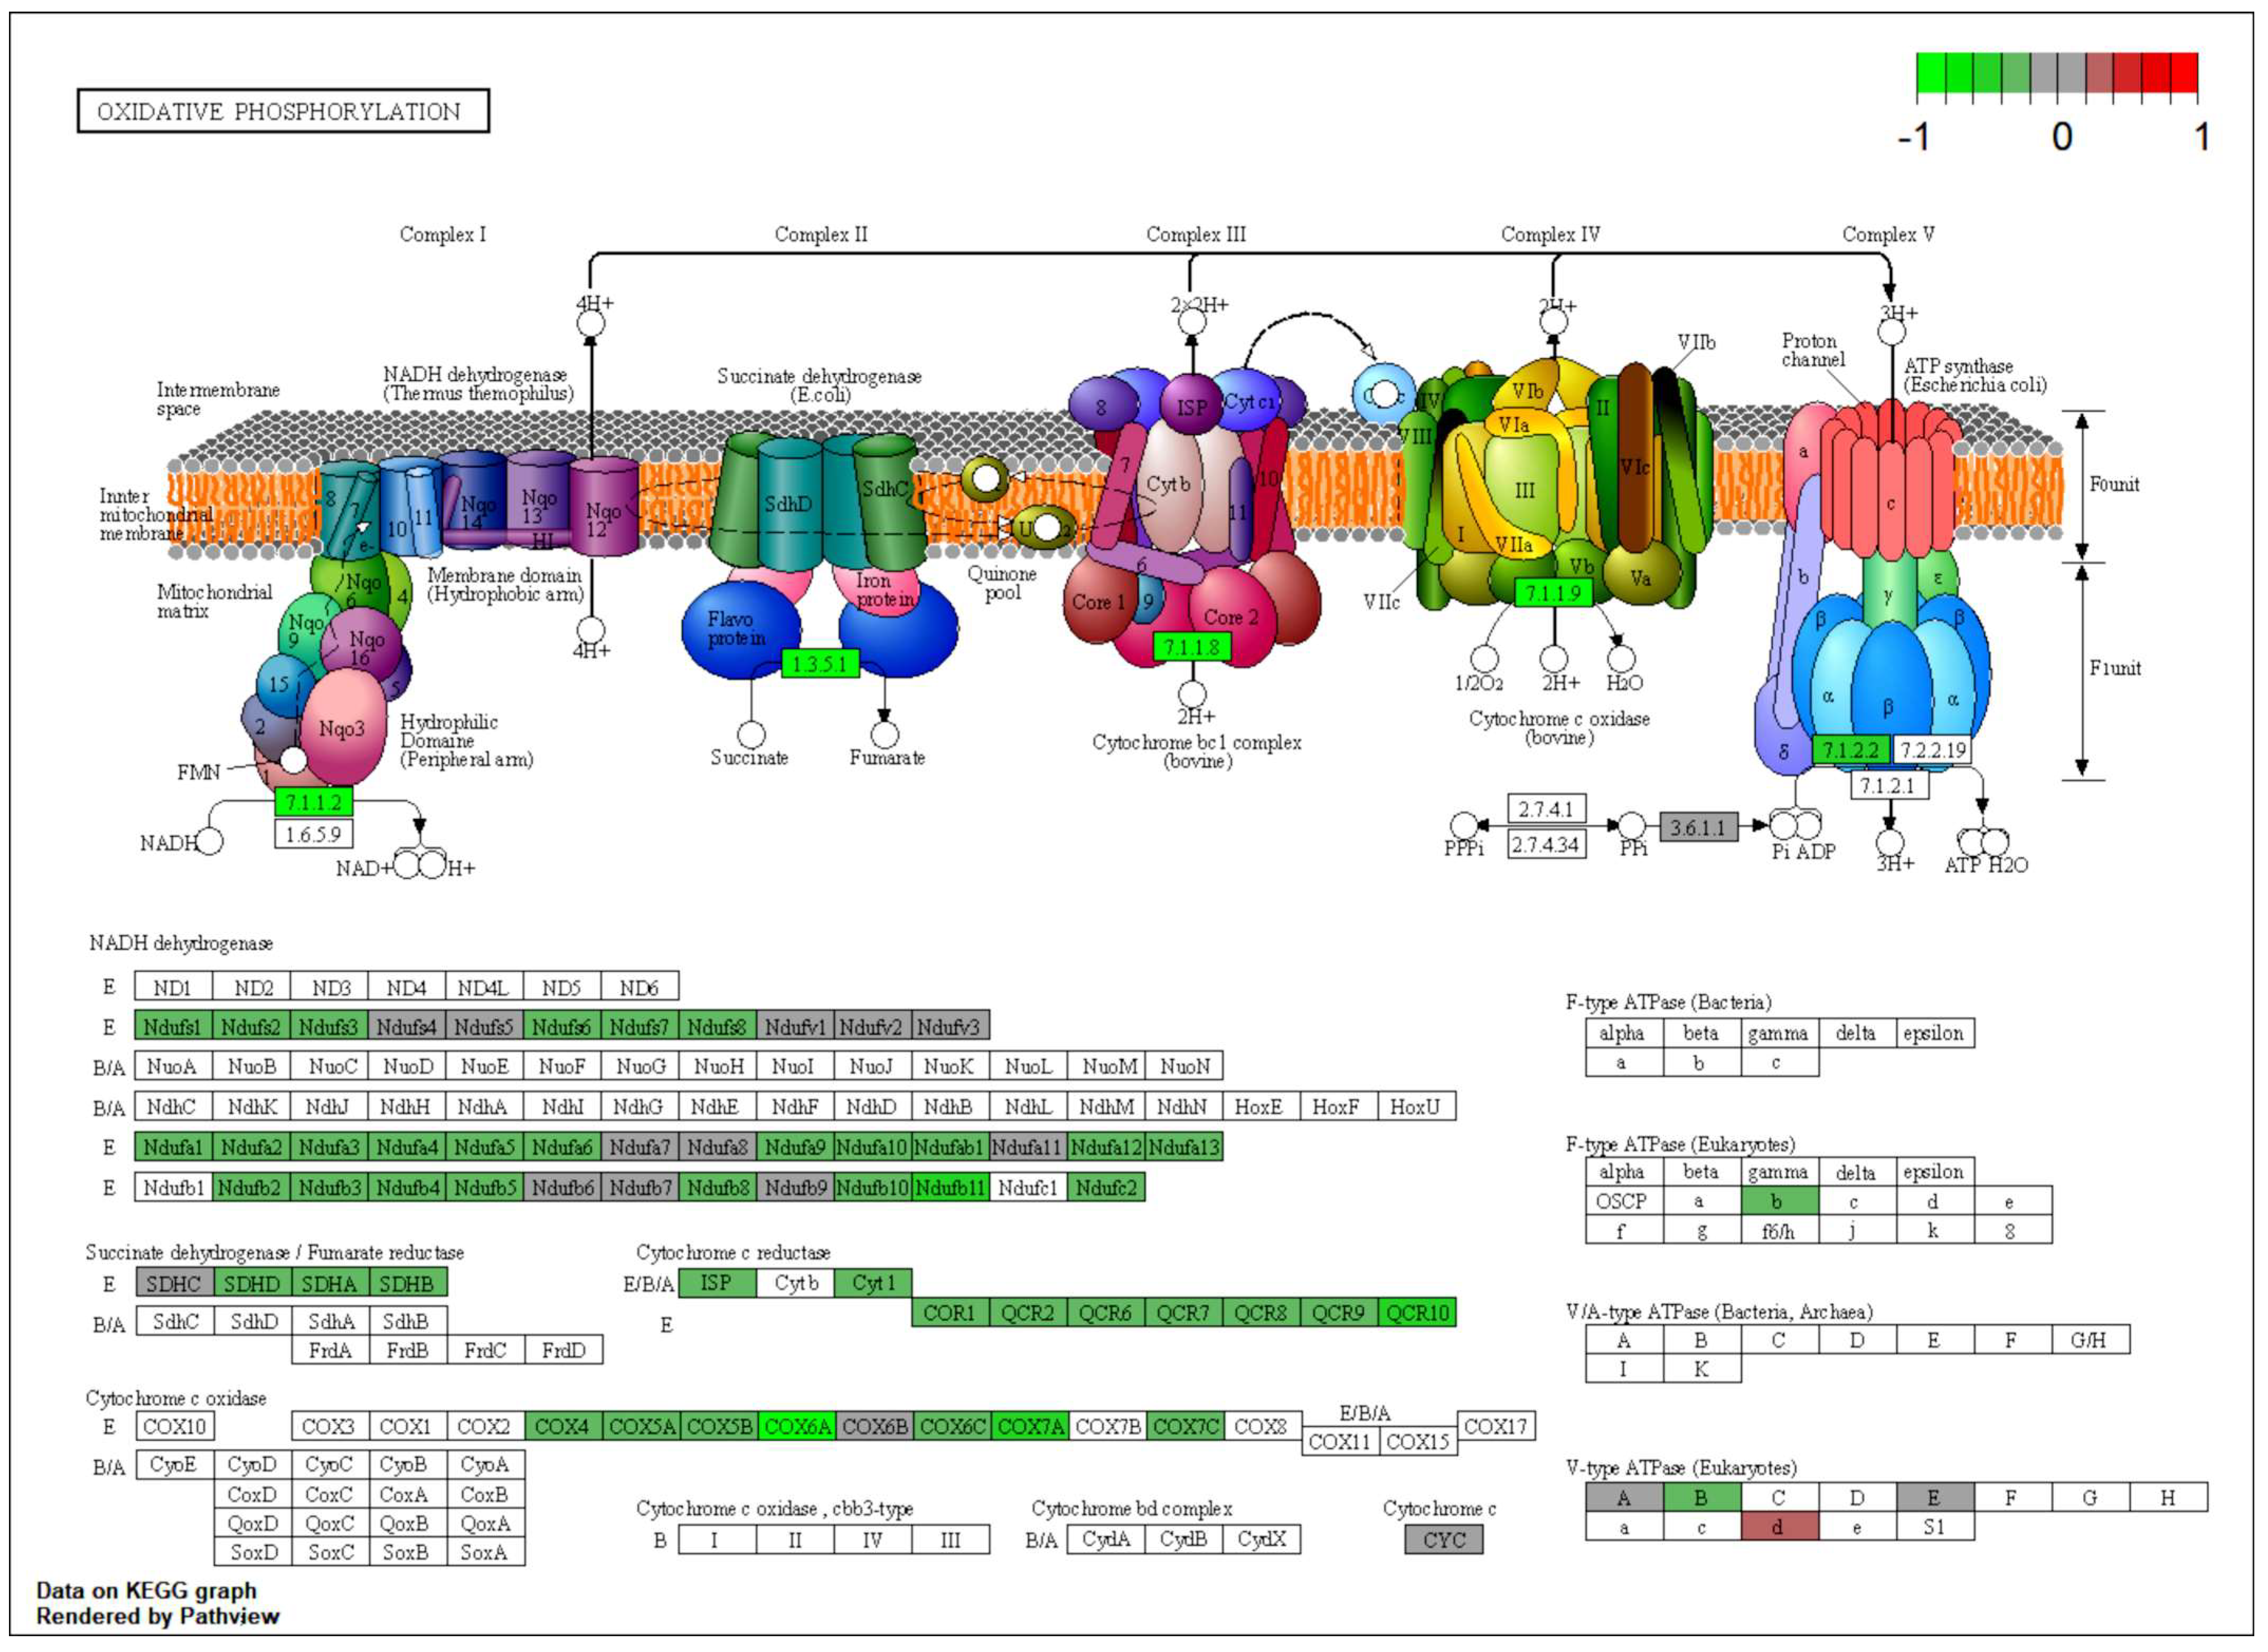
2.5. Downregulated OXPHOS Proteins and Upregulated Ketone Bodies Production Were Shown in Brains of NMN-Treated HFD Mice
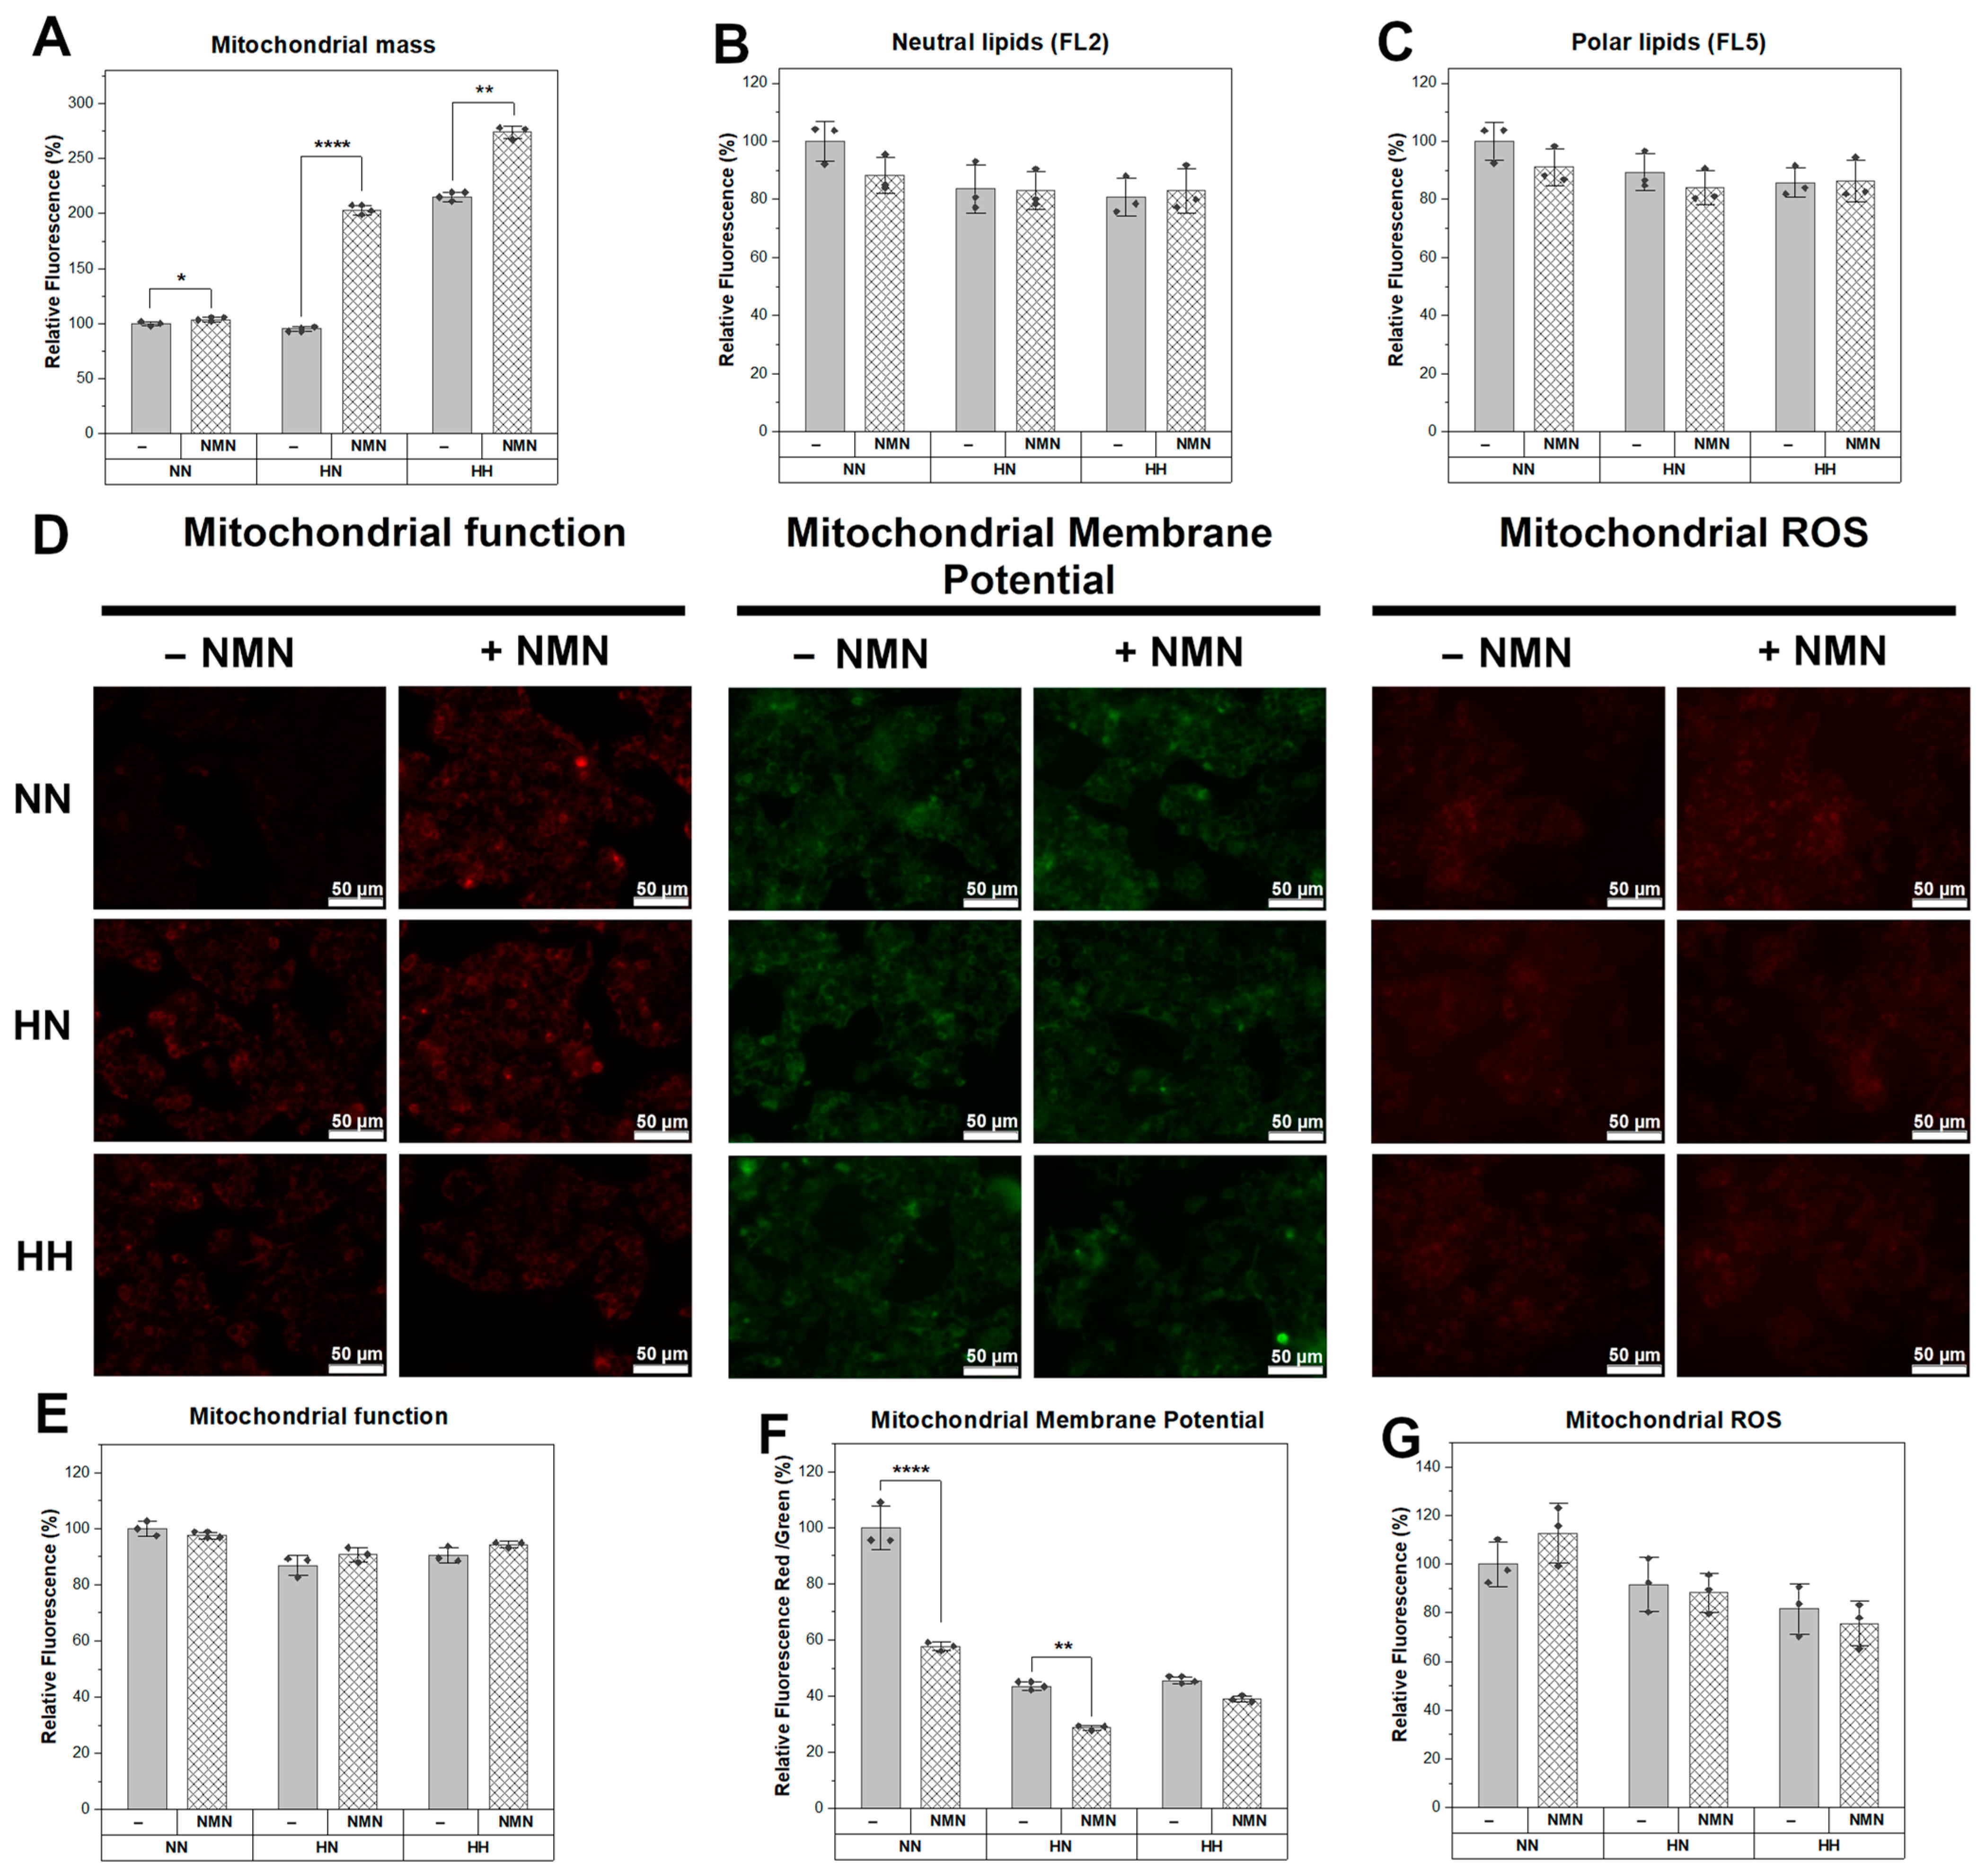
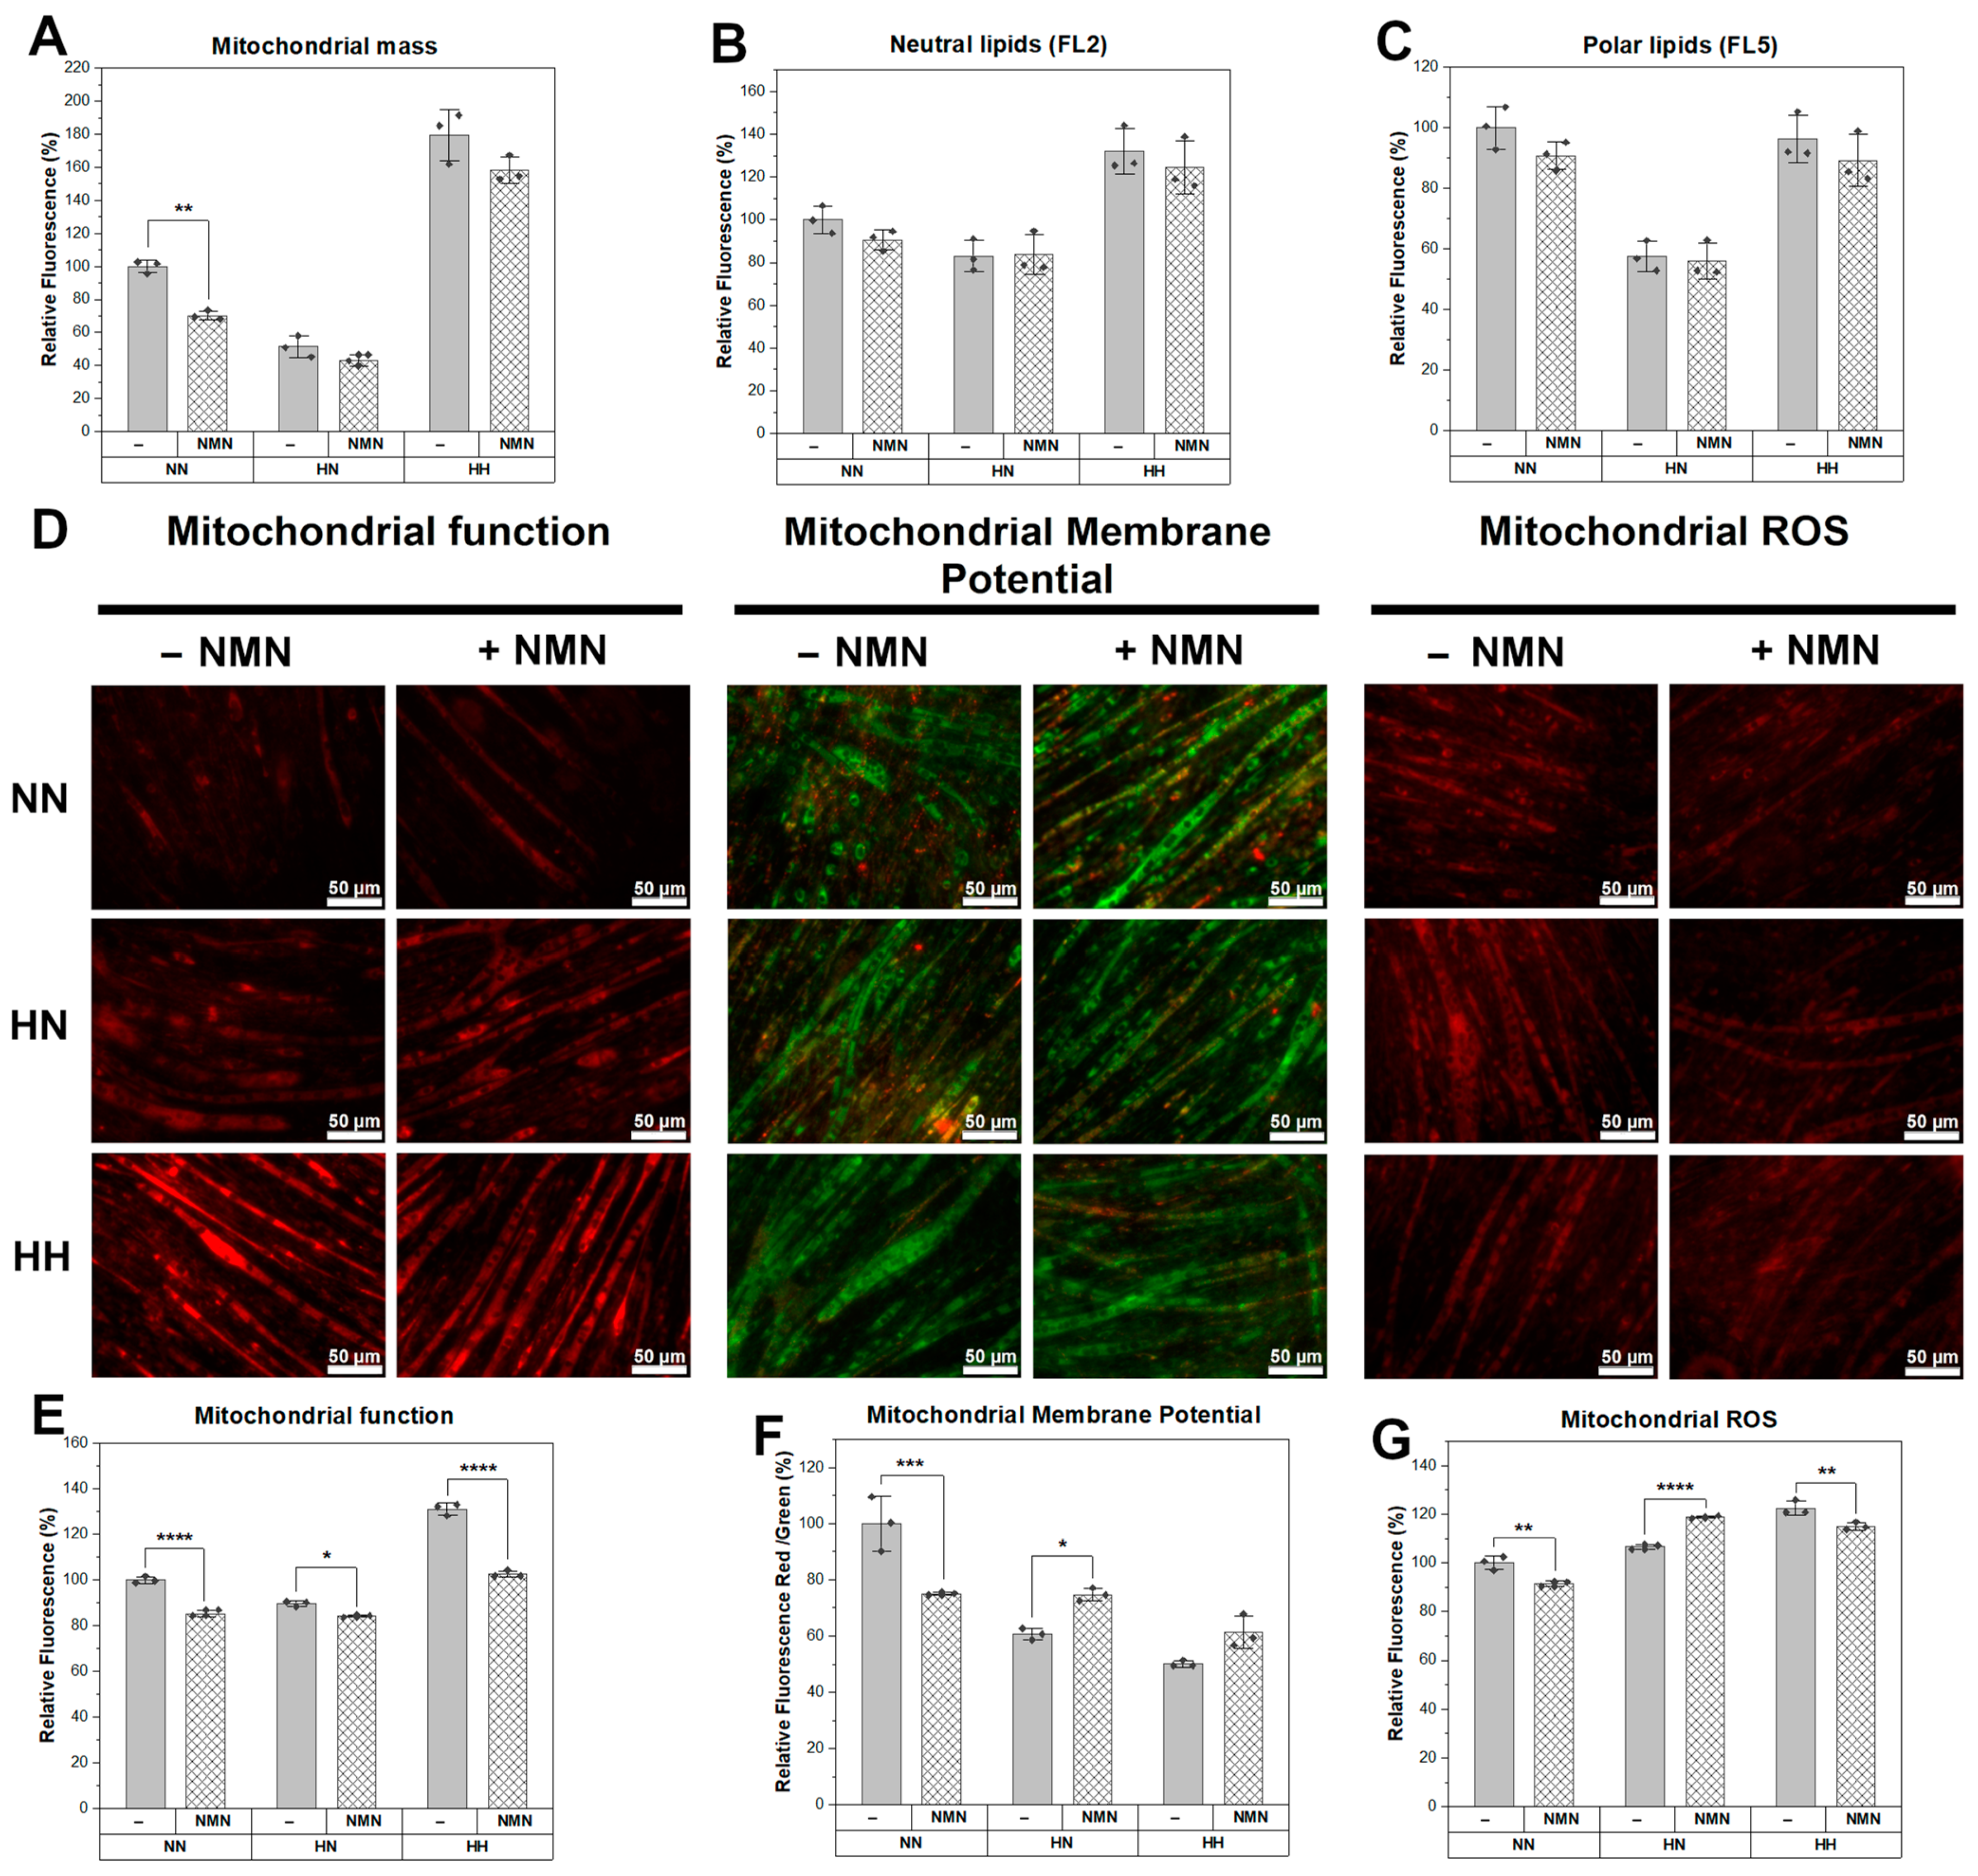
2.6. NMN Treatment Decreased Mitochondrial Function with Increased Membrane Potential and Higher ROS Production in Muscle Cells while in Hepatic Cells, Mitochondrial Mass Was Higher and Mitochondrial Membrane Potential Was Reduced
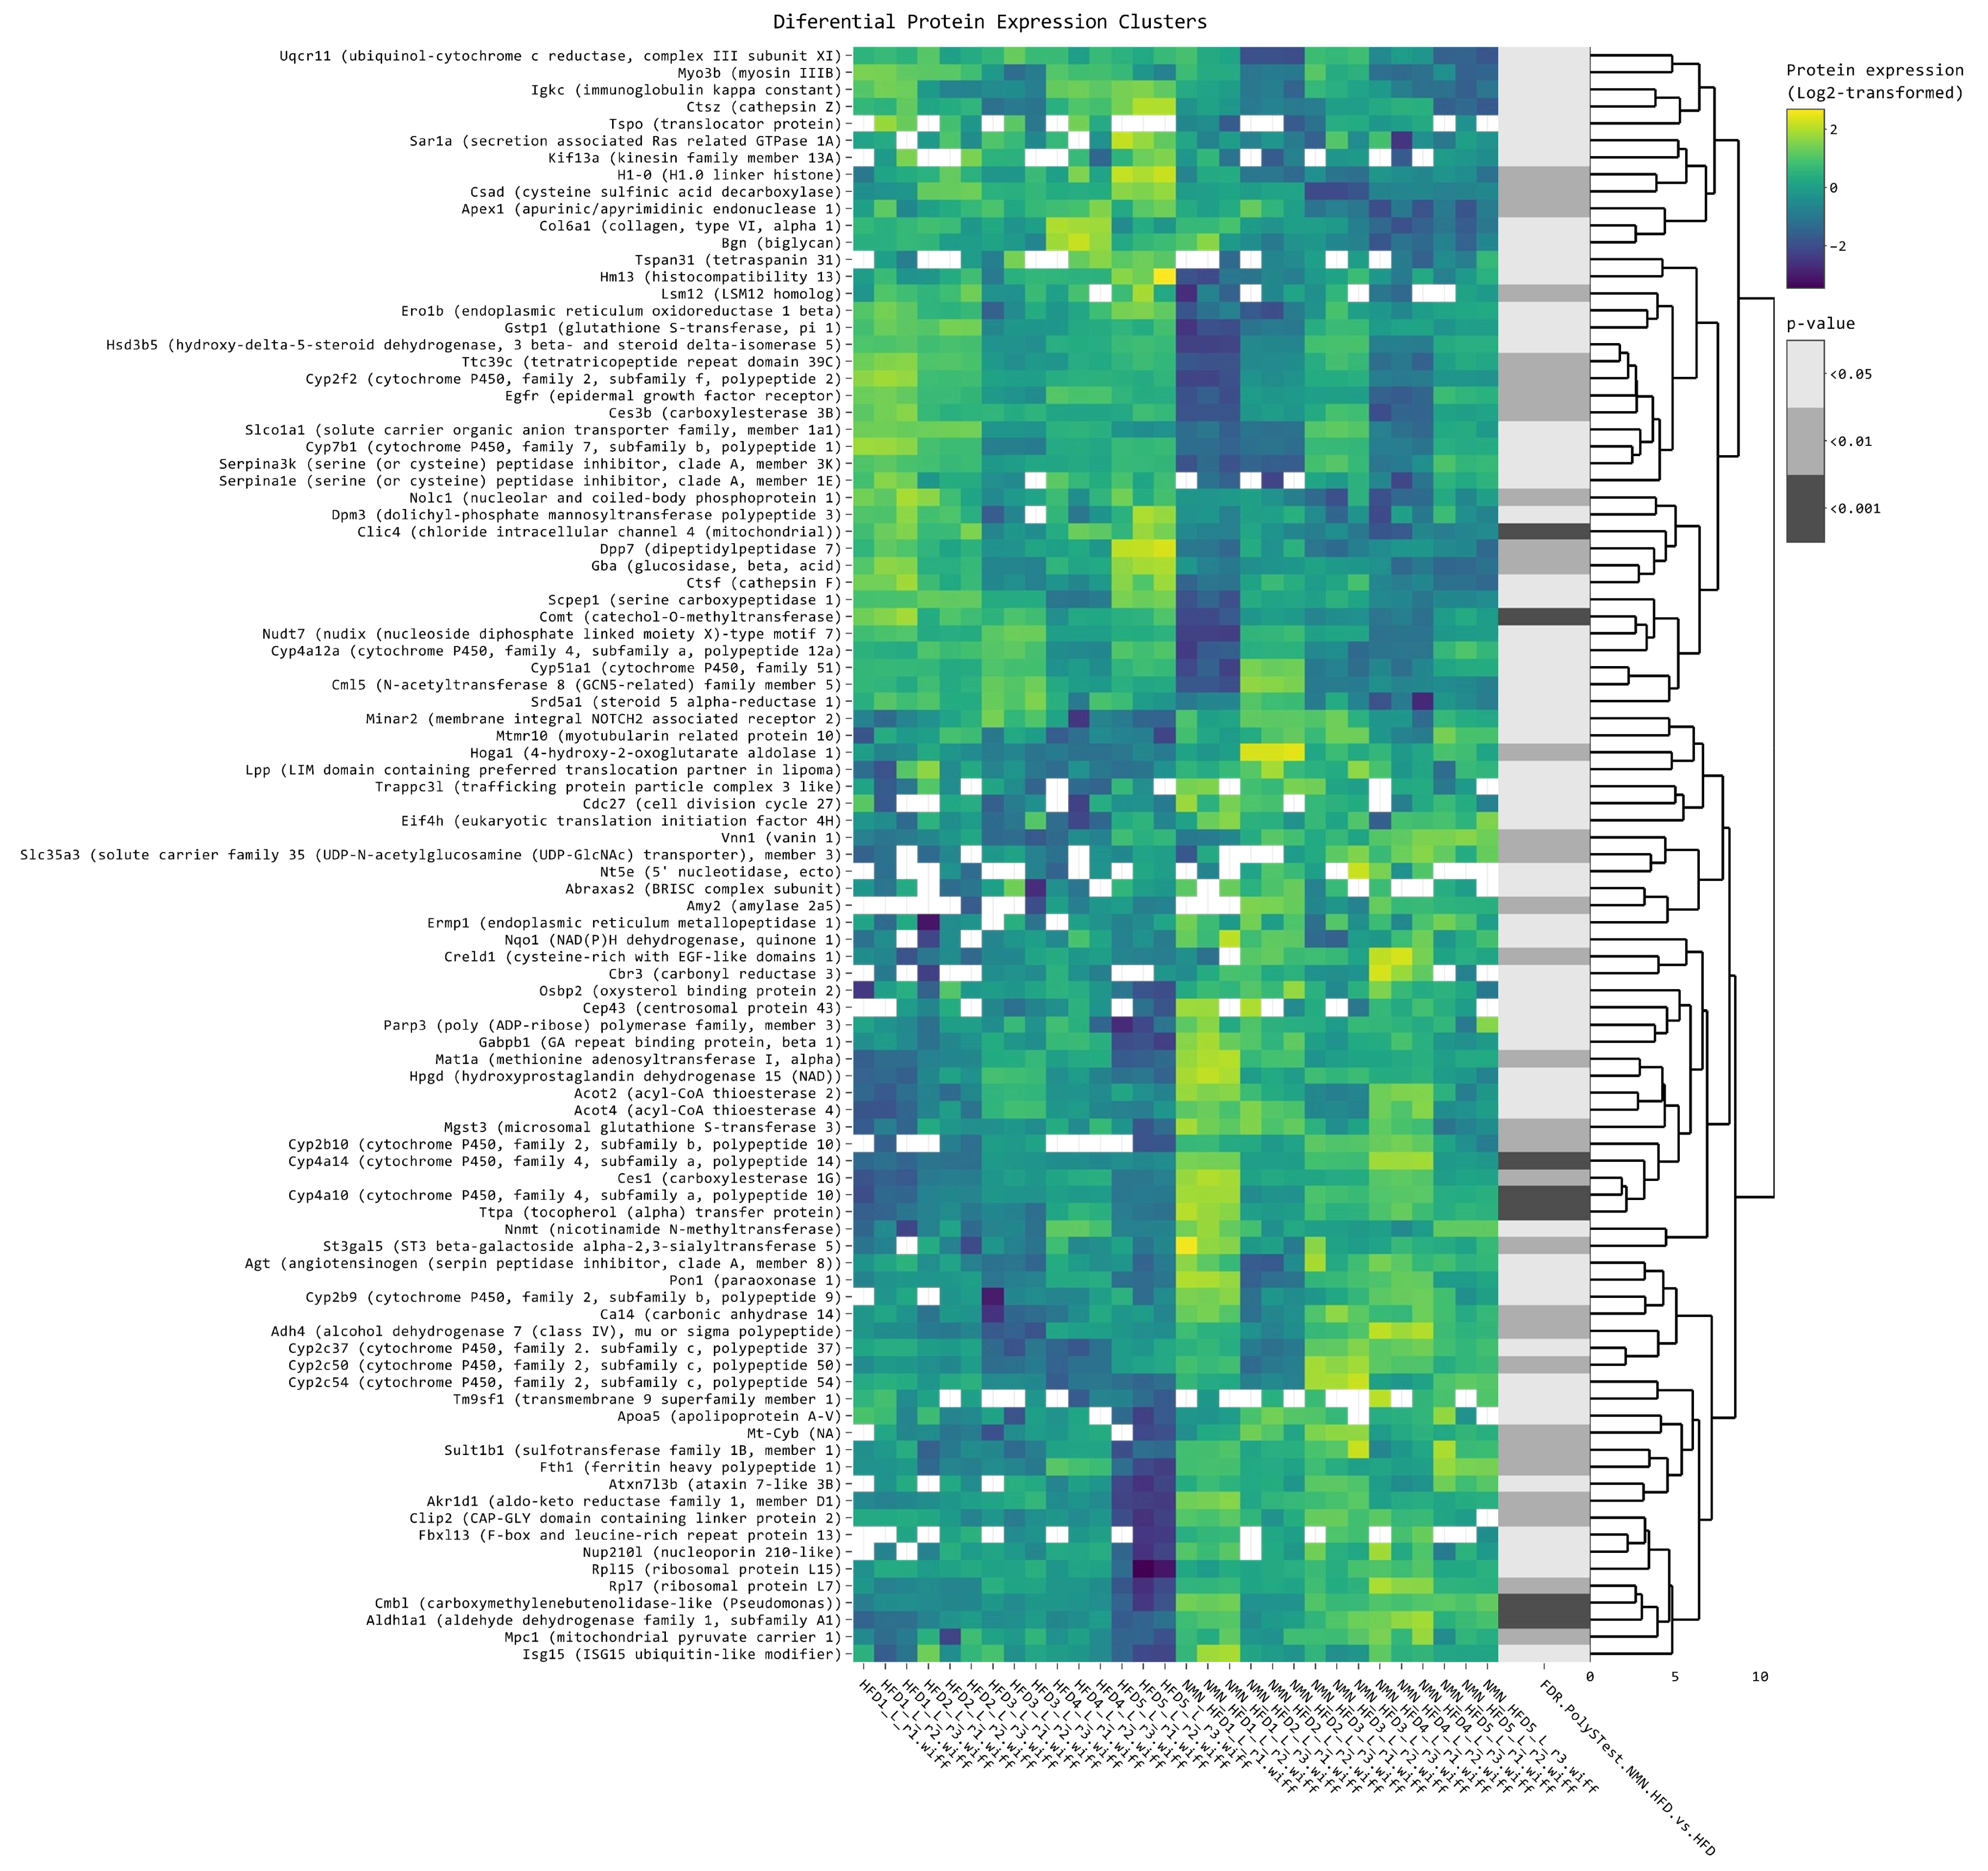
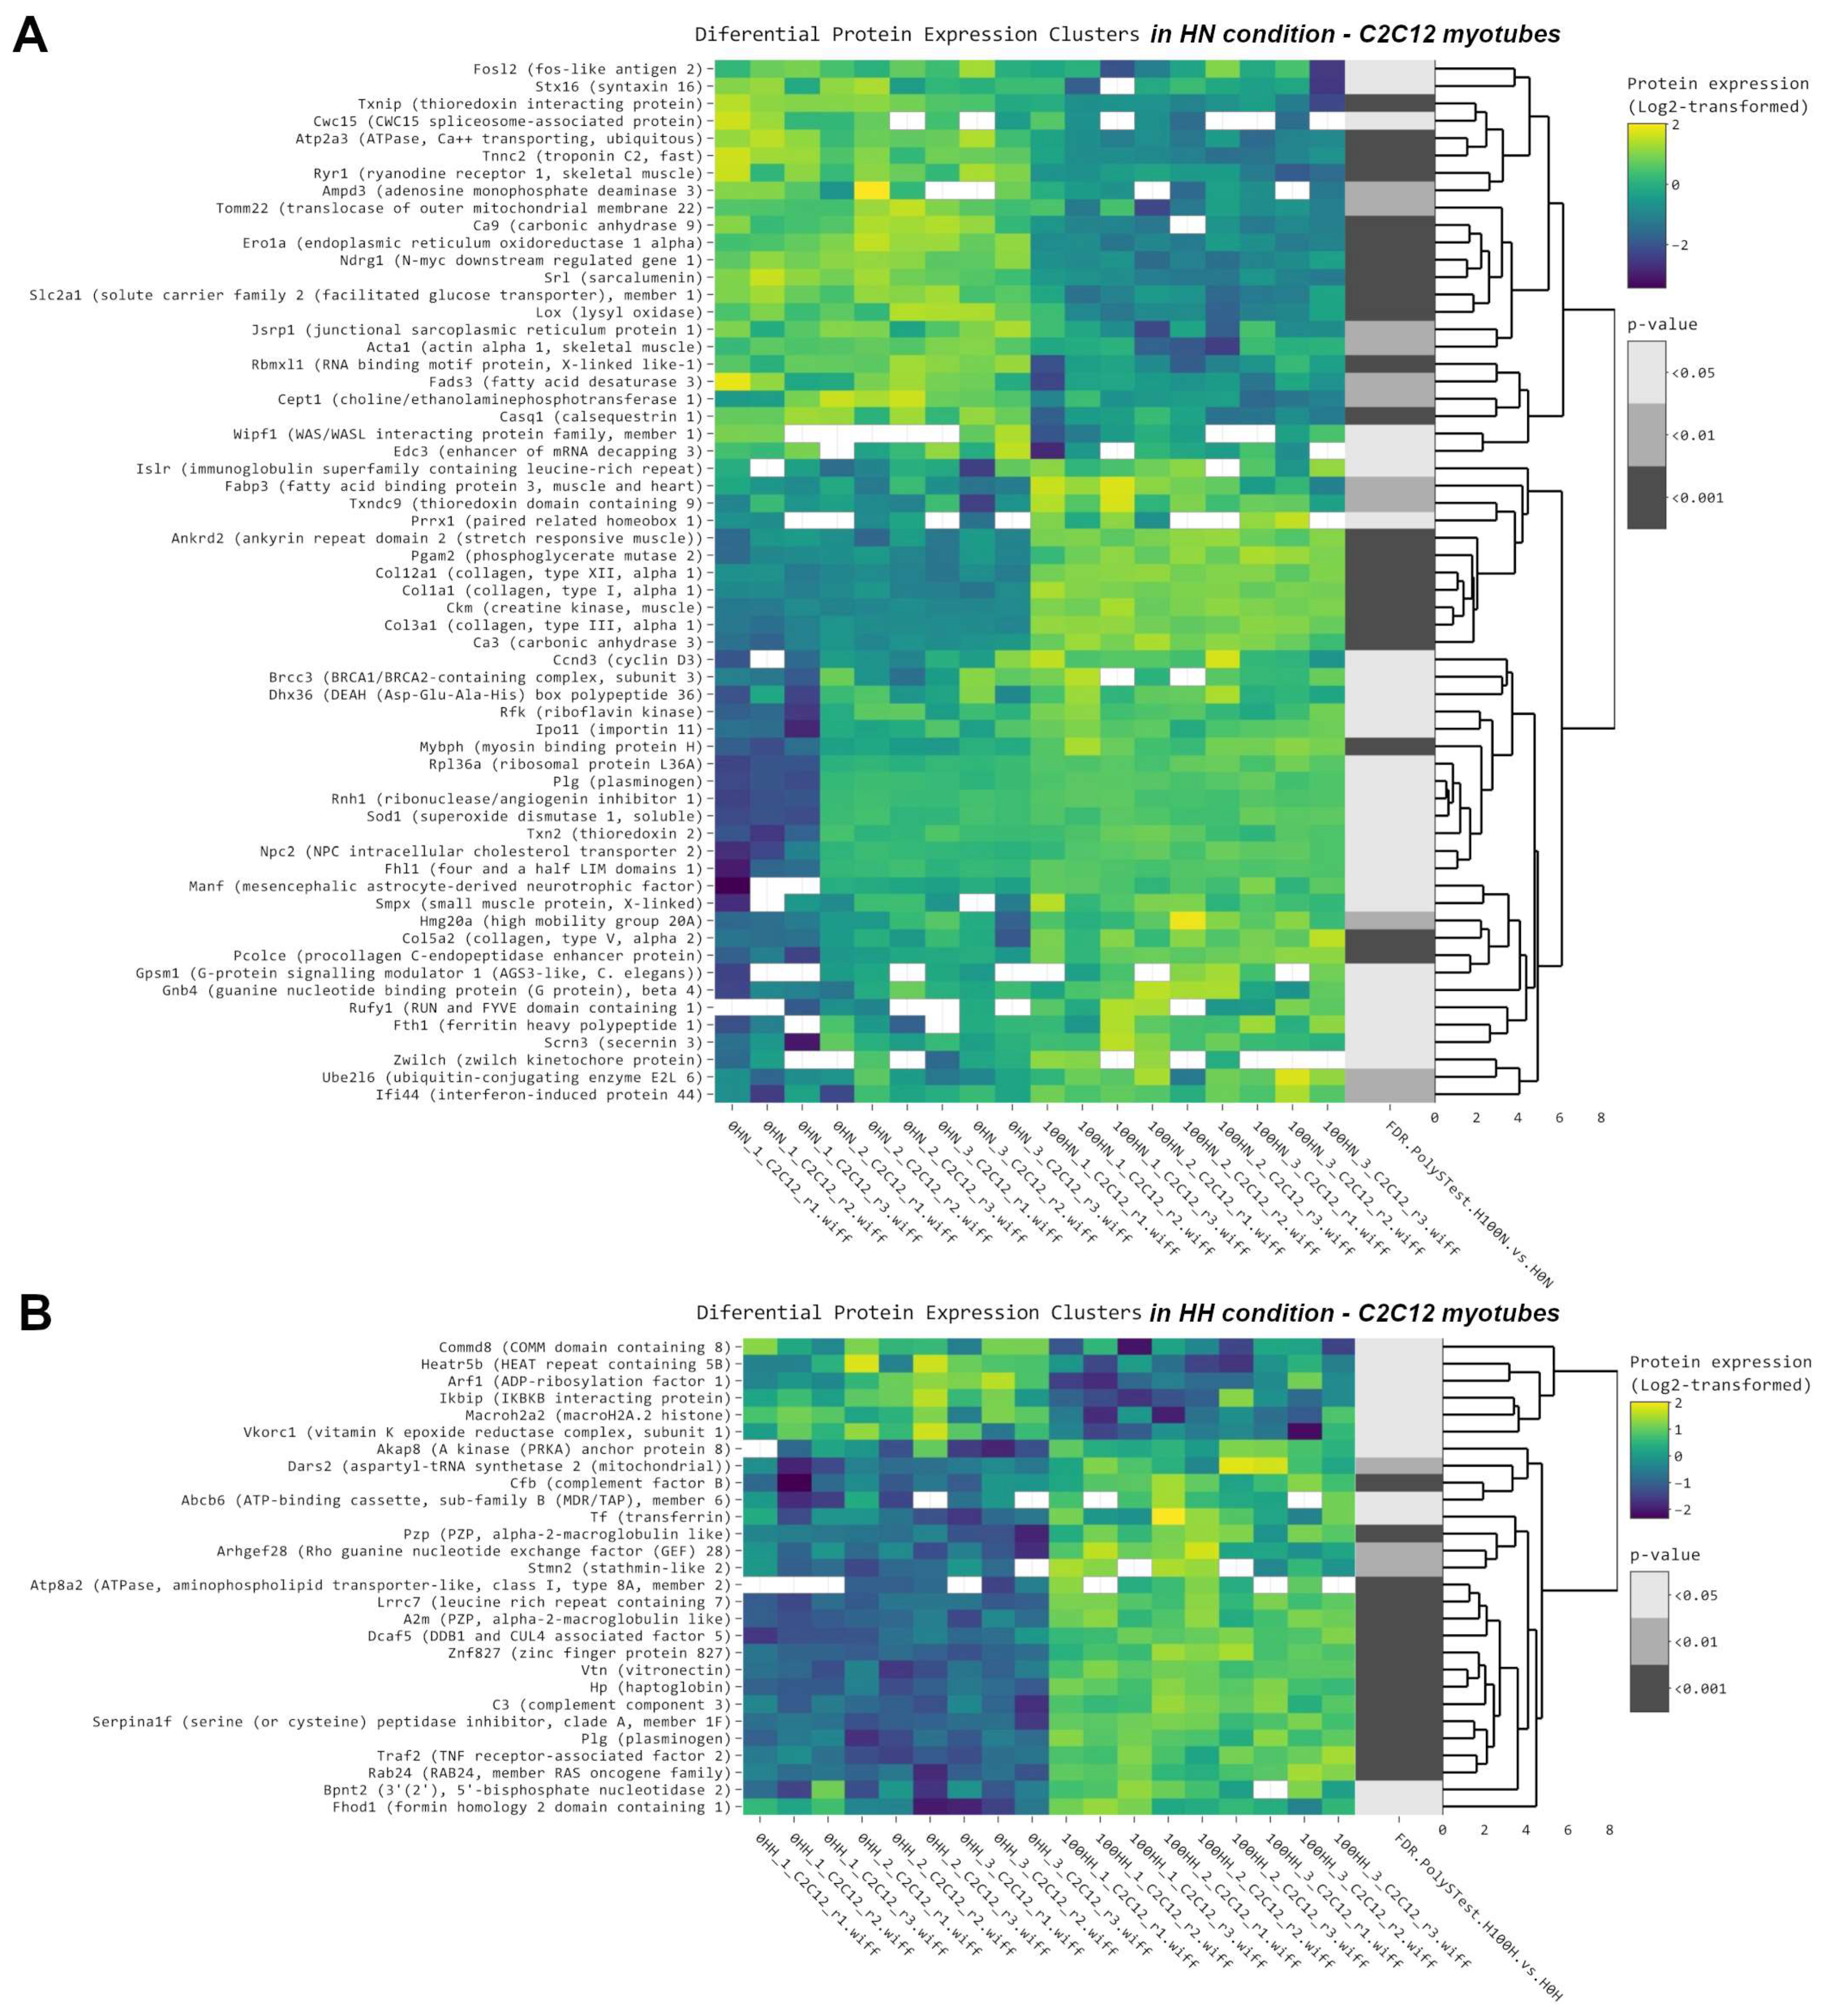
2.7. NMN Downregulates Spliceosome Proteins While Upregulating Ribosome Proteins in Hepatocytes
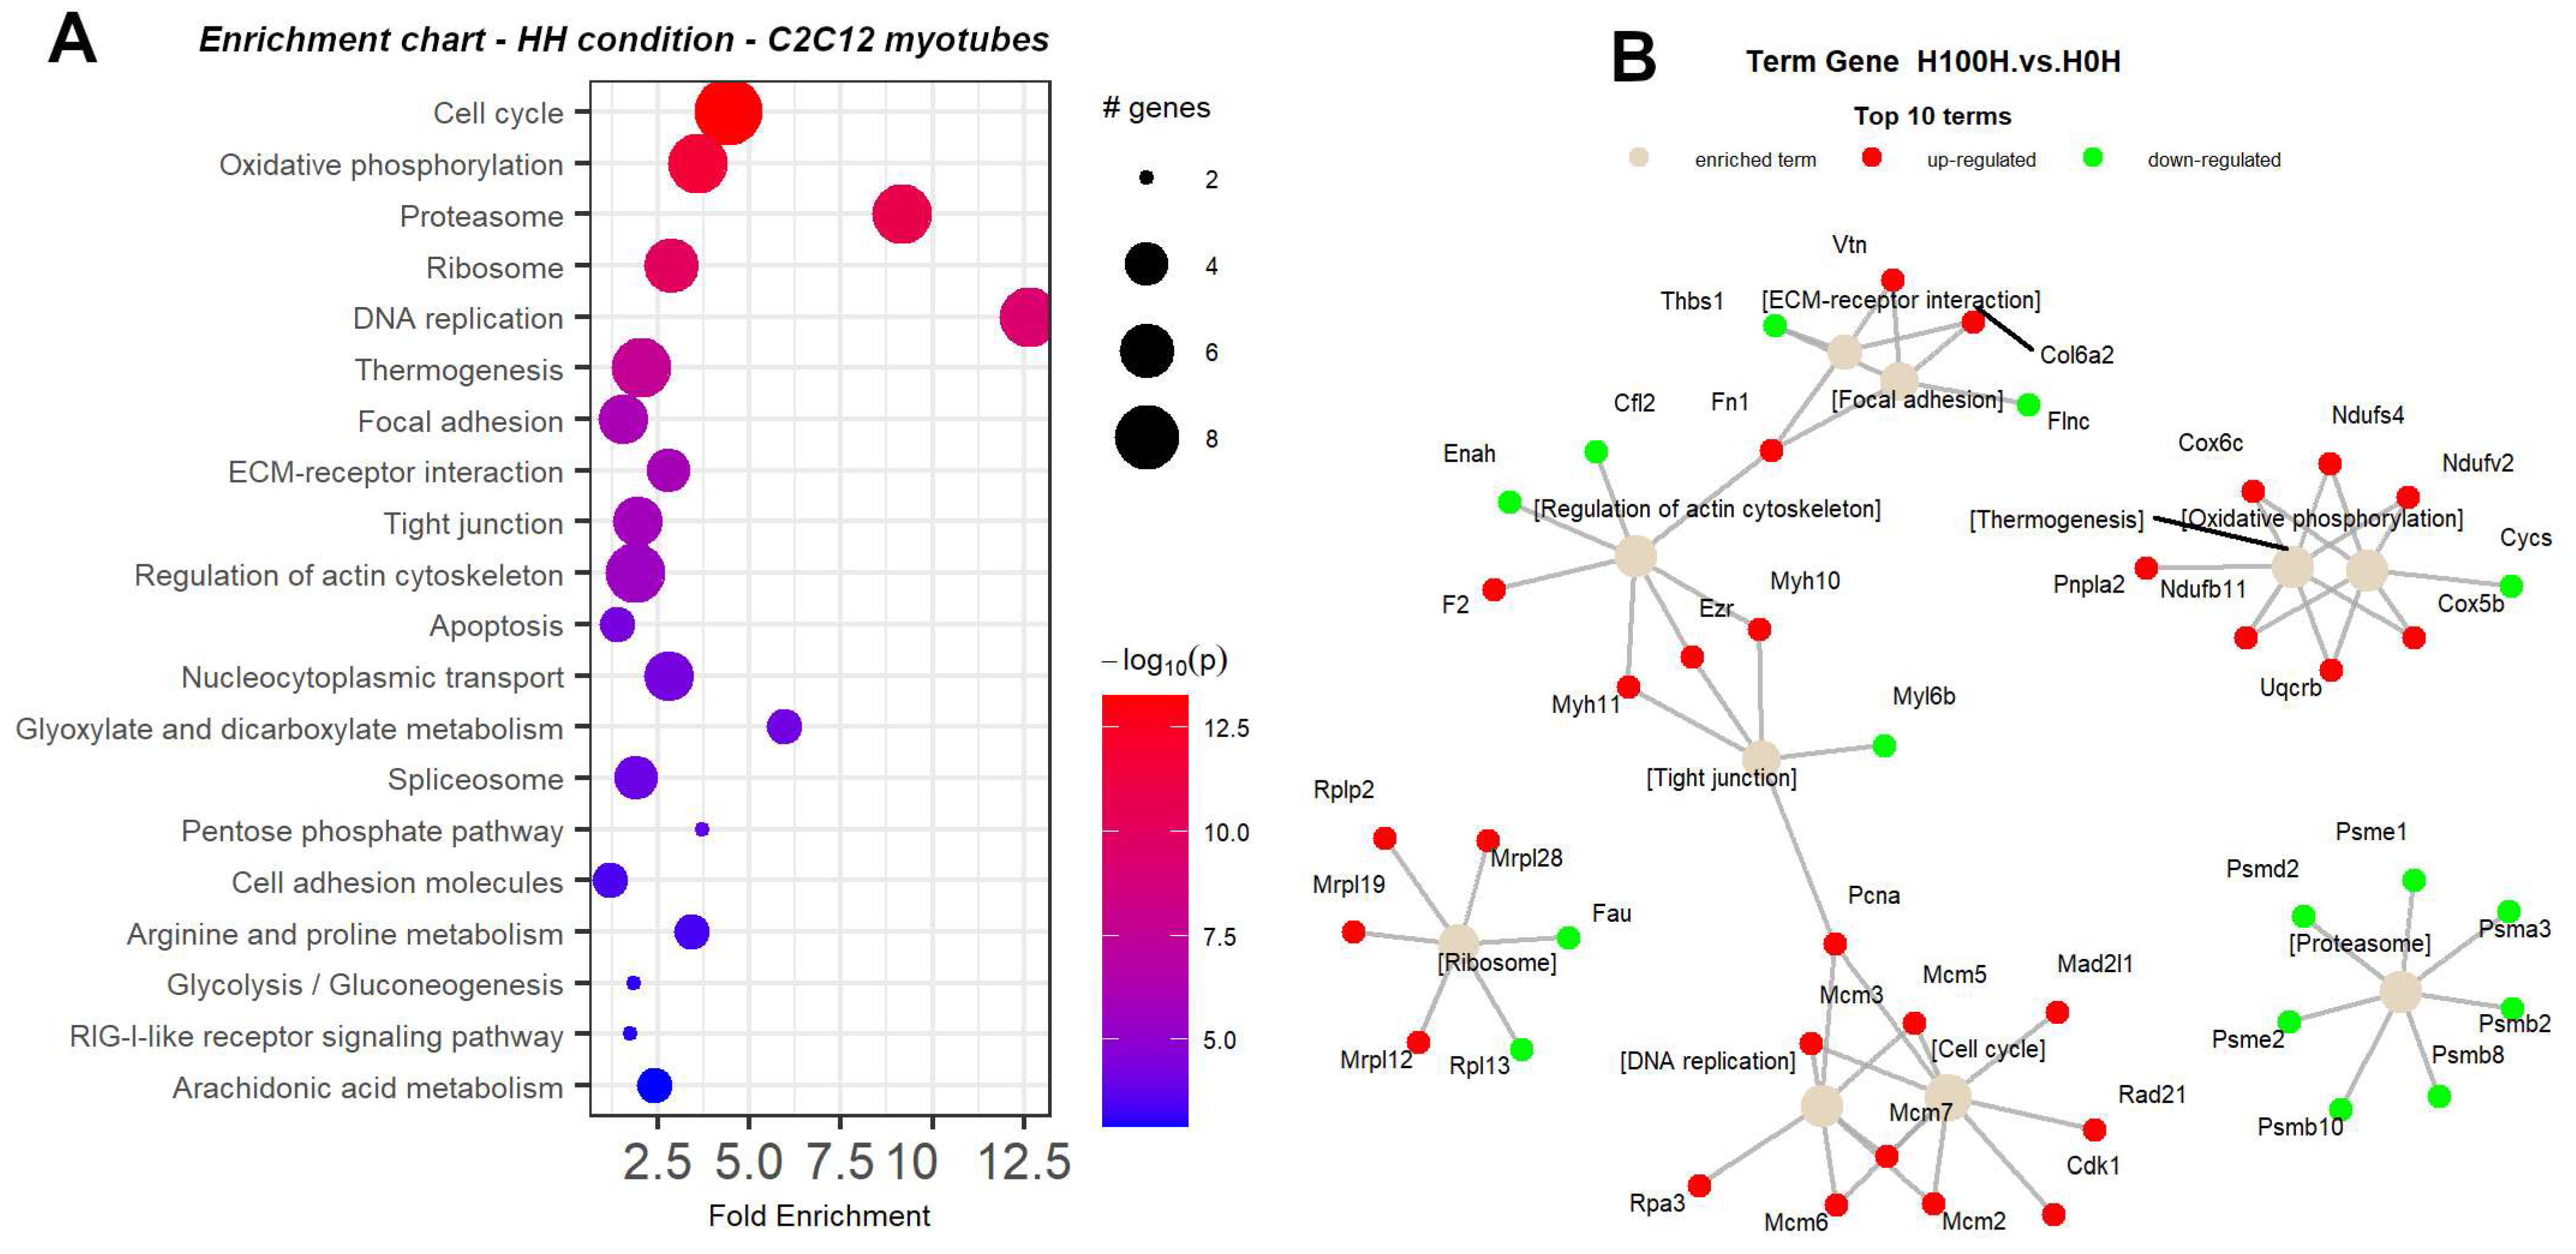
2.8. NMN Downregulates Proteasome and Upregulates DNA Replication and Cell Cycle Pathways in Muscle Cells
3. Discussion
4. Materials and Methods
4.1. Animal Experiments and NMN Treatment
4.2. Serum Levels of Triglycerides and Cholesterol
4.3. Histochemical Observation
4.4. Cell Culture, Differentiation, and NMN Treatment
4.5. Flow Cytometry
4.6. Fluorescence Microscopy
4.7. Sample Preparation for Mass Spectrometry Analysis
4.8. Identification of Proteins by Liquid Chromatography–Mass Spectrometry Analysis
4.9. Data Analysis
5. Conclusions
Supplementary Materials
Author Contributions
Funding
Institutional Review Board Statement
Data Availability Statement
Acknowledgments
Conflicts of Interest
Appendix A


References
- International Diabetes Federation. IDF Diabetes Atlas, IDF, 10th ed.; International Diabetes Federation: Brussels, Belgium, 2022; pp. 1–141. Available online: https://diabetesatlas.org/ (accessed on 18 April 2023).
- Zhao, F.; Wu, W.; Feng, X.; Li, C. Physical Activity Levels and Diabetes Prevalence in US Adults: Findings from NHANES 2015–2016. Diabetes Ther. 2020, 11, 1303–1316. [Google Scholar] [CrossRef]
- O’Hearn, M.; Lara-Castor, L.; Cudhea, F.; Miller, V.; Reedy, J.; Shi, P.; Zhang, J.; Wong, J.B.; Economos, C.D.; Micha, R.; et al. Incident Type 2 Diabetes Attributable to Suboptimal Diet in 184 Countries. Nat. Med. 2023, 29, 982–995. [Google Scholar] [CrossRef]
- Ruiz-Alejos, A.; Carrillo-Larco, R.M.; Miranda, J.J.; Anderson, C.A.M.; Gilman, R.H.; Smeeth, L.; Bernabé-Ortiz, A. Addressing the Impact of Urban Exposure on the Incidence of Type 2 Diabetes Mellitus: The Peru MIGRANT Study. Sci. Rep. 2018, 8, 5512. [Google Scholar] [CrossRef]
- International Diabetes Federation. IDF Diabetes Atlas, IDF, 8th ed.; International Diabetes Federation: Brussels, Belgium, 2018; pp. 1–150. Available online: https://diabetesatlas.org/ (accessed on 18 April 2023).
- Chadt, A.; Al-Hasani, H. Glucose Transporters in Adipose Tissue, Liver, and Skeletal Muscle in Metabolic Health and Disease. Pflugers. Arch. 2020, 472, 1273–1298. [Google Scholar] [CrossRef]
- Han, H.; Kang, G.; Kim, J.S.; Choi, B.H.; Koo, S. Regulation of Glucose Metabolism from a Liver-Centric Perspective. Exp. Mol. Med. 2016, 48, e218. [Google Scholar] [CrossRef]
- Merz, K.E.; Thurmond, D.C. Role of Skeletal Muscle in Insulin Resistance and Glucose Uptake. Compr. Physiol. 2021, 10, 785–809. [Google Scholar] [CrossRef]
- Longo, M.; Zatterale, F.; Naderi, J.; Parrillo, L.; Formisano, P.; Raciti, G.A.; Beguinot, F.; Miele, C. Adipose Tissue Dysfunction as Determinant of Obesity-Associated Metabolic Complications. Int. J. Mol. Sci. 2019, 20, 2358. [Google Scholar] [CrossRef]
- Wang, Q.; Duan, L.; Li, X.; Wang, Y.; Guo, W.; Guan, F.; Ma, S. Glucose Metabolism, Neural Cell Senescence and Alzheimer’s Disease. Int. J. Mol. Sci. 2022, 23, 4351. [Google Scholar] [CrossRef]
- Yoshino, J.; Mills, K.F.; Yoon, M.J.; Imai, S.I. Nicotinamide Mononucleotide, a Key NAD+ Intermediate, Treats the Pathophysiology of Diet- and Age-Induced Diabetes in Mice. Cell Metab. 2011, 14, 528–536. [Google Scholar] [CrossRef]
- Gomes, A.P.; Price, N.L.; Ling, A.J.Y.; Moslehi, J.J.; Montgomery, M.K.; Rajman, L.; White, J.P.; Teodoro, J.S.; Wrann, C.D.; Hubbard, B.P.; et al. Declining NAD+ Induces a Pseudohypoxic State Disrupting Nuclear-Mitochondrial Communication during Aging. Cell 2013, 155, 1624–1638. [Google Scholar] [CrossRef]
- Mills, K.F.; Yoshida, S.; Stein, L.R.; Grozio, A.; Kubota, S.; Sasaki, Y.; Redpath, P.; Migaud, M.E.; Apte, R.S.; Uchida, K.; et al. Long-Term Administration of Nicotinamide Mononucleotide Mitigates Age-Associated Physiological Decline in Mice. Cell Metab. 2016, 24, 795–806. [Google Scholar] [CrossRef]
- Hong, W.; Mo, F.; Zhang, Z.; Huang, M.; Wei, X. Nicotinamide Mononucleotide: A Promising Molecule for Therapy of Diverse Diseases by Targeting NAD+ Metabolism. Front. Cell Dev. Biol. 2020, 8, 246. [Google Scholar] [CrossRef]
- Majeed, Y.; Halabi, N.; Madani, A.Y.; Engelke, R.; Bhagwat, A.M.; Abdesselem, H.; Agha, M.V.; Vakayil, M.; Courjaret, R.; Goswami, N.; et al. SIRT1 Promotes Lipid Metabolism and Mitochondrial Biogenesis in Adipocytes and Coordinates Adipogenesis by Targeting Key Enzymatic Pathways. Sci. Rep. 2021, 11, 8177. [Google Scholar] [CrossRef]
- Price, N.L.; Gomes, A.P.; Ling, A.J.Y.; Duarte, F.V.; Martin-Montalvo, A.; North, B.J.; Agarwal, B.; Ye, L.; Ramadori, G.; Teodoro, J.S.; et al. SIRT1 Is Required for AMPK Activation and the Beneficial Effects of Resveratrol on Mitochondrial Function. Cell Metab. 2012, 15, 675–690. [Google Scholar] [CrossRef]
- Roos, J.; Zinngrebe, J.; Fischer-Posovszky, P. Nicotinamide Mononucleotide: A Potential Effective Natural Compound against Insulin Resistance. Signal Transduct. Target. Ther. 2021, 6, 3–4. [Google Scholar] [CrossRef]
- Song, Q.; Zhou, X.; Xu, K.; Liu, S.; Zhu, X.; Yang, J. The Safety and Antiaging Effects of Nicotinamide Mononucleotide in Human Clinical Trials: An Update. Adv. Nutr. 2023, 14, 1416–1435. [Google Scholar] [CrossRef]
- Deu, E.; Verdoes, M.; Bogyo, M. New Approaches for Dissecting Protease Functions to Improve Probe Development and Drug Discovery. Nat. Struct. Mol. Biol. 2012, 19, 9–16. [Google Scholar] [CrossRef]
- Schwämmle, V.; Hagensen, C.E.; Rogowska-Wrzesinska, A.; Jensen, O.N. PolySTest: Robust Statistical Testing of Proteomics Data with Missing Values Improves Detection of Biologically Relevant Features. Mol. Cell. Proteom. 2020, 19, 1396–1408. [Google Scholar] [CrossRef]
- Kanehisa, M.; Goto, S. KEGG: Kyoto Encyclopedia of Genes and Genomes. Nucleic Acids Res. 2000, 28, 27–30. [Google Scholar] [CrossRef]
- Kanehisa, M. Toward Understanding the Origin and Evolution of Cellular Organisms. Protein Sci. 2019, 28, 1947–1951. [Google Scholar] [CrossRef]
- Kanehisa, M.; Furumichi, M.; Sato, Y.; Kawashima, M.; Ishiguro-Watanabe, M. KEGG for Taxonomy-Based Analysis of Pathways and Genomes. Nucleic Acids Res. 2023, 51, 587–592. [Google Scholar] [CrossRef]
- Alberts, B. Molecular Biology of the Cell, 4th ed.; Garland Science, Taylor and Francis Group: New York, NY, USA, 2015. [Google Scholar]
- Demichev, V.; Messner, C.B.; Vernardis, S.I.; Lilley, K.S.; Ralser, M. DIA-NN: Neural Networks and Interference Correction Enable Deep Proteome Coverage in High Throughput. Nat. Methods 2020, 17, 41–44. [Google Scholar] [CrossRef]
- Huang, H.H.; Ferguson, I.D.; Thornton, A.M.; Bastola, P.; Lam, C.; Lin, Y.H.T.; Choudhry, P.; Mariano, M.C.; Marcoulis, M.D.; Teo, C.F.; et al. Proteasome Inhibitor-Induced Modulation Reveals the Spliceosome as a Specific Therapeutic Vulnerability in Multiple Myeloma. Nat. Commun. 2020, 11, 1931. [Google Scholar] [CrossRef]
- Moya-Quiles, M.R.; Torío, A.; Muro, M.; Montes-Ares, O.; Marin, L.; Minguela, A.; Sánchez-Bueno, F.; Garcia-Alonso, A.M.; Parrilla, P.; Álvarez-López, M.R. Impact of HLA-C on Acute Rejection in Liver Transplantation. Transplant. Proc. 2003, 35, 1892–1893. [Google Scholar] [CrossRef] [PubMed]
- Chon, J.; Stover, P.J.; Field, M.S. Targeting Nuclear Thymidylate Biosynthesis. Mol. Asp. Med. 2017, 53, 48–56. [Google Scholar] [CrossRef]
- Bolderson, E.; Petermann, E.; Croft, L.; Suraweera, A.; Pandita, R.K.; Pandita, T.K.; Helleday, T.; Khanna, K.K.; Richard, D.J. Human Single-Stranded DNA Binding Protein 1 (HSSB1/NABP2) Is Required for the Stability and Repair of Stalled Replication Forks. Nucleic Acids Res. 2014, 42, 6326–6336. [Google Scholar] [CrossRef] [PubMed]
- Hurov, K.E.; Cotta-Ramusino, C.; Elledge, S.J. A Genetic Screen Identifies the Triple T Complex Required for DNA Damage Signaling and ATM and ATR Stability. Genes Dev. 2010, 24, 1939–1950. [Google Scholar] [CrossRef] [PubMed]
- Michalopoulos, G.K. Liver Regeneration after Partial Hepatectomy: Critical Analysis of Mechanistic Dilemmas. Am. J. Pathol. 2010, 176, 2–13. [Google Scholar] [CrossRef]
- Jiao, X.; Doamekpor, S.K.; Bird, J.G.; Nickels, B.E.; Tong, L.; Hart, R.P.; Kiledjian, M. 5′ End Nicotinamide Adenine Dinucleotide Cap in Human Cells Promotes RNA Decay through DXO-Mediated DeNADding. Cell 2017, 168, 1015–1027.e10. [Google Scholar] [CrossRef]
- Kiledjian, M. Eukaryotic RNA 5′-End NAD+ Capping and DeNADding. Trends Cell Biol. 2018, 28, 454–464. [Google Scholar] [CrossRef]
- Yuan, F.; Li, G.; Tong, T. Nucleolar and Coiled-Body Phosphoprotein 1 (NOLC1) Regulates the Nucleolar Retention of TRF2. Cell Death Discov. 2017, 3, 17043. [Google Scholar] [CrossRef]
- Guo, M. Cellular Senescence and Liver Disease: Mechanisms and Therapeutic Strategies. Biomed. Pharmacother. 2017, 96, 1527–1537. [Google Scholar] [CrossRef]
- Dewidar, B.; Soukupova, J.; Fabregat, I.; Dooley, S. TGF-β in Hepatic Stellate Cell Activation and Liver Fibrogenesis: Updated. Curr. Pathobiol. Rep. 2015, 3, 291–305. [Google Scholar] [CrossRef]
- Kim, W.; Deik, A.; Gonzalez, C.; Gonzalez, M.E.; Fu, F.; Ferrari, M.; Churchhouse, C.L.; Florez, J.C.; Jacobs, S.B.R.; Clish, C.B.; et al. Polyunsaturated Fatty Acid Desaturation Is a Mechanism for Glycolytic NAD+ Recycling. Cell Metab. 2019, 29, 856–870.e7. [Google Scholar] [CrossRef]
- Melis, M.; Tang, X.H.; Trasino, S.E.; Gudas, L.J. Retinoids in the Pathogenesis and Treatment of Liver Diseases. Nutrients 2022, 14, 1456. [Google Scholar] [CrossRef]
- Bogdan, A.R.; Miyazawa, M.; Hashimoto, K.; Tsuji, Y. Regulators of Iron Homeostasis: New Players in Metabolism, Cell Death, and Disease. Trends Biochem. Sci. 2016, 41, 274–286. [Google Scholar] [CrossRef]
- Fujimoto, B.A.; Young, M.; Nakamura, N.; Ha, H.; Carter, L.; Pitts, M.W.; Torres, D.; Noh, H.L.; Suk, S.; Kim, J.K.; et al. Disrupted Glucose Homeostasis and Skeletal-Muscle-Specific Glucose Uptake in an Exocyst Knockout Mouse Model. J. Biol. Chem. 2021, 296, 100482. [Google Scholar] [CrossRef] [PubMed]
- Hulett, N.A.; Scalzo, R.L.; Reusch, J.E.B. Glucose Uptake by Skeletal Muscle within the Contexts of Type 2 Diabetes and Exercise: An Integrated Approach. Nutrients 2022, 14, 647. [Google Scholar] [CrossRef] [PubMed]
- Busiello, R.A.; Savarese, S.; Lombardi, A. Mitochondrial Uncoupling Proteins and Energy Metabolism. Front. Physiol. 2015, 6, 36. [Google Scholar] [CrossRef] [PubMed]
- Niu, K.M.; Bao, T.; Gao, L.; Ru, M.; Li, Y.; Jiang, L.; Ye, C.; Wang, S.; Wu, X. The Impacts of Short-Term NMN Supplementation on Serum Metabolism, Fecal Microbiota, and Telomere Length in Pre-Aging Phase. Front. Nutr. 2021, 8, 756243. [Google Scholar] [CrossRef] [PubMed]
- Bargut, T.C.L.; Souza-Mello, V.; Aguila, M.B.; Mandarim-De-Lacerda, C.A. Browning of White Adipose Tissue: Lessons from Experimental Models. Horm. Mol. Biol. Clin. Investig. 2017, 31, 20160051. [Google Scholar] [CrossRef]
- Spindel, O.N.; World, C.; Berk, B.C. Thioredoxin Interacting Protein: Redox Dependent and Independent Regulatory Mechanisms. Antioxid. Redox Signal. 2012, 16, 587–596. [Google Scholar] [CrossRef]
- Parikh, H.; Carlsson, E.; Chutkow, W.A.; Johansson, L.E.; Storgaard, H.; Poulsen, P.; Saxena, R.; Ladd, C.; Schulze, P.C.; Mazzini, M.J.; et al. TXNIP Regulates Peripheral Glucose Metabolism in Humans. PLoS Med. 2007, 4, e158. [Google Scholar] [CrossRef]
- Alhawiti, N.M.; Al Mahri, S.; Aziz, M.A.; Malik, S.S.; Mohammad, S. TXNIP in Metabolic Regulation: Physiological Role and Therapeutic Outlook. Curr. Drug Targets 2017, 18, 1095–1103. [Google Scholar] [CrossRef] [PubMed]
- Oberacker, T.; Bajorat, J.; Ziola, S.; Schroeder, A.; Röth, D.; Kastl, L.; Edgar, B.A.; Wagner, W.; Gülow, K.; Krammer, P.H. Enhanced Expression of Thioredoxin-Interacting-Protein Regulates Oxidative DNA Damage and Aging. FEBS Lett. 2018, 592, 2297–2307. [Google Scholar] [CrossRef] [PubMed]
- Herchenröther, A.; Gossen, S.; Friedrich, T.; Reim, A.; Daus, N.; Diegmüller, F.; Leers, J.; Sani, H.M.; Gerstner, S.; Schwarz, L.; et al. The H2A.Z and NuRD Associated Protein HMG20A Controls Early Head and Heart Developmental Transcription Programs. Nat. Commun. 2023, 14, 472. [Google Scholar] [CrossRef] [PubMed]
- Dilworth, L.; Facey, A.; Omoruyi, F. Diabetes Mellitus and Its Metabolic Complications: The Role of Adipose Tissues. Int. J. Mol. Sci. 2021, 22, 7644. [Google Scholar] [CrossRef]
- Pamarthy, S.; Kulshrestha, A.; Katara, G.K.; Beaman, K.D. The Curious Case of Vacuolar ATPase: Regulation of Signaling Pathways. Mol. Cancer 2018, 17, 41. [Google Scholar] [CrossRef]
- Wautier, J.L.; Wautier, M.P. Vascular Permeability in Diseases. Int. J. Mol. Sci. 2022, 23, 3645. [Google Scholar] [CrossRef]
- Jamaluddin, M.S.; Weakley, S.M.; Yao, Q.; Chen, C. Resistin: Functional Roles and Therapeutic Considerations for Cardiovascular Disease. Br. J. Pharmacol. 2012, 165, 622–632. [Google Scholar] [CrossRef]
- Jiang, Y.; Lu, L.; Hu, Y.; Li, Q.; An, C.; Yu, X.; Shu, L.; Chen, A.; Niu, C.; Zhou, L.; et al. Resistin Induces Hypertension and Insulin Resistance in Mice via a TLR4-Dependent Pathway. Sci. Rep. 2016, 6, 22193. [Google Scholar] [CrossRef]
- Deitmer, J.W.; Theparambil, S.M.; Ruminot, I.; Noor, S.I.; Becker, H.M. Energy Dynamics in the Brain: Contributions of Astrocytes to Metabolism and PH Homeostasis. Front. Neurosci. 2019, 13, 1301. [Google Scholar] [CrossRef]
- Wei, P.; Blundon, J.A.; Rong, Y.; Zakharenko, S.S.; Morgan, J.I. Impaired Locomotor Learning and Altered Cerebellar Synaptic Plasticity in Pep-19/Pcp4 -Null Mice. Mol. Cell. Biol. 2011, 31, 2838–2844. [Google Scholar] [CrossRef] [PubMed]
- Zhong, W. Diversifying Neural Cells through Order of Birth and Asymmetry of Division. Neuron 2003, 37, 11–14. [Google Scholar] [CrossRef] [PubMed]
- El-Hashash, A.H.K.; Warburton, D. Numb Expression and Asymmetric versus Symmetric Cell Division in Distal Embryonic Lung Epithelium. J. Histochem. Cytochem. 2012, 60, 675–682. [Google Scholar] [CrossRef] [PubMed]
- Johnson, R.J.; Lanaspa, M.A.; Sanchez-lozada, L.G.; Tolan, D.; Nakagawa, T.; Ishimoto, T.; Andres-hernando, A.; Rodriguez-iturbe, B.; Stenvinkel, P. The Fructose Survival Hypothesis for Obesity. Phil. Trans. R. Soc. B 2023, 378, 20220230. [Google Scholar] [CrossRef] [PubMed]
- Johnson, R.J.; Gomez-Pinilla, F.; Nagel, M.; Nakagawa, T.; Rodriguez-Iturbe, B.; Sanchez-Lozada, L.G.; Tolan, D.R.; Lanaspa, M.A. Cerebral Fructose Metabolism as a Potential Mechanism Driving Alzheimer’s Disease. Front. Aging Neurosci. 2020, 12, 560865. [Google Scholar] [CrossRef] [PubMed]
- Koriyama, Y.; Furukawa, A.; Muramatsu, M.; Takino, J.I.; Takeuchi, M. Glyceraldehyde Caused Alzheimer’s Disease-like Alterations in Diagnostic Marker Levels in SH-SY5Y Human Neuroblastoma Cells. Sci. Rep. 2015, 5, 13313. [Google Scholar] [CrossRef] [PubMed]
- Ma, J.; You, D.; Chen, S.; Fang, N.; Yi, X.; Wang, Y.; Lu, X.; Li, X.; Zhu, M.; Xue, M.; et al. Epigenetic Association Study Uncovered H3K27 Acetylation Enhancers and Dysregulated Genes in High-Fat-Diet-Induced Nonalcoholic Fatty Liver Disease in Rats. Epigenomics 2022, 14, 1523–1540. [Google Scholar] [CrossRef]
- Jia, S.; Liu, J.Y.; Chu, Y.; Liu, Q.; Mai, L.; Fan, W. Single-Cell RNA Sequencing Reveals Distinct Transcriptional Features of the Purinergic Signaling in Mouse Trigeminal Ganglion. Front. Mol. Neurosci. 2022, 15, 1038539. [Google Scholar] [CrossRef]
- Sita, G.; Hrelia, P.; Tarozzi, A.; Morroni, F. P-Glycoprotein (ABCB1) and Oxidative Stress: Focus on Alzheimer⇔s Disease. Oxid. Med. Cell. Longev. 2017, 2017, 7905486. [Google Scholar] [CrossRef] [PubMed]
- De Santis, R.; Alfano, V.; de Turris, V.; Colantoni, A.; Santini, L.; Garone, M.G.; Antonacci, G.; Peruzzi, G.; Sudria-Lopez, E.; Wyler, E.; et al. Mutant FUS and ELAVL4 (HuD) Aberrant Crosstalk in Amyotrophic Lateral Sclerosis. Cell Rep. 2019, 27, 3818–3831.e5. [Google Scholar] [CrossRef] [PubMed]
- Song, G.; Zhang, S.; Tian, M.; Zhang, L.; Guo, R.; Zhuo, W.; Yang, M. Molecular Insights into the Human ABCB6 Transporter. Cell Discov. 2021, 7, 55. [Google Scholar] [CrossRef] [PubMed]
- Deng, S.; Liu, S.; Jin, P.; Feng, S.; Tian, M.; Wei, P.; Zhu, H.; Tan, J.; Zhao, F.; Gong, Y. Albumin Reduces Oxidative Stress and Neuronal Apoptosis via the ERK/Nrf2/HO-1 Pathway after Intracerebral Hemorrhage in Rats. Oxid. Med. Cell. Longev. 2021, 2021, 8891373. [Google Scholar] [CrossRef] [PubMed]
- Dutta, S.; Roy, S.; Polavaram, N.S.; Baretton, G.B.; Muders, M.H.; Batra, S.; Datta, K. NRP2 Transcriptionally Regulates Its Downstream Effector WDFY1. Sci. Rep. 2016, 6, 23588. [Google Scholar] [CrossRef] [PubMed]
- Negraes, P.D.; Trujillo, C.A.; Pillat, M.M.; Teng, Y.D.; Ulrich, H. Roles of Kinins in the Nervous System. Cell Transplant. 2015, 24, 613–623. [Google Scholar] [CrossRef] [PubMed]
- Wang, Y.; Sun, Z.S.; Szyf, M. S-Adenosyl-Methionine (SAM) Alters the Transcriptome and Methylome and Specifically Blocks Growth and Invasiveness of Liver Cancer Cells. Oncotarget 2017, 8, 111866–111881. [Google Scholar] [CrossRef] [PubMed]
- Zabala-Letona, A.; Arruabarrena-Aristorena, A.; Fernandez-Ruiz, S.; Viera, C.; Carlevaris, O.; Ercilla, A.; Mendizabal, I.; Martin, T.; Macchia, A.; Camacho, L.; et al. PI3K-Regulated Glycine N-Methyltransferase Is Required for the Development of Prostate Cancer. Oncogenesis 2022, 11, 10. [Google Scholar] [CrossRef]
- Carrasco, M.; Rabaneda, L.G.; Murillo-carretero, M.; Ortega-, S.; Martínez-chantar, M.L.; Woodhoo, A.; Luka, Z.; Lu, S.C.; Mato, J.M.; Micó, J.A.; et al. Glycine N-methyltransferase expression in the hippocampus and its role in neurogenesis and cognitive performance. Hippocampus 2015, 24, 840–852. [Google Scholar] [CrossRef]
- Pircs, K.; Drouin-Ouellet, J.; Horváth, V.; Gil, J.; Rezeli, M.; Garza, R.; Grassi, D.A.; Sharma, Y.; St-Amour, I.; Harris, K.; et al. Distinct Subcellular Autophagy Impairments in Induced Neurons from Patients with Huntington’s Disease. Brain 2022, 145, 3035–3057. [Google Scholar] [CrossRef]
- Liang, D.; Aygün, N.; Matoba, N.; Ideraabdullah, F.Y.; Love, M.I.; Stein, J.L. Inference of putative cell-type-specific imprinted regulatory elements and genes during human neuronal differentiation. Hum. Mol. Genet. 2023, 32, 402–416. [Google Scholar] [CrossRef] [PubMed]
- Puchalska, P.; Crawford, P.A. Multi-Dimensional Roles of Ketone Bodies in Fuel Metabolism, Signaling, and Therapeutics. Cell Metab. 2017, 25, 262–284. [Google Scholar] [CrossRef] [PubMed]
- Lee, P.C.W.; Dodart, J.C.; Aron, L.; Finley, L.W.; Bronson, R.T.; Haigis, M.C.; Yankner, B.A.; Harper, J.W. Altered Social Behavior and Neuronal Development in Mice Lacking the Uba6-Use1 Ubiquitin Transfer System. Mol. Cell 2013, 50, 172–184. [Google Scholar] [CrossRef]
- Tarsa, L.; Goda, Y. Synaptophysin Regulates Activity-Dependent Synapse Formation in Cultured Hippocampal Neurons. Proc. Natl. Acad. Sci. USA 2002, 99, 1012–1016. [Google Scholar] [CrossRef]
- Smiley, S.; Nickerson, P.E.; Comanita, L.; Daftarian, N.; El-Sehemy, A.; Tsai, E.L.S.; Matan-Lithwick, S.; Yan, K.; Thurig, S.; Touahri, Y.; et al. Establishment of a Cone Photoreceptor Transplantation Platform Based on a Novel Cone-GFP Reporter Mouse Line. Sci. Rep. 2016, 6, 22867. [Google Scholar] [CrossRef]
- Perez-Riverol, Y.; Bai, J.; Bandla, C.; García-Seisdedos, D.; Hewapathirana, S.; Kamatchinathan, S.; Kundu, D.J.; Prakash, A.; Frericks-Zipper, A.; Eisenacher, M.; et al. The PRIDE Database Resources in 2022: A Hub for Mass Spectrometry-Based Proteomics Evidences. Nucleic Acids Res. 2022, 50, D543–D552. [Google Scholar] [CrossRef]
- Cox, J.; Hein, M.Y.; Luber, C.A.; Paron, I.; Nagaraj, N.; Mann, M. Accurate Proteome-Wide Label-Free Quantification by Delayed Normalization and Maximal Peptide Ratio Extraction, Termed MaxLFQ. Mol. Cell. Proteom. 2014, 13, 2513–2526. [Google Scholar] [CrossRef] [PubMed]
- Carlson, M. org.Mm.eg.db: Genome Wide Annotation for Mouse, R package version 3.8.2; Bioconductor. 2019. Available online: https://bioconductor.org/packages/release/data/annotation/html/org.Mm.eg.db.html(accessed on 10 January 2023).
- Carlson, M. org.Hs.eg.db: Genome Wide Annotation for Human, R package version 3.8.2; Bioconductor. 2019. Available online: https://bioconductor.org/packages/release/data/annotation/html/org.Hs.eg.db.html(accessed on 10 January 2023).
- Ulgen, E.; Ozisik, O.; Sezerman, O.U. PathfindR: An R Package for Comprehensive Identification of Enriched Pathways in Omics Data through Active Subnetworks. Front. Genet. 2019, 10, 858. [Google Scholar] [CrossRef]
- Luo, W.; Brouwer, C. Pathview: An R/Bioconductor Package for Pathway-Based Data Integration and Visualization. Bioinformatics 2013, 29, 1830–1831. [Google Scholar] [CrossRef]


| Tissue | Protein Name/Pathway | Function | Expression Change |
|---|---|---|---|
| Liver | Nolc1 | Ribosome biogenesis | Downregulated |
| Liver | Clic4 | Regulation of extracellular matrix production | Downregulated |
| Liver | Mt-Cyb | Improves the electron carrier function of mitochondria | Upregulated |
| Liver | FTH1 | Iron storage and homeostasis | Upregulated |
| Liver | |||
| Muscle | NUP210L | Transport of macromolecules between the nucleus and cytoplasm | Upregulated |
| Muscle | Cep43 | Regulation of microtubule dynamics and spindle formation during mitosis | Upregulated |
| Muscle | VNN1 | Regulation of oxidative stress and inflammation | Upregulated |
| Muscle | CDC27 | Regulation of the cell cycle | Upregulated |
| Muscle | TRAPPC3L | transport of proteins between the endoplasmic reticulum (ER) and Golgi apparatus | Upregulated |
| Muscle | GLUT4 | Glucose internalization in muscle cells | Downregulated |
| Muscle | UCP1 | Thermogenesis | Upregulated |
| Adipose | mTOR pathway | Cell growth | Upregulated |
| Adipose | Lysosomal pathway | Lipid metabolism | Upregulated |
| Adipose | Resistin | Adipokine involved in insulin resistance | Downregulated |
| Brain | OXPHOS proteins | Mitochondrial function | Downregulated |
| Brain | Tight Junctions | Cell membrane structure | Upregulated |
| Brain | ABCB10 | Regulation of mitochondrial function in neurons | Downregulated |
| Brain | Synaptic plasticity proteins | Neuronal survival and development | Upregulated |
| Brain | HMGCS2 | Ketone bodies synthesis | Upregulated |
| Brain | Ube2z | Improved turnover of synaptic proteins | Upregulated |
Disclaimer/Publisher’s Note: The statements, opinions and data contained in all publications are solely those of the individual author(s) and contributor(s) and not of MDPI and/or the editor(s). MDPI and/or the editor(s) disclaim responsibility for any injury to people or property resulting from any ideas, methods, instructions or products referred to in the content. |
© 2024 by the authors. Licensee MDPI, Basel, Switzerland. This article is an open access article distributed under the terms and conditions of the Creative Commons Attribution (CC BY) license (https://creativecommons.org/licenses/by/4.0/).
Share and Cite
Popescu, R.G.; Dinischiotu, A.; Soare, T.; Vlase, E.; Marinescu, G.C. Nicotinamide Mononucleotide (NMN) Works in Type 2 Diabetes through Unexpected Effects in Adipose Tissue, Not by Mitochondrial Biogenesis. Int. J. Mol. Sci. 2024, 25, 2594. https://doi.org/10.3390/ijms25052594
Popescu RG, Dinischiotu A, Soare T, Vlase E, Marinescu GC. Nicotinamide Mononucleotide (NMN) Works in Type 2 Diabetes through Unexpected Effects in Adipose Tissue, Not by Mitochondrial Biogenesis. International Journal of Molecular Sciences. 2024; 25(5):2594. https://doi.org/10.3390/ijms25052594
Chicago/Turabian StylePopescu, Roua Gabriela, Anca Dinischiotu, Teodoru Soare, Ene Vlase, and George Cătălin Marinescu. 2024. "Nicotinamide Mononucleotide (NMN) Works in Type 2 Diabetes through Unexpected Effects in Adipose Tissue, Not by Mitochondrial Biogenesis" International Journal of Molecular Sciences 25, no. 5: 2594. https://doi.org/10.3390/ijms25052594