Article

Morphological Analyses and QTL Mapping of Mottled Leaf in Zucchini (Cucurbita pepo L.)

1
Key Laboratory of Biology and Genetic Improvement of Horticultural Crops (Northeast Region), Ministry of Agriculture and Rural Affairs, Northeast Agricultural University, Harbin 150030, China
2
College of Horticulture and Landscape Architecture, Northeast Agricultural University, Harbin 150030, China
*
Authors to whom correspondence should be addressed.
Int. J. Mol. Sci. 2024, 25(5), 2491; https://doi.org/10.3390/ijms25052491
Submission received: 15 January 2024 / Revised: 7 February 2024 / Accepted: 17 February 2024 / Published: 20 February 2024
(This article belongs to the Special Issue Advances in Research for Horticultural Crops Breeding and Genetics)

Abstract

:
The mottled leaf is one of the agronomic traits of zucchini and can be applied as a marker trait in aggregation breeding. However, the genetic mechanism responsible for mottled leaf has yet to be elucidated. In the present study, we used two inbred lines (line ‘19’: silver mottled leaf; line ‘113’: normal leaf) as parents for the physiological and genetic analysis of mottled leaf. The synthesis and net photosynthetic rate of chlorophyll were not significantly affected in the mottled areas of leaves. However, we detected a large space between the palisade parenchyma in the leaf mottle area of line ‘19’, which may have caused the mottled leaf phenotype. Light also plays an important role in the formation of mottled leaf, and receiving light during the early stages of leaf development is a necessary factor. Genetic analysis has previously demonstrated that mottled leaf is a quantitative trait that is controlled by multiple genes. Based on the strategy of quantitative trait locus sequencing (QTL-seq), two QTLs were identified on chromosomes 1 and 17, named CpML1.1 and CpML17.1, respectively. Two major loci were identified using R/qtl software version 1.66 under greenhouse conditions in April 2019 (2019A) and April 2020 (2020A) and under open cultivation conditions in May 2020 (2020M). The major QTL, CpML1.1, was located in a 925.2-kb interval on chromosome 1 and explained 10.51%-24.15% of the phenotypic variation. The CpML17.1 was located in a 719.7-kb interval on chromosome 17 and explained 16.25%-38.68% of the phenotypic variation. Based on gene annotation, gene sequence alignment, and qRT–PCR analysis, the Cp4.1LG01g23790 at the CpML1.1 locus encoding a protein of the TPX2 family (target protein of Xklp2) may be a candidate gene for mottled leaf in zucchini. Our findings may provide a theoretical basis for the formation of mottled leaf and provide a foundation for the fine mapping of genes associated with mottled leaf. Molecular markers closely linked to mottled leaf can be used in molecular-assisted selection for the zucchini mottled leaf breeding.

1. Introduction

Leaf color arises from the dynamic balance of various photosynthetic pigments, including chlorophyll and carotenoids, of which chlorophyll accounts for the largest proportion. Therefore, the color of the leaves is mostly green. When the proportion of photosynthetic pigments in plants changes, healthy leaves will appear in different colors. According to the leaf color phenotype, the color of leaves can be divided into pale green, stripe, spotted leaf, yellow-green, white-green, and other types [1]. According to their anatomical structure, they can be divided into chlorophyll type, air space type, epidermis type, pigment type, and appendage type [2]. Overall, the diversity of leaf colors is beneficial for enhancing the ornamental value of plants. Therefore, some plants intentionally cultivate different leaf color varieties, but usually, only a portion of seeds can transmit traits.
At present, many leaf color mutants have been reported in Arabidopsis. The im mutant exhibits white-green variation and possesses a small amount of carotenoids, abnormal plastids, and palisade parenchyma in the white area. The IM gene encodes a plastid terminal oxidase (PTOX), which participates in the synthesis of carotenoids. The formation of white areas may be due to insufficient carotenoid synthesis in im mutants; this can lead to chlorophyll photooxidation and influence the expression of chloroplast genes, ultimately resulting in the formation of leaf variation [3,4,5]. Similar to the im mutant, the var3, msl-1, and msl-2 mutants also exhibit abnormal palisade tissue [6,7]. Both var1 and var2 exhibit a yellow-green-white mottled phenotype. VAR1 and VAR2 encode a similar chloroplast FtSH protease, which plays an important role in the degradation of photodamage subunits in photosystem II. VAR1 and VAR2 are known to exert synergistic effects. Furthermore, the absence of VAR1 and VAR2 may damage the photoprotection mechanism and the development of thylakoids, resulting in variegated leaves [8,9,10,11]. White-green leaf mutants have also been reported in rice. Both zl16 and zebra524 exhibited a white-green leaf phenotype, encoding β-hydroxyl ACP dehydratase (HAD) and lycopene β-cyclizing enzymes, respectively, which play an important role in the synthesis of photosynthetic pigments [12,13]. The plastid ribosomal proteins (PRPs) and phosphate ribosamine glycine ligase (PurD) are involved in regulating chloroplast development and chlorophyll metabolism during leaf development to regulate rice leaf color [14,15]. RLK proteins also participate in the whitening of rice leaves through other pathways [16]. Similar phenotypes have also been reported in maize [17].
Among Cucurbitaceae crops, there are the most reports on the leaf color of cucumbers and pumpkins. Yellow-green leaf mutants are commonly found in cucumbers. Both mutants C777 and Ygl1 exhibited a yellow-green leaf phenotype. Their candidate genes are involved in chloroplast development and chlorophyll metabolism pathways to regulate cucumber leaf color [18,19]. Cucurbita pepo L. is an important commercial crop with good nutritional and medicinal value. C. pepo is rich in resources; most germplasm resources possess green leaves, although some plants have yellowing, albinism, or mottled leaves. There are two types of silver mottle on leaves in zucchini; one is a hereditary form of leaf mottle, and the other is caused by whitefly. Hereditary leaf mottle is regulated by a dominant gene which shows an irregular shape and grows along the direction of the leaf vein [20,21,22]. The lower epidermis of the mottled leaves remains green. The expression of the leaf mottle is regulated by the M gene, the expression of which can be affected in many ways. Firstly, the M gene is regulated by the modified gene, which can affect the expression of M in terms of both time and degree. In addition, environmental factors and expression positions play an important role in the expression of the M gene. The time at which M is first expressed during plant development can also impact the expression levels of the M gene [23,24,25]. Furthermore, the M gene can cause air space between the palisade parenchyma and the upper epidermal cells, which causes changes in light refraction, making the leaves appear silver. Light reflection from the leaf mottle area has been shown to range from 400 to 700 nm, which is higher than that of the green area of leaves [26]. In addition to hereditary leaf mottle, leaf mottle can also be caused by whitefly, which can be affected by light, temperature, humidity, and insect density. Chloroplasts in palisade cells and the plasma membrane around some vascular cells exhibited slight ultrastructural damage, thereby affecting photosynthesis and the agronomic traits of plants [27,28]. The structures of hereditary leaf mottle and the leaf mottle caused by whitefly are similar, with spaces between the palisade cells and the upper epidermis. However, few studies have investigated the location of mottled leaf in C. pepo. A genetic linkage map of C. pepo was constructed using BC1 and showed that the dominant gene M was located in the linkage group 6 [29]. Through a high-density genetic map of C. pepo using an RIL population, a major QTL related to leaf mottle was located in a 0.29 Mb interval on chromosome 17 that explained 23.3% of the phenotypic variation. Two minor QTLs were also found to be located on chromosome 1 (with a 0.18 Mb interval) and chromosome 13 (with a 1.67 Mb interval); these explained 3.83% and 8.01% of the phenotypic variation, respectively [30].
In this study, we used lines ‘19’ and ‘113’ as materials to observe mottled leaf phenotype, constructed F2 populations for QTL analysis and stability analysis, and analyzed the interaction of mottled leaf QTLs. Our findings indicate that molecular markers closely linked to mottled leaf can be used for molecular marker-assisted selection breeding in zucchini and provide a foundation for the fine mapping of genes and the molecular mechanistic research of mottled leaf.

2. Results

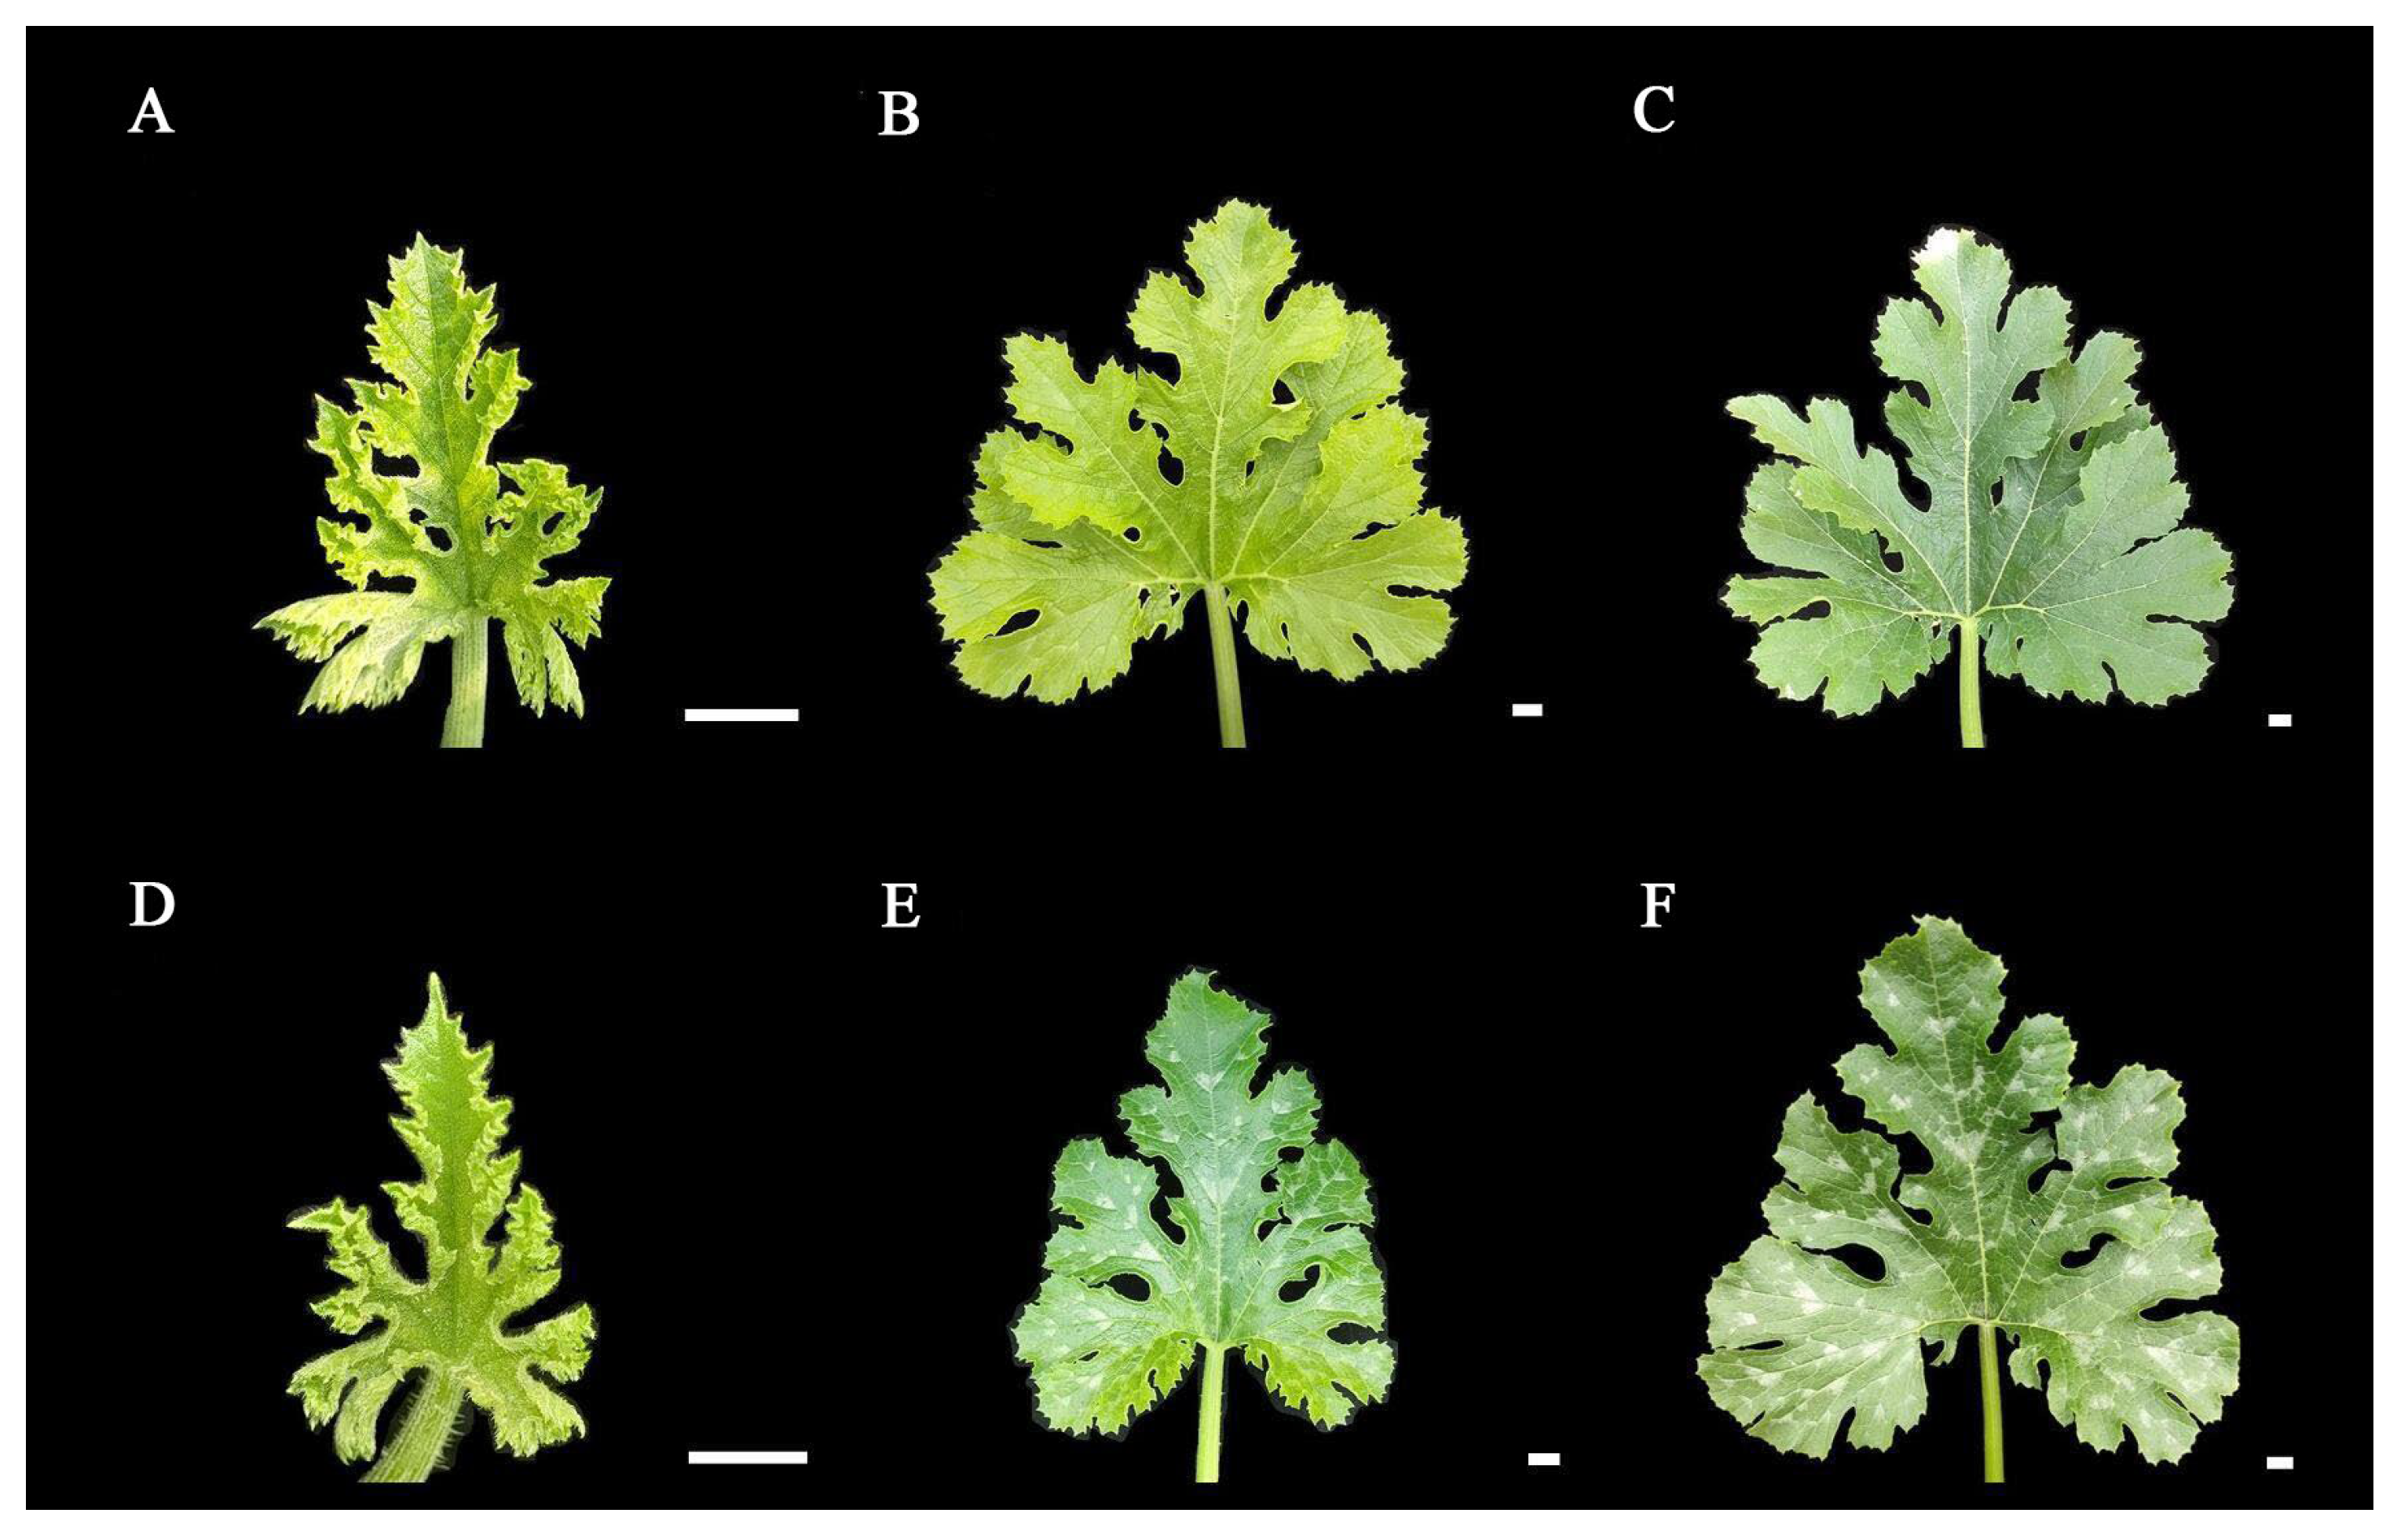
2.1. Observation of the Phenotypes Associated with the Mottled Leaf Trait

We observed the mottled leaf traits of lines ‘19’ and ‘113’ during growth and observed that leaf mottle appeared on the leaves of line ‘19’ during the 8-leaf stage. There was no significant leaf mottle at this stage, although chlorosis began on the first and second leaves under the growing tip. Subsequently, the area of chlorosis gradually turned silver, and leaf mottle was formed until the fifth leaf stage under the growing tip. As the plant grew, the leaf mottle became more prominent. Subsequently, all leaves were covered with leaf mottle. No chlorosis and leaf mottle appeared in line ‘113’ during the growth period. The appearance period of leaf mottle in the F1 generation was similar to that of line ‘19’, although the grade of leaf mottle was lower compared to line ‘19’ (Figure 1). The mottled leaf phenotype was most significant at the 20-leaf stage. Lines ‘19’ and ‘113’, and the F1 generation, were classified as grade 3, grade 0, and grade 2, respectively.

2.2. Determination of the Content of Photosynthetic Pigment in Leaves

In order to investigate the changes in pigment content, we selected the mottled area and green area of parent ‘19’ and the corresponding position of ‘113’ at the 20-leaf-stage to determine pigment content.
The first, second, third, and fifth leaves under the growing tip at the 20-leaf-stage were selected for the determination of pigment content. The color of the first and second leaves of parent ‘19’ was an inconspicuous chlorotic mottle. The pigment content of all the leaves was measured collectively. Leaf mottle was evident on the third and fifth leaves, and the pigment content was measured separately for the green and mottle areas. The content of chlorophyll a in the two parents was always higher than that of chlorophyll b, with a ratio between 4.1 and 5.7. The ratio of carotenoid to total chlorophyll was stable between 0.22 and 0.27. Due to the higher chlorophyll content of the two parents, the leaves were predominantly green. Except for the significantly higher carotenoid content in the green area of line ‘19’ of the third and fifth leaves when compared to the corresponding area of line ‘113’, there was no significant difference in chlorophyll content and carotenoid content between the two lines of plants (Figure 2). There was no significant difference in the levels of chlorophyll a, chlorophyll b, carotenoid, and total chlorophyll in the first, second, third, and fifth leaves of the mottled area in line ‘19’ and the green area in line ‘19’. Moreover, there was no significant difference in the chlorophyll content when comparing the mottle area and the green area in line ‘19’, thereby indicating that the formation of leaf mottle did not affect the synthesis of carotenoid and chlorophyll.

2.3. Analysis of Photosynthetic Parameters in Leaves

Next, we determined the net photosynthetic rate (Pn), transpiration rate (Ti), stomatal conductance (Cs), and intercellular CO2 concentration (Ci) of lines ‘19’ and ‘113’ at the 20-leaf-stage. Analysis showed that there was no significant difference in net photosynthetic rate between the two parents (Figure 3A). Compared with the green area of lines ‘19’ and ‘113’, the Ti, Cs, and Ci of the mottle area in line ‘19’ were all significantly reduced (Figure 3B–D). The formation of leaf mottle, therefore, affects Ti, Cs, and Ci but has no significant impact on Pn.

2.4. Shading Analysis of Leaf

In order to investigate whether light exerts an impact on the formation of leaf mottle, we applied shading treatment to the leaves of line ‘19’. We selected plants with the same extent of growth, covered the first true leaf under the growing tip, and plants with all leaves exposed to natural light acted as controls. Analysis showed that no leaf mottle appeared on the leaves under the 5-days shading treatment. Subsequently, the cover was removed, and all leaves were exposed to natural light. After 10-days, no mottle had appeared on the leaves (Figure 4A–C). The control group maintains a mottled leaf phenotype during these stages (Figure 4D–F). Our findings indicate that light is involved in the formation of leaf mottle, and that receiving light during the early stages of leaf development is a necessary factor for the formation of leaf mottle.

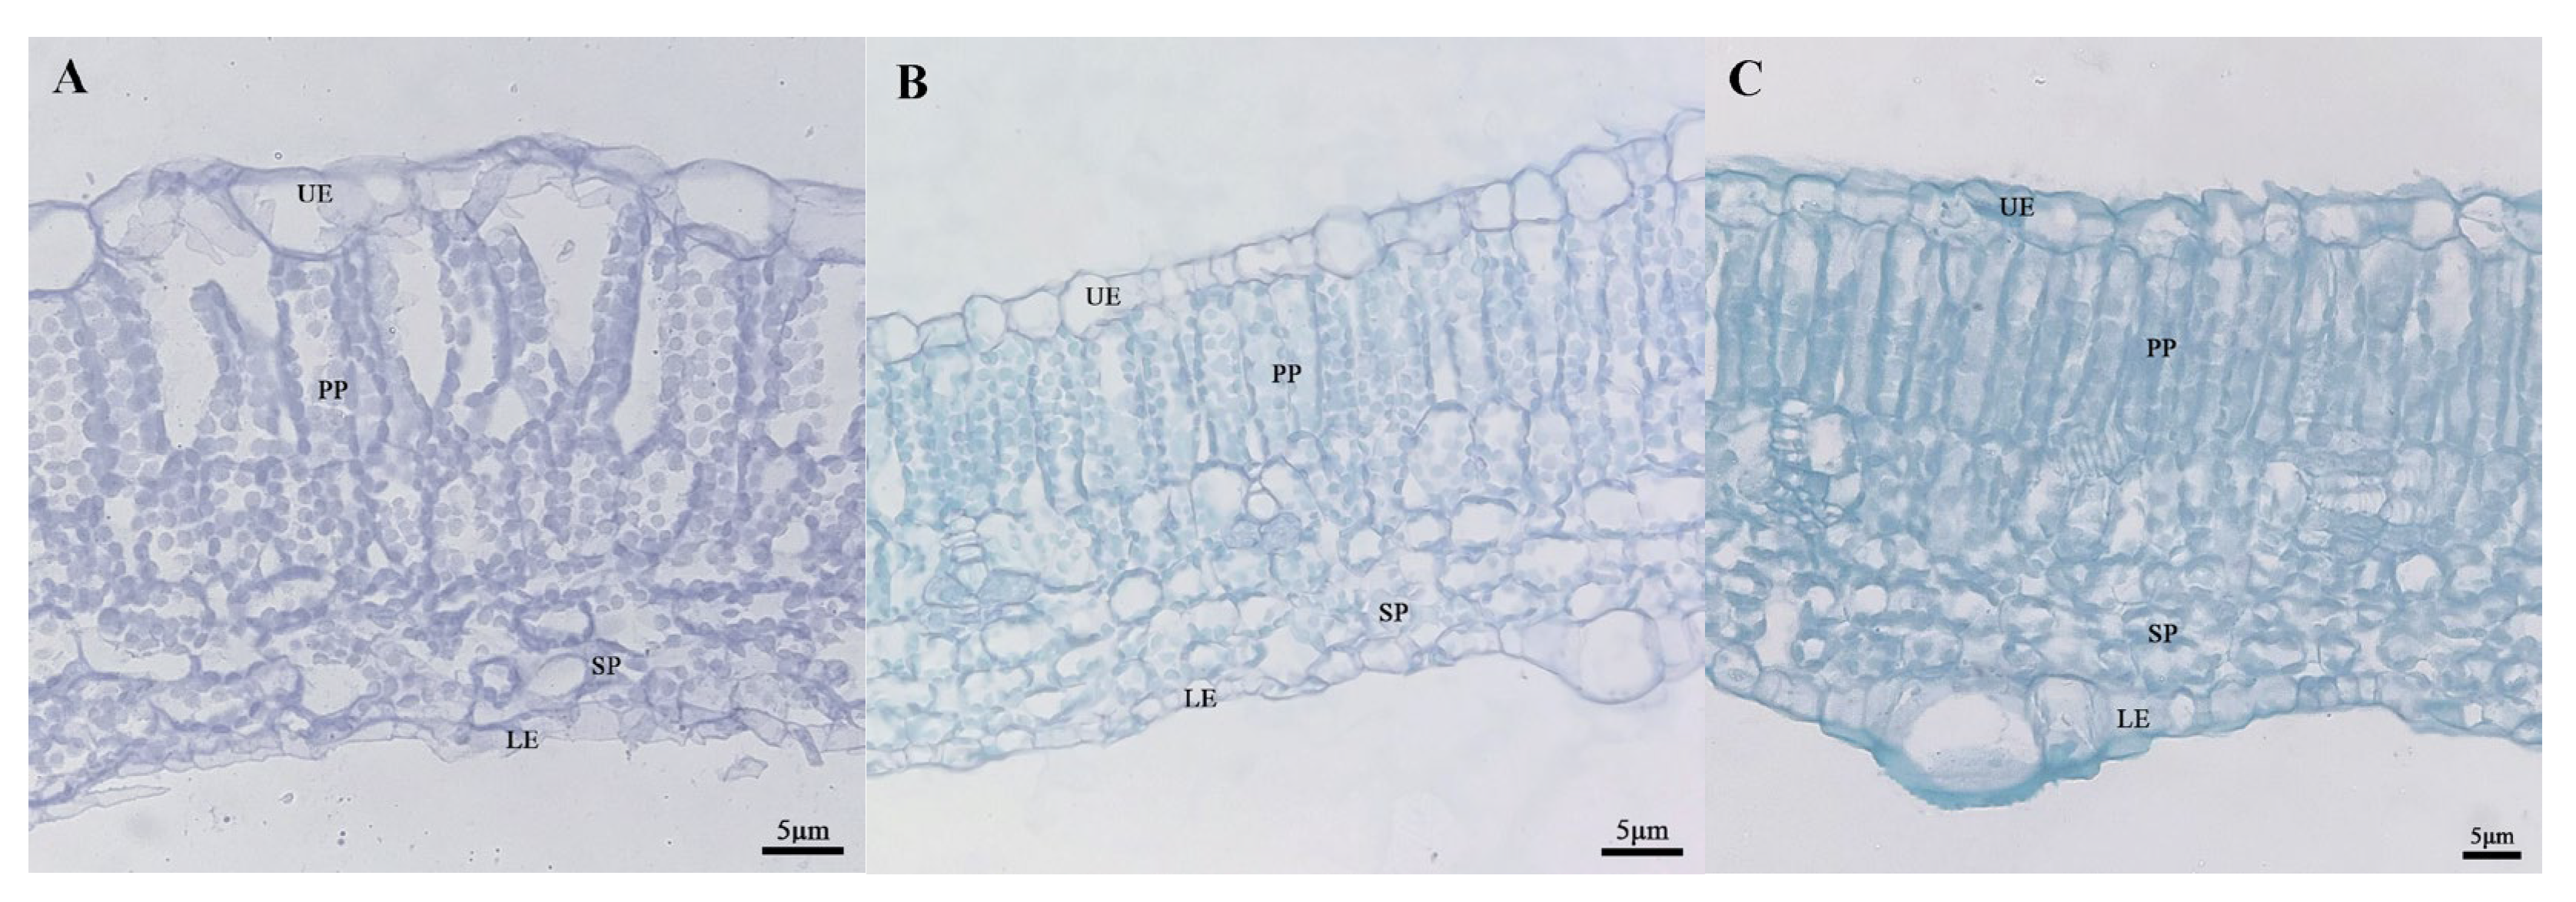
2.5. Analysis of Differences in the Microstructure of Leaves

In order to determine whether there was a structural difference between the mottled area and the green area of leaves, we selected the fifth leaf (a mature and functional leaf) under the growing tip at the 20-leaf-stage for analysis. At this time, leaf mottle had developed obviously on the leaves. The green area and mottle area of line ‘19’ and the corresponding area of line ‘113’ were selected to prepare paraffin-embedded sections. The zucchini leaves were composed of an upper epidermal layer, a palisade parenchyma, a sponge parenchyma, and a lower epidermal layer (Figure 5). In the green area of line ‘19’ and line ‘113’, the palisade parenchyma was closely arranged (Figure 5B,C), while the palisade parenchyma in the mottled area of leaves from line ‘19’ was loosely arranged and contained large air space between cells. The sponge parenchyma in the green area of the leaves from line ‘19’ and line ‘113’ was tighter than in the mottled area on leaves from line ‘19’ (Figure 5). Next, we measured the leaf thickness and the cell thickness of each layer of the two parents. Analysis showed that the thickness of cells in the upper epidermis cells and the sponge parenchyma in line ‘19’ exhibited significant differences when compared between the mottle area and green area (Table 1).

2.6. Genetic Analysis of Mottled Leaf Trait

F1 populations derived by crossing lines ‘19’ and ‘113’ showed significant leaf mottle on their leaves (grade 2) (Figure 1). An F2 generation was constructed by F1 self-crossing. The leaf mottle grades of the F2 population planted in different environments were divided into three grades (grade 0, grade 2, and grade 3) for 2019A and four grades (grade 0, grade 1, grade 2, and grade 3) for 2020A and 2020M. It was found that the absolute values of skewness and kurtosis of mottled leaf traits in the F2 population under different environments were <1 (Table S1), and the population phenotypic distribution conformed to a typical normal distribution (Figure 6). Therefore, the mottled leaf trait was a quantitative trait.

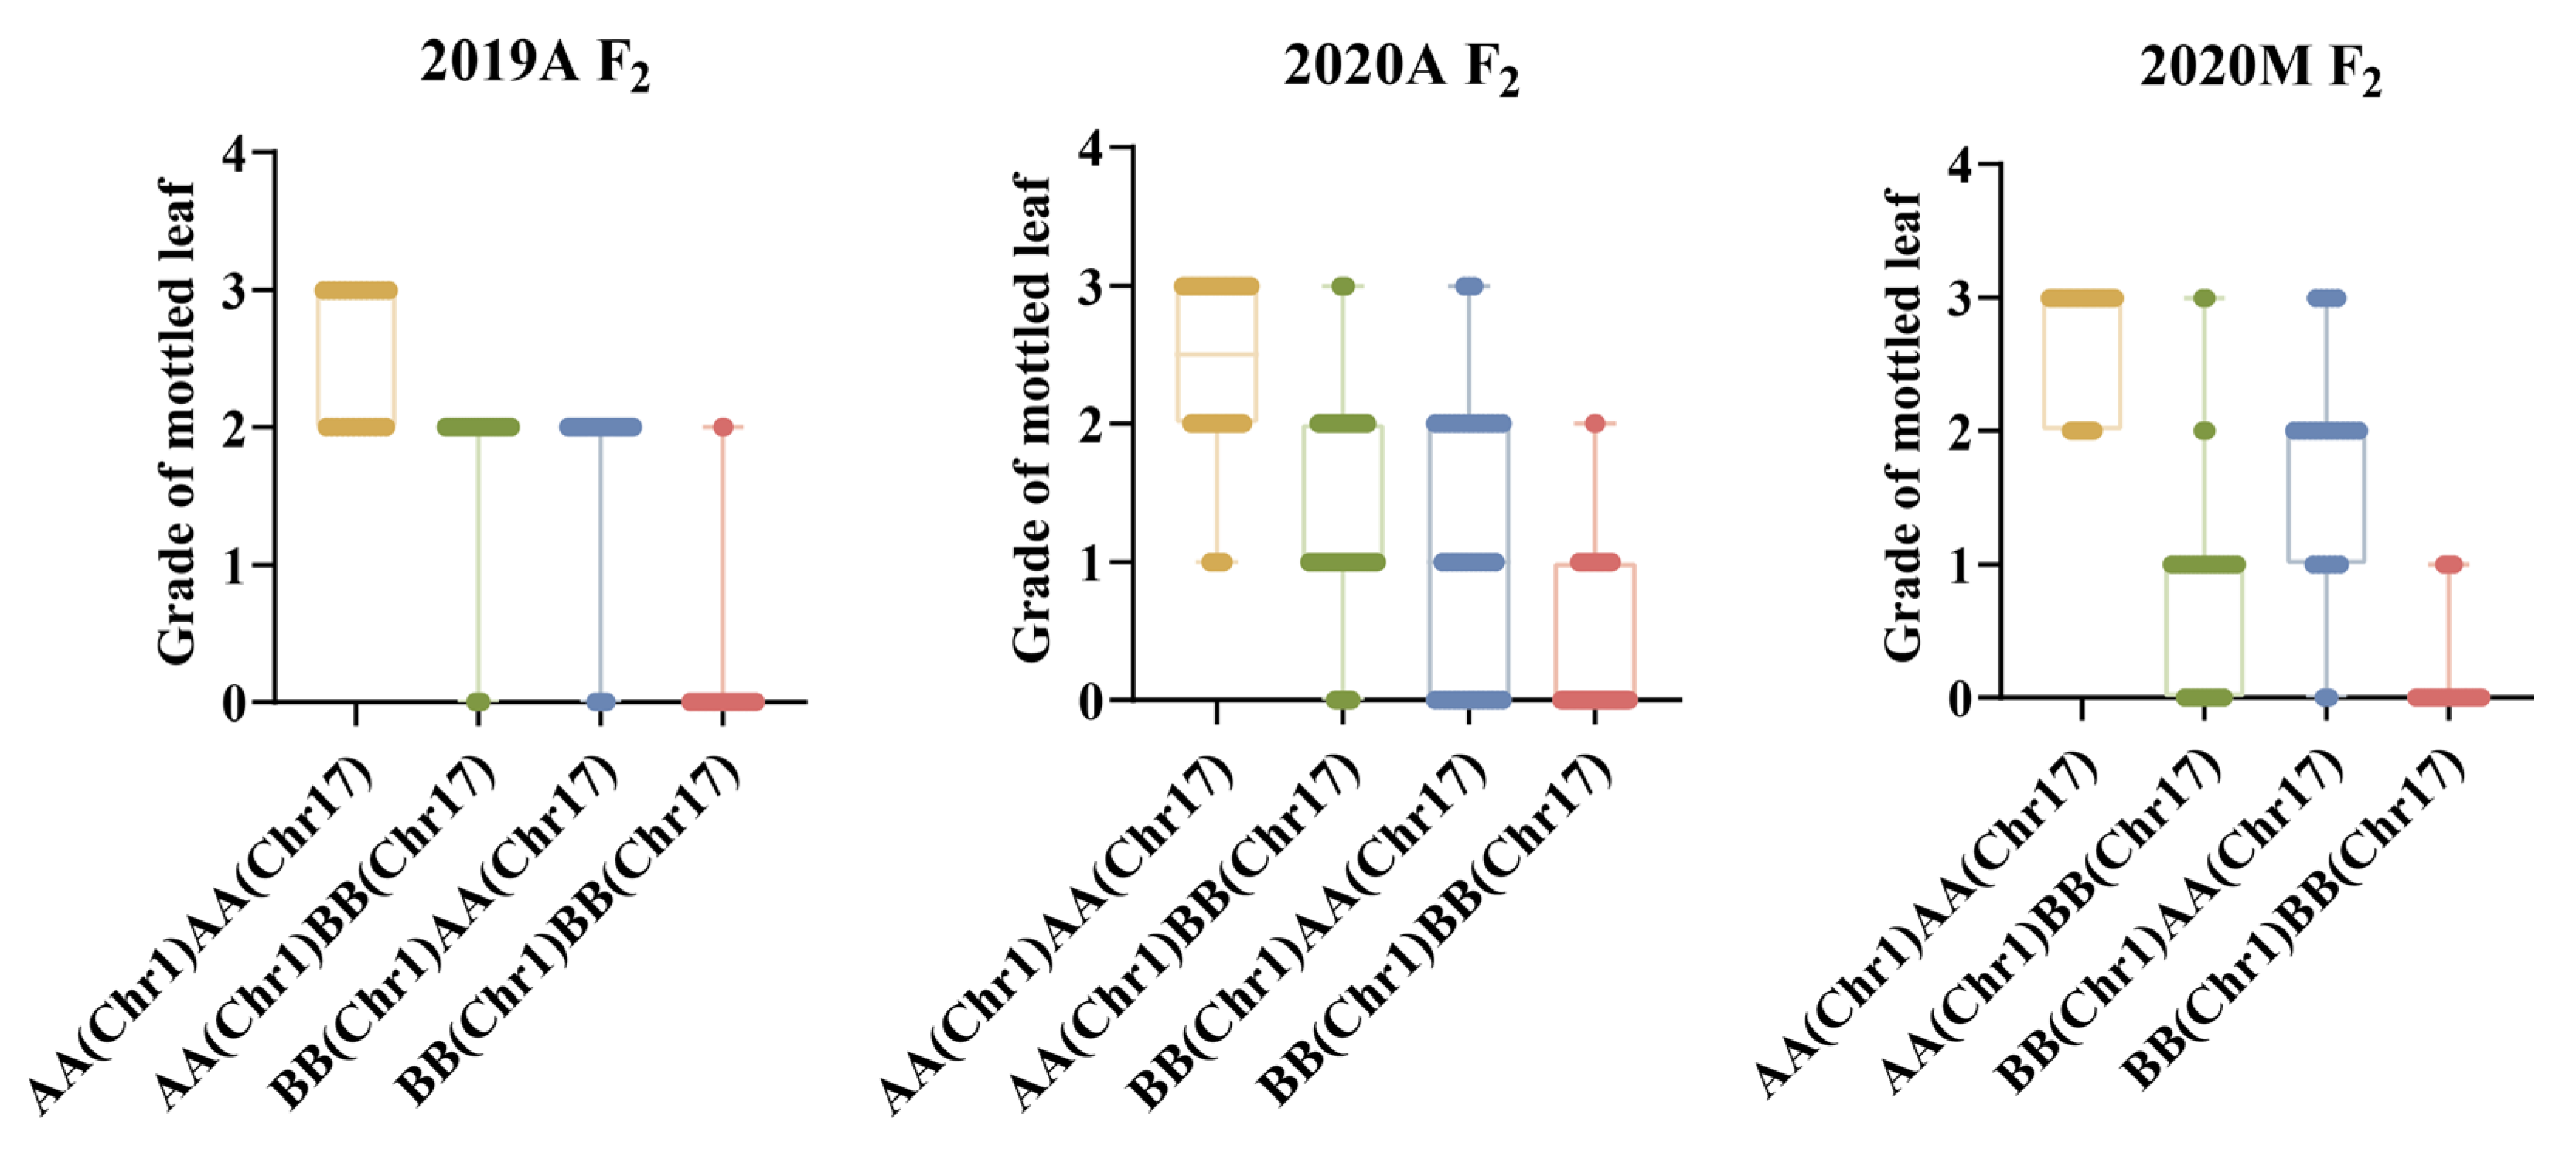
2.7. QTL Analysis of the Mottled Leaf Trait

In total, 49,104,069 clean reads and 49,745,164 clean reads were obtained from the M-pool (28× read depth with 97.21%) and the N-pool (28× read depth with 97.22%) using QTL-seq. Q30 values reached 88.18% and 87.99%, respectively. These results indicated that the sequencing results were reliable for gene mapping. A total of 979,650 SNPs and 324,752 InDels were identified on all 20 chromosomes. SNPs/InDels with multiple genotypes, a read depth <4 in both pools, or consistent genotypes in both pools were removed, thus leaving 617,314 high-quality SNPs, and then 191,073 high-quality InDels were obtained. Next, the ED algorithm was employed to identify significantly different InDels between the M-pool and N-pool based on sequencing data to predict candidate regions of the mottled leaf. A 1.26-Mb region and a 4.30-Mb region were identified on chromosomes 1 and 17, respectively (Figure 7A). The ED algorithm was also employed to identify significantly differential SNPs between the M-pool and N-pool based on sequencing data to predict candidate regions of the mottled leaf. A 1.35-Mb region and a 4.35-Mb region were identified on chromosomes 1 and 17, respectively (Figure 7B). The Δ(InDel-index) and Δ(SNP-index) were calculated and plotted by comparing the results of the InDel-index and SNP-index of the M-pool and N-pool in the genomic positions. The threshold of the Δ(InDel-index) value was 0.45; only one region was found on chromosome 17 (total length 2.10 Mb) (Figure 7C). The threshold of the Δ(SNP-index) value was 0.44, and two regions were found on chromosome 1 (total length 0.06 Mb) and chromosome 17 (total length: 2.03 Mb), respectively (Figure 7D). Combining the results of these analyses, the candidate regions associated with the mottled leaf trait were positioned within the 19.71–20.97 Mb intervals on chromosome 1 and between the 3.83–6.14 Mb intervals on chromosome 17. Therefore, we named these loci as CpML1.1 and CpML17.1, respectively.
Based on the InDels in the candidate region between parental genomes, 25 polymorphic markers were developed on chromosomes 1 and 17 (Table S2). To test the stability of the QTLs CpML1.1 and CpML17.1, we analyzed 580 F2 plants in 2019A, 580 F2 plants in 2020A, and 480 F2 plants in 2020M. R/qtl analysis showed that a total of two QTLs associated with the mottled leaf trait were detected on chromosomes 1 and 17 (Figure 8). In 2019A, 2020A, and 2020M, CpML1.1 was located between markers Chr01_18713051 and Chr01_19638223, Chr01_18590758 and Chr01_19419173, Chr01_18713051 and Chr01_19638223, respectively, with LOD scores of 43.79, 31.18, and 14.02. These scores explained 24.15%, 23.82%, and 10.51% of the phenotypic variation. With regards to the intersection of associated regions from QTL mapping, we used the CIM method in the three environments and QTL-seq analysis and determined that CpML1.1 was located in a 925.2-kb region between markers Chr01_18713051 and Chr01_19638223. CpML17.1 was located between markers Chr17_5225091 and Chr17_5944838, Chr17_5225091 and Chr17_5944838, Chr17_5225091 and Chr17_5944838, respectively, with LOD scores of 38.70, 20.65 and 52.99, thereby explaining 20.80%, 16.25%, and 38.68% of phenotypic variation. Combining the mapping results of different populations, CpML17.1 was located in the 719.7-kb region between markers Chr17_5225091 and Chr17_5944838 (Table 2).

2.8. QTL Interaction Analysis of Mottled Leaf Trait

Both CpML1.1 and CpML17.1 exhibited a positive additive effect on mottled leaf traits. In order to study the interaction effect of CpML17.1 and CpML1.1, we analyzed the genotype and phenotype of the two loci (Figure 9). When both loci carry homozygous ‘A’ (from mottled leaf material from line ‘19’), the grade of mottled leaf was the highest, and when both loci carried the homozygous ‘B’ (from no-mottled-leaf material from line ‘113’), the grade of mottled leaf was the lowest. Under different environmental conditions, in CpML1.1 BB plants (the CpML1.1 locus genotype was BB), the mottled leaf grade was CpML1.1 AA > CpML1.1 AB > CpML1.1 BB. In CpML17.1 BB plants (the CpML17.1 locus genotype was BB), the mottled leaf grade was CpML17.1 AA > CpML17.1 AB > CpML17.1 BB. These results showed that CpML1.1 and CpML17.1 exerted cumulative effects on mottled leaf traits.

2.9. Candidate Gene Analysis of Major QTLs

According to the Cucurbit Genomics Database and SoftBerry, a total of 105 putative genes were identified in the CpML1.1 region (925.2 kb) and 41 putative genes in the CpML17.1 region (719.7 kb). Of these, 12 genes in the CpML1.1 region and 15 genes in the CpML17.1 region had non-synonymous changes in the CDS region and InDels/SNPs in the promoter element when comparing lines ‘19’ and ‘113’ (Tables S3 and S4). In addition, we found that changes in the arrangement of palisade cells were the main reason underlying the mottled leaves. Therefore, candidate genes may be involved in the development of palisade cells. In addition, previous research reported that E3 ubiquitin ligase also participates in the formation of air-space type leaf color mutants [31]. Therefore, we first selected genes related to cell development and encoding E3 ubiquitin ligase for further validation. Cp4.1LG17g08140 encodes an E3 ubiquitin ligase, while Cp4.1LG17g08260 encodes a TBL protein that has been reported to participate in the growth and development of cell walls. Cp4.1LG17g08300 encodes a beta-glucosidase, which represents one of the important components of cellulase that is mainly involved in cell wall degradation. Cp4.1LG01g23790 encodes a TPX2 family protein (target protein of Xklp2), which is a microtubule-associated protein. The functions of these three genes are all related to cellular development processes. We compared the protein sequence differences of these four genes in the parents, and all four genes have non-synonymous mutations (Figures S1–S4).
We selected parental and F2 leaves for qRT-PCR. The expression levels of Cp4.1LG17g08260 in the first and second leaves of line ‘19’ were significantly lower than those of line ‘113’. An opposite trend of expression was observed for Cp4.1LG17g08260 in the fifth and seventh leaves. In the F2 population, the expression levels of the Cp4.1LG17g08260 only showed a significant difference in the leaf mottle area and green area during the first leaf period (Figure 10A,E). During the first to fifth leaf period, Cp4.1LG17g08300 was only expressed at a low expression level in the leaf mottle area of line ‘19’ and was significantly lower than in line ‘113’. However, during the seventh leaf period, the expression level of Cp4.1LG17g08300 suddenly increased in the leaf mottle area of line ‘19’, significantly higher than the level detected in line ‘113’. In the F2 population, the expression level of Cp4.1LG17g08300 in the leaf mottle area showed a gradually decreasing trend, and the expression level in the leaf mottle area was higher than that in the green area during the first and fifth leaf periods (Figure 10B,F). The expression level of Cp4.1LG17g08140 was lower than line ‘113’ in the second and third leaves of line ‘19’ and significantly higher than line ‘113’ in the other periods. The trend in expression levels of Cp4.1LG17g08140 in the F2 population was opposite to the parents in the third leaves (Figure 10C,G). The expression level of Cp4.1LG01g23790 was significantly higher than line ‘113’ in the first and second leaf periods of line ‘19’ but significantly lower than line ‘113’ in the third, fifth, and seventh leaf periods. In the F2 population, Cp4.1LG01g23790 was expressed at higher levels in the leaf mottle area during the first leaf period and at lower levels during the third and fifth leaf periods (Figure 10D,H).
Thus, our analysis revealed that the expression trends for Cp4.1LG17g08260, Cp4.1LG17g08300, and Cp4.1LG17g08140 between the leaf mottle area and green area in the F2 population were opposite to those of their parents. The expression trend for Cp4.1LG01g23790 followed the same trend as their parents. Therefore, we speculated that Cp4.1LG01g23790 is a possible candidate gene that plays a key role in the formation of mottled leaves.

3. Discussion

Various factors are responsible for leaf color variation and can be divided into the pigment type and non-pigmented type. Most leaf color mutations are mainly caused by changes in chlorophyll, carotenoid, and anthocyanin content. In the present study, we found that silver mottle appeared on zucchini leaves. To determine whether the appearance of the mottled leaf is related to chlorophyll and carotenoids, we measured the content of the photosynthetic pigment in the leaves of zucchini. The chlorophyll contents of the lines ‘19’ and ‘113’ were not significantly different. The differences in photosynthetic rate between these three areas were not significant. Therefore, the formation of leaf mottle in ‘19’ does not affect chlorophyll content or chloroplast development. This indicates that mottled leaf may not affect yield. In addition, we constructed nearly isogenic lines (NILs) for the two QTL loci CpML1.1 and CpML17.1 identified in the article, using line ‘113’ as the recurrent parent—both NIL-ML1.1 and NIL-ML17.1 exhibit mottled leaf phenotype. We simultaneously planted NIL-ML1.1, NIL-ML17.1, and recurrent parent ‘113’ for unified field management. Compared with ‘113’, the number of fruits and single fruit weight of NIL-ML1.1 and NIL-ML17.1 did not significantly decrease. This result further confirms this speculation.
The morphology analysis of mottled leaves and green leaves showed that the palisade tissue was closely arranged in the green area of line ‘19’ and ‘113’, but was loosely arranged and featured air space between cells in the mottled area of leaves from line ‘19’. Therefore, the air space between the palisade tissue in the leaf mottle area of line ‘19’ may be the main reason for the mottled leaf phenotype. Our findings are similar to those of Scarchuk, who previously reported the presence of air space between the palisade cells from the leaf mottle area and that these cells were not tightly associated with epidermal cells. These air spaces were found to be responsible for the silver leaf mottle phenotype [32]. A similar phenomenon has also been reported in ornamental plants. Air spaces between the cells were reported to cause leaf variegation, confirmed in Erythronium dens-canis L. and Egonia rexPutz [33,34]. In the present study, we found that the formation of mottled leaf requires the participation of light. However, the growth of leaf mottle varied between parental materials grown in different environments. Therefore, the formation of mottled leaf may be related to factors such as light quality, light intensity, and light duration. In Cucurbitaceae crops, the formation of mottled leaves in cucumber is also light-dependent and is most sensitive to ultraviolet light in sunlight [35]. In the future, we plan to investigate the effects of different light qualities on the formation of mottled leaf in zucchini to explore the most suitable light environment for the growth of mottled leaf in zucchini.
QTL-seq and the detection of molecular markers reveal that the silver leaf gene was located at an interval of 287.15 kb on chromosome 4 in Cucurbita moschata. The segregation ratio of green leaf to silver leaf was 3:1, showing that the silver leaf trait was inherited in a completely recessive manner. The gene CmoCh04G023390 gene was located in the candidate interval of chromosome 4 in C. moschata and can be mapped to chromosome 1 in zucchini at the physical position of 16561706 bp to 16565740 bp. A major QTL for Cucurbita pepo L. silver leaf Sl12_1 was detected on chromosome 17 at a physical position of 1.72 Mb-2.01 Mb. Two minor QTLs for silver leaf Sl1_1 and Sl16_1 were detected on chromosome 1 and chromosome 13 at the physical locations of 0.54 Mb-0.72 Mb and 0.1 Mb-1.77 Mb, respectively [30]. In our present research, we found that the mottled leaf trait was a quantitative trait. Two major QTLs were detected using composite interval mapping. CpML1.1 was located on chromosome 1 at a physical position of 18.7 Mb-19.6 Mb. CpML17.1 was located on chromosome 17 at a physical position of 5.22 Mb-5.94 Mb. Compared with previous results, Sl1_1 and CpML1.1 were both located on chromosome 1, while Sl12_1 and CpML17.1 were both located on chromosome 17. However, the physical positions of the two QTLs identified in this study were located far from Sl1_1 and Sl12_1. Therefore, we hypothesize that CpML1.1 and CpML17.1 may represent two new QTLs that control mottled leaf.
To verify the accuracy of the QTL-seq results, we developed InDel molecular markers in the candidate regions to test the stability of the loci and narrow the location intervals. We found that the inheritance of CpML1.1 and CpML17.1 were stable in different environments. In different environments, when both loci carry a homozygous ‘A’, the mottled leaf is classified as grade 2–3. When both loci carry a homozygous ‘B’, the grade of the mottled leaf was 0–1 grade. When one of the two loci was homozygous for ‘A’, the phenotype of the mottled leaf was grade 1–3, which indicates that the two loci have an additive effect on the formation of leaf mottle. The more homozygote ‘A’ carried, the higher the grade of the mottled leaf. In 2019A, the CpML1.1 and CpML17.1 explained 24.15% and 20.80% of the phenotypic variation, respectively. When CpML1.1 and CpML17.1 carry different homozygosity, the mottled leaf grade was concentrated in grade 2, and the influence between the two loci is not significant. In 2020A, when CpML1.1 and CpML17.1 exhibited different homozygosity, the highest grade of mottled leaf was grade 2. However, when CpML1.1 was homozygous for ‘B’, and CpML17.1 was homozygous for ‘A’, there were more plants that were grade 0. The phenotypic variation of CpML1.1 was also higher than that of CpML17.1. Therefore, the effect of CpML1.1 was slightly stronger than that of CpML17.1. In 2020M, when CpML1.1 was homozygous for ‘A’ and CpML17.1 was homozygous for ‘B’, the mottled leaf grade was mainly concentrated in grades 0–1. When CpML1.1 was homozygous for ‘B’, and CpML17.1 was homozygous for ‘A’, the mottled leaf grades were mainly concentrated in grades 1–2. In this environment, the LOD score for CpML17.1 was as high as 52.99, explaining the phenotypic variation of 38.68%. CpML1.1 explained 10.51% of the phenotypic variation. This phenomenon indicates that CpML17.1 plays a stronger role than CpML1.1 (Figure 11). Thus, the strength of CpML1.1 and CpML17.1 will be affected in different environments, but both loci will exert their effectiveness. Due to the limitations of F2 population mapping, it is impossible to locate a single QTL precisely. Many quantitative traits are currently mapped by applying the NIL method. In order to investigate the relationship between CpML1.1 and CpML17.1 further, it was necessary to construct NILs for the two QTLs, respectively. These two NILs can be used for fine mapping and provide a foundation for gene cloning.
Cell division is crucial for plant growth and development, and microtubules are essential for eukaryotic cell division, expansion, and differentiation [36,37]. Plants have unique microtubule arrays that control the direction of cell division and expansion, mainly regulated by microtubule-associated proteins (MAPs). There are various conserved microtubule-related proteins in eukaryotes, such as augmin, TPX2, CLASP and EB1. By applying gene annotation, gene sequence alignment, and qRT-PCR analysis, we identified a Cp4.1LG01g23790 gene, which encodes a TPX2 family protein (target protein of Xklp2). TPX2 (target protein Xklp2) is an evolutionarily conserved microtubule-associated protein and a key factor for mitotic spindle assembly factor. To date, all plant TPX2-family proteins have been shown to bind to microtubules and function in distinct processes such as cell division and the regulation of hypocotyl cell elongation by hormones and light signals [38,39]. Thus far, several TPX2 family proteins have been reported, including TPX2, WAVE DAMPENED 2 (WVD2), WAVE DAMPENED 2 LIKE (WDL) 1, 2, and 3 and MAP20. In Arabidopsis, WAVE-DAMPENED2-LIKE5 (WDL5) is a microtubule-stabilizing protein that plays a positive role in ethylene-regulated hypocotyl cell extension [40]. The overexpression of EgMAP20 and EgWDL3L in Arabidopsis leads to changes in cell morphology and results in organ-twisting phenotypes [41]. However, there have been no reports on how TPX2 could influence the arrangement of leaf cells. It has been reported that the microtubule protein CLASP can influence the arrangement of leaf cells. In Arabidopsis, the clasp-1 mutant exhibits defects in cell-directed amplification [42]. The lack of microtubule-related protein CLSAP leads to changes in cell division patterns, resulting in significant distortions in the topological relationships between cells and intercellular spaces and changes in their relative abundance [43]. In the present study, we detected a difference in the expression of TPX2 between the mottled area and green area; this may influence cell division and lead to mottled leaf.

4. Materials and Methods

4.1. Plant Material

The two C. pepo inbred lines ‘19’ and ‘113’ were originally developed by the Laboratory of Pumpkin Molecular Genetic Breeding, Northeast Agricultural University, Harbin, China. Inbred line ‘19’ showed significant silver mottle on leaves; there was no leaf mottle on inbred line ‘113’. The F1 and F2 populations derived by crossing ‘19’ and ‘113’ were constructed to analyze the inheritance and QTL analysis for mottled leaves. 40 ‘19’, 40 ‘113’, 40 F1, and 580 F2 were planted in a greenhouse in April 2019 (2019A). 40 ‘19’, 40 ‘113’, 40 F1, and 580 F2 were planted in a greenhouse in April 2020 (2020A). 40 ‘19’, 40 ‘113’, 40 F1, and 480 F2 were planted under open cultivation in May 2020 (2020M). All plants were grown at the Xiangyang Base of Northeast Agricultural University, Harbin, China (N45°77′, E126°92′).

4.2. Determination of Photosynthetic Pigments

The first, second, third, and fifth leaves from the growing tip were selected as the material during the 20-leaf-stage. The mottle area and green area of ‘19’ and the green leaves in the same area for ‘113’ were collected. The pigment in the leaves was extracted using 80% acetone. The absorbance of the extract was measured at 663, 645, and 470 nm using a microplate reader. The control was 80% acetone. Three biological repeats were determined for each material, and technical repeats were performed three times in each biological repeat. The formula for calculating pigment content is as follows:
Cchla (mg/g) = 12.21 × A663 − 2.81 × A645
Cchlb (mg/g) = 20.13 × A645 − 5.03 × A663
Ccaro (mg/g) = (1000 × A470 − 3.27 × Ca – 104 × Cb)/229
Total Chl = Cchla + Cchlb

4.3. Determination of Photosynthetic Parameters

The fifth true leaf from the growing tip of the 20-leaf-stage was selected to measure the photosynthetic parameters. The mottle area and green area of ‘19’ and the green leaves in the same area for ‘113’ were collected. Net photosynthetic rates (Pn; µmol CO2 m−2s−1), stomatal conductance (Gs; mol H2O m−2s−1), intercellular carbon dioxide concentrations (Ci; µmol CO2 mol−1), and transpiration rates (Ts; mmol H2O m−2s−1) were measured, using CI-340. Three biological repeats were determined for each material, and technical repeats were performed three times in each biological repeat.

4.4. Leaf Anatomy Assay

At the stage of twenty leaves, the fifth leaf under the growing tip is used for leaf structure analysis. The mottle area and green area of ‘19’ and the green leaves in the same area for ‘113’ were collected. Prepare FAA and different concentrations of alcohol to fix and dehydrate the leaves and dye them with safranin-fast green. After taking photos, use ImageJ to measure the thickness of the upper epidermis, palisade parenchyma, sponge parenchyma, and lower epidermis of leaves.
CTR = (thickness of palisade parenchyma/leaf thickness) × 100%
SR = (thickness of sponge parenchyma /leaf thickness) × 100%

4.5. Inheritance Analysis of the Mottled Leaf Trait

F2 population of ‘19’ and ‘113’ was constructed for inheritance analysis of the mottled leaves. We conducted a survey on mottled leaf grade during the 20-leaf-stage. According to the percentage of mottled area to total leaf area, the grade of mottled leaf was divided into three grades in 2019 and four grades in 2020. The grade 0 plant showed no leaf mottle. The leaf mottle area of grades 1 to 3 accounts for 20%, 50%, and 80% of the total leaf area, respectively (Figure 12).

4.6. Pool Construction and QTL-seq Analysis

Genomic DNA was extracted from ‘19’, ‘113’, F1, and F2 using the modified cetyltrimethylammonium bromide (CTAB) method. The mottled leaf pool (M-Pool) and no-mottled-leaf pool (N-Pool) were constructed by mixing equal amounts of DNA from 30 extremely mottled leaf plants (grade 3) and 30 extremely without mottled leaf plants (grade 0) from the 2019A F2 population. The parental DNA pools were constructed by mixing equal amounts of DNA from the 30 ‘19’ and 30 ‘113’ plants. DNA libraries were sequenced on the Illumina Hiseq 2000 platform in BioMaker (Peking, China). In order to ensure the quality of information analysis, the Raw reads were filtered to obtain clean reads. The clean reads of all samples were compared with the reference genome of zucchini (http://cucurbitgenomics.org/organism/14, accessed on 2 July 2019) using the BWA software (https://bio-bwa.sourceforge.net/bwa.shtml, accessed on 2 July 2019) for subsequent variance analysis [44,45]. The SNPs and InDels were detected and filtered using GATK. The SNP/InDel index of the Euclidean distance (ED) and Δ(SNP/InDel-index) were calculated for all positions to determine the region associated with the mottled leaf.

4.7. QTL Analysis with Molecular Markers

Polymorphic InDel markers were developed in the candidate regions of mottled leaf based on the parent resequencing. InDel markers were designed with Primer Premier 5.0 (Table S2). PCR was carried out using 10 μL samples containing ~40 ng of genomic DNA, each primer at 0.5 μM, 200 μM dNTPs, 1× reaction buffer, and 0.5 U of Taq DNA polymerase (Aidlab Biotechnologies, Beijing, China). PCR amplification was performed using the following program: 94 °C for 5 min; 35 cycles of 94 °C for 30 s, 56 °C for 30 s, and 72 °C for 30 s; and 72 °C for 5 min [46,47]. The primers used in this study were synthesized using the BGI gene. Products were separated on an 8% polyacrylamide gel by electrophoresis. After electrophoresis at 220 V for 2 h, the gel was stained with 0.3% AgNO3 solution, and the silver-stained DNA bands were revealed.

4.8. Data Analysis

A, B, and H are homozygous ‘19’, homozygous ‘113’, and heterozygous F1 genotypes, respectively. We used JoinMap 4.0 to perform genetic mapping of F2 individuals using InDel markers on target chromosomes and obtained genetic distances. In R/qtl software (http://www.rqtl.org/), composite interval mapping (CIM) was used to test the significance of QTL [48,49]. The significance of each QTL was tested using LOD thresholds (p < 0.05), which were determined using 1000 permutations. For each detected QTL, a 2-LOD-support interval was calculated and defined by left and right markers. The QTLs were named according to chromosome locations and different environments.

4.9. Prediction of Candidate Genes and qRT-PCR

The gene ID, function, and structure data were obtained from the gourd genome database [44]. SoftBerry online software (http://linux1.softberry.com/, accessed on 22 November 2022) was used for gene structure prediction based on two family plants (Arabidopsis). The first, second, third, fifth, and seventh leaves under the growing tip at the 20-leaf stage of parents material and the first, third, and fifth leaves under the growing tip at the 20-leaf stage in the F2 population were selected to determine the expression of candidate genes. Total RNA was extracted using TRIzol reagent (Invitrogen, Carlsbad, CA, USA). Three pairs of primers for candidate genes were designed in total. Taq SYBR Green qPCR Premix (Yugong Biolabs, Inc., Jiangsu, China) was applied to perform qRT-PCR. The program used in this assay was as follows: 96 °C for 1 min; 30 cycles of 95 °C for 15 s, 56 °C for 15 s, and 72 °C for 45 s [50,51]. The Actin gene was used as the internal reference. Three technical replicates were set for each sample, and relative expression levels were quantified using the 2−ΔΔCT method.

5. Conclusions

In summary, our findings indicate that the formation of mottled leaves did not affect the pigment content or photosynthesis in zucchini leaves. The large air space between cells in the palisade parenchyma was identified as the main factor underlying the formation of mottled leaf. During the early stages of leaf development, light is an important condition for the appearance of the mottled leaf. Genetic analysis revealed that mottled leaf is an inheritable quantitative trait and is controlled by multiple genes. Based on QTL-seq and the development of InDel markers, two major QTLs, CpML1.1 and CpML17.1, were detected in different environments. They were located in a 925.2-kb interval on chromosome 1 and a 719.7-kb interval on chromosome 17, respectively. By performing gene annotation, gene sequence alignment, and qRT-PCR analysis, we found that the Cp4.1LG01g23790 gene may be a candidate gene for mottled leaf in zucchini. Our results provide a suitable foundation for the fine mapping and mechanistic research of mottled leaf traits.

Supplementary Materials

The supporting information can be downloaded at: https://www.mdpi.com/article/10.3390/ijms25052491/s1.

Author Contributions

K.W. performed the data analysis and prepared the manuscript. X.W. and L.Z. contributed to collecting phenotypic characteristics and DNA extraction. Y.C. contributed to growing plants. Y.L. contributed to RNA extraction and qRT-PCR test. W.X., Y.W., and S.Q., the corresponding authors, oversaw all project implementation and manuscript development activities. All authors have read and agreed to the published version of the manuscript.

Funding

This work was supported by grants from the National Natural Science Foundation of China (32272723 and 32072590).

Institutional Review Board Statement

Not applicable.

Informed Consent Statement

Not applicable.

Data Availability Statement

The raw datasets of QTL-seq generated during the current study are available in the NCBI repository, BioProject ID: PRJNA826826 (‘19’ and ‘113’) and PRJNA1077909 (M-pool and N-pool).

Conflicts of Interest

The authors declare no conflict of interest.

References

  1. Vairam, N.; Ibrahim, S.-M.; Vanniarajan, C. Frequency and spectrum of chlorophyll mutations in greengram [Vigna radiata (L.) Wilczek]. Asian J. Biol. Sci. 2014, 9, 204–207. [Google Scholar] [CrossRef]
  2. Zhang, J.-H.; Zeng, J.-C.; Wang, X.-M.; Chen, S.-F.; Albach, D.C.; Li, H.-Q. A revised classification of leaf variegation types. Flora 2020, 272, 151703. [Google Scholar] [CrossRef]
  3. Aluru, M.-R.; Bae, H.; Wu, D.; Rodermel, S.-R. The Arabidopsis immutans mutation affects plastid differentiation and the morphogenesis of white and green sectors in variegated plants. Plant Physiol. 2001, 127, 67–77. [Google Scholar] [CrossRef]
  4. Wetzel, C.-M.; Jiang, C.-Z.; Meehan, L.-J.; Voytas, D.F.; Rodermel, S.-R. Nuclear-organelle interactions: The immutans variegation mutant of Arabidopsis is plastid autonomous and impaired in carotenoid biosynthesis. Plant J. 1994, 6, 161–175. [Google Scholar] [CrossRef]
  5. Carol, P.; Stevenson, D.; Bisanz, C.; Breitenbach, J.; Sandmann, G.; Mache, R.; Coupland, G.; Kuntz, M. Mutations in the Arabidopsis gene IMMUTANS cause a variegated phenotype by inactivating a chloroplast terminal oxidase associated with phytoene desaturation. Plant Cell 1999, 11, 57–68. [Google Scholar] [CrossRef] [PubMed]
  6. Næsted, H.; Holm, A.; Jenkins, T.; Nielsen, H.-B.; Harris, C.-A.; Beale, M.-H.; Andersen, M.; Mant, A.; Scheller, H.; Camara, B.; et al. Arabidopsis VARIEGATED 3 encodes a chloroplast-targeted, zinc-finger protein required for chloroplast and palisade cell development. J. Cell Sci. 2004, 117, 4807–4818. [Google Scholar] [CrossRef]
  7. Haswell, E.-S.; Meyerowitz, E.-M. MscS-like proteins control plastid size and shape in Arabidopsis thaliana. Curr. Biol. 2006, 16, 1–11. [Google Scholar] [CrossRef] [PubMed]
  8. Sakamoto, W.; Tamura, T.; Hanba-Tomita, Y.; Murata, M.; Sodmergen. The VAR1 locus of Arabidopsis encodes a chloroplastic FtsH and is responsible for leaf variegation in the mutant alleles. Genes Cells 2002, 7, 769–780. [Google Scholar] [CrossRef]
  9. Chen, M.; Choi, Y.; Voytas, D.-F.; Rodermel, S. Mutations in the Arabidopsis VAR2 locus cause leaf variegation due to the loss of a chloroplast FtsH protease. Plant J. 2000, 22, 303–313. [Google Scholar] [CrossRef]
  10. Bailey, S.; Thompson, E.; Nixon, P.-J.; Horton, P.; Mullineaux, C.-W.; Robinson, C.; Mann, N. A critical role for the Var2 FtsH homologue of Arabidopsis thaliana in the photosystem II repair cycle in vivo. J. Biol. Chem. 2002, 277, 2006–2011. [Google Scholar] [CrossRef] [PubMed]
  11. Liu, X.; Yu, F.; Rodermel, S. Arabidopsis chloroplast FtsH, var2 and suppressors of var2 leaf variegation: A review. J. Integr. Plant Biol. 2010, 52, 750–761. [Google Scholar] [CrossRef] [PubMed]
  12. Liu, Z.-W.; Wang, Z.-Y.; Gu, H.; You, J.; Hu, M.-M.; Zhang, Y.-J.; Zhu, Z.; Wang, Y.-H.; Liu, S.-J.; Chen, L.-M.; et al. Identification and Phenotypic Characterization of ZEBRA LEAF16 Encoding a β-Hydroxyacyl-ACP Dehydratase in Rice. Front. Plant Sci. 2018, 9, 782. [Google Scholar] [CrossRef] [PubMed]
  13. Li, Y.-Q.; Zhong, P.; Gao, Z.-Y.; Zhu, B.-Y.; Chen, D.; Su, C.-H.; Wang, P.-R.; Deng, X.-J. Morphological characterization and candidate gene analysis of zebra leaf mutant zebra524 in rice. Sci. Agric. Sin. 2014, 47, 2907–2915. [Google Scholar]
  14. Qiu, Z.-N.; Chen, D.-D.; He, L.; Zhang, S.; Yang, Z.-N.; Wang, Z.-W.; Ren, D.-Y.; Qian, Q.; Guo, L.-B.; Zhu, L. The rice white green leaf 2 gene causes defects in chloroplast development and affects the plastid ribosomal protein S9. Rice 2018, 11, 39. [Google Scholar] [CrossRef] [PubMed]
  15. Zhang, T.; Feng, P.; Li, Y.-F.; Yu, G.-L.; Sang, X.-C.; Ling, Y.-H.; Zeng, X.-Q.; Li, Y.-D.; Huang, J.-Y. VIRESCENT-ALBINO LEAF 1 regulates leaf colour development and cell division in rice. J. Exp. Bot. 2018, 69, 4791–4804. [Google Scholar] [CrossRef]
  16. Feng, P.; Shi, J.-Q.; Zhang, T.; Zhong, Y.-Q.; Zhang, L.-S.; Yu, G.-L.; Zhang, T.-Q.; Zhu, X.-Y.; Xing, Y.-D.; Yin, W.-Z.; et al. Zebra leaf 15, a receptor-like protein kinase involved in moderate low temperature signaling pathway in rice. Rice 2019, 12, 1–13. [Google Scholar] [CrossRef]
  17. Li, Q.-G.; Du, J.-Y.; Qiao, Z.-H.; Pan, C.; He, W.-Q.; Zhang, L.; Li, X.-H.; Nie, Y.-X.; Li, X.-Z.; Pan, G.-T.; et al. White and green striate leaves 1, predicted to encode a 16S rRNA processing protein, plays a critical role in the processing of chloroplast ribosomes in maize (Zea mays L.). Mol. Breed. 2023, 43, 65. [Google Scholar] [CrossRef]
  18. Hu, L.-L.; Zhang, H.-Q.; Xie, C.; Wang, J.; Zhang, J.-Y.; Wang, H.; Weng, Y.-Q.; Chen, P.; Li, Y.-H. A mutation in CsHD encoding a histidine and aspartic acid domain-containing protein leads to yellow young leaf-1 (yyl-1) in cucumber (Cucumis sativus L.). Plant Sci. 2020, 293, 110407. [Google Scholar] [CrossRef]
  19. Ding, Y.; Yang, W.; Su, C.-G.; Ma, H.-H.; Pan, Y.; Zhang, X.-G.; Li, J.-H. Tandem 13-lipoxygenase genes in a cluster confers yellow-green leaf in cucumber. Int. J. Mol. Sci. 2019, 20, 3102. [Google Scholar] [CrossRef]
  20. Scarchuk, J. Fruit and leaf characters in summer squash: The interrelationship of striped-fruit and mottled-leaf. J. Hered. 1954, 45, 295–297. [Google Scholar] [CrossRef]
  21. Scott, D.-H.; Riner, M.-E. A Mottled-Leaf Character in Winter Squash: Inherited as a Dominant Mendelian Character. J. Hered. 1946, 37, 27–28. [Google Scholar] [CrossRef] [PubMed]
  22. Lopez-Anido, F.; Cointry, E.; Firpo, I.; García, S.-M.; Gattuso, S. Inheritance of gray leaf color in a material derived from a Cucurbita maxima Duch. x C. moschata Duch. hybrid. Rep. Cucurbit Genet. Coop. 2002, 25, 46–48. [Google Scholar]
  23. Ribeiro, A.; da Costa, C.-P. Inheritance of mottled leaf in Cucurbita moschata. Cucurbit Genet. Coop. 1989, 29, 70–71. [Google Scholar]
  24. Shifriss, O. Further notes on the silvery-leaf trait in Cucurbita. Cucurbit Genet Coop. Rep. 1984, 7, 81–83. [Google Scholar]
  25. Shifriss, O. Do Cucurbita plants with silvery leaves escape virus infection? Origin and characteristics of NJ260. Cucurbit Genet. Coop. 1981, 4, 42–43. [Google Scholar]
  26. Shifriss, O. Reflected light spectra from silvery and nonsilvery leaves of Cucurbita pepo. Cucurbit Genet. Coop. 1983, 44, 89–90. [Google Scholar]
  27. Mcauslane, H.-J.; Chen, J.; Carle, R.-B.; Schmalstig, J. Influence of Bemisia argentifolii (Homoptera: Aleyrodidae) infestation and squash silverleaf disorder on zucchini seedling growth. J. Econ. Entomol. 2004, 97, 1096–1105. [Google Scholar] [CrossRef]
  28. Jiménez, D.-R.; Yokomi, R.-K.; Mayer, R.-T.; Shapiro, J.-P. Cytology and physiology of silver leaf whitefly-induced squash silver leaf. Physiol. Mol. Plant Pathol. 1995, 46, 227–242. [Google Scholar] [CrossRef]
  29. Brown, R.-N.; Myers, J.-R. A genetic map of squash (Cucurbita sp.) with randomly amplified polymorphic DNA markers and morphological markers. J. Am. Soc. Hortic. Sci. 2002, 127, 568–575. [Google Scholar] [CrossRef]
  30. Montero-Pau, J.; Blanca, J.; Esteras, C.; Martínez-Pérez, E.-M.; Gómez, P.; Monforte, A.-J.; Cañizares, J.; Picó, B. An SNP-based saturated genetic map and QTL analysis of fruit-related traits in Zucchini using Genotyping-by-sequencing. BMC Genom. 2017, 18, 94. [Google Scholar] [CrossRef]
  31. Li, K.-T.; Zhang, J.; Kang, Y.-H.; Chen, M.-C.; Song, T.-T.; Geng, H.; Tian, J. McMYB10 modulates the expression of a Ubiquitin Ligase, McCOP1 during leaf coloration in crabapple. Front. Plant Sci. 2018, 9, 704. [Google Scholar] [CrossRef] [PubMed]
  32. Scarchuk, J.; Lent, J.-M. The structure of mottled-leaf summer squash. J. Hered. 1965, 56, 167–168. [Google Scholar] [CrossRef]
  33. Zhang, Y.; Hayashi, T.; Hosokawa, M.; Yazawa, S.; Li, Y. Metallic lustre and the optical mechanism generated from the leaf surface of Begonia rex Putz. Sci. Hortic. 2009, 121, 213–217. [Google Scholar] [CrossRef]
  34. La Rocca, N.; Pupillo, P.; Puppi, G.; Rascio, N. Erythronium dens-canis L.(Liliaceae): An unusual case of change of leaf mottling. Plant Physiol. Biochem. 2014, 74, 108–117. [Google Scholar] [CrossRef]
  35. Cao, W.; Du, Y.; Wang, C.; Xu, L.; Wu, T. Cscs encoding chorismate synthase is a candidate gene for leaf variegation mutation in cucumber. Breed. Sci. 2018, 68, 571–581. [Google Scholar] [CrossRef]
  36. Hamada, T. Microtubule organization and microtubule-associated proteins in plant cells. Int. Rev. Cell Mol. Biol. 2014, 312, 1. [Google Scholar]
  37. Hashimoto, T. Microtubules in plants. Arab. Book Am. Soc. Plant Biol. 2015, 13, e0179. [Google Scholar] [CrossRef] [PubMed]
  38. Smertenko, A.; Clare, S.-J.; Effertz, K.; Parish, A.; Ross, A.; Schmidt, S. A guide to plant TPX2-like and WAVE-DAMPENED2-like proteins. J. Exp. Bot. 2021, 72, 1034–1045. [Google Scholar] [CrossRef]
  39. Dvořák Tomaštíková, E.; Rutten, T.; Dvořák, P.; Tugai, A.; Ptosková, K.; Petrovská, B.; van Damme, D.; Houben, A.; Dolezel, J.; Demidov, D. Functional divergence of microtubule-associated TPX2 family members in Arabidopsis thaliana. Int. J. Mol. Sci. 2020, 21, 2183. [Google Scholar] [CrossRef]
  40. Sun, J.; Ma, Q.; Mao, T. Ethylene regulates the Arabidopsis microtubule-associated protein WAVE-DAMPENED2-LIKE5 in etiolated hypocotyl elongation. Plant Physiol. 2015, 169, 325–337. [Google Scholar] [CrossRef]
  41. Du, P.-Z.; Kumar, M.; Yao, Y.; Xie, Q.-L.; Wang, J.-Y.; Zhang, B.-L.; Gan, S.-M.; Wang, Y.-Q.; Wu, A.-M. Genome-wide analysis of the TPX2 family proteins in Eucalyptus grandis. BMC Genom. 2016, 17, 967. [Google Scholar] [CrossRef]
  42. Ambrose, J.-C.; Shoji, T.; Kotzer, A.-M.; Pighin, J.-A.; Wasteneys, G.-O. The Arabidopsis CLASP Gene Encodes a Microtubule-Associated Protein Involved in Cell Expansion and Division. Plant Cell 2007, 19, 2763–2775. [Google Scholar] [CrossRef] [PubMed]
  43. Zhang, L.; Ambrose, C. CLASP balances two competing cell division plane cues during leaf development. Nat. Plants 2022, 8, 682–693. [Google Scholar] [CrossRef]
  44. Montero-Pau, J.; Blanca, J.; Bombarely, A.; Ziarsolo, P.; Esteras, C.; Marti-Gómez, C.; Ferriol, M.; Gómez, P.; Jamilena, M.; Mueller, L.; et al. De novo assembly of zucchini genome reveals a whole-genome duplication associated with the origin of the Cucurbita genus. Plant Biotechnol. J. 2018, 16, 1161–1171. [Google Scholar] [CrossRef] [PubMed]
  45. Li, H.; Durbin, R. Fast and accurate short read alignment with Burrows–Wheeler transform. Bioinformatics 2009, 25, 1754–1760. [Google Scholar] [CrossRef] [PubMed]
  46. Qu, S.-P.; Dan, Y.; Yu, H.-Y.; Chen, F.-Y.; Wang, K.-X.; Ding, W.-Q.; Xu, W.-L.; Wang, Y.-L. QTL analysis of early flowering of female flowers in zucchini (Cucurbita pepo L.). J. Integr. Agric. 2023, 22, 3321–3330. [Google Scholar] [CrossRef]
  47. Wang, Y.-L.; Wang, G.-C.; Lin, D.-J.; Luo, Q.-F.; Xu, W.-L.; Qu, S.-P. QTL mapping and stability analysis of trichome density in zucchini (Cucurbita pepo L.). Front. Plant Sci. 2023, 14, 1232154. [Google Scholar] [CrossRef]
  48. Wang, G.-C.; Dai, D.-Y.; Wang, L.; Sheng, Y.-Y.; Wang, D.; Li, D.-D.; Tian, L.-M.; Luan, F.-S. QTL analysis of flowering-related traits by specific length amplified fragment sequencing in melon. Crop Sci. 2022, 62, 203–215. [Google Scholar] [CrossRef]
  49. Weng, Y.-Q.; Colle, M.; Wang, Y.-H.; Yang, L.-M.; Rubinstein, M.; Sherman, A.; Ophir, R.; Grumet, R. QTL mapping in multiple populations and development stages reveals dynamic QTL for fruit size in cucumbers of different market classes. Theor. Appl. Genet. 2015, 128, 1747–1763. [Google Scholar] [CrossRef]
  50. Ding, W.-Q.; Wang, Y.-L.; Qi, C.; Luo, Y.-S.; Wang, C.-J.; Xu, W.-L.; Qu, S.-P. Fine mapping identified the gibberellin 2-oxidase gene CpDw leading to a dwarf phenotype in squash (Cucurbita pepo L.). Plant Sci. 2021, 306, 110857. [Google Scholar] [CrossRef]
  51. Luo, Y.-S.; Wang, C.-J.; Wang, M.-M.; Wang, Y.-L.; Xu, W.-L.; Han, H.-Y.; Wang, Z.-C.; Zhong, Y.-J.; Huang, H.-X.; Qu, S.-P. Accumulation of carotenoids and expression of carotenoid biosynthesis genes in fruit flesh during fruit development in two Cucurbita maxima inbred lines. Hortic. Plant J. 2021, 7, 529–538. [Google Scholar] [CrossRef]
Figure 1. The phenotypes of ‘19’, ‘113’ and F1. (A) 19. (B) 113. (C) F1. Scale = 1 cm.
Ijms 25 02491 g001
Figure 2. Photosynthetic pigment content of parent in different stages. Chl a: chlorophyll a, Chl b: chlorophyll b, Caro: carotenoid, Chl: chlorophyll. Different letters indicate significant differences at 0.05 level. Columns are the mean values ± SD. Each column has been tested in three replicates.
Ijms 25 02491 g002
Figure 3. Photosynthetic parameters in different leaf areas. (A) net photosynthetic rate of parents. (B) Transpiration rate of parents. (C) Stomatal conductance rate of parents. (D) Intercellular CO2 concentration rate of parents. Different letters indicate significant differences at 0.05 level. Columns are the mean values ± SD. Each column has been tested in three replicates.
Ijms 25 02491 g003
Figure 4. Results of leaves under shading treatments. (A) The leaf without shading treatment. (B) The leaf under 5-days of shading. (C) The leaf under 5-days of shading, then 10-days of light restoration. (DF) Leaves growing under light in the same periods as (AC). Scale = 1 cm.
Ijms 25 02491 g004
Figure 5. The cross-sectional structure of parental. (A) Silver area of ‘19’ (40×). (B) Green area of ‘19’ (40×). (C) ‘113’ (40×). UE: upper epidermis; PP: palisade parenchyma; SP: sponge parenchyma; LE: Lower epidermis. Scale = 5 μm.
Ijms 25 02491 g005
Figure 6. Frequency histogram of leaf mottle grades in different F2 populations. The orange arrows indicate mottled leaf phenotype in ‘19’, the green arrows indicate mottled leaf phenotype in ‘113’, and the blue arrows indicate mottled leaf phenotype in F1.
Ijms 25 02491 g006
Figure 7. The results of QTL-seq. (A) Distribution of the ED-based linkage value with InDels on chromosomes. (B) Distribution of the ED-based linkage value with SNPs on chromosomes. (C) Distribution of InDel-index correlation values on chromosomes. (D) Distribution of SNP-index correlation values on chromosomes. In (A,B), the medians +3 SD of the fitted value of all sites were defined as the linkage threshold and shown by red lines. In (C,D), the top panel is a distribution map of the SNP-index (InDel-index) values of the M-pool, the middle panel is a distribution map of the SNP-index (InDel-index) values of the N-pool, and the bottom panel is a distribution map of the Δ(SNP-index)/Δ(InDel-index) values. The red line represents the confidence threshold line for the 99 percentile.
Ijms 25 02491 g007
Figure 8. Verification of QTL stability. The area between the red dashed lines represents the QTL location.
Ijms 25 02491 g008
Figure 9. Interaction plots of the QTL pairs detected in the F2 and RIL populations for mottled leaf.
Ijms 25 02491 g009
Figure 10. Relative expression levels of four candidate genes in the ‘19’ and ‘113’ and F2 populations. (A) Relative expression levels of Cp4.1LG17g08260. (B) Relative expression levels of Cp4.1LG17g08300. (C) Relative expression levels of Cp4.1LG17g08140. (D) Relative expression levels of Cp4.1LG01g23790. (AD) Relative expression levels of four candidate genes in ‘19’ and ‘113’. (E) Relative expression levels of Cp4.1LG17g08260. (F) Relative expression levels of Cp4.1LG17g08300. (G) Relative expression levels of Cp4.1LG17g08140. (H) Relative expression levels of Cp4.1LG01g23790. (EH) Relative expression levels of four candidate genes in the F2 populations. The relative expression levels of four genes were quantified using the 2−ΔΔCT method. For the two parents, the relative expression level at the 1-leaf-stage in ‘19’ was set to a value of 1 and used as a reference, respectively. For the F2, the relative expression level at the 1-leaf-stage in mottled leaf area was set to a value of 1 and used as a reference, respectively. ** indicates an extremely significant difference, p < 0.01; * indicates a significant difference, p < 0.05.
Ijms 25 02491 g010
Figure 11. Results of the mottled leaf grade when CpML1.1 and CpML17.1 carry different homozygotes.
Ijms 25 02491 g011
Figure 12. Grading standard of F2 mottled leaf. (A) 0 grade. (B) 1 grade. (C) 2 grade. (D) 3 grade. Scale = 1 cm.
Ijms 25 02491 g012
Table 1. Microstructure analysis between ‘19’ and ‘113’.
MaterialLeaf ThicknessThickness of Upper EpidermisThickness of Palisade ParenchymaThickness of Sponge ParenchymaThickness of Lower EpidermisCTR (%)SR (%)
‘19’ mottle area45.12 ± 0.09 a4.64 ± 0.16 a26.24 ± 0.10 a8.69 ± 0.05 c1.99 ± 0.10 a58.15 ± 0.00 a19.26 ± 0.00 c
‘19’ green area45.09 ± 0.16 a3.82 ± 0.08 b26.22 ± 0.35 a11.20 ± 0.06 a2.32 ± 0.04 a58.18 ± 0.01 a24.83 ± 0.00 a
‘113’43.66 ± 0.14 b3.80 ± 0.04 bB22.26 ± 0.20 b10.24 ± 0.24 b2.32 ± 0.41 a50.98 ± 0.01 b23.45 ± 0.01 b
Note: Values are the average ± SD on three replicates. Different letters indicate significant differences at the 0.05 level.
Table 2. QTL mapping of the mottled leaf trait in the F2 population.
QTLEnvironmentPosition IntervalPhysical Distance (Kb)LODAddDomPVE (%)
CpML1.12019ACHr01_18713051-CHr01_19638223925.243.790.640.3624.15
2020ACHr01_18590758-CHr01_19419173828.431.180.560.0423.82
2020MCHr01_18713051-CHr01_19638223925.214.020.430.1510.51
CpML17.12019ACHr17_5225091-CHr17_5944838719.738.700.630.0320.80
2020ACHr17_5225091-CHr17_5944838719.720.650.47-0.0116.25
2020MCHr17_5225091-CHr17_5944838719.752.990.85-0.1938.68
Disclaimer/Publisher’s Note: The statements, opinions and data contained in all publications are solely those of the individual author(s) and contributor(s) and not of MDPI and/or the editor(s). MDPI and/or the editor(s) disclaim responsibility for any injury to people or property resulting from any ideas, methods, instructions or products referred to in the content.

