
Targeted Proteomics Reveals Quantitative Differences in Low-Abundance Glycosyltransferases of Patients with Congenital Disorders of Glycosylation
 , , , ,
Abstract
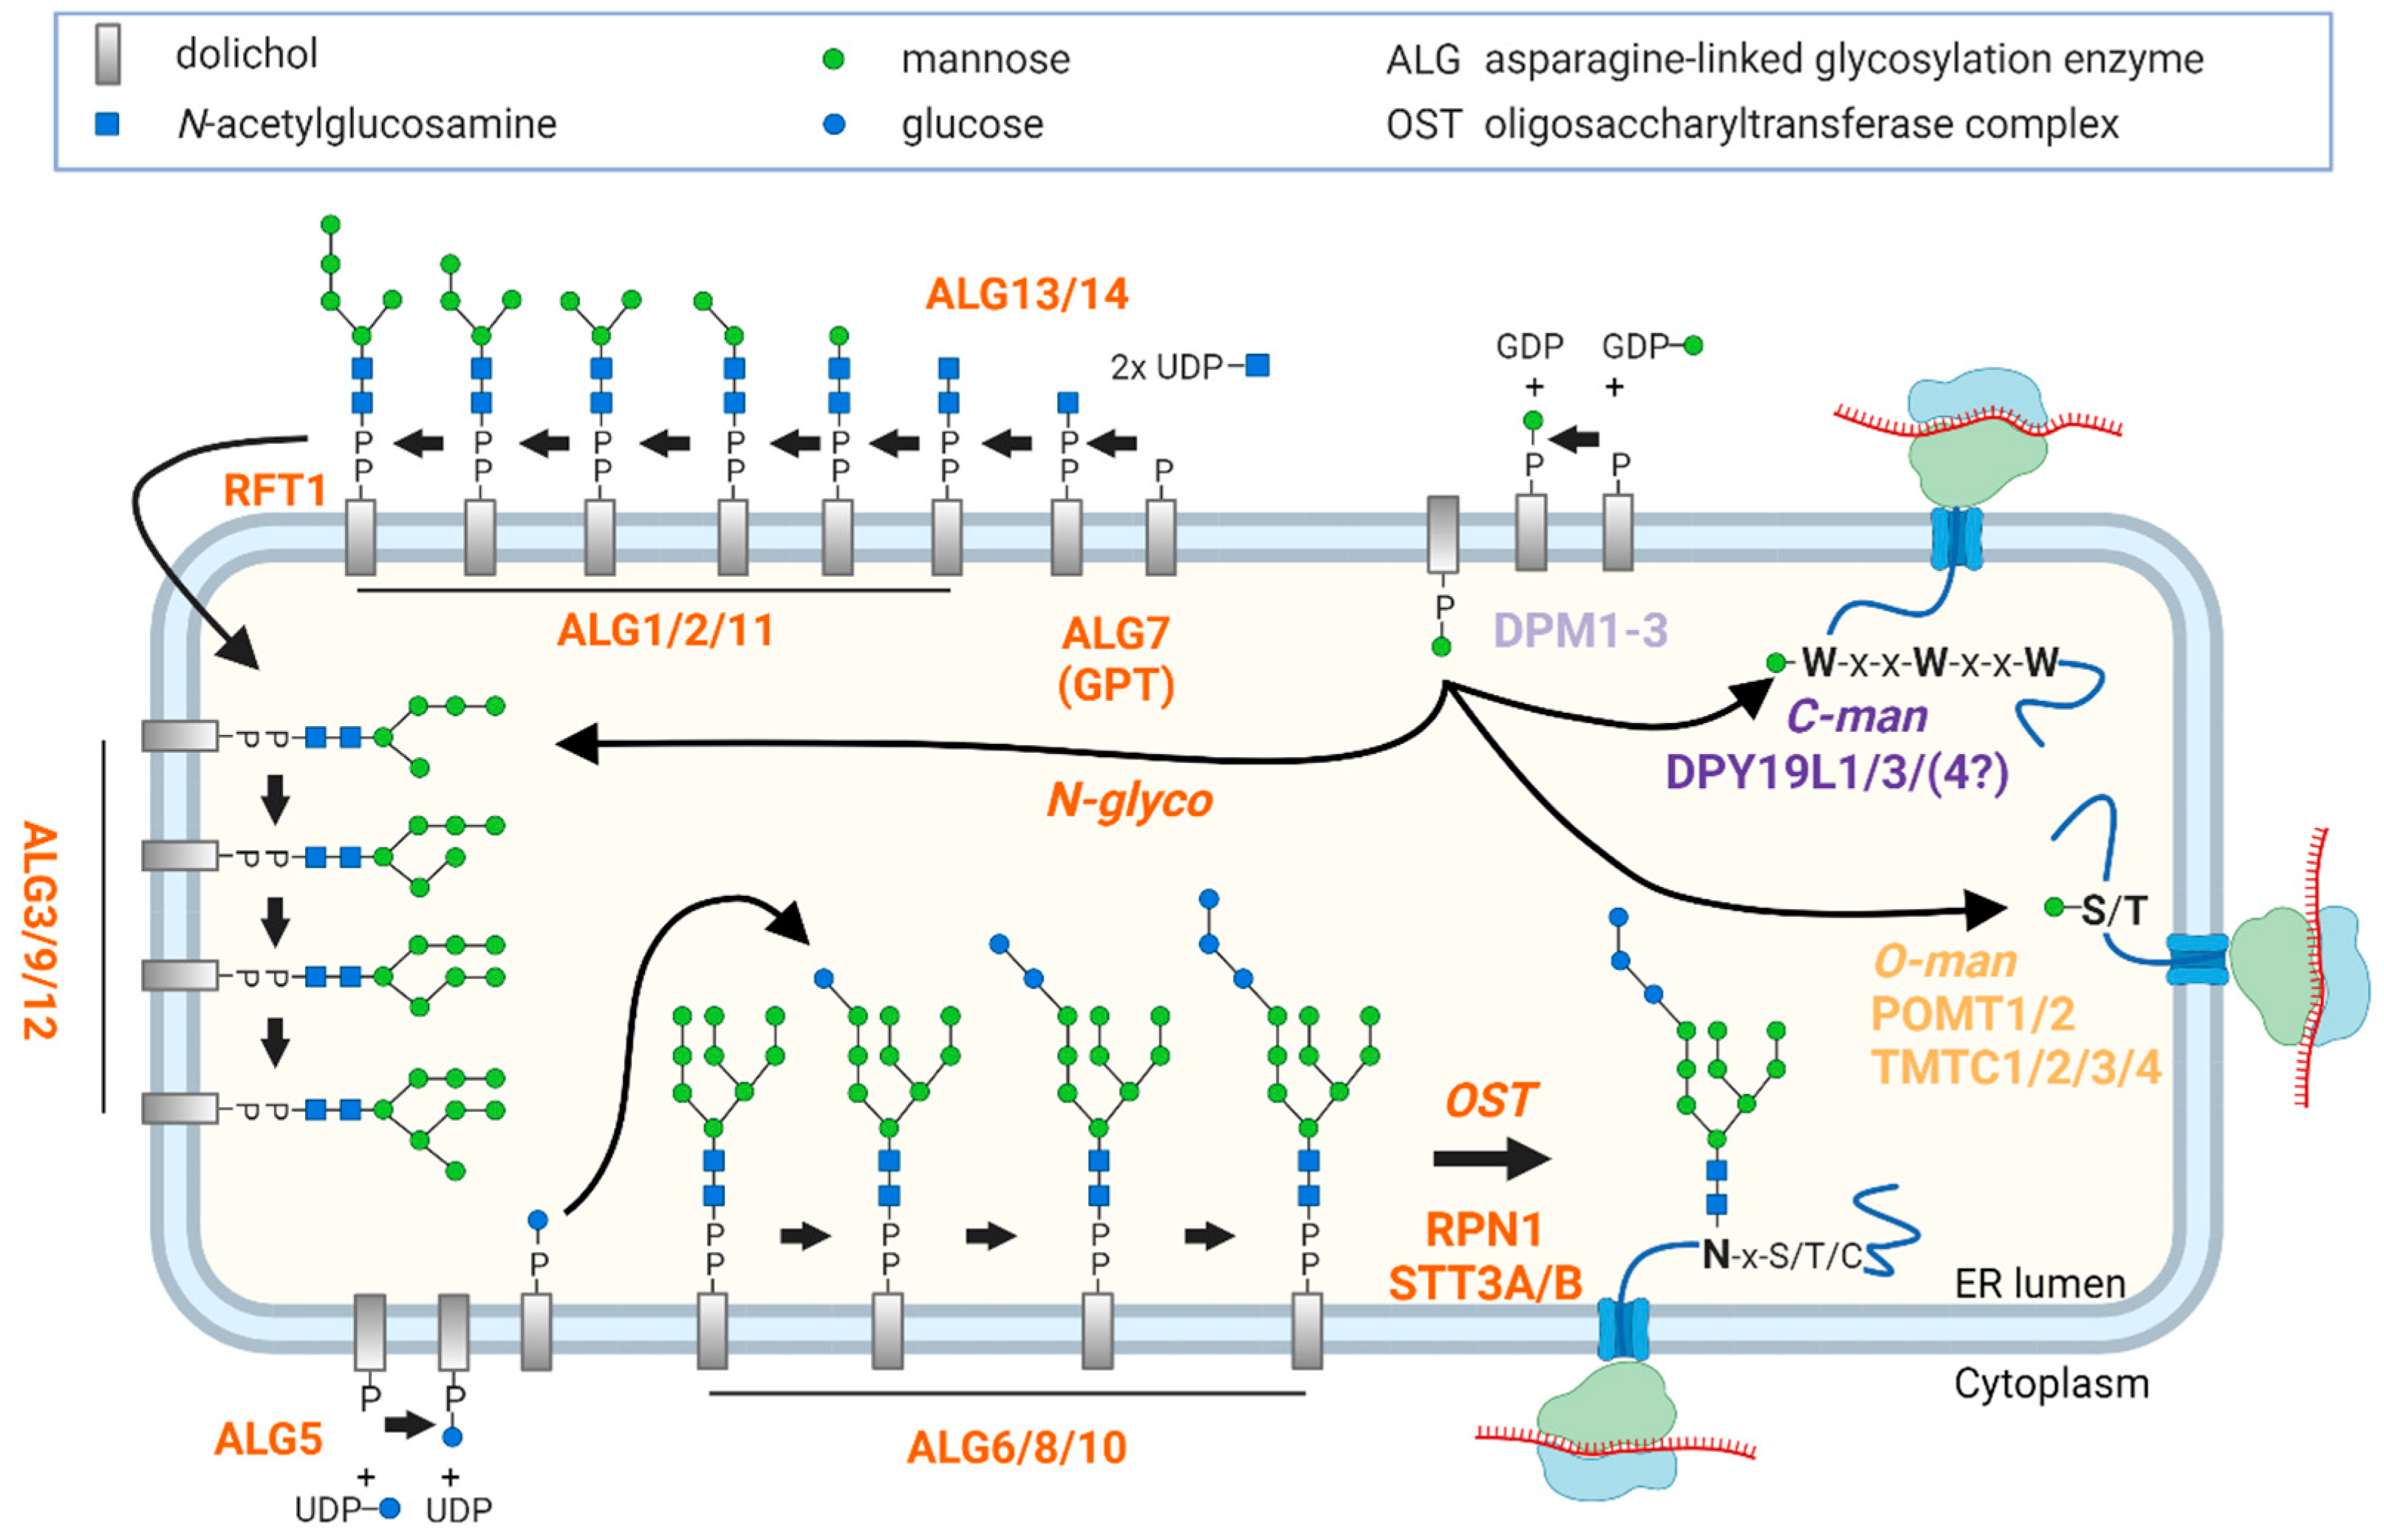
:1. Introduction
2. Results
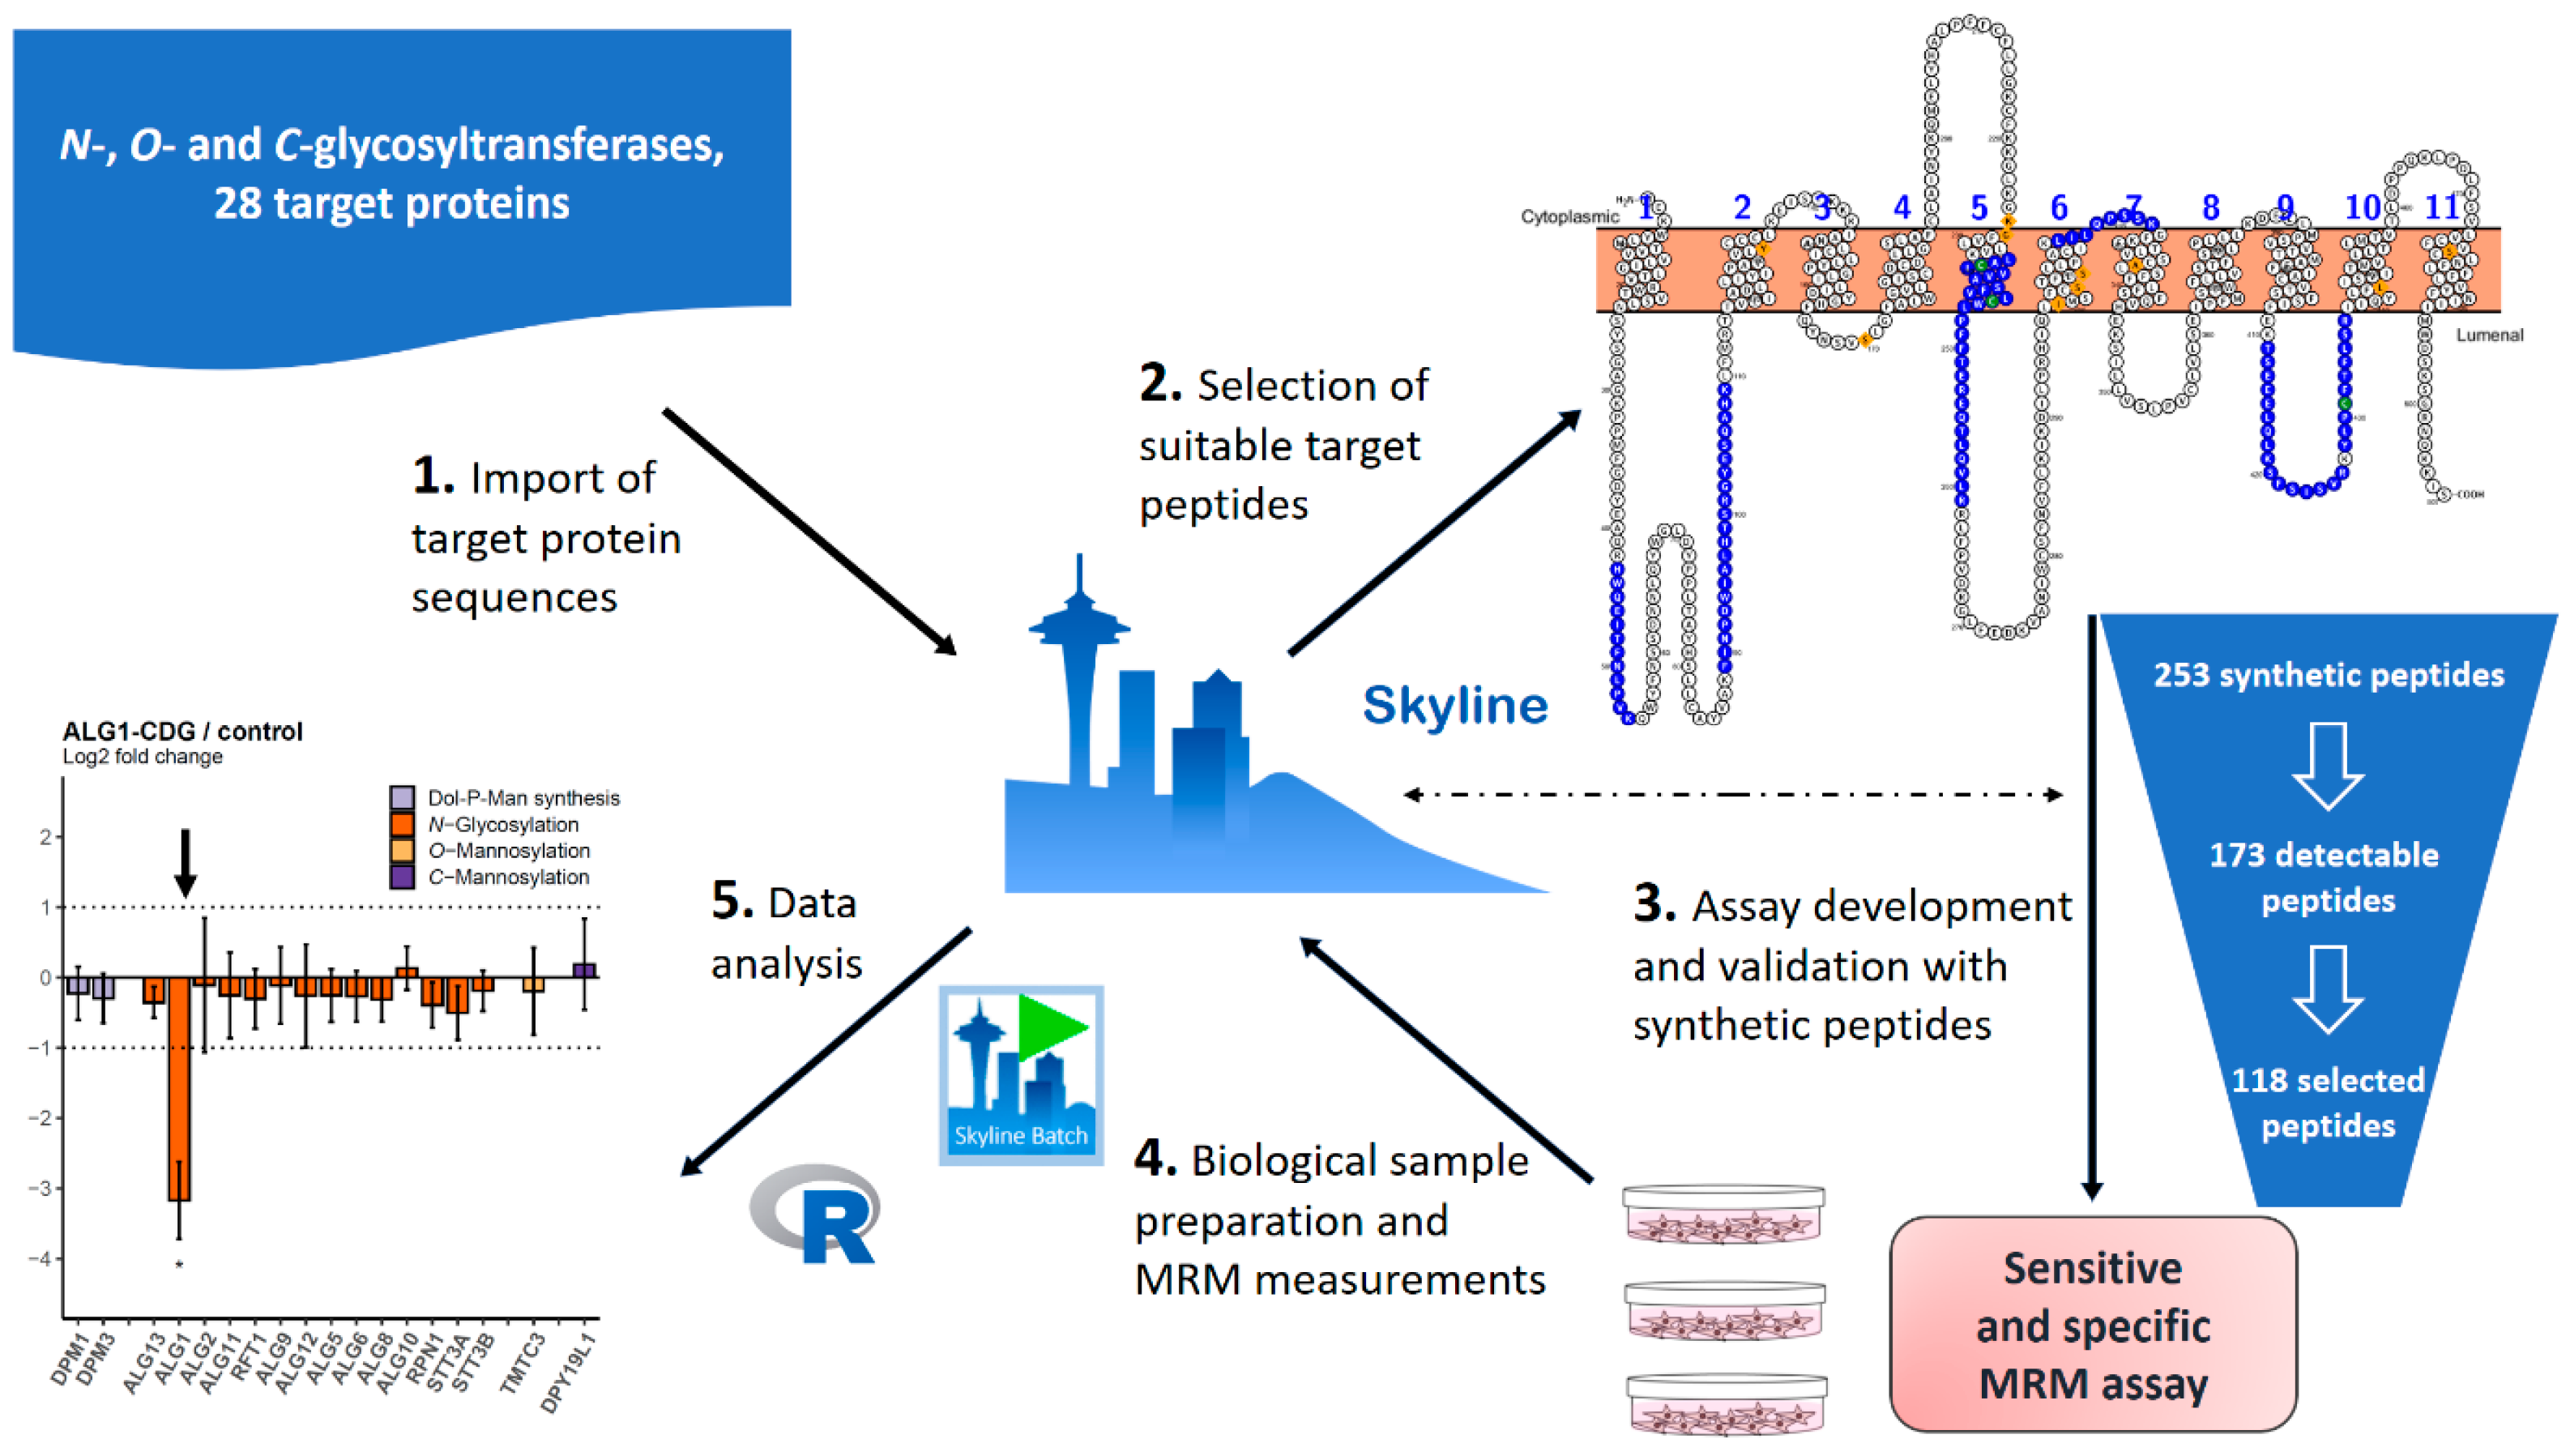
2.1. MRM Assay for the Quantitative Analysis of ER-Based GTs
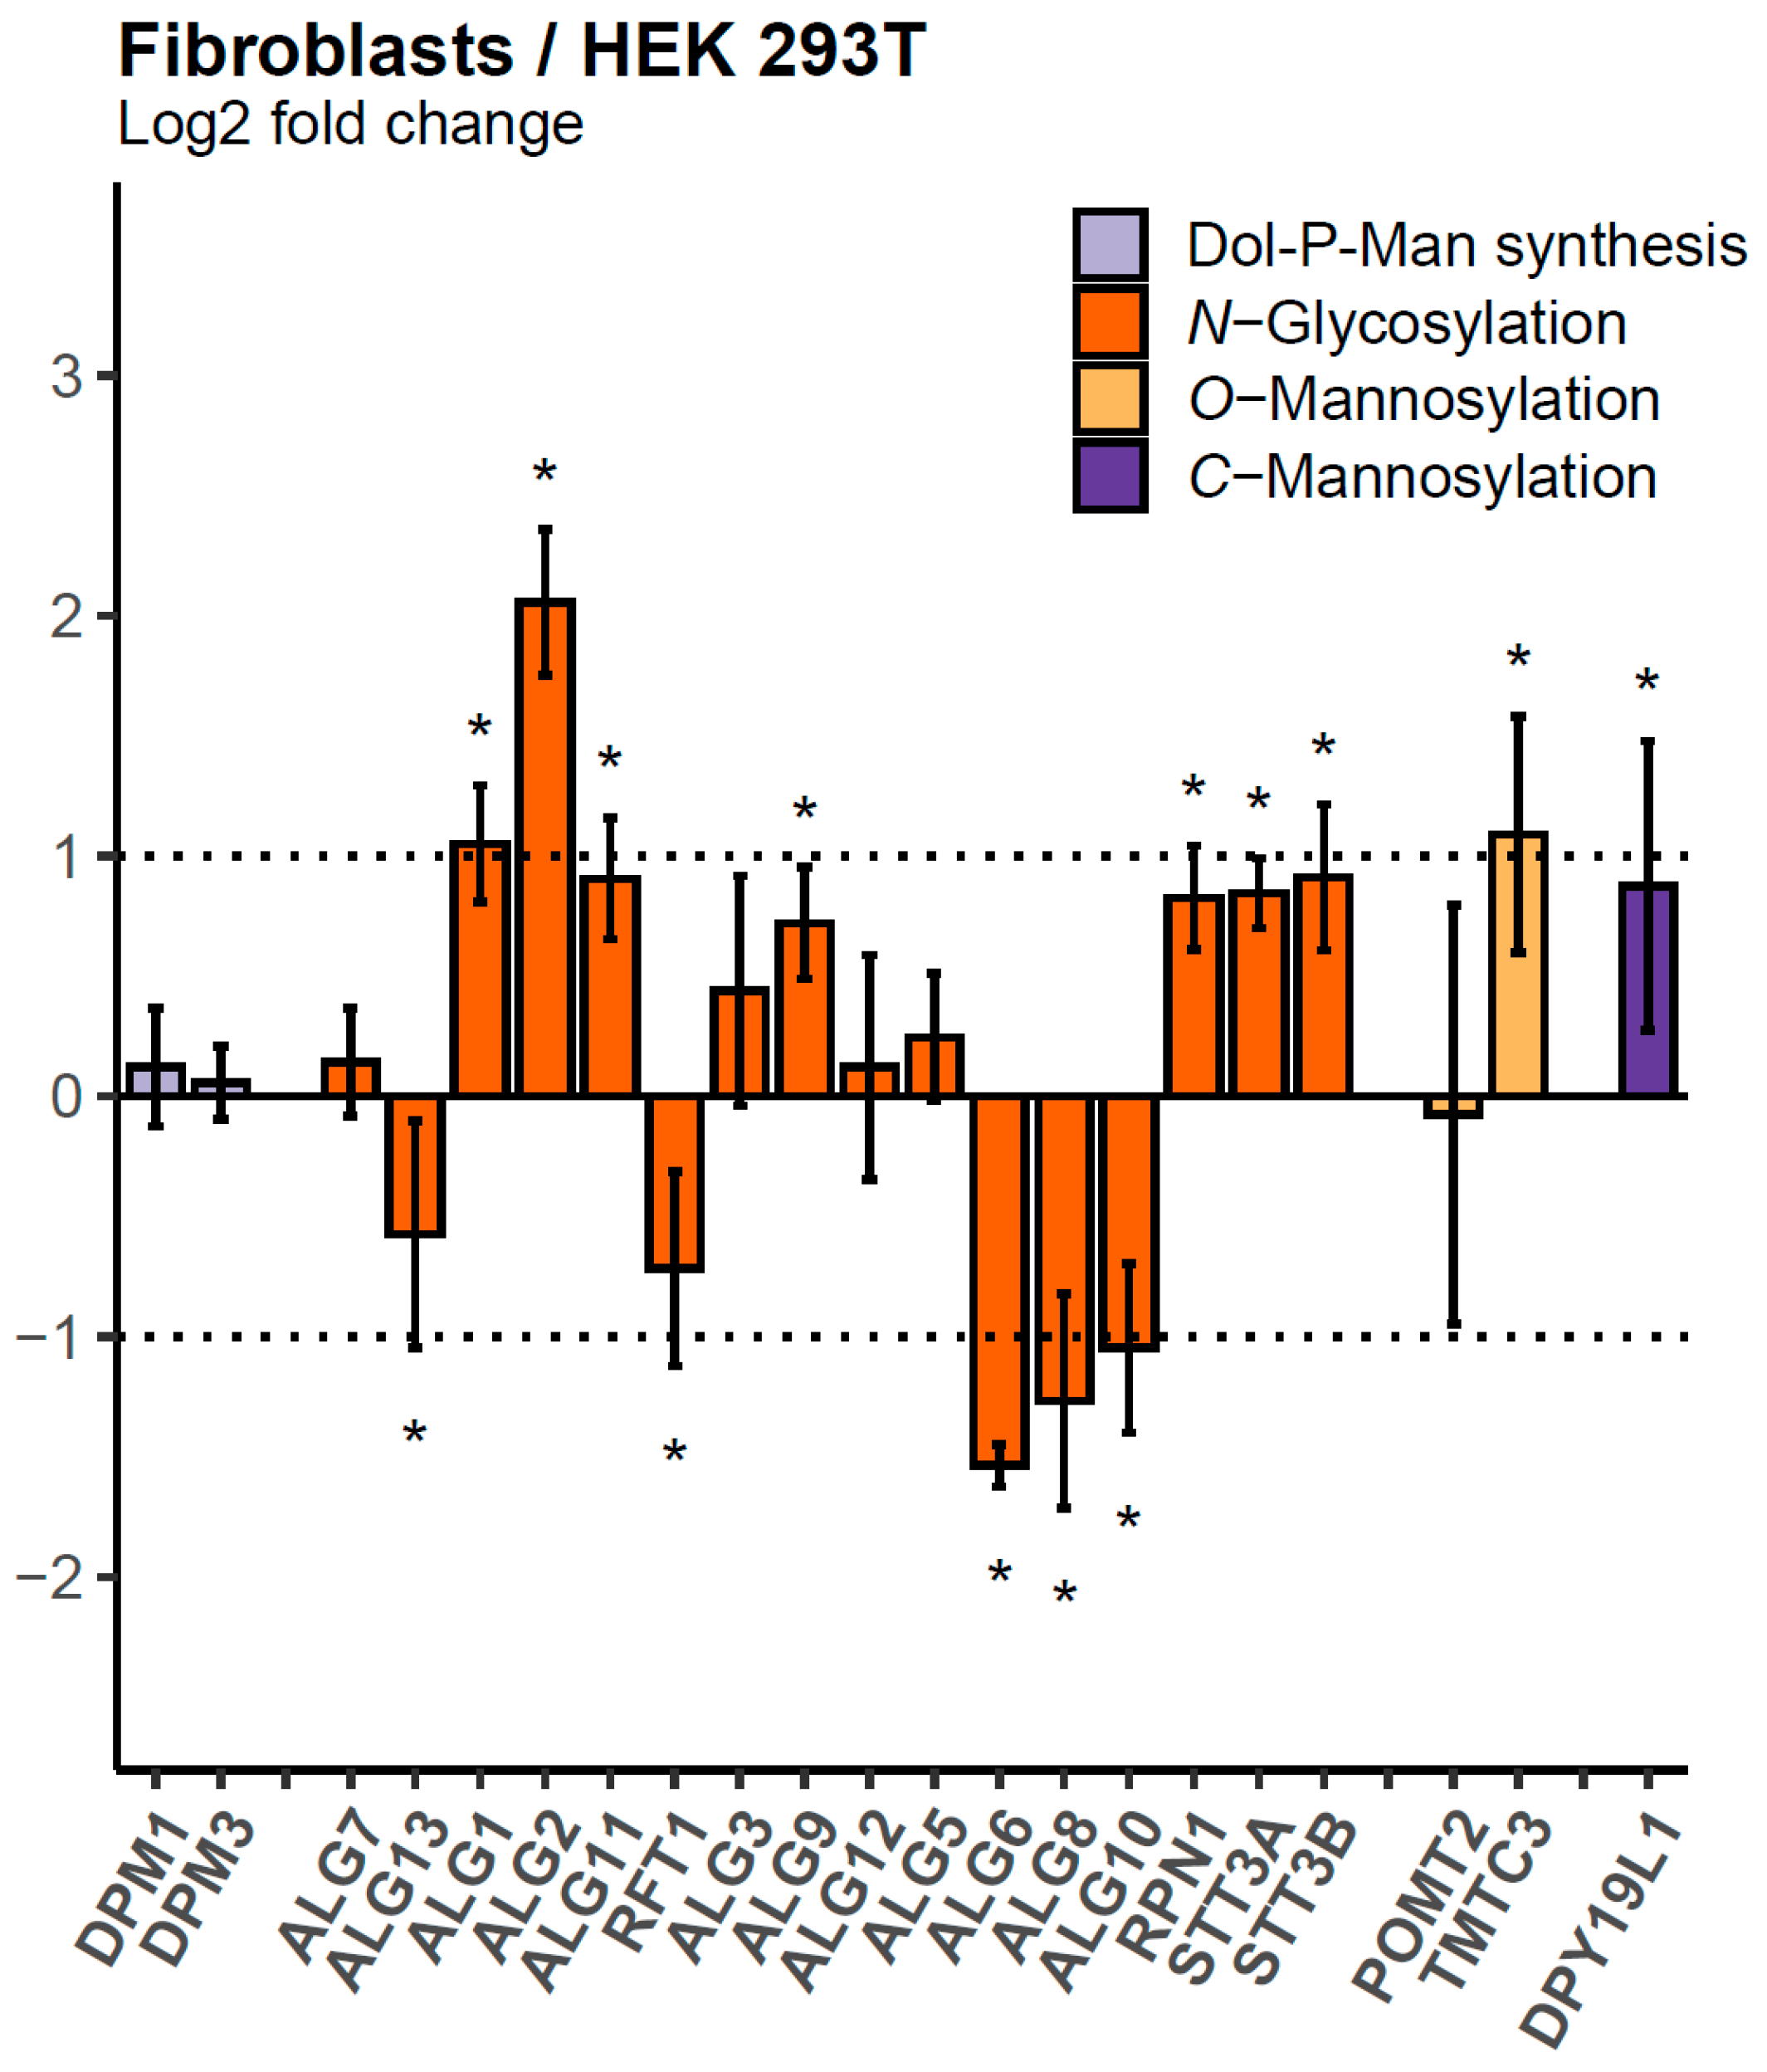
2.2. Relative Abundances of GTs in HEK 293T, HeLa, and Primary Skin Fibroblast Cell Lines
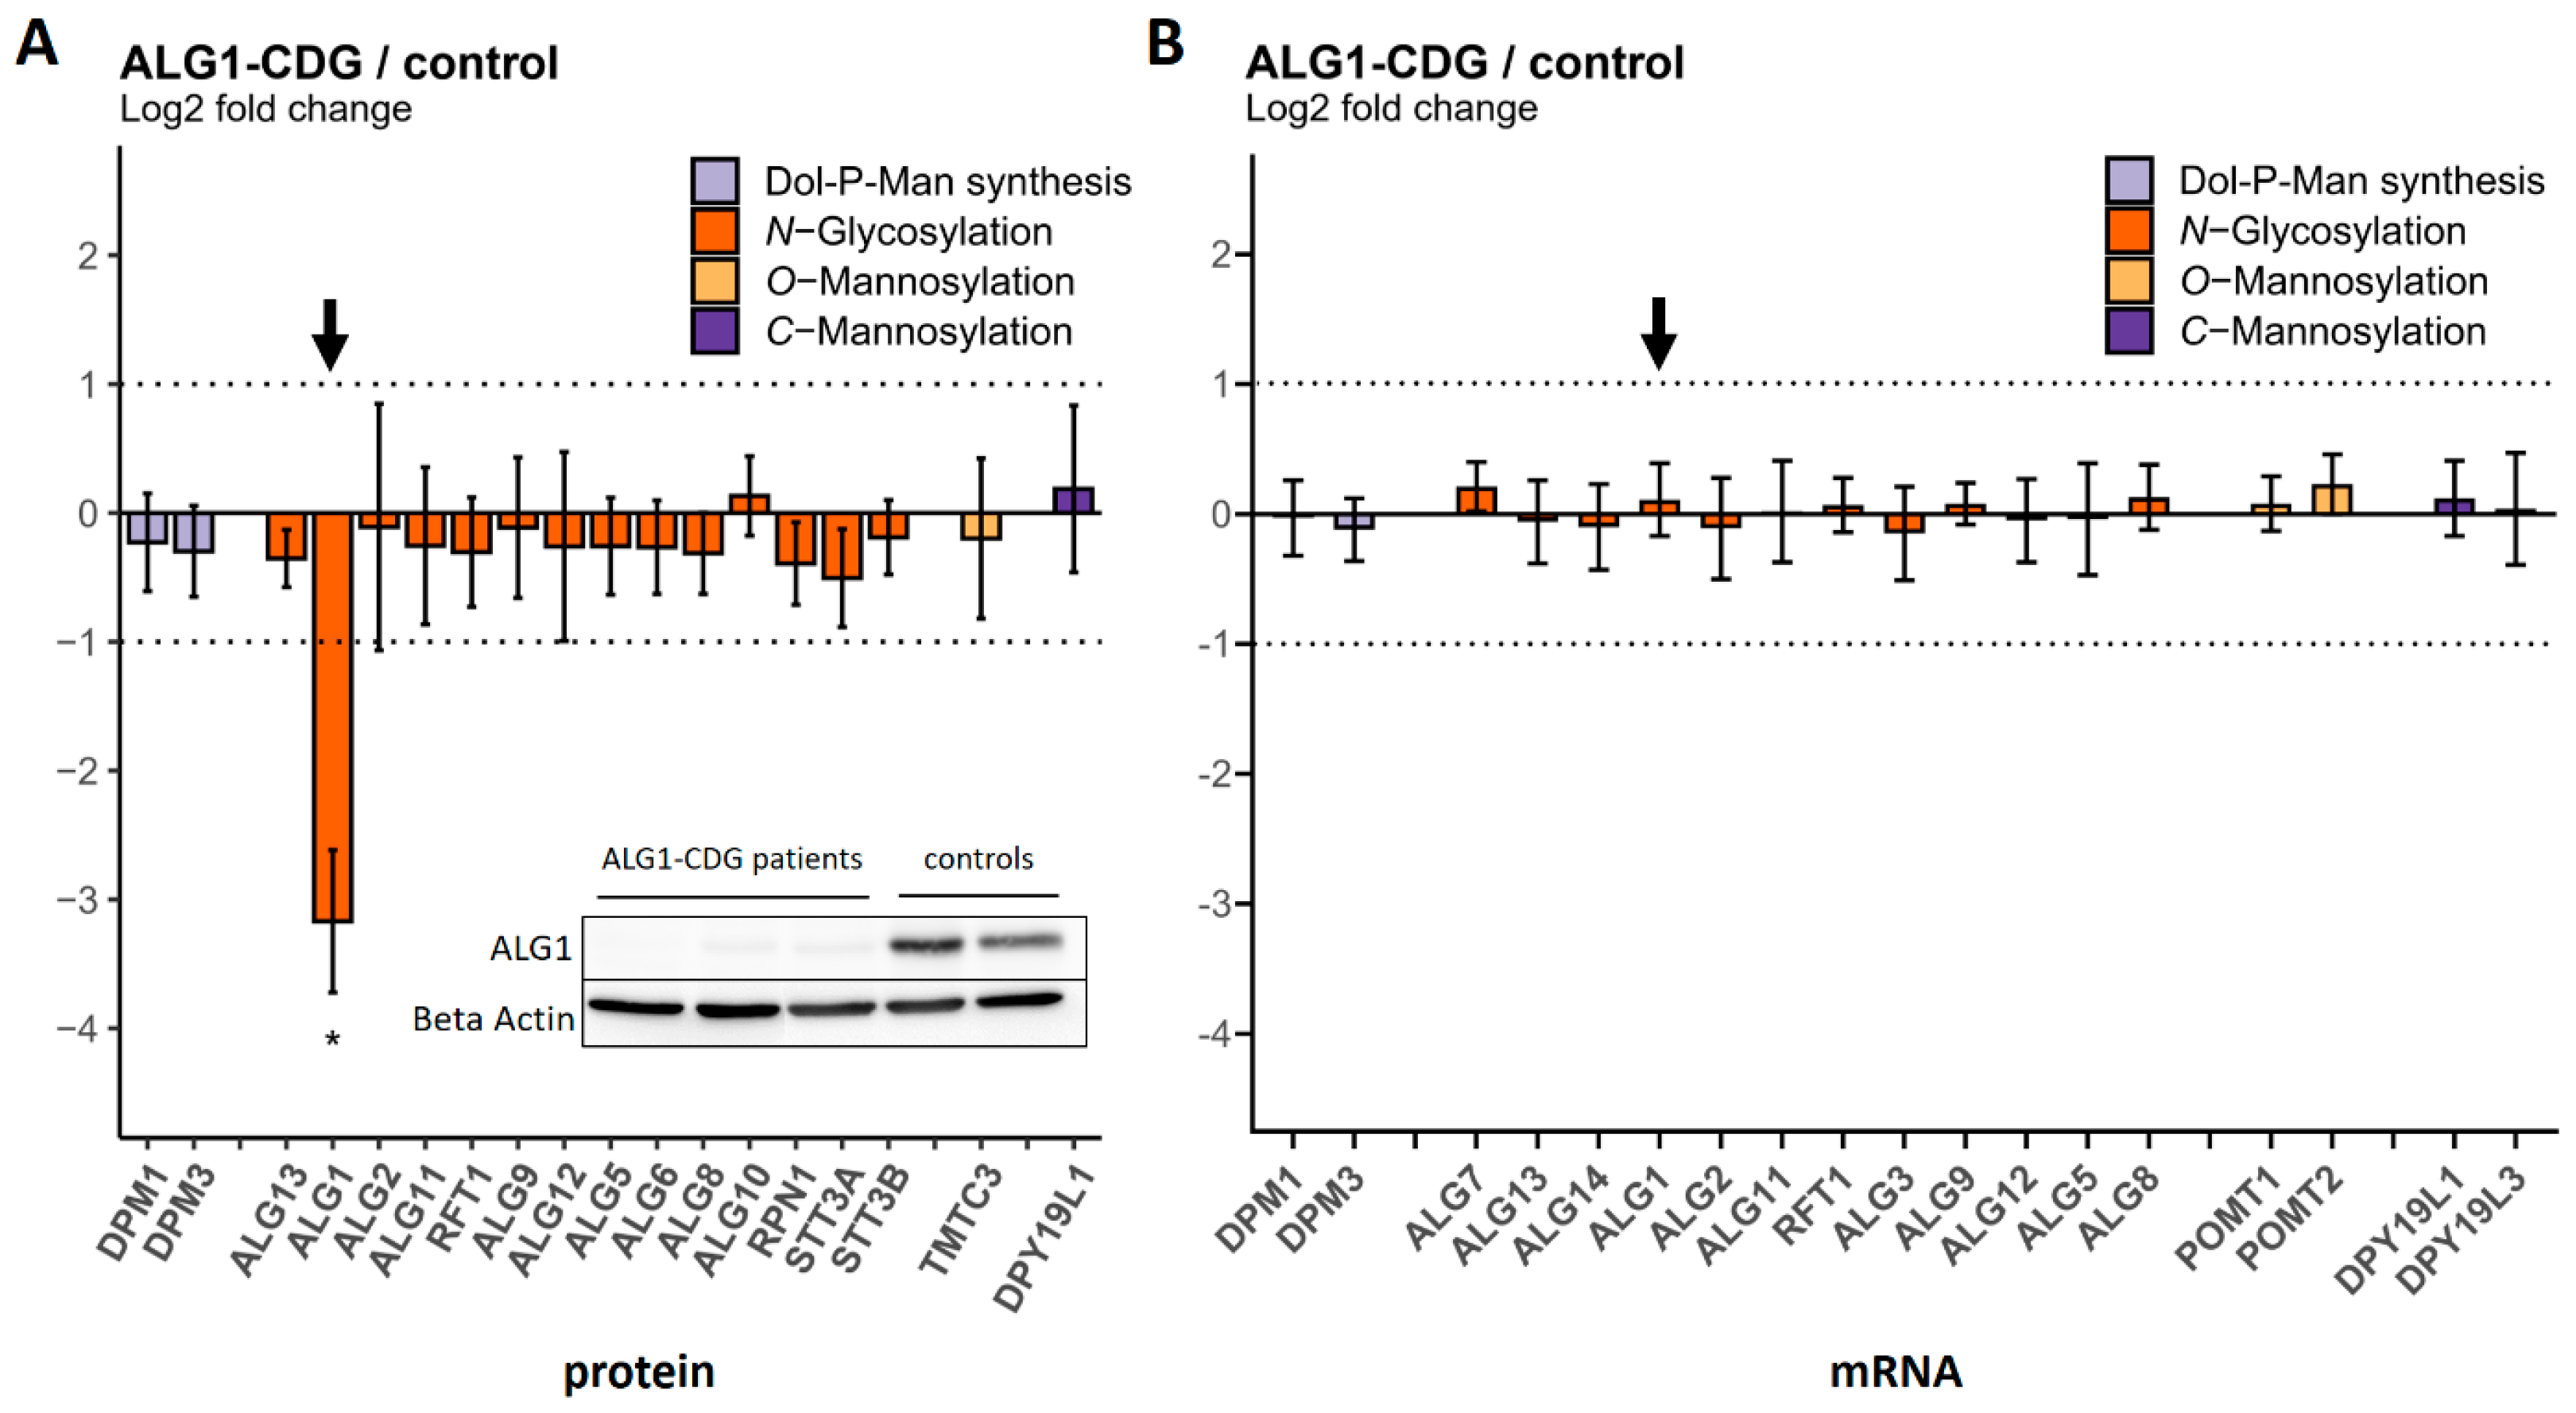
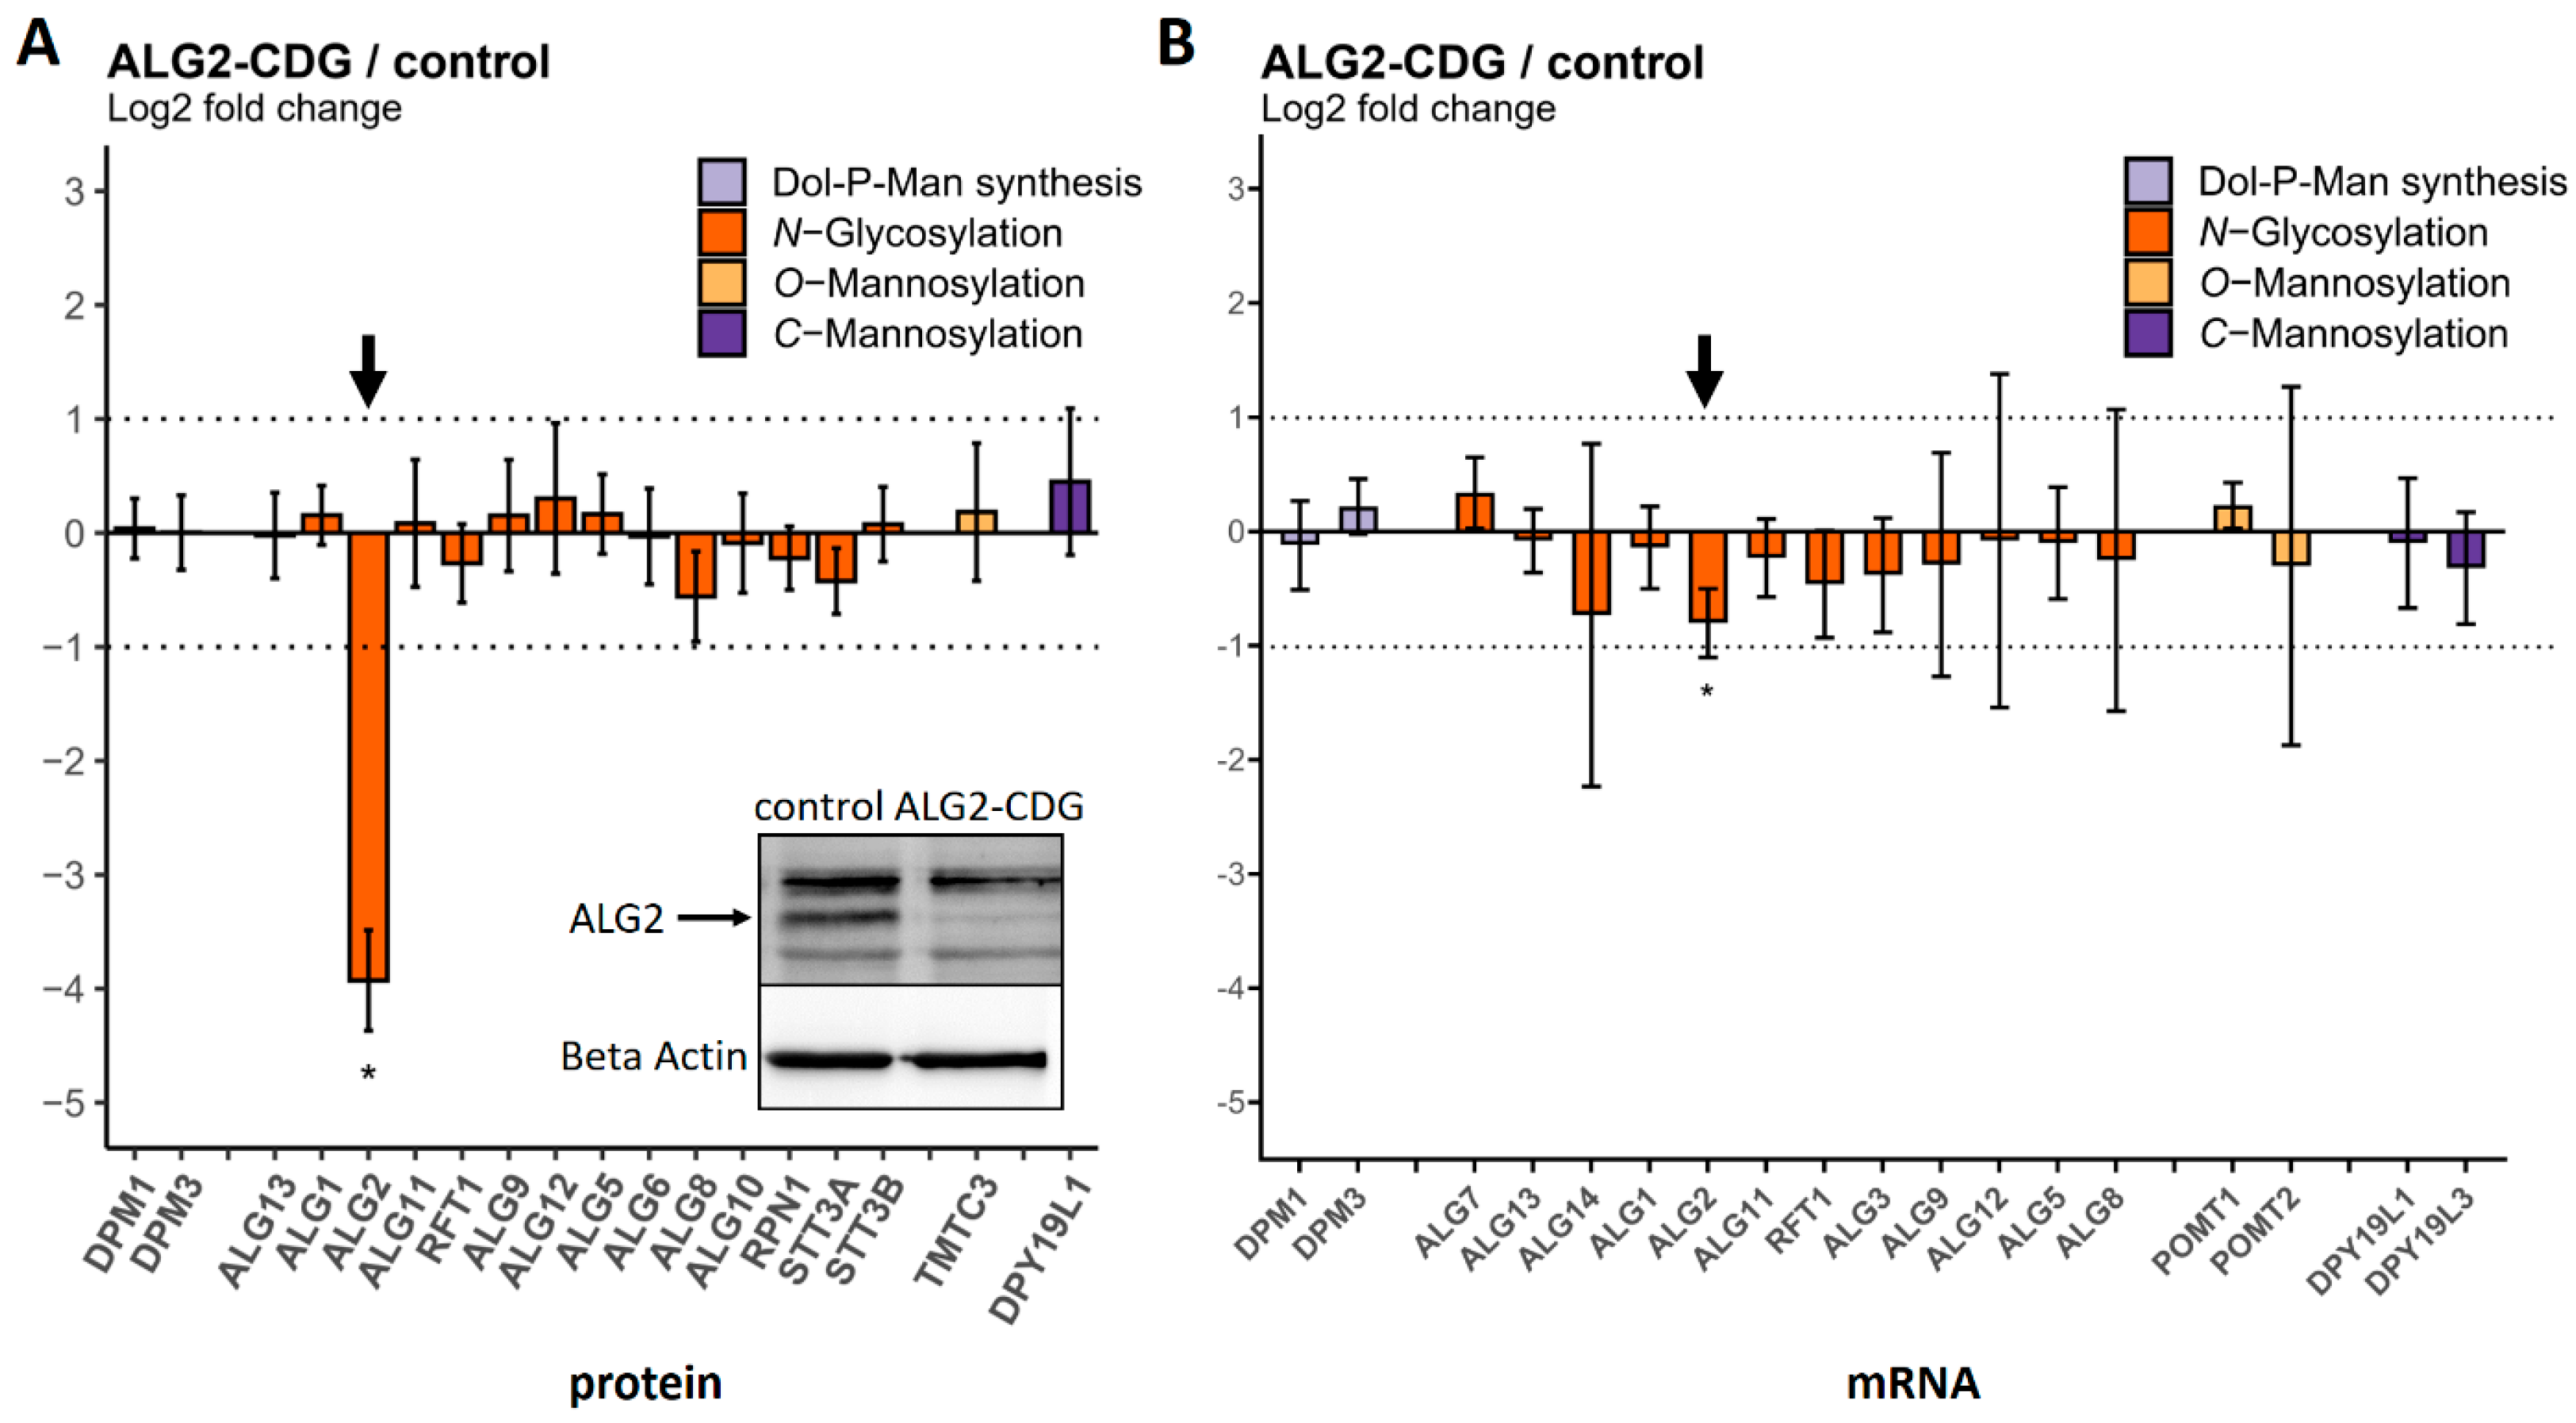
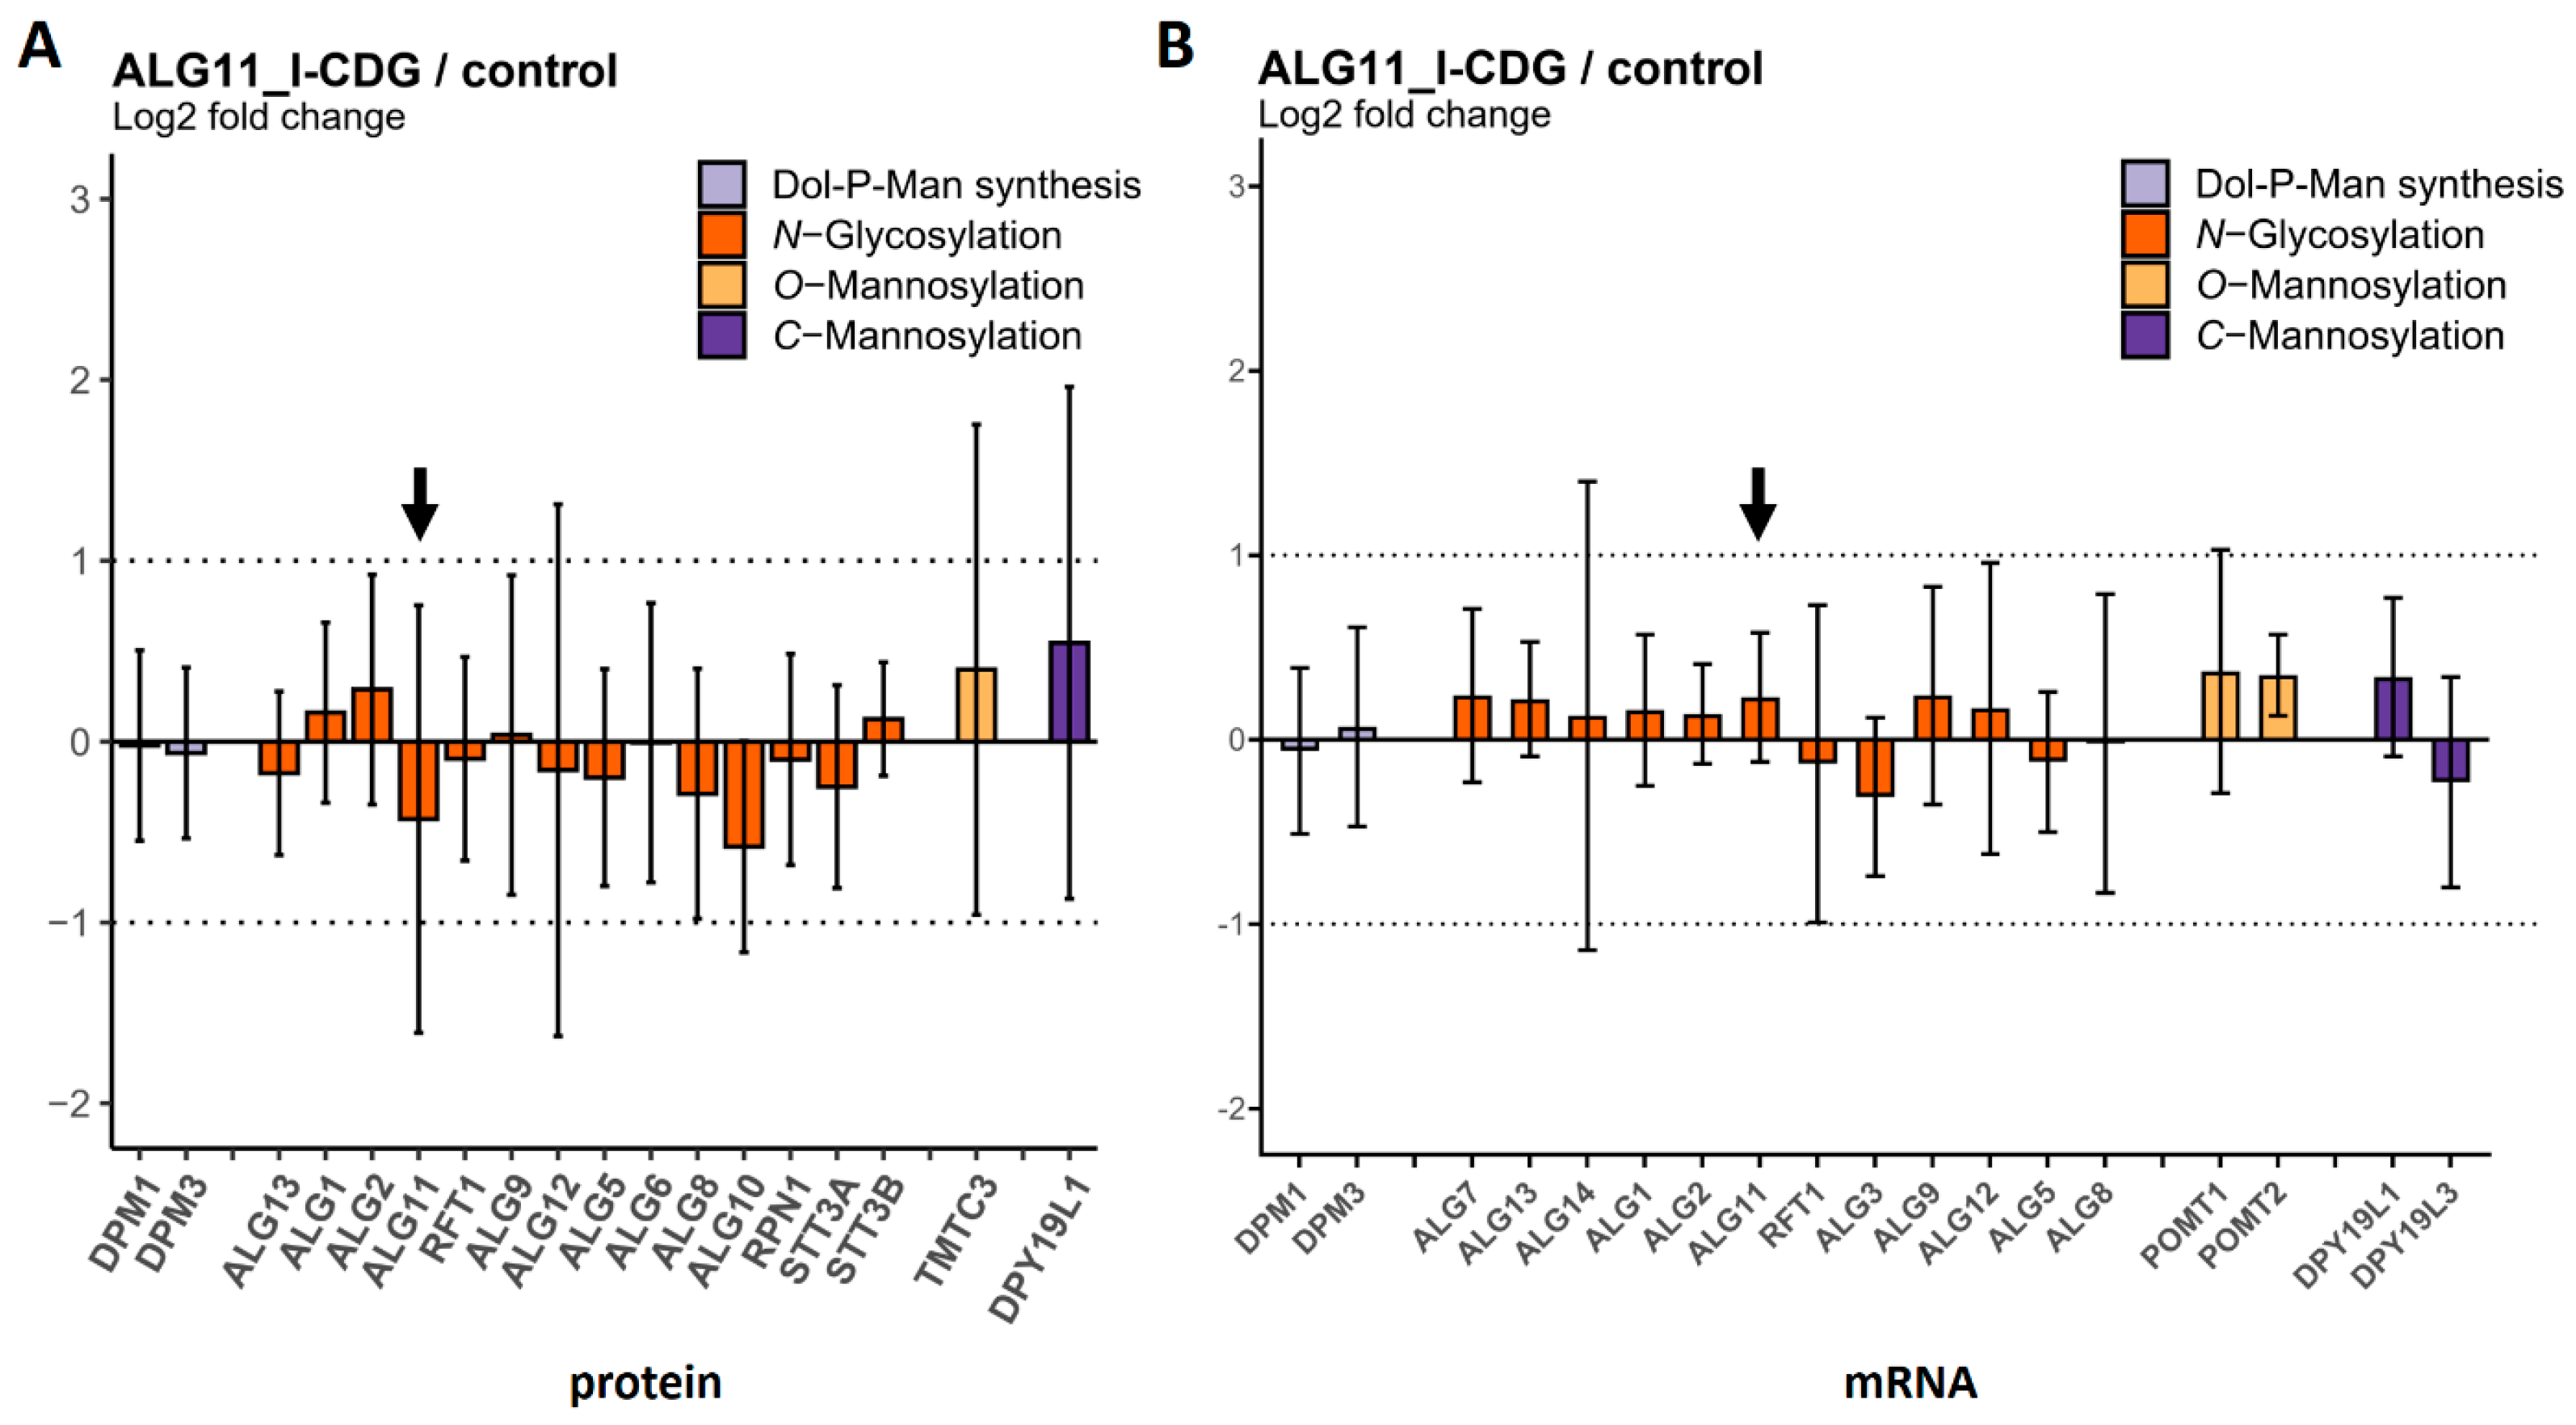
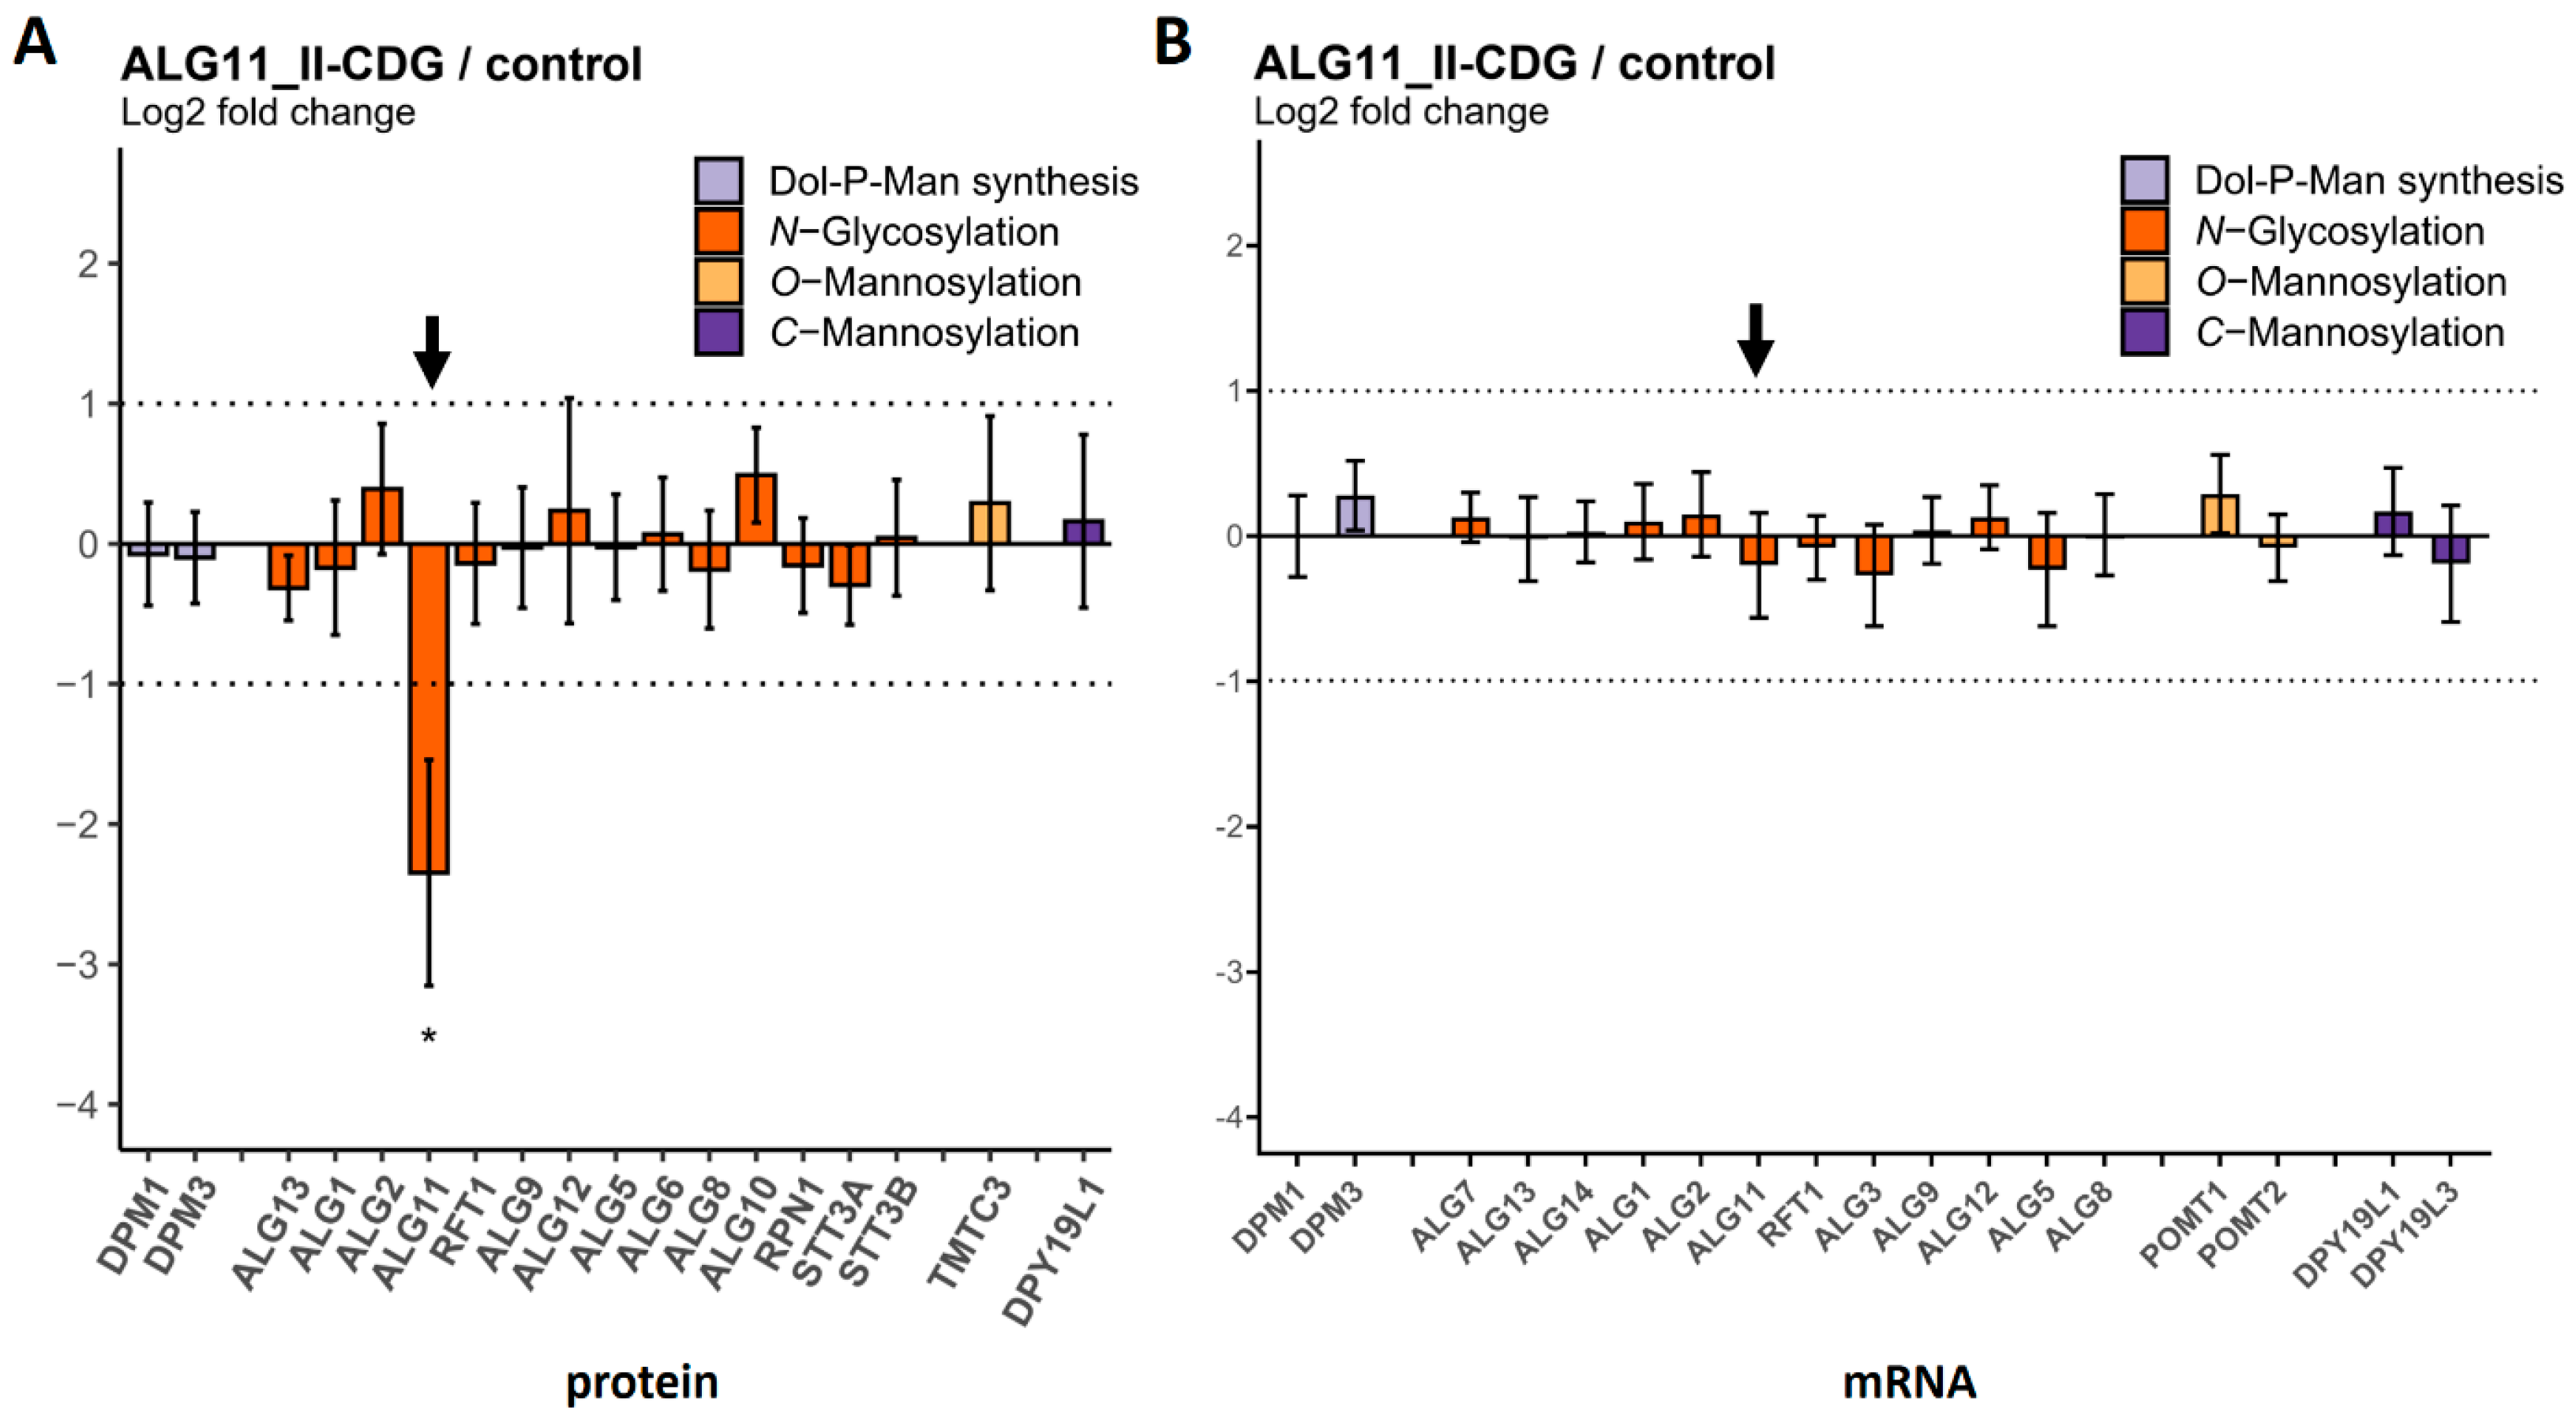
2.3. Comparison of Protein and mRNA Abundance between CDG Patient Fibroblasts and Controls
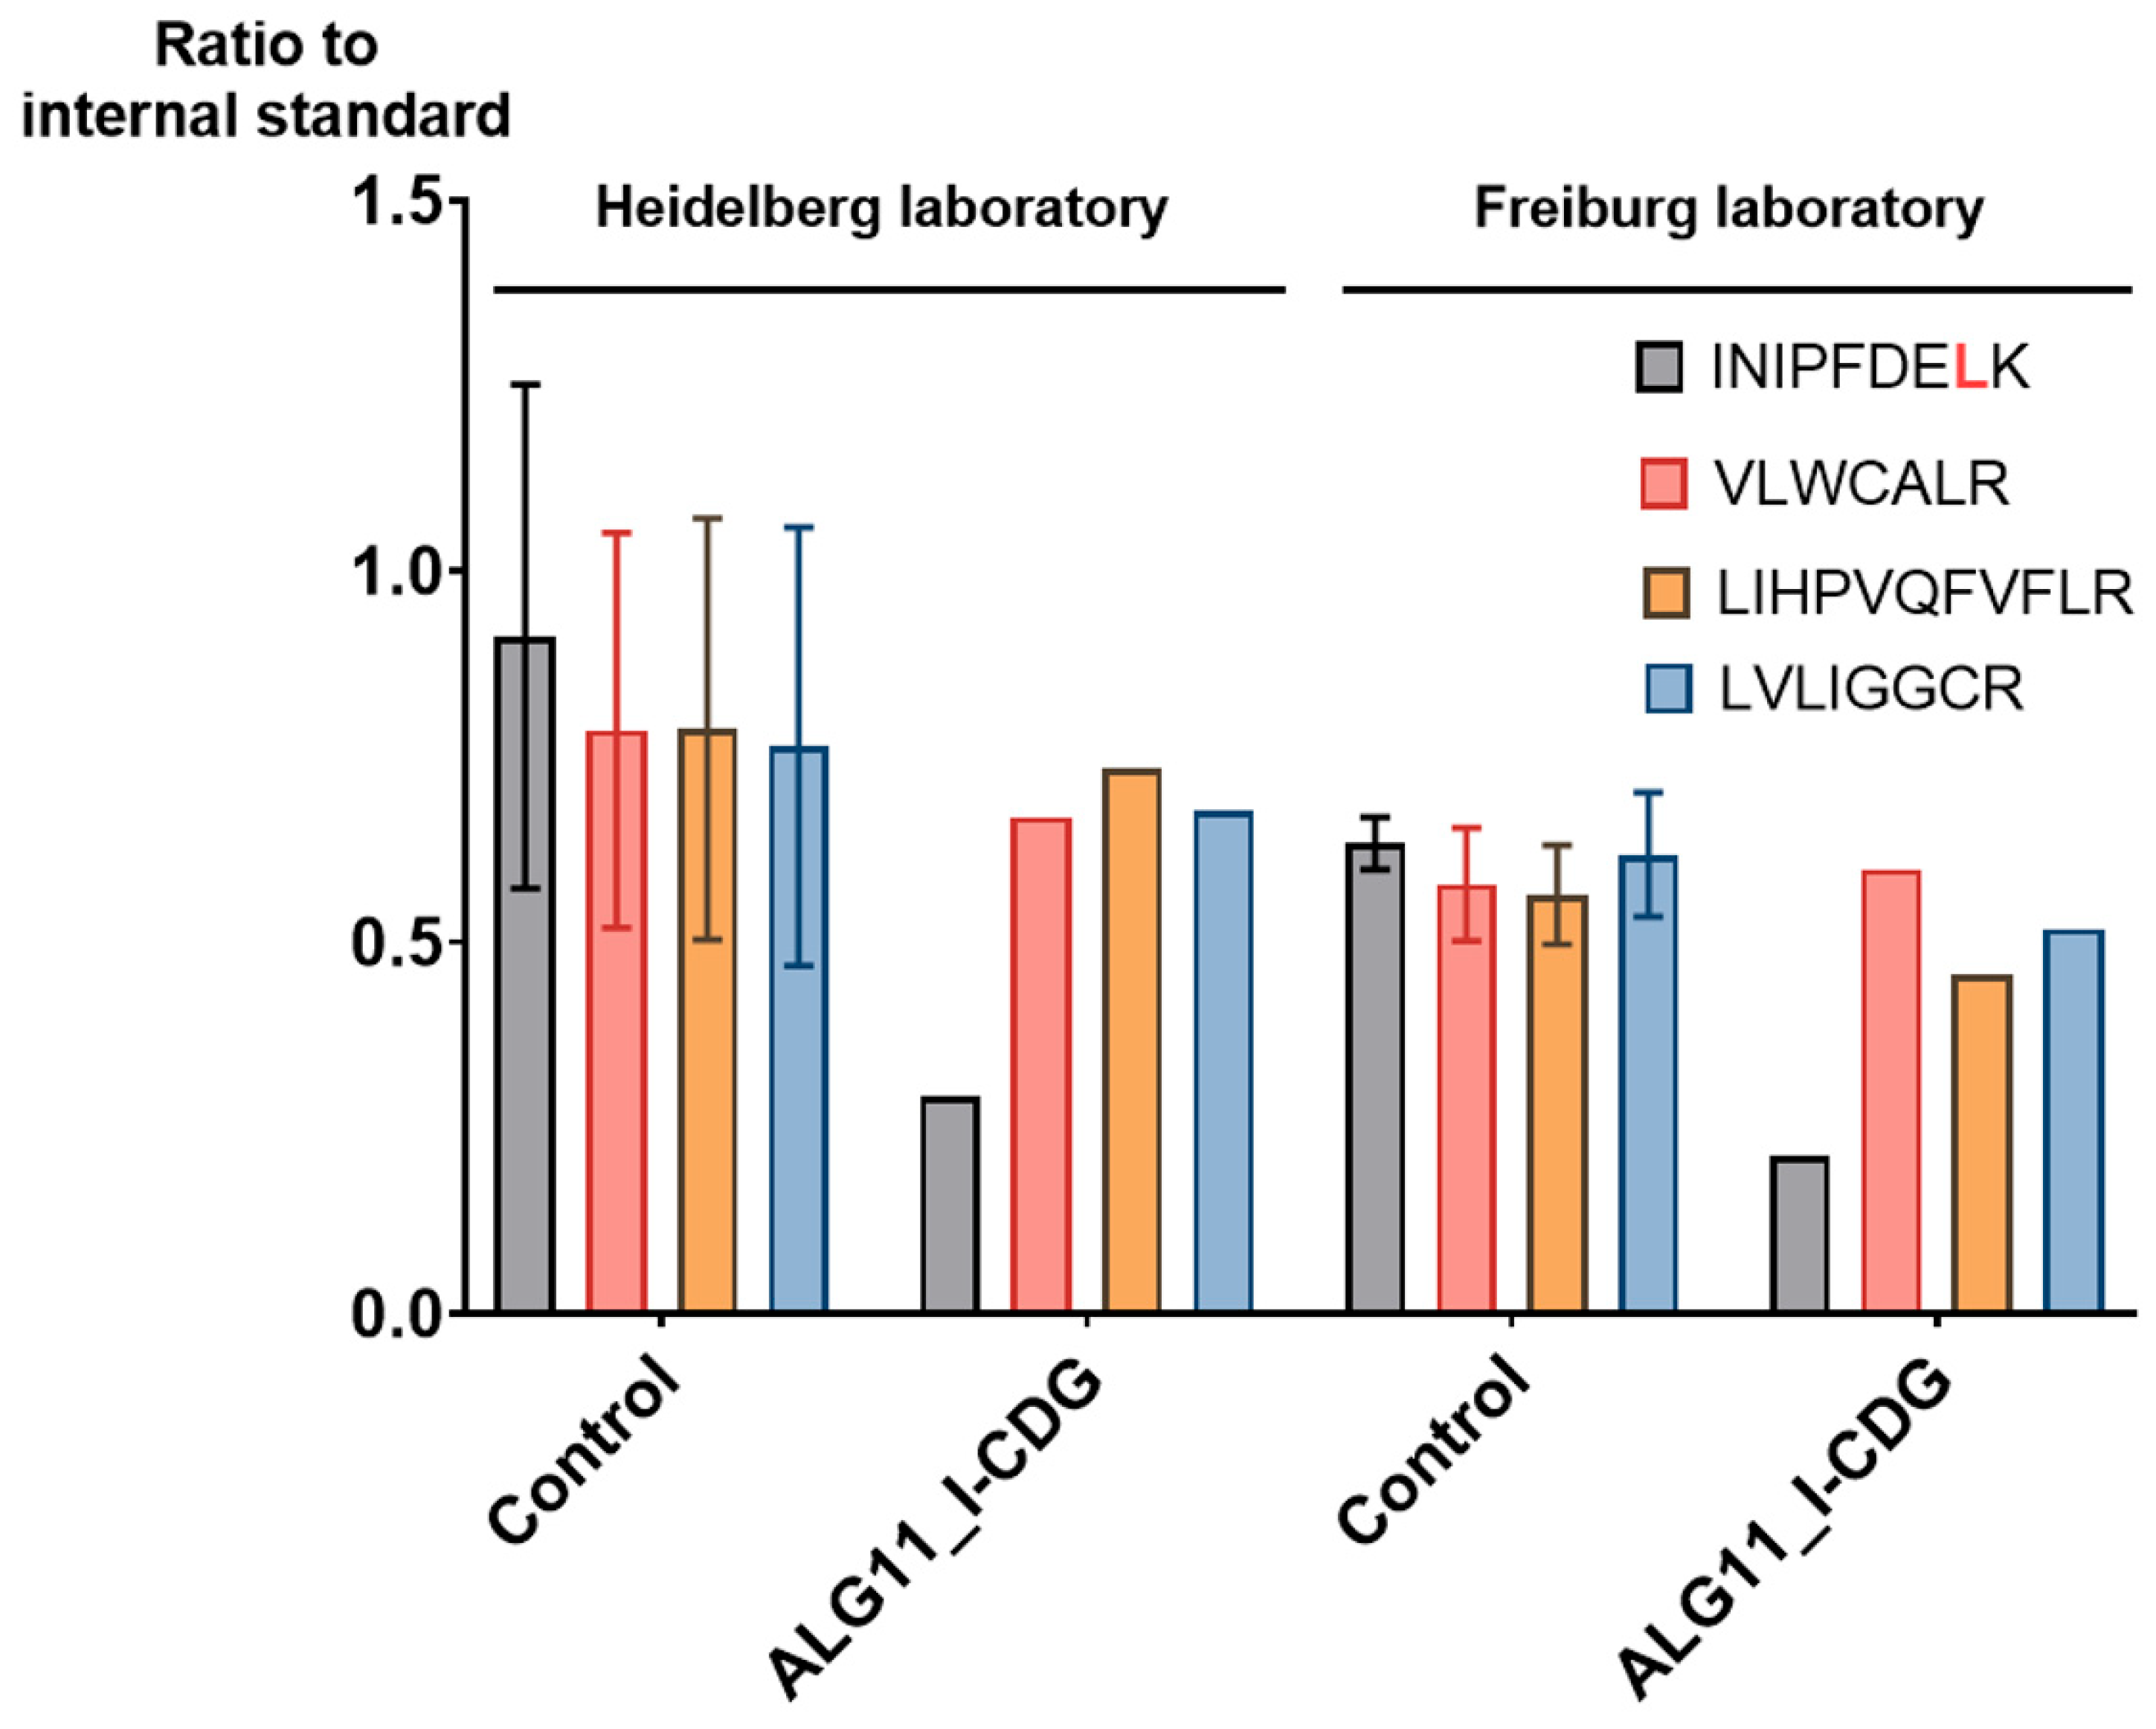
2.4. MRM Assay Results Were Easily Reproduced in a Cross-Laboratory Test
3. Discussion
4. Materials and Methods
4.1. Cell Culture and Protein Extraction
4.2. RNA Preparation and Nanostring/nCounter® Analysis
4.3. Western Blot Analysis
4.4. MRM Assay Development and Refinement
4.5. Sample Preparation and LC-MRM Measurements (Heidelberg)
4.6. Sample Preparation and LC-MRM Measurements (Freiburg)
4.7. LC-MRM Data and Statistical Analysis
Supplementary Materials
Author Contributions
Funding
Institutional Review Board Statement
Informed Consent Statement
Data Availability Statement
Acknowledgments
Conflicts of Interest
Abbreviations
References
- Jaeken, J. Congenital disorders of glycosylation. Ann. N. Y. Acad. Sci. 2010, 1214, 190–198. [Google Scholar] [CrossRef] [PubMed]
- Verheijen, J.; Tahata, S.; Kozicz, T.; Witters, P.; Morava, E. Therapeutic approaches in Congenital Disorders of Glycosylation (CDG) involving N-linked glycosylation: An update. Genet. Med. 2020, 22, 268–279. [Google Scholar] [CrossRef] [PubMed]
- Gao, X.D.; Nishikawa, A.; Dean, N. Physical interactions between the Alg1, Alg2, and Alg11 mannosyltransferases of the endoplasmic reticulum. Glycobiology 2004, 14, 559–570. [Google Scholar] [CrossRef] [PubMed]
- Takahashi, T.; Gao, X.-D. Physical Interactions among Human Glycosyltransferases Involved in Dolichol-Linked Oligosaccharide Biosynthesis. Trends Glycosci. Glycotechnol. 2012, 24, 65–77. [Google Scholar] [CrossRef]
- Maeda, Y.; Kinoshita, T. Dolichol-phosphate mannose synthase: Structure, function and regulation. Biochim. Biophys. Acta 2008, 1780, 861–868. [Google Scholar] [CrossRef]
- Aebi, M. N-linked protein glycosylation in the ER. Biochim. Biophys. Acta 2013, 1833, 2430–2437. [Google Scholar] [CrossRef]
- Buettner, F.F.; Ashikov, A.; Tiemann, B.; Lehle, L.; Bakker, H.C. elegans DPY-19 is a C-mannosyltransferase glycosylating thrombospondin repeats. Mol. Cell 2013, 50, 295–302. [Google Scholar] [CrossRef]
- Moremen, K.W.; Tiemeyer, M.; Nairn, A.V. Vertebrate protein glycosylation: Diversity, synthesis and function. Nat. Rev. Mol. Cell Biol. 2012, 13, 448–462. [Google Scholar] [CrossRef]
- Albuquerque-Wendt, A.; Hutte, H.J.; Buettner, F.F.R.; Routier, F.H.; Bakker, H. Membrane Topological Model of Glycosyltransferases of the GT-C Superfamily. Int. J. Mol. Sci. 2019, 20, 4842. [Google Scholar] [CrossRef]
- Picotti, P.; Aebersold, R. Selected reaction monitoring-based proteomics: Workflows, potential, pitfalls and future directions. Nat. Methods 2012, 9, 555–566. [Google Scholar] [CrossRef]
- Pino, L.K.; Searle, B.C.; Bollinger, J.G.; Nunn, B.; MacLean, B.; MacCoss, M.J. The Skyline ecosystem: Informatics for quantitative mass spectrometry proteomics. Mass Spectrom. Rev. 2020, 39, 229–244. [Google Scholar] [CrossRef] [PubMed]
- Escher, C.; Reiter, L.; MacLean, B.; Ossola, R.; Herzog, F.; Chilton, J.; MacCoss, M.J.; Rinner, O. Using iRT, a normalized retention time for more targeted measurement of peptides. Proteomics 2012, 12, 1111–1121. [Google Scholar] [CrossRef] [PubMed]
- Marsh, A.N.; Sharma, V.; Mani, S.K.; Vitek, O.; MacCoss, M.J.; MacLean, B.X. Skyline Batch: An Intuitive User Interface for Batch Processing with Skyline. J. Proteome Res. 2022, 21, 289–294. [Google Scholar] [CrossRef] [PubMed]
- Geiger, T.; Wisniewski, J.R.; Cox, J.; Zanivan, S.; Kruger, M.; Ishihama, Y.; Mann, M. Use of stable isotope labeling by amino acids in cell culture as a spike-in standard in quantitative proteomics. Nat. Protoc. 2011, 6, 147–157. [Google Scholar] [CrossRef]
- Albright, C.F.; Robbins, R.W. The sequence and transcript heterogeneity of the yeast gene ALG1, an essential mannosyltransferase involved in N-glycosylation. J. Biol. Chem. 1990, 265, 7042–7049. [Google Scholar] [CrossRef] [PubMed]
- Cipollo, J.F.; Trimble, R.B.; Chi, J.H.; Yan, Q.; Dean, N. The yeast ALG11 gene specifies addition of the terminal alpha 1,2-Man to the Man5GlcNAc2-PP-dolichol N-glycosylation intermediate formed on the cytosolic side of the endoplasmic reticulum. J. Biol. Chem. 2001, 276, 21828–21840. [Google Scholar] [CrossRef] [PubMed]
- Jackson, B.J.; Kukuruzinska, M.A.; Robbins, P. Biosynthesis of asparagine-linked oligosaccharides in Saccharomyces cerevisiae: The alg2 mutation. Glycobiology 1993, 3, 357–364. [Google Scholar] [CrossRef]
- Waas, M.; Bhattacharya, S.; Chuppa, S.; Wu, X.; Jensen, D.R.; Omasits, U.; Wollscheid, B.; Volkman, B.F.; Noon, K.R.; Gundry, R.L. Combine and conquer: Surfactants, solvents, and chaotropes for robust mass spectrometry based analyses of membrane proteins. Anal. Chem. 2014, 86, 1551–1559. [Google Scholar] [CrossRef]
- Omasits, U.; Ahrens, C.H.; Muller, S.; Wollscheid, B. Protter: Interactive protein feature visualization and integration with experimental proteomic data. Bioinformatics 2014, 30, 884–886. [Google Scholar] [CrossRef]
- Unwin, R.D.; Griffiths, J.R.; Whetton, A.D. A sensitive mass spectrometric method for hypothesis-driven detection of peptide post-translational modifications: Multiple reaction monitoring-initiated detection and sequencing (MIDAS). Nat. Protoc. 2009, 4, 870–877. [Google Scholar] [CrossRef]
- van Bentum, M.; Selbach, M. An Introduction to Advanced Targeted Acquisition Methods. Mol. Cell. Proteom. 2021, 20, 100165. [Google Scholar] [CrossRef]
- Sharma, V.; Eckels, J.; Schilling, B.; Ludwig, C.; Jaffe, J.D.; MacCoss, M.J.; MacLean, B. Panorama Public: A Public Repository for Quantitative Data Sets Processed in Skyline. Mol. Cell. Proteom. 2018, 17, 1239–1244. [Google Scholar] [CrossRef] [PubMed]
- Dupuis, A.; Hennekinne, J.A.; Garin, J.; Brun, V. Protein Standard Absolute Quantification (PSAQ) for improved investigation of staphylococcal food poisoning outbreaks. Proteomics 2008, 8, 4633–4636. [Google Scholar] [CrossRef] [PubMed]
- Avci, D.; Malchus, N.S.; Heidasch, R.; Lorenz, H.; Richter, K.; Nessling, M.; Lemberg, M.K. The intramembrane protease SPP impacts morphology of the endoplasmic reticulum by triggering degradation of morphogenic proteins. J. Biol. Chem. 2019, 294, 2786–2800. [Google Scholar] [CrossRef] [PubMed]
- Ng, B.G.; Freeze, H.H. Perspectives on Glycosylation and Its Congenital Disorders. Trends Genet. 2018, 34, 466–476. [Google Scholar] [CrossRef] [PubMed]
- Thiel, C.; Schwarz, M.; Peng, J.; Grzmil, M.; Hasilik, M.; Braulke, T.; Kohlschutter, A.; von Figura, K.; Lehle, L.; Korner, C. A new type of congenital disorders of glycosylation (CDG-Ii) provides new insights into the early steps of dolichol-linked oligosaccharide biosynthesis. J. Biol. Chem. 2003, 278, 22498–22505. [Google Scholar] [CrossRef]
- Thiel, C.; Rind, N.; Popovici, D.; Hoffmann, G.F.; Hanson, K.; Conway, R.L.; Adamski, C.R.; Butler, E.; Scanlon, R.; Lambert, M.; et al. Improved diagnostics lead to identification of three new patients with congenital disorder of glycosylation-Ip. Hum. Mutat. 2012, 33, 485–487. [Google Scholar] [CrossRef] [PubMed]
- Mueller, S.; Wahlander, A.; Selevsek, N.; Otto, C.; Ngwa, E.M.; Poljak, K.; Frey, A.D.; Aebi, M.; Gauss, R. Protein degradation corrects for imbalanced subunit stoichiometry in OST complex assembly. Mol. Biol. Cell 2015, 26, 2596–2608. [Google Scholar] [CrossRef]
- Bantscheff, M.; Lemeer, S.; Savitski, M.M.; Kuster, B. Quantitative mass spectrometry in proteomics: Critical review update from 2007 to the present. Anal. Bioanal. Chem. 2012, 404, 939–965. [Google Scholar] [CrossRef]
- Peanne, R.; de Lonlay, P.; Foulquier, F.; Kornak, U.; Lefeber, D.J.; Morava, E.; Perez, B.; Seta, N.; Thiel, C.; Van Schaftingen, E.; et al. Congenital disorders of glycosylation (CDG): Quo vadis? Eur. J. Med. Genet. 2018, 61, 643–663. [Google Scholar] [CrossRef]
- Cossins, J.; Belaya, K.; Hicks, D.; Salih, M.A.; Finlayson, S.; Carboni, N.; Liu, W.W.; Maxwell, S.; Zoltowska, K.; Farsani, G.T.; et al. Congenital myasthenic syndromes due to mutations in ALG2 and ALG14. Brain 2013, 136, 944–956. [Google Scholar] [CrossRef] [PubMed]
- Monies, D.M.; Al-Hindi, H.N.; Al-Muhaizea, M.A.; Jaroudi, D.J.; Al-Younes, B.; Naim, E.A.; Wakil, S.M.; Meyer, B.F.; Bohlega, S. Clinical and pathological heterogeneity of a congenital disorder of glycosylation manifesting as a myasthenic/myopathic syndrome. Neuromuscul. Disord. 2014, 24, 353–359. [Google Scholar] [CrossRef]
- Papazoglu, G.M.; Cubilla, M.; Pereyra, M.; de Kremer, R.D.; Perez, B.; Sturiale, L.; Asteggiano, C.G. Mass spectrometry glycophenotype characterization of ALG2-CDG in Argentinean patients with a new genetic variant in homozygosis. Glycoconj. J. 2021, 38, 191–200. [Google Scholar] [CrossRef] [PubMed]
- Ong, S.E.; Blagoev, B.; Kratchmarova, I.; Kristensen, D.B.; Steen, H.; Pandey, A.; Mann, M. Stable isotope labeling by amino acids in cell culture, SILAC, as a simple and accurate approach to expression proteomics. Mol. Cell. Proteom. 2002, 1, 376–386. [Google Scholar]
- MacLean, B.; Tomazela, D.M.; Shulman, N.; Chambers, M.; Finney, G.L.; Frewen, B.; Kern, R.; Tabb, D.L.; Liebler, D.C.; MacCoss, M.J. Skyline: An open source document editor for creating and analyzing targeted proteomics experiments. Bioinformatics 2010, 26, 966–968. [Google Scholar] [CrossRef] [PubMed]
- MacLean, B.; Tomazela, D.M.; Abbatiello, S.E.; Zhang, S.; Whiteaker, J.R.; Paulovich, A.G.; Carr, S.A.; Maccoss, M.J. Effect of collision energy optimization on the measurement of peptides by selected reaction monitoring (SRM) mass spectrometry. Anal. Chem. 2010, 82, 10116–10124. [Google Scholar] [CrossRef] [PubMed]
- Wessel, D.; Flugge, U.I. A method for the quantitative recovery of protein in dilute solution in the presence of detergents and lipids. Anal. Biochem. 1984, 138, 141–143. [Google Scholar] [CrossRef]
- Rappsilber, J.; Mann, M.; Ishihama, Y. Protocol for micro-purification, enrichment, pre-fractionation and storage of peptides for proteomics using StageTips. Nat. Protoc. 2007, 2, 1896–1906. [Google Scholar] [CrossRef]
- Kovalchuk, S.I.; Jensen, O.N.; Rogowska-Wrzesinska, A. FlashPack: Fast and Simple Preparation of Ultrahigh-performance Capillary Columns for LC-MS. Mol. Cell. Proteom. 2019, 18, 383–390. [Google Scholar] [CrossRef]
- R Development Core Team. R: A Language and Environment for Statistical Computing; R Foundation for Statistical Computing: Vienna, Austria, 2018. [Google Scholar]
- Itzhak, D.N.; Tyanova, S.; Cox, J.; Borner, G.H. Global, quantitative and dynamic mapping of protein subcellular localization. eLife 2016, 5, e16950. [Google Scholar] [CrossRef]
- Benjamini, Y.; Hochberg, Y. Controlling the False Discovery Rate: A Practical and Powerful Approach to Multiple Testing. J. R. Stat. Soc. Ser. B 1995, 57, 289–300. [Google Scholar]
- Choi, M.; Chang, C.Y.; Clough, T.; Broudy, D.; Killeen, T.; MacLean, B.; Vitek, O. MSstats: An R package for statistical analysis of quantitative mass spectrometry-based proteomic experiments. Bioinformatics 2014, 30, 2524–2526. [Google Scholar] [CrossRef] [PubMed]
- UniProt Consortium. UniProt: The Universal Protein Knowledgebase in 2023. Nucleic Acids Res. 2022, 51, D523–D531. [Google Scholar] [CrossRef]
- Kusebauch, U.; Campbell, D.S.; Deutsch, E.W.; Chu, C.S.; Spicer, D.A.; Brusniak, M.Y.; Slagel, J.; Sun, Z.; Stevens, J.; Grimes, B.; et al. Human SRMAtlas: A Resource of Targeted Assays to Quantify the Complete Human Proteome. Cell 2016, 166, 766–778. [Google Scholar] [CrossRef]
- Eyers, C.E.; Lawless, C.; Wedge, D.C.; Lau, K.W.; Gaskell, S.J.; Hubbard, S.J. CONSeQuence: Prediction of reference peptides for absolute quantitative proteomics using consensus machine learning approaches. Mol. Cell. Proteom. 2011, 10, M110.003384. [Google Scholar] [CrossRef]


| Protein Class | Gene Name (UniProtKB Accession Number) |
|---|---|
| N-glycosylation | ALG7 (Q9H3H5); ALG13 (Q9NP73-2); ALG14 (Q96F25); ALG1 (Q9BT22); ALG2 (Q9H553); ALG11 (Q2TAA5); RFT1 (Q96AA3); ALG3 (Q92685); ALG9 (Q9H6U8); ALG12 (Q9BV10); ALG5 (Q9Y673); ALG6 (Q9Y672); ALG8 (Q9BVK2); ALG10 (Q5BKT4 or Q5I7T1); RPN1 (P04843); STT3A (P46977); STT3B (Q8TCJ2) |
| O-mannosylation | POMT1 (Q9Y6A1-2); POMT2 (Q9UKY4); TMTC1 (Q8IUR5); TMTC2 (Q8N394); TMTC3 (Q6ZXV5); TMTC4 (Q5T4D3) |
| C-mannosylation | DPY19L1 (A0A1B0GW05); DPY19L3 (Q6ZPD9); DPY19L4 (Q7Z388) |
| Dol-P-Man synthesis | DPM1 (O60762); DPM3 (Q9P2X0-2) |
| Nucleotide-activated sugars | PMM2 (O15305) |
| Housekeeping | SEC63 (Q9UGP8) |
| CDG | Number of Patients | Mutation |
|---|---|---|
| ALG1-CDG | 3 | homozygous c.C773T, p.S258L |
| ALG2-CDG | 1 | heterozygous c.1040delG p.G347VfsX26 c.G393T p.() |
| ALG11_I-CDG | 1 | heterozygous c.1142T > C/p.L381S and c.1192G > A/p.E398K |
| ALG11_II-CDG | 3 | homozygous c.A953C, p.Q318P; homozygous c.T257C, p.L86S heterozygous c.A836C p.Y279S and c.del623- 642; |
Disclaimer/Publisher’s Note: The statements, opinions and data contained in all publications are solely those of the individual author(s) and contributor(s) and not of MDPI and/or the editor(s). MDPI and/or the editor(s) disclaim responsibility for any injury to people or property resulting from any ideas, methods, instructions or products referred to in the content. |
© 2024 by the authors. Licensee MDPI, Basel, Switzerland. This article is an open access article distributed under the terms and conditions of the Creative Commons Attribution (CC BY) license (https://creativecommons.org/licenses/by/4.0/).
Share and Cite
Sakson, R.; Beedgen, L.; Bernhard, P.; Alp, K.M.; Lübbehusen, N.; Röth, R.; Niesler, B.; Luzarowski, M.; Shevchuk, O.; Mayer, M.P.; et al. Targeted Proteomics Reveals Quantitative Differences in Low-Abundance Glycosyltransferases of Patients with Congenital Disorders of Glycosylation. Int. J. Mol. Sci. 2024, 25, 1191. https://doi.org/10.3390/ijms25021191
Sakson R, Beedgen L, Bernhard P, Alp KM, Lübbehusen N, Röth R, Niesler B, Luzarowski M, Shevchuk O, Mayer MP, et al. Targeted Proteomics Reveals Quantitative Differences in Low-Abundance Glycosyltransferases of Patients with Congenital Disorders of Glycosylation. International Journal of Molecular Sciences. 2024; 25(2):1191. https://doi.org/10.3390/ijms25021191
Chicago/Turabian StyleSakson, Roman, Lars Beedgen, Patrick Bernhard, K. Merve Alp, Nicole Lübbehusen, Ralph Röth, Beate Niesler, Marcin Luzarowski, Olga Shevchuk, Matthias P. Mayer, and et al. 2024. "Targeted Proteomics Reveals Quantitative Differences in Low-Abundance Glycosyltransferases of Patients with Congenital Disorders of Glycosylation" International Journal of Molecular Sciences 25, no. 2: 1191. https://doi.org/10.3390/ijms25021191