
Identification and Validation of a Prognostic Signature Derived from the Cancer Stem Cells for Oral Squamous Cell Carcinoma
 , ,
, ,
Abstract
:
1. Introduction
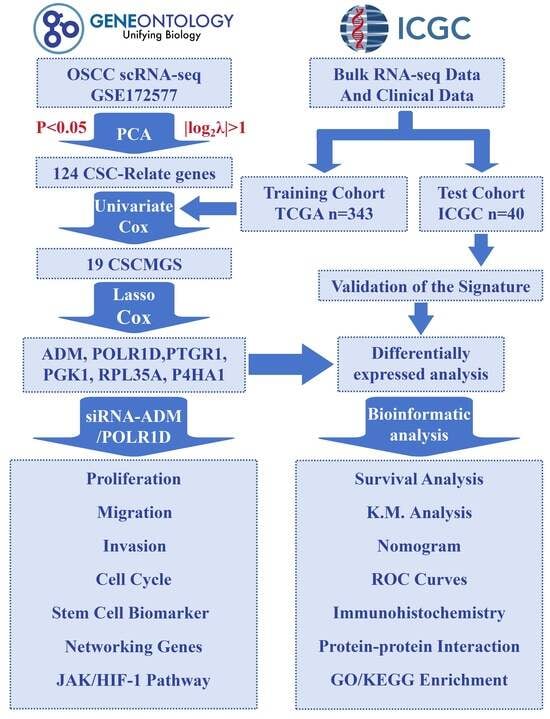
2. Results
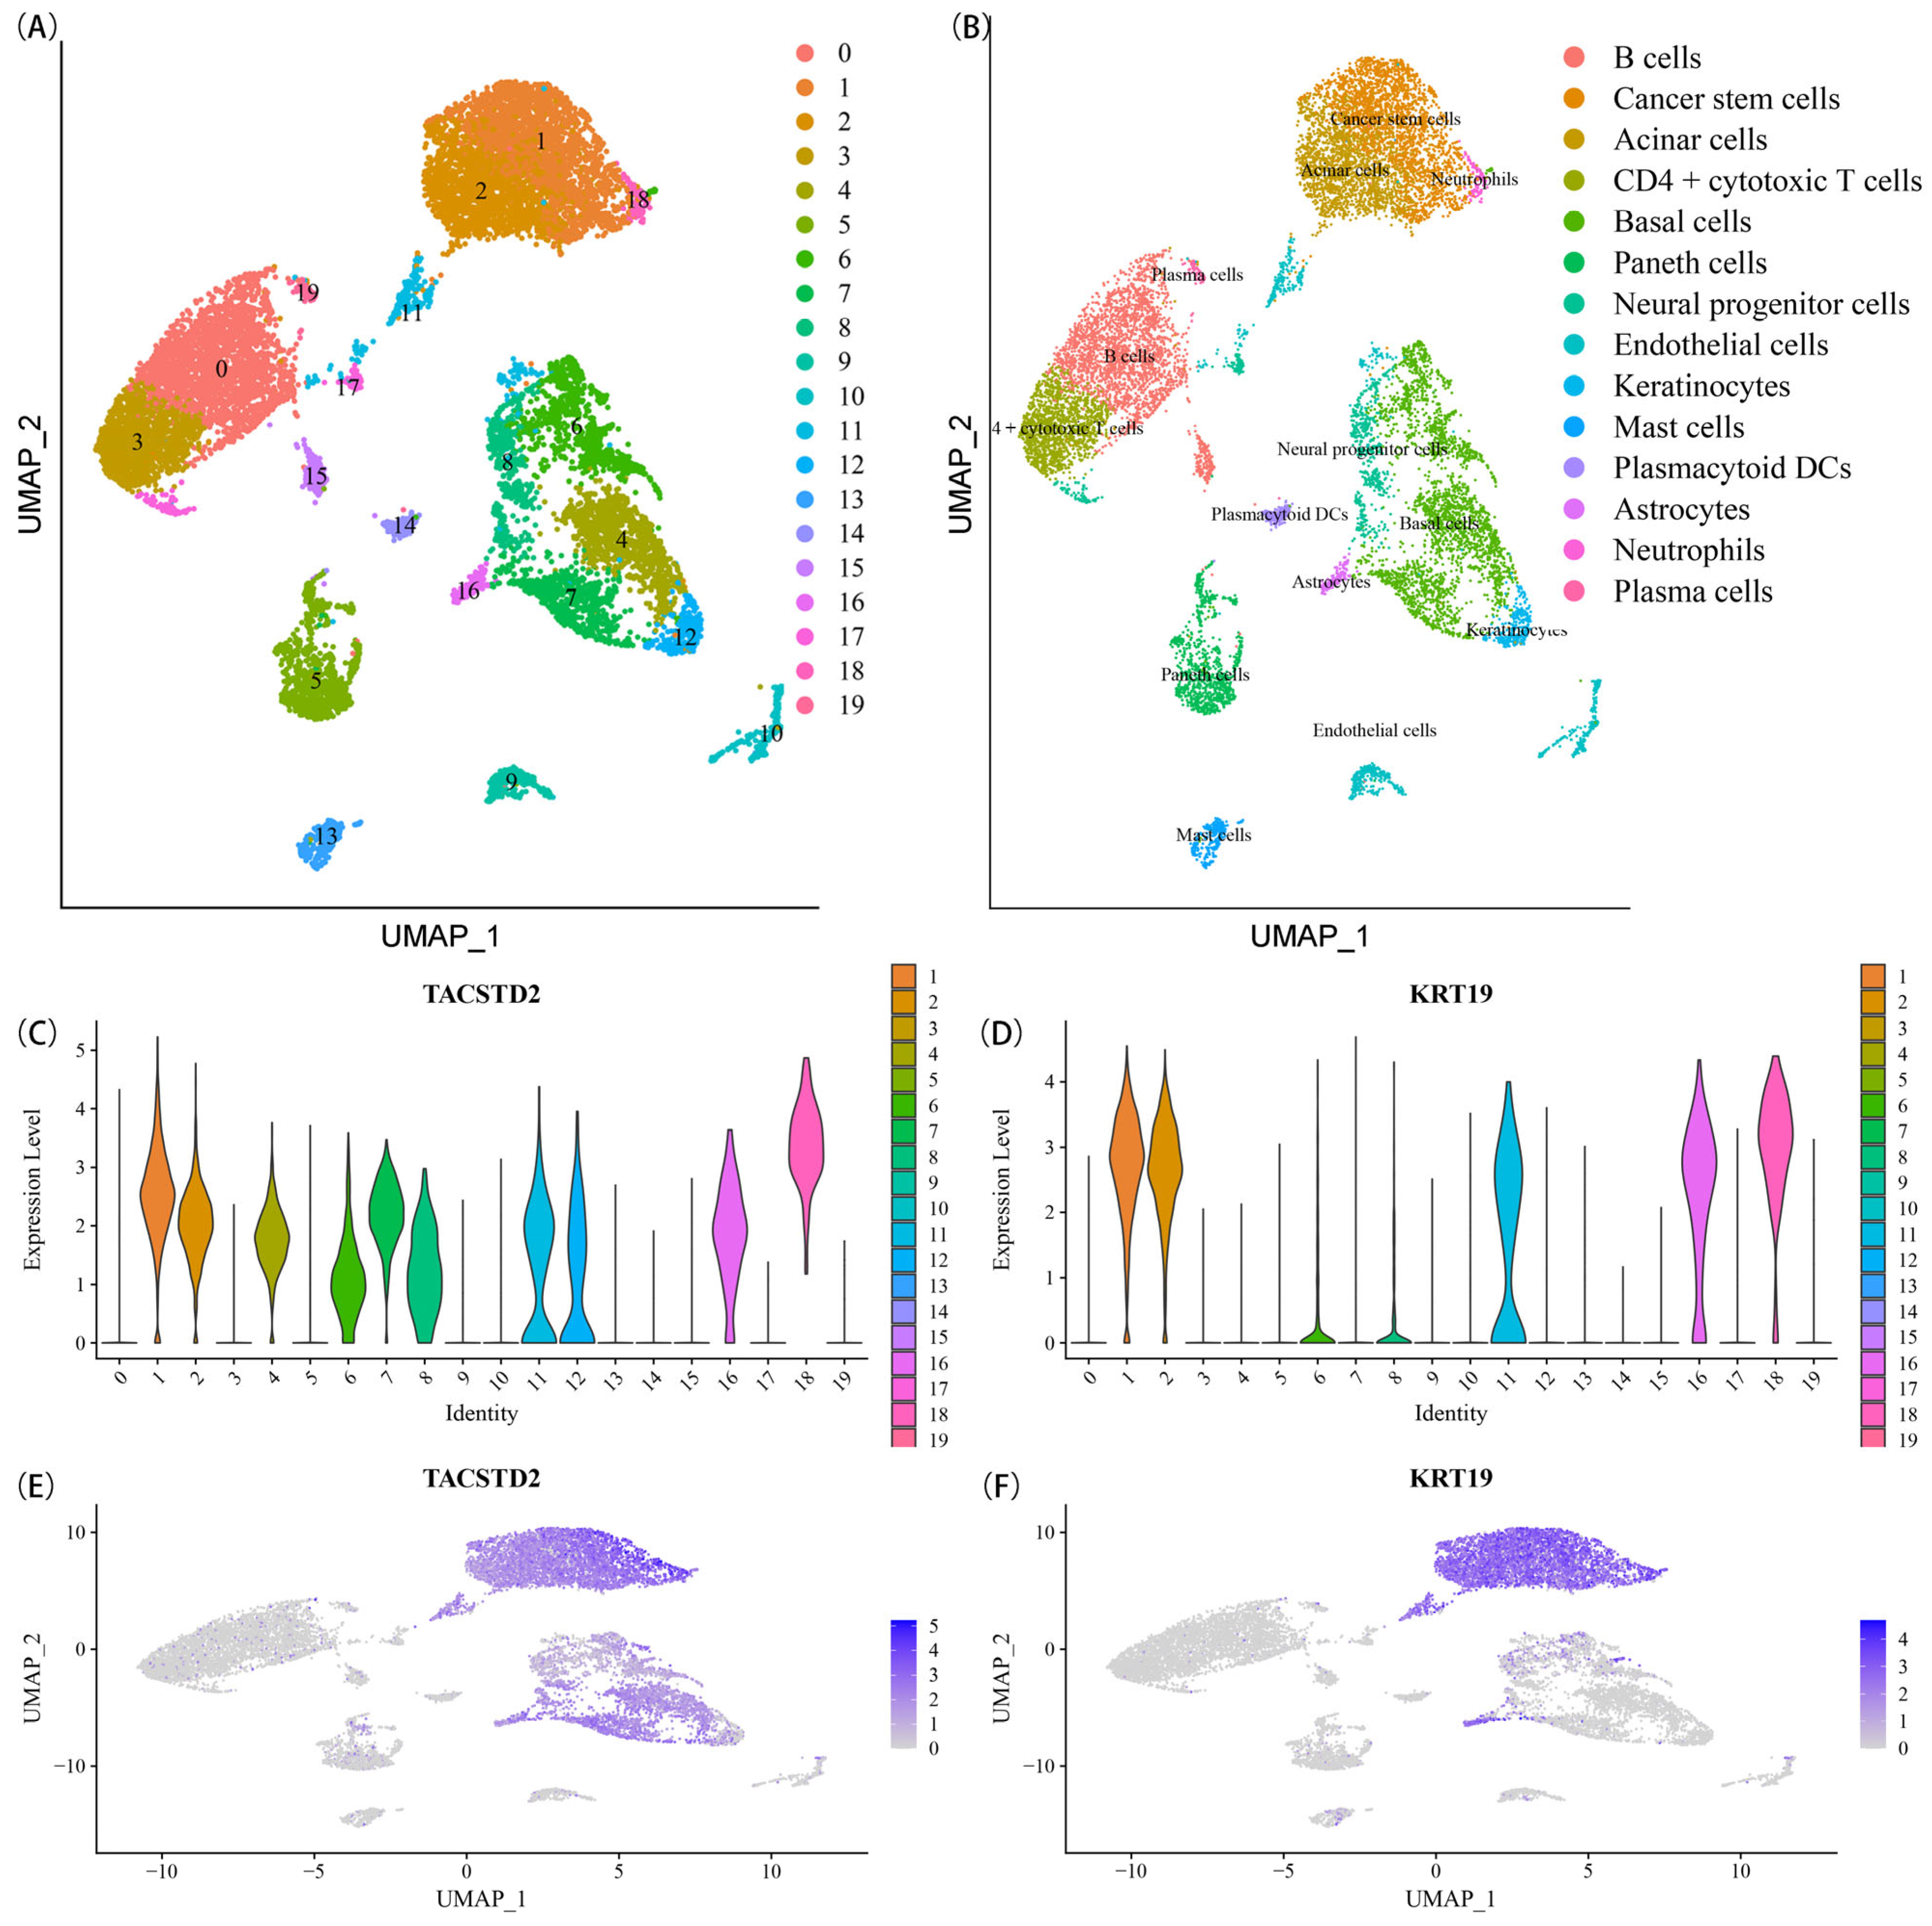
2.1. Identification of CSCMGs Expression Profiles
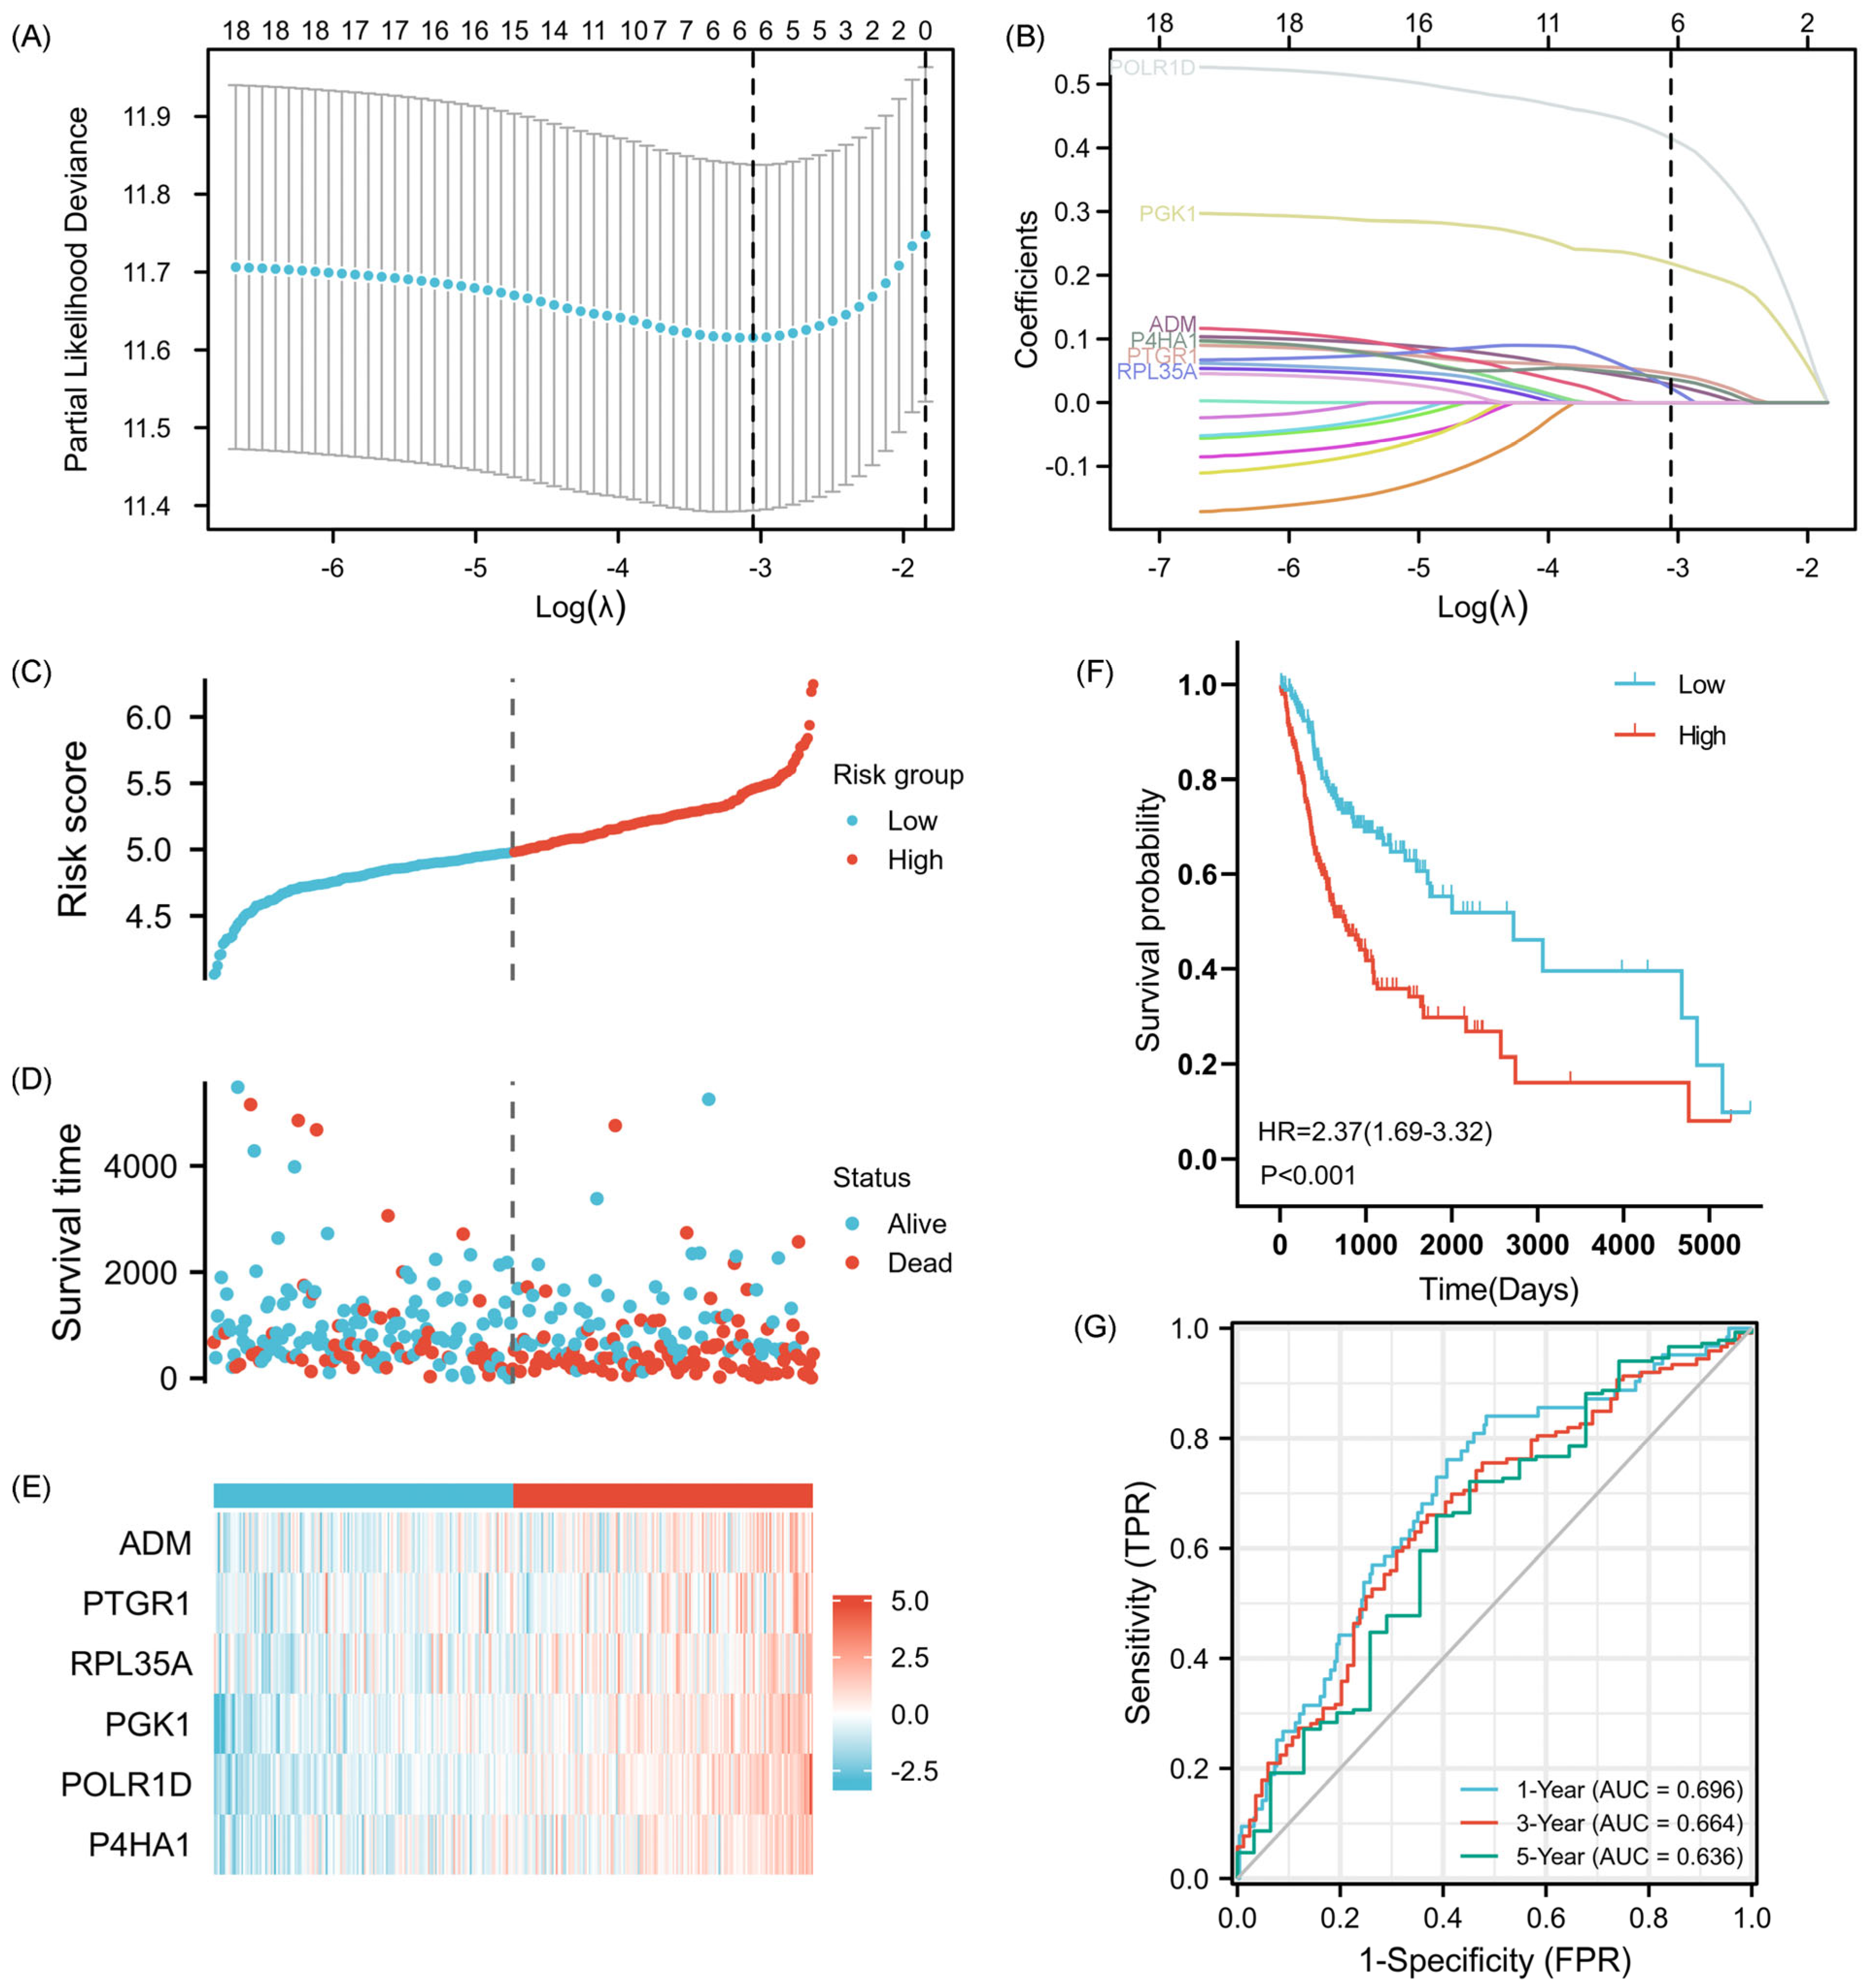
2.2. Establishment of the 6-GPS Based on CSCMGs
2.3. Construction and Assessment of Nomogram
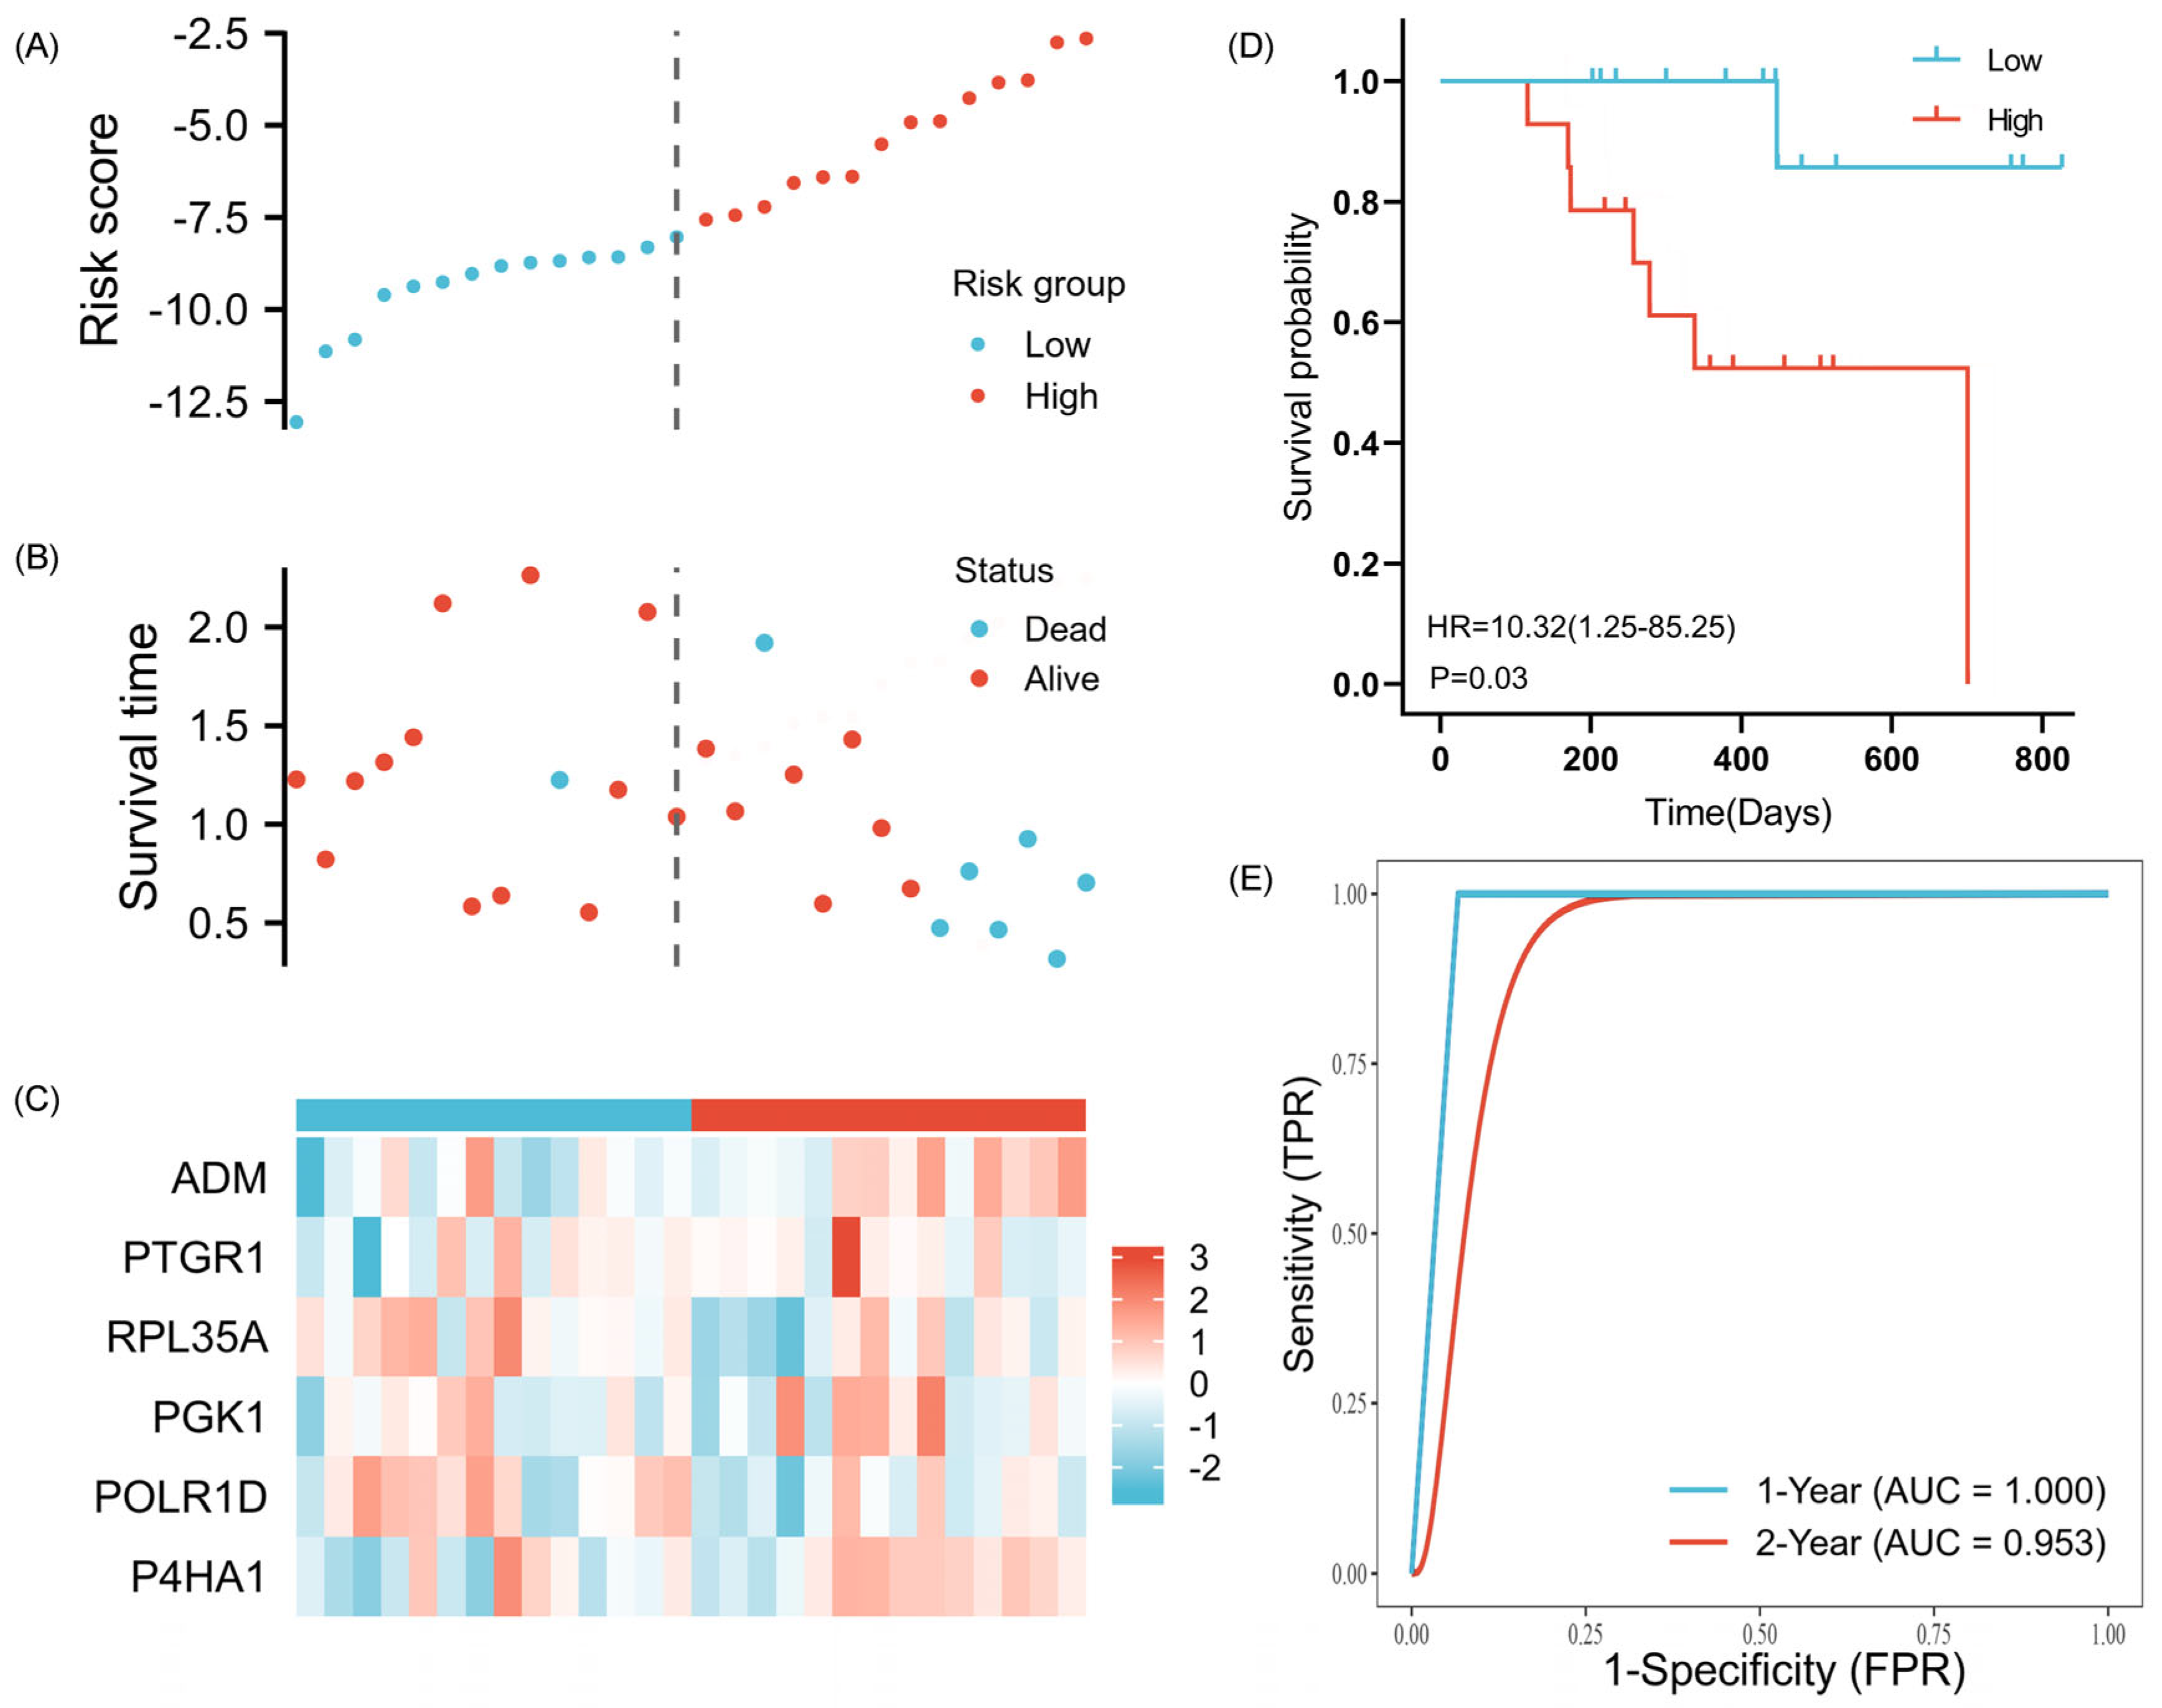
2.4. Validation of the Prognostic Signature
2.5. Expression Levels of 6-GPS
2.6. Analysis of the Functional Characteristics of 6-GPS
2.7. Inhibition of OSCC Cell Proliferation, Migration, and Invasion upon ADM and POLR1D Genes Knockdown
2.8. The Mechanistic Role of ADM and POLR1D in OSCC Cells
3. Discussion
4. Materials and Methods
4.1. Data Download and Preprocessing
4.2. Identification of CSCs Marker Genes by scRNA-seq Analysis
4.3. Construction of 6-GPS Based on CSCMGs
4.4. Development of a Prognostic Nomogram and Assessment of Its Predictive Performance
4.5. Validation of the Prognostic Signature
4.6. Pathway and Function Enrichment Analysis
4.7. Correlation between ADM/POLR1D and the Cellular Response to Hypoxia
4.8. Cell Culture and Transfection
4.9. RT-qPCR
4.10. Cell Proliferation Assay
4.11. Cellular Migration and Invasion Assays
4.12. Flow Cytometry Assay
4.13. Western Blot Analysis
4.14. Statistical Analysis
Supplementary Materials
Author Contributions
Funding
Institutional Review Board Statement
Informed Consent Statement
Data Availability Statement
Acknowledgments
Conflicts of Interest
References
- Fan, T.; Wang, X.; Zhang, S.; Deng, P.; Jiang, Y.; Liang, Y.; Jie, S.; Wang, Q.; Li, C.; Tian, G.; et al. NUPR1 promotes the proliferation and metastasis of oral squamous cell carcinoma cells by activating TFE3-dependent autophagy. Signal Transduct. Target. Ther. 2022, 7, 130. [Google Scholar] [CrossRef] [PubMed]
- Peña-Oyarzún, D.; Reyes, M.; Hernández-Cáceres, M.; Kretschmar, C.; Morselli, E.; Ramirez-Sarmiento, C.; Lavandero, S.; Torres, V.; Criollo, A. Role of Autophagy in the Microenvironment of Oral Squamous Cell Carcinoma. Front. Oncol. 2020, 10, 602661. [Google Scholar] [CrossRef] [PubMed]
- Warnakulasuriya, S. Global epidemiology of oral and oropharyngeal cancer. Oral. Oncol. 2009, 45, 309–316. [Google Scholar] [CrossRef] [PubMed]
- Wang, J.; Wang, Y.; Kong, F.; Han, R.; Song, W.; Chen, D.; Bu, L.; Wang, S.; Yue, J.; Ma, L. Identification of a six-gene prognostic signature for oral squamous cell carcinoma. J. Cell Physiol. 2020, 235, 3056–3068. [Google Scholar] [CrossRef] [PubMed]
- Sung, H.; Ferlay, J.; Siegel, R.; Laversanne, M.; Soerjomataram, I.; Jemal, A.; Bray, F. Global Cancer Statistics 2020: GLOBOCAN Estimates of Incidence and Mortality Worldwide for 36 Cancers in 185 Countries. CA Cancer J. Clin. 2021, 71, 209–249. [Google Scholar] [CrossRef] [PubMed]
- Cao, M.; Shi, E.; Wang, H.; Mao, L.; Wu, Q.; Li, X.; Liang, Y.; Yang, X.; Wang, Y.; Li, C. Personalized Targeted Therapeutic Strategies against Oral Squamous Cell Carcinoma. An Evidence-Based Review of Literature. Int. J. Nanomed. 2022, 17, 4293–4306. [Google Scholar] [CrossRef] [PubMed]
- Fan, H.; Zhu, Z.; Zhang, W.; Yin, Y.; Tang, Y.; Liang, X.; Zhang, L. Light stimulus responsive nanomedicine in the treatment of oral squamous cell carcinoma. Eur. J. Med. Chem. 2020, 199, 112394. [Google Scholar] [CrossRef] [PubMed]
- Cao, L.; Wu, Y.; Shan, Y.; Tan, B.; Liao, J. A review: Potential application and outlook of photothermal therapy in oral cancer treatment. Biomed. Mater. 2022, 17, 022008. [Google Scholar] [CrossRef]
- Shi, F.; Luo, D.; Zhou, X.; Sun, Q.; Shen, P.; Wang, S. Combined effects of hyperthermia and chemotherapy on the regulate autophagy of oral squamous cell carcinoma cells under a hypoxic microenvironment. Cell Death Discov. 2021, 7, 227. [Google Scholar] [CrossRef]
- Gebremedhin, S.; Singh, A.; Koons, S.; Bernt, W.; Konopka, K.; Duzgunes, N. Gene delivery to carcinoma cells via novel non-viral vectors: Nanoparticle tracking analysis and suicide gene therapy. Eur. J. Pharm. Sci. Off. J. Eur. Fed. Pharm. Sci. 2014, 60, 72–79. [Google Scholar] [CrossRef]
- Rogers, S.; Brown, J.; Woolgar, J.; Lowe, D.; Magennis, P.; Shaw, R.; Sutton, D.; Errington, D.; Vaughan, D. Survival following primary surgery for oral cancer. Oral. Oncol. 2009, 45, 201–211. [Google Scholar] [CrossRef] [PubMed]
- Metsäniitty, M.; Hasnat, S.; Salo, T.; Salem, A. Oral Microbiota-A New Frontier in the Pathogenesis and Management of Head and Neck Cancers. Cancers 2021, 14, 46. [Google Scholar] [CrossRef]
- Fukumoto, C.; Uchida, D.; Kawamata, H. Diversity of the Origin of Cancer Stem Cells in Oral Squamous Cell Carcinoma and Its Clinical Implications. Cancers 2022, 14, 3588. [Google Scholar] [CrossRef]
- Amôr, N.; Buzo, R.; Ortiz, R.; Lopes, N.; Saito, L.; Mackenzie, I.; Rodini, C. In vitro and in vivo characterization of cancer stem cell subpopulations in oral squamous cell carcinoma. J. Oral Pathol. Med. 2021, 50, 52–59. [Google Scholar] [CrossRef] [PubMed]
- Bao, S.; Wu, Q.; McLendon, R.; Hao, Y.; Shi, Q.; Hjelmeland, A.; Dewhirst, M.; Bigner, D.; Rich, J. Glioma stem cells promote radioresistance by preferential activation of the DNA damage response. Nature 2006, 444, 756–760. [Google Scholar] [CrossRef] [PubMed]
- Pavlopoulou, A.; Oktay, Y.; Vougas, K.; Louka, M.; Vorgias, C.; Georgakilas, A. Determinants of resistance to chemotherapy and ionizing radiation in breast cancer stem cells. Cancer Lett. 2016, 380, 485–493. [Google Scholar] [CrossRef]
- Abad, E.; Graifer, D.; Lyakhovich, A. DNA damage response and resistance of cancer stem cells. Cancer Lett. 2020, 474, 106–117. [Google Scholar] [CrossRef]
- Sistigu, A.; Musella, M.; Galassi, C.; Vitale, I.; De Maria, R. Tuning Cancer Fate: Tumor Microenvironment’s Role in Cancer Stem Cell Quiescence and Reawakening. Front. Immunol. 2020, 11, 2166. [Google Scholar] [CrossRef]
- Lequerica-Fernández, P.; Suárez-Canto, J.; Rodriguez-Santamarta, T.; Rodrigo, J.P.; Suárez-Sánchez, F.J.; Blanco-Lorenzo, V.; Domínguez-Iglesias, F.; García-Pedrero, J.M.; de Vicente, J.C. Prognostic Relevance of CD4+, CD8+ and FOXP3+ TILs in Oral Squamous Cell Carcinoma and Correlations with PD-L1 and Cancer Stem Cell Markers. Biomedicines 2021, 9, 653. [Google Scholar] [CrossRef]
- Venugopal, D.C.; Caleb, C.L.; Kirupakaran, N.P.; Shyamsundar, V.; Ravindran, S.; Yasasve, M.; Krishnamurthy, A.; Harikrishnan, T.; Sankarapandian, S.; Ramshankar, V. Clinicopathological Significance of Cancer Stem Cell Markers (OCT-3/4 and SOX-2) in Oral Submucous Fibrosis and Oral Squamous Cell Carcinoma. Biomedicines 2023, 11, 1040. [Google Scholar] [CrossRef]
- Varun, B.R.; Jayanthi, P.; Ramani, P. Cancer stem cells: A comprehensive review on identification and therapeutic implications. J. Oral Maxillofac. Pathol. 2020, 24, 190. [Google Scholar] [PubMed]
- Han, Y.K.; Park, H.Y.; Park, S.-G.; Hwang, J.J.; Park, H.R.; Yi, J.M. Promoter Methylation of Cancer Stem Cell Surface Markers as an Epigenetic Biomarker for Prognosis of Oral Squamous Cell Carcinoma. Int. J. Mol. Sci. 2022, 23, 14624. [Google Scholar] [CrossRef] [PubMed]
- Wan, S.; Moure, U.A.E.; Liu, R.; Liu, C.; Wang, K.; Deng, L.; Liang, P.; Cui, H. Combined bulk RNA-seq and single-cell RNA-seq identifies a necroptosis-related prognostic signature associated with inhibitory immune microenvironment in glioma. Front. Immunol. 2022, 13, 1013094. [Google Scholar] [CrossRef]
- Lin, V.C.; Huang, S.-P.; Huang, C.-Y.; Yu, C.-C.; Yin, H.-L.; Huang, T.-Y.; Lee, C.-H.; Lu, T.-L.; Bao, B.-Y. Cancer Stem Cell Gene Variants Predict Disease Recurrence in Patients Treated with Radical Prostatectomy for Prostate Cancer. Int. J. Med. Sci. 2017, 14, 1301–1306. [Google Scholar] [CrossRef] [PubMed]
- Kawai, T.; Yasuchika, K.; Ishii, T.; Katayama, H.; Yoshitoshi, E.Y.; Ogiso, S.; Kita, S.; Yasuda, K.; Fukumitsu, K.; Mizumoto, M.; et al. Keratin 19, a Cancer Stem Cell Marker in Human Hepatocellular Carcinoma. Clin. Cancer Res. 2015, 21, 3081–3091. [Google Scholar] [CrossRef]
- Pindiprolu, S.H.; Pindiprolu, S.K.S.S. CD133 receptor mediated delivery of STAT3 inhibitor for simultaneous elimination of cancer cells and cancer stem cells in oral squamous cell carcinoma. Med. Hypotheses 2019, 129, 109241. [Google Scholar] [CrossRef] [PubMed]
- Grimm, M.; Krimmel, M.; Polligkeit, J.; Alexander, D.; Munz, A.; Kluba, S.; Keutel, C.; Hoffmann, J.; Reinert, S.; Hoefert, S. ABCB5 expression and cancer stem cell hypothesis in oral squamous cell carcinoma. Eur. J. Cancer 2012, 48, 3186–3197. [Google Scholar] [CrossRef]
- Ohnishi, Y.; Yasui, H.; Nozaki, M.; Nakajima, M. Molecularly-targeted therapy for the oral cancer stem cells. Jpn. Dent. Sci. Rev. 2018, 54, 88–103. [Google Scholar] [CrossRef]
- Wu, L.; Yang, J.; She, P.; Kong, F.; Mao, Z.; Wang, S. Single-cell RNA sequencing and traditional RNA sequencing reveals the role of cancer-associated fibroblasts in oral squamous cell carcinoma cohort. Front. Oncol. 2023, 13, 1195520. [Google Scholar] [CrossRef]
- Hinson, J.P.; Kapas, S.; Smith, D.M. Adrenomedullin, a multifunctional regulatory peptide. Endocr. Rev. 2000, 21, 138–167. [Google Scholar]
- Liu, L.-L.; Chen, S.-L.; Huang, Y.-H.; Yang, X.; Wang, C.-H.; He, J.-H.; Yun, J.-P.; Luo, R.-Z. Adrenomedullin inhibits tumor metastasis and is associated with good prognosis in triple-negative breast cancer patients. Am. J. Transl. Res. 2020, 12, 773–786. [Google Scholar]
- Dai, K.; Tanaka, M.; Kamiyoshi, A.; Sakurai, T.; Ichikawa-Shindo, Y.; Kawate, H.; Cui, N.; Wei, Y.; Tanaka, M.; Kakihara, S.; et al. Deficiency of the adrenomedullin-RAMP3 system suppresses metastasis through the modification of cancer-associated fibroblasts. Oncogene 2020, 39, 1914–1930. [Google Scholar] [CrossRef] [PubMed]
- Tanaka, M.; Koyama, T.; Sakurai, T.; Kamiyoshi, A.; Ichikawa-Shindo, Y.; Kawate, H.; Liu, T.; Xian, X.; Imai, A.; Zhai, L.; et al. The endothelial adrenomedullin-RAMP2 system regulates vascular integrity and suppresses tumour metastasis. Cardiovasc. Res. 2016, 111, 398–409. [Google Scholar] [CrossRef]
- Simonetti, G.; Angeli, D.; Petracci, E.; Fonzi, E.; Vedovato, S.; Sperotto, A.; Padella, A.; Ghetti, M.; Ferrari, A.; Robustelli, V.; et al. Adrenomedullin Expression Characterizes Leukemia Stem Cells and Associates With an Inflammatory Signature in Acute Myeloid Leukemia. Front. Oncol. 2021, 11, 684396. [Google Scholar] [CrossRef]
- Li, M.; Hong, L.I.; Liao, M.; Guo, G. Expression and clinical significance of focal adhesion kinase and adrenomedullin in epithelial ovarian cancer. Oncol. Lett. 2015, 10, 1003–1007. [Google Scholar] [CrossRef] [PubMed]
- Zhang, Z.-L.; Huang, S.-X.; Lin, S.; Chai, L. Plasma adrenomedullin levels and nasopharyngeal carcinoma prognosis. Clin. Chim. Acta 2015, 440, 172–176. [Google Scholar] [CrossRef] [PubMed]
- Noack Watt, K.E.; Achilleos, A.; Neben, C.L.; Merrill, A.E.; Trainor, P.A. The Roles of RNA Polymerase I and III Subunits Polr1c and POLR1D in Craniofacial Development and in Zebrafish Models of Treacher Collins Syndrome. PLoS Genet. 2016, 12, e1006187. [Google Scholar] [CrossRef]
- Jorgensen, P.; Rupes, I.; Sharom, J.R.; Schneper, L.; Broach, J.R.; Tyers, M. A dynamic transcriptional network communicates growth potential to ribosome synthesis and critical cell size. Genes Dev. 2004, 18, 2491–2505. [Google Scholar] [CrossRef]
- Trainor, P.A.; Merrill, A.E. Ribosome biogenesis in skeletal development and the pathogenesis of skeletal disorders. Biochim. Biophys. Acta 2014, 1842, 769–778. [Google Scholar] [CrossRef]
- Tian, Y.; Sun, F.; Zhong, Y.; Huang, W.; Wang, G.; Liu, C.; Xiao, Y.; Wu, J.; Mu, L. Expression and Clinical Significance of POLR1D in Colorectal Cancer. Oncology 2020, 98, 138–145. [Google Scholar] [CrossRef]
- Zhou, Q.; Perakis, S.O.; Ulz, P.; Mohan, S.; Riedl, J.M.; Talakic, E.; Lax, S.; Tötsch, M.; Hoefler, G.; Bauernhofer, T.; et al. Cell-free DNA analysis reveals POLR1D-mediated resistance to bevacizumab in colorectal cancer. Genome Med. 2020, 12, 20. [Google Scholar] [CrossRef] [PubMed]
- Yang, S.; Luo, F.; Wang, J.; Mao, X.; Chen, Z.; Wang, Z.; Guo, F. Effect of prostaglandin reductase 1 (PTGR1) on gastric carcinoma using lentivirus-mediated system. Int. J. Clin. Exp. Pathol. 2015, 8, 14493–14499. [Google Scholar] [PubMed]
- Sánchez-Rodríguez, R.; Torres-Mena, J.E.; De-la-Luz-Cruz, M.; Bernal-Ramos, G.A.; Villa-Treviño, S.; Chagoya-Hazas, V.; Landero-López, L.; García-Román, R.; Rouimi, P.; Del-Pozo-Yauner, L.; et al. Increased expression of prostaglandin reductase 1 in hepatocellular carcinomas from clinical cases and experimental tumors in rats. Int. J. Biochem. Cell Biol. 2014, 53, 186–194. [Google Scholar] [CrossRef] [PubMed]
- Huang, X.; Zhou, W.; Zhang, Y.; Liu, Y. High Expression of PTGR1 Promotes NSCLC Cell Growth via Positive Regulation of Cyclin-Dependent Protein Kinase Complex. Biomed. Res. Int. 2016, 2016, 5230642. [Google Scholar] [CrossRef] [PubMed]
- Xue, L.; Zhu, Z.; Wang, Z.; Li, H.; Zhang, P.; Wang, Z.; Chen, Q.; Chen, H.; Chong, T. Knockdown of prostaglandin reductase 1 (PTGR1) suppresses prostate cancer cell proliferation by inducing cell cycle arrest and apoptosis. Biosci. Trends 2016, 10, 133–139. [Google Scholar] [CrossRef]
- Wang, X.; Yin, G.; Zhang, W.; Song, K.; Zhang, L.; Guo, Z. Prostaglandin Reductase 1 as a Potential Therapeutic Target for Cancer Therapy. Front. Pharmacol. 2021, 12, 717730. [Google Scholar] [CrossRef]
- Liu, M.; Liu, Y.; Deng, L.; Wang, D.; He, X.; Zhou, L.; Wicha, M.S.; Bai, F.; Liu, S. Transcriptional profiles of different states of cancer stem cells in triple-negative breast cancer. Mol. Cancer 2018, 17, 65. [Google Scholar] [CrossRef]
- Chu, H.-W.; Chang, K.-P.; Yen, W.-C.; Liu, H.-P.; Chan, X.-Y.; Liu, C.-R.; Hung, C.-M.; Wu, C.-C. Identification of salivary autoantibodies as biomarkers of oral cancer with immunoglobulin A enrichment combined with affinity mass spectrometry. Proteomics 2023, 23, e2200321. [Google Scholar] [CrossRef]
- Colombo, P.; Read, M.; Fried, M. The human L35a ribosomal protein (RPL35A) gene is located at chromosome band 3q29-qter. Genomics 1996, 32, 148–150. [Google Scholar] [CrossRef]
- Shenoy, N.; Kessel, R.; Bhagat, T.D.; Bhattacharyya, S.; Yu, Y.; McMahon, C.; Verma, A. Alterations in the ribosomal machinery in cancer and hematologic disorders. J. Hematol. Oncol. 2012, 5, 32. [Google Scholar] [CrossRef]
- Wu, F.; Sun, D.; Liao, Y.; Shang, K.; Lu, C. RPL35A is a key promotor involved in the development and progression of gastric cancer. Cancer Cell Int. 2021, 21, 497. [Google Scholar] [CrossRef]
- Fu, Q.; Yu, Z. Phosphoglycerate kinase 1 (PGK1) in cancer: A promising target for diagnosis and therapy. Life Sci. 2020, 256, 117863. [Google Scholar] [CrossRef] [PubMed]
- Zhao, C.; Zhou, Y.; Ma, H.; Wang, J.; Guo, H.; Liu, H. A four-hypoxia-genes-based prognostic signature for oral squamous cell carcinoma. BMC Oral Health 2021, 21, 232. [Google Scholar] [CrossRef] [PubMed]
- Hu, H.; Zhu, W.; Qin, J.; Chen, M.; Gong, L.; Li, L.; Liu, X.; Tao, Y.; Yin, H.; Zhou, H.; et al. Acetylation of PGK1 promotes liver cancer cell proliferation and tumorigenesis. Hepatology 2017, 65, 515–528. [Google Scholar] [CrossRef] [PubMed]
- Li, Y.; Wang, S.; Zhang, X.; Yang, R.; Wei, X.; Yan, R.; Jiang, Y.; Shen, W. Expression Characteristics and Significant Prognostic Values of PGK1 in Breast Cancer. Front. Mol. Biosci. 2021, 8, 695420. [Google Scholar] [CrossRef]
- Ge, J.; Li, J.; Na, S.; Wang, P.; Zhao, G.; Zhang, X. miR-548c-5p inhibits colorectal cancer cell proliferation by targeting PGK1. J. Cell Physiol. 2019, 234, 18872–18878. [Google Scholar] [CrossRef]
- Cao, H.; Yu, H.; Feng, Y.; Chen, L.; Liang, F. Curcumin inhibits prostate cancer by targeting PGK1 in the FOXD3/miR-143 axis. Cancer Chemother. Pharmacol. 2017, 79, 985–994. [Google Scholar] [CrossRef]
- Kappler, M.; Kotrba, J.; Kaune, T.; Bache, M.; Rot, S.; Bethmann, D.; Wichmann, H.; Güttler, A.; Bilkenroth, U.; Horter, S.; et al. P4HA1: A single-gene surrogate of hypoxia signatures in oral squamous cell carcinoma patients. Clin. Transl. Radiat. Oncol. 2017, 5, 6–11. [Google Scholar] [CrossRef]
- Cao, X.; Cao, Y.; Zhao, H.; Wang, P.; Zhu, Z. Prolyl 4-hydroxylase P4HA1 Mediates the Interplay Between Glucose Metabolism and Stemness in Pancreatic Cancer Cells. Curr. Stem Cell Res. Ther. 2023, 18, 712–719. [Google Scholar] [CrossRef]
- Peng, Y.; Xiao, L.; Rong, H.; Ou, Z.; Cai, T.; Liu, N.; Li, B.; Zhang, L.; Wu, F.; Lan, T.; et al. Single-cell profiling of tumor-infiltrating TCF1/TCF7+ T cells reveals a T lymphocyte subset associated with tertiary lymphoid structures/organs and a superior prognosis in oral cancer. Oral Oncol. 2021, 119, 105348. [Google Scholar] [CrossRef]
- Hu, J.; Chen, Z.; Bao, L.; Zhou, L.; Hou, Y.; Liu, L.; Xiong, M.; Zhang, Y.; Wang, B.; Tao, Z.; et al. Single-Cell Transcriptome Analysis Reveals Intratumoral Heterogeneity in ccRCC, which Results in Different Clinical Outcomes. Mol. Ther. J. Am. Soc. Gene Ther. 2020, 28, 1658–1672. [Google Scholar] [CrossRef] [PubMed]
- Danaher, P.; Warren, S.; Dennis, L.; D’Amico, L.; White, A.; Disis, M.; Geller, M.; Odunsi, K.; Beechem, J.; Fling, S. Gene expression markers of Tumor Infiltrating Leukocytes. J. Immunother. Cancer 2017, 5, 18. [Google Scholar] [CrossRef] [PubMed]
- Zhang, C.; He, H.; Hu, X.; Liu, A.; Huang, D.; Xu, Y.; Chen, L.; Xu, D. Development and validation of a metastasis-associated prognostic signature based on single-cell RNA-seq in clear cell renal cell carcinoma. Aging 2019, 11, 10183–10202. [Google Scholar] [CrossRef] [PubMed]
- Liu, X.; Jin, S.; Hu, S.; Li, R.; Pan, H.; Liu, Y.; Lai, P.; Xu, D.; Sun, J.; Liu, Z.; et al. Single-cell transcriptomics links malignant T cells to the tumor immune landscape in cutaneous T cell lymphoma. Nat. Commun. 2022, 13, 1158. [Google Scholar] [CrossRef]
- Yu, G.; Wang, L.-G.; Han, Y.; He, Q.-Y. clusterProfiler: An R package for comparing biological themes among gene clusters. Omics J. Integr. Biol. 2012, 16, 284–287. [Google Scholar] [CrossRef]


| Genes | Forward Primer (5′-3′) | Reverse Primer (5′-3′) |
|---|---|---|
| ADM | CGAAAGAAGTGGAATAAGTGGGC | AGTTGTTCATGCTCTGGCGGT |
| POLR1D | AAAGAGGGCGATAAGGAACCAG | TTTCGTACTTGTCCTGGCTGC |
| RAMP2 | ACTTTGCCAACTGCTCCCTG | GCCTCACTGTCTTTACTCCTCCAT |
| POLR1F | AGTGACTCCAGTGGTTACCAAAGT | GGTGAGCATTTCAAAGGTGGG |
| POLR3B | CATCCGCAATGCCTTACCT | CCCTTTTCTATCAGCCTCCAC |
| MMP2 | CTCATCGCAGATGCCTGGAA | TTCAGGTAATAGGCACCCTTGAAGA |
| GAPDH | GGAAGCTTGTCATCAATGGAAATC | TGATGACCCTTTTGGCTCCC |
Disclaimer/Publisher’s Note: The statements, opinions and data contained in all publications are solely those of the individual author(s) and contributor(s) and not of MDPI and/or the editor(s). MDPI and/or the editor(s) disclaim responsibility for any injury to people or property resulting from any ideas, methods, instructions or products referred to in the content. |
© 2024 by the authors. Licensee MDPI, Basel, Switzerland. This article is an open access article distributed under the terms and conditions of the Creative Commons Attribution (CC BY) license (https://creativecommons.org/licenses/by/4.0/).
Share and Cite
Shi, M.; Huang, K.; Wei, J.; Wang, S.; Yang, W.; Wang, H.; Li, Y. Identification and Validation of a Prognostic Signature Derived from the Cancer Stem Cells for Oral Squamous Cell Carcinoma. Int. J. Mol. Sci. 2024, 25, 1031. https://doi.org/10.3390/ijms25021031
Shi M, Huang K, Wei J, Wang S, Yang W, Wang H, Li Y. Identification and Validation of a Prognostic Signature Derived from the Cancer Stem Cells for Oral Squamous Cell Carcinoma. International Journal of Molecular Sciences. 2024; 25(2):1031. https://doi.org/10.3390/ijms25021031
Chicago/Turabian StyleShi, Mingxuan, Ke Huang, Jiaqi Wei, Shiqi Wang, Weijia Yang, Huihui Wang, and Yi Li. 2024. "Identification and Validation of a Prognostic Signature Derived from the Cancer Stem Cells for Oral Squamous Cell Carcinoma" International Journal of Molecular Sciences 25, no. 2: 1031. https://doi.org/10.3390/ijms25021031