Article

Polyploid Genome Assembly Provides Insights into Morphological Development and Ascorbic Acid Accumulation of Sauropus androgynus

1
Key Laboratory of Genetics, Breeding and Multiple Utilization of Crops, Ministry of Education, College of Agriculture, Fujian Agriculture and Forestry University, Fuzhou 350002, China
2
Key Laboratory of Biological Breeding for Fujian and Taiwan Crops, Ministry of Agriculture and Rural Affairs, College of Agriculture, Fujian Agriculture and Forestry University, Fuzhou 350002, China
3
Agricultural Big-Data Research Center, College of Plant Protection, Shandong Agricultural University, Tai’an 271018, China
4
Guangdong Provincial Key Laboratory of Plant Molecular Breeding, State Key Laboratory for Conservation and Utilization of Subtropical Agro-Bioresources, South China Agricultural University, Guangzhou 510642, China
*
Authors to whom correspondence should be addressed.
These authors contributed equally to this work.
Int. J. Mol. Sci. 2024, 25(1), 300; https://doi.org/10.3390/ijms25010300
Submission received: 28 November 2023 / Revised: 19 December 2023 / Accepted: 21 December 2023 / Published: 25 December 2023

Abstract

:
Sauropus androgynus (S. androgynus) (2n = 4x = 52) is one of the most popular functional leafy vegetables in South and Southeast Asia. With its rich nutritional and pharmaceutical values, it has traditionally had widespread use for dietary and herbal purposes. Here, the genome of S. androgynus was sequenced and assembled, revealing a genome size of 1.55 Gb with 26 pseudo-chromosomes. Phylogenetic analysis traced back the divergence of Sauropus from Phyllanthus to approximately 29.67 million years ago (Mya). Genome analysis revealed that S. androgynus polyploidized around 20.51 Mya and shared a γ event about 132.95 Mya. Gene function analysis suggested that the expansion of pathways related to phloem development, lignin biosynthesis, and photosynthesis tended to result in the morphological differences among species within the Phyllanthaceae family, characterized by varying ploidy levels. The high accumulation of ascorbic acid in S. androgynus was attributed to the high expression of genes associated with the L-galactose pathway and recycling pathway. Moreover, the expanded gene families of S. androgynus exhibited multiple biochemical pathways associated with its comprehensive pharmacological activity, geographic adaptation and distinctive pleasurable flavor. Altogether, our findings represent a crucial genomic asset for S. androgynus, casting light on the intricate ploidy within the Phyllanthaceae family.

1. Introduction

Sauropus androgynus L. Merr (S. androgynus) (2n = 4x = 52; family: Phyllanthaceae; Figure 1A) is a perennial shrub that naturally thrives in hot and humid environments, exhibiting wide dispersion and cultivation across South and Southeast Asia [1]. The plant has been traditionally used as an herbal remedy for various ailments, including colds, eye diseases, and gastrointestinal disorders [2,3,4]. Additionally, it holds high culinary value in countries like India, Indonesia, and Malaysia [5,6].
As one of the most popular functional foliar vegetables in South and Southeast Asia, the popularity of S. androgynus is attributed not only to the exceptionally delightful flavor of its leaves [7] but also to its wealth of nutritional and pharmaceutical values. S. androgynus is abundant in a variety of body-healthy components, with numerous publications reporting its abundance of ascorbic acid (vitamin C), vitamin A, vitamin E, flavonoid, phenol, etc. [2,8,9,10,11]. An earlier study showed that the content of vitamin C in fresh leaves of S. androgynus was 314.3 mg/100 g, which was higher than in common edible vegetables [2]. As a multivitamin plant, the high content of vitamin C in S. androgynus has also been demonstrated in many other studies [1,6,8]. These bioactive components present in S. androgynus can serve as direct or potential sources of its antioxidant, antibacterial and anti-inflammatory abilities [5,12,13], which provide the fundamental basis for its comprehensive pharmacological activities.
The current research on S. androgynus mainly concentrates on its phytochemical and biological components, as well as its pharmacology applications. However, the absence of reference genome sequences and limited functional genomics studies have hindered the comprehension of their underlying molecular mechanisms, thus presenting challenges for advancing related research.
The genus Sauropus has been confirmed to be deeply embedded in the Phyllanthaceae by molecular approaches (such as ITS and matK) [14]. In an early classification, the Phyllanthaceae family was categorized as the subfamily Phyllanthoideae, under the Euphorbiaceae family [15]. However, the revised APG II classification recognized Phyllanthaceae as a distinct and independent family within the order Malpighiales [16]. Despite this, probably due to the different taxonomic principles, or the speed of updating the website, certain websites (e.g., Integrated Taxonomic Information System (https://www.itis.gov/ (accessed on 30 March 2023)), PLANTS Database (https://plants.usda.gov/ (accessed on 30 March 2023)), Plants of the World Online (https://powo.science.kew.org/ (accessed on 30 March 2023)), The International Plant Names Index (https://www.ipni.org/ (accessed on 30 March 2023)), iPlant (http://www.iplant.cn/ (accessed on 30 March 2023))) and recent studies [17,18] still classify the taxonomy of S. androgynus under the Euphorbiaceae family. As such, we hope to furnish further genetic evidence to clarify the evolutionary placement of the Phyllanthaceae family.
Polyploidization events often exhibit a correlation with enhanced vigor and the adaptation of newly formed polyploids to novel environmental conditions, which has been widely utilized in the breeding processes of crops [19]. These evolutionary events may induce morphological changes in species, such as the enlargement of plant organs following polyploidization [20]. Previous studies involving karyotype analysis have identified diverse chromosomal counts in plant specimens belonging to this botanical family [21]. This observation implies the presence of distinct ploidy levels among species within the family. The first genome assembly of diploid Phyllanthaceae (Phyllanthus cochinchinensis), with a genome size of 284.88 Mb and 13 pseudo-chromosomes, has been released based on the combination of Illumina, PacBio, and Hi-C technology [22]. This has promoted further functional genomic research on species within the Phyllanthaceae family. However, only a diploid genome is clearly insufficient for comprehensive research on a family characterized by complex ploidy.
In this study, we employed various methods to determine the ploidy of S. androgynus and achieved a chromosomal-level assembly of its genome. Our subsequent exploration via functional gene analysis unveiled specific genes affected by polyploidy, which likely play a role in driving morphological variations. Furthermore, we conducted an extensive investigation into the highly scrutinized vitamin C metabolic pathway in S. androgynus. The outcomes of this research are anticipated to provide valuable insights for future genetic studies within the Phyllanthaceae family, while also holding significance for the medicinal applications of S. androgynus.

2. Results

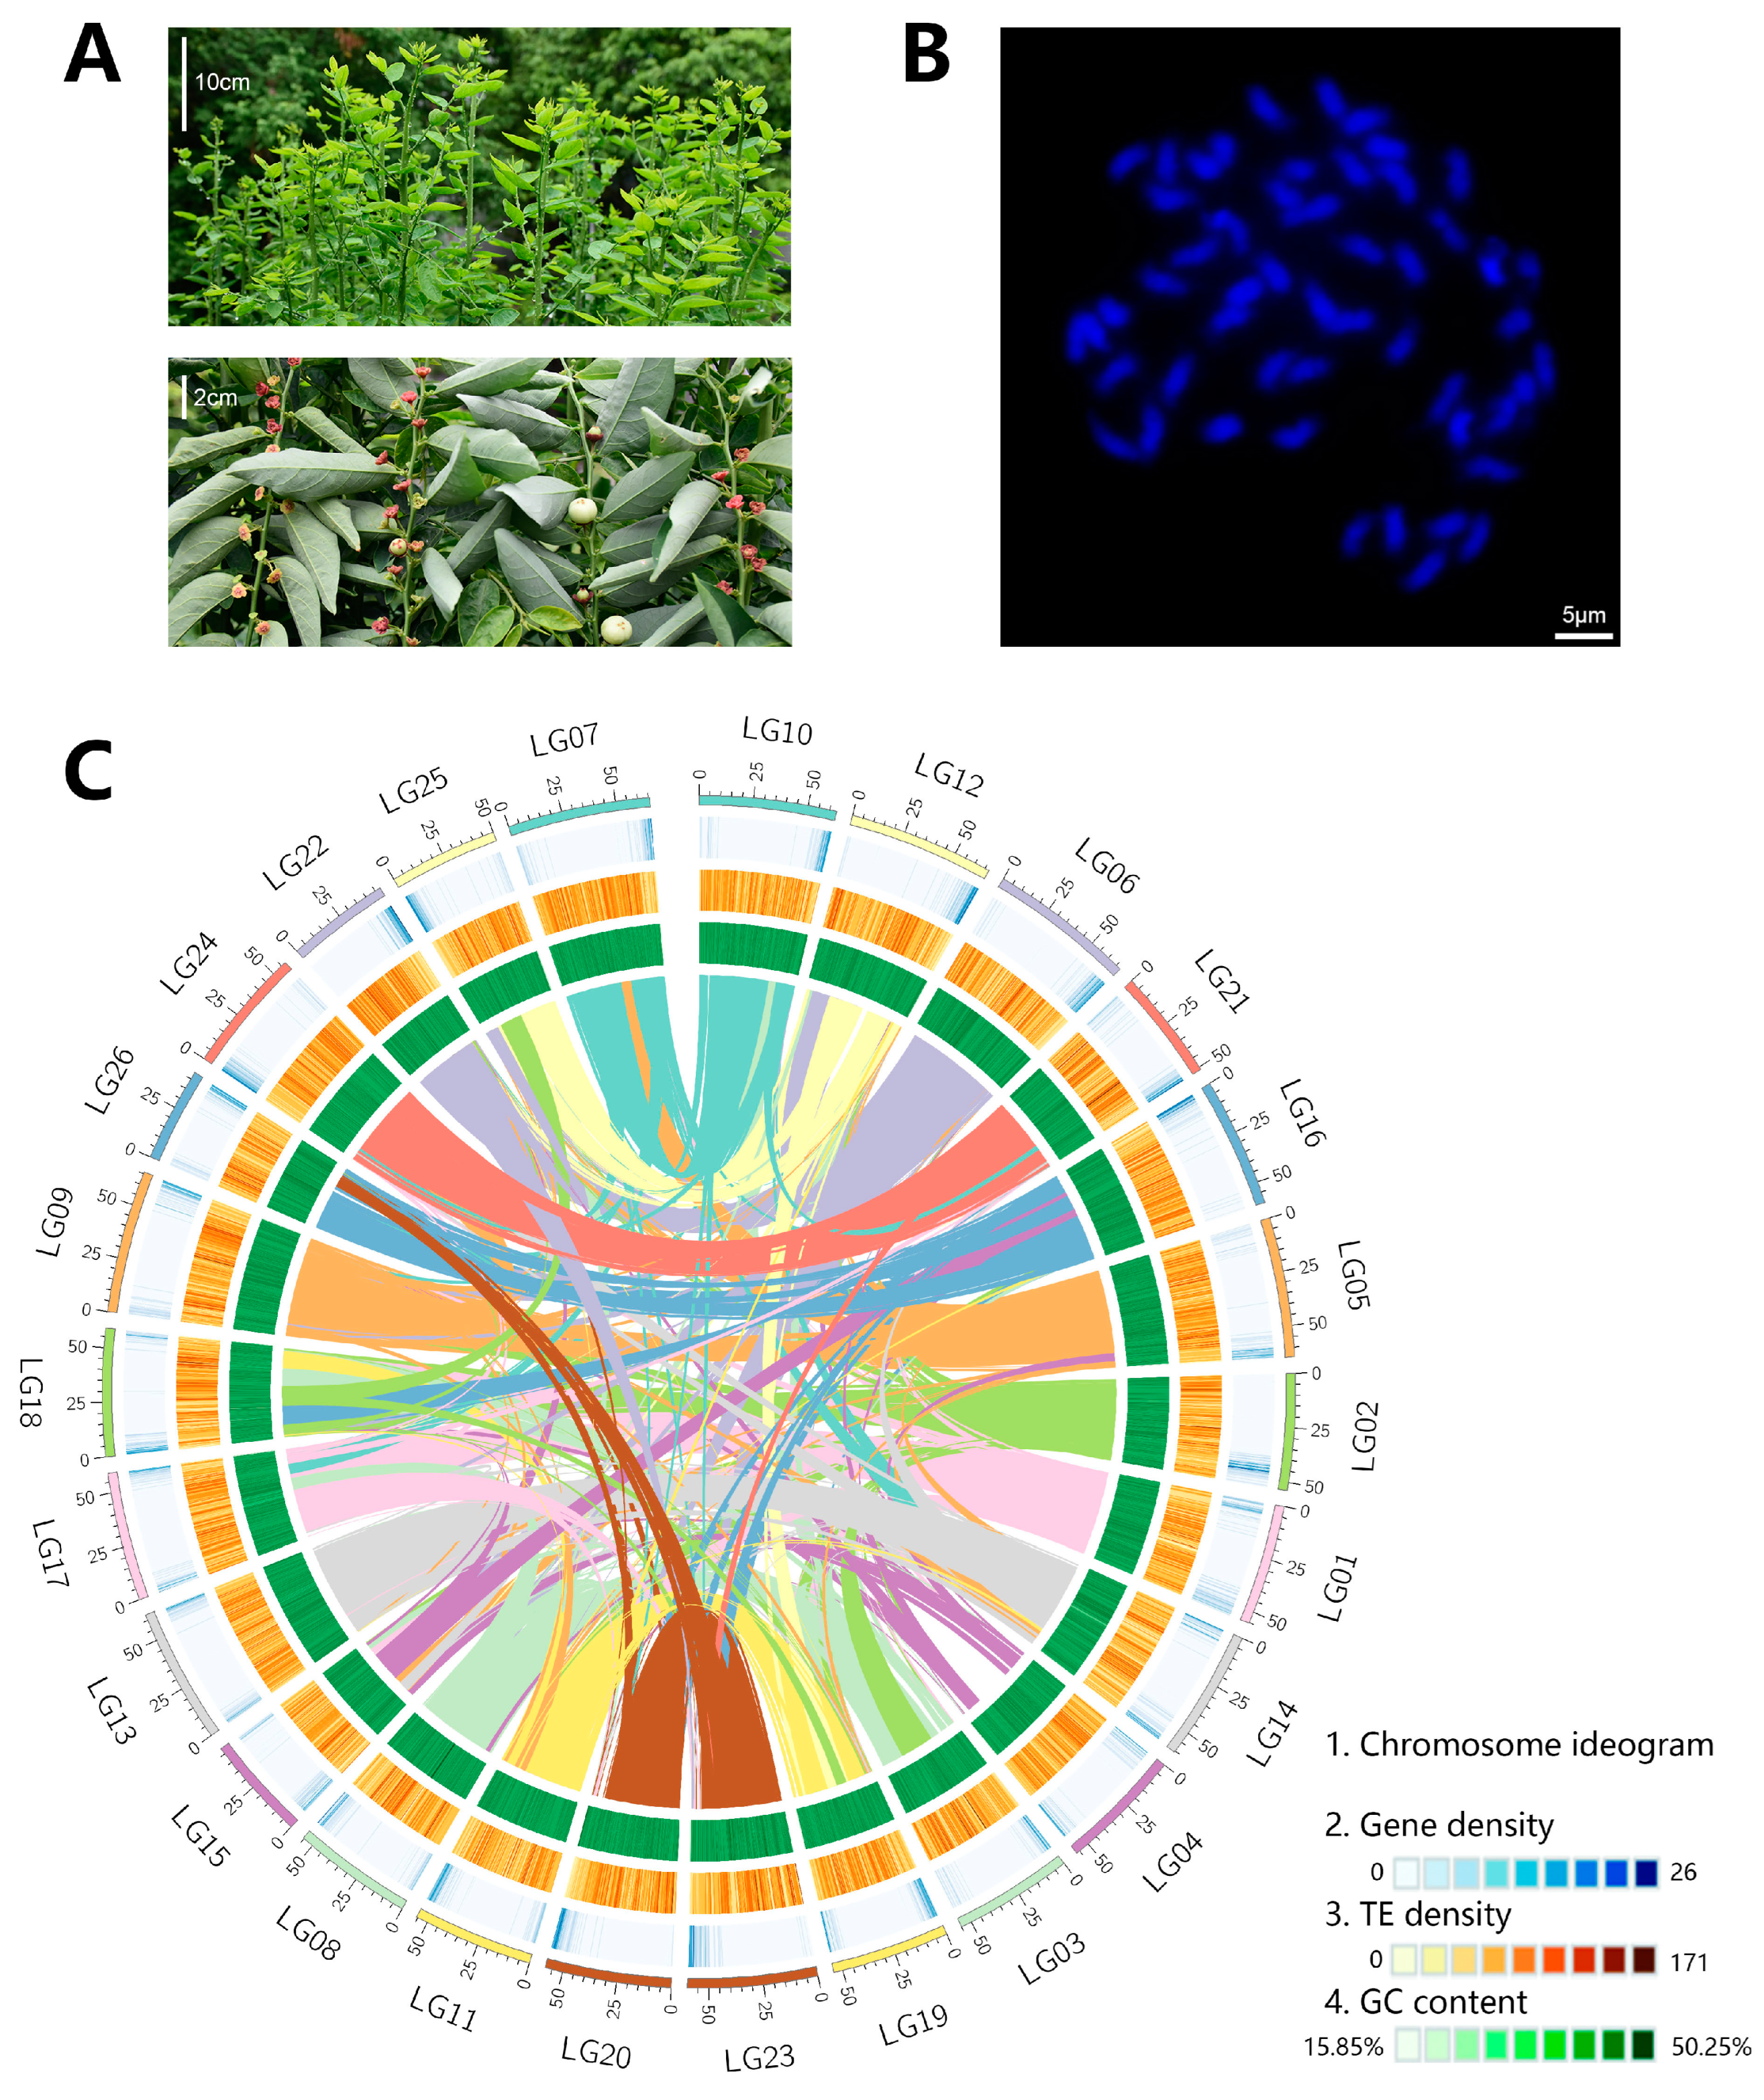
2.1. Potential Polyploid of S. androgynus

Previous research had reported a diploid species, P. cochinchinensis, with 13 pairs of homologous chromosomes (2n = 26; n = 13) [21]. Karyotype analysis in S. androgynus detected a twofold (2n = 52) elevation in the chromosomes number in the pachytene of the root tips cells (Figure 1B). The estimation of the genome size based on k-mer analysis and flow cytometer elucidated the elevation in the genome size (1.43 Gb and 1.52 Gb) in S. androgynus (Figures S1 and S2). Smudgeplot analysis revealed the characteristic of the allotetraploids in S. androgynus (Figure S1). These results suggested the potential polyploid in S. androgynus.

2.2. Genome Assembly and Quality Assessment

A total of 44.32 Gb (~31.03×) PacBio circular consensus sequencing (CCS) and 192.75 Gb (~134.79×) Hi-C Illumina platform clean data were combined to assemble the S. androgynus genome sequence. Initially, we assembled the reads into 1.68 Gb of contig sequences, with a contig N50 size of 29.83 Mb (Table S1). The scaffold, based on Hi-C data, generated a genome assembly with a size of 1.55 Gb and a scaffold N50 of 58.10 Mb (Table S1). A total of 1.52 Gb (97.79%) of assembled sequences were anchored onto 26 pseudo-chromosomes, with 1.50 Gb (96.28%) of sequences successfully establishing their order and orientation. The results corresponded to the chromosome numbers in the karyotype assay and elucidated a chromosome-level genome assembly for S. androgynus (Figure 1C and Figure S3, Table S2).
The quality and coverage of the genome assembly were evaluated from the perspectives of completeness in the gene and genome sequence. Benchmarking Universal Single-Copy Orthologs (BUSCO) and Core Eukaryotic Genes Mapping Approach (CEGMA) analyses predicted 96.84% complete BUSCO genes and 98.47% CEGMA genes in the S. androgynus genome assembly, respectively (Tables S3 and S4). Additionally, 96.92% of the short-read sequences were properly mapped to the assembly (Table S5). These assessments collectively suggested a high-quality genome assembly for S. androgynus.

2.3. LTR Accumulation Promoted the Genome Expansion of S. androgynus

In the genome of S. androgynus, 77.81% of the total length was classified as repetitive sequences using both homology-based and de novo methods (Table 1). Among these sequences, transposable elements constituted 74.02% of the genome length (Table S6). The predominant type of repeat was retroelements, accounting for 71.25% of the genome length. Further analysis of these repetitive sequences revealed that the long terminal repeat (LTR) superfamily elements, including LTR/Copia, LTR/Gypsy, and LTR/Unknown, constituted 36.27%, 20.3%, and 13.65% of the genome length, respectively. LTR insertion time analysis showed a gradual accumulation of these LTRs over 5 million years, peaking at 0.13 million years ago (Mya) (Figure S4). Additionally, the genome of S. androgynus contained 3.79% tandem repeats (Table S6).

2.4. Gene Prediction and Annotation of S. androgynus

Through the integration of homology-based, de novo, and RNA-Seq data-based prediction methods (Table S7 and Figure S5), a total of 26,048 protein-coding genes were identified within the S. androgynus genome. The average lengths of the whole genes, coding sequences, exon sequences, and intron sequences were found to be 3405.95, 1354.96, 1739.48, and 1666.47 base pairs (bp), respectively (Table S8). BUSCO assessment revealed 96.47% completeness, indicating the high quality of the gene prediction (Table S9). A total of 99.36% of the protein-coding genes were functionally annotated using various databases: Gene Ontology (GO) (84.6%), Kyoto Encyclopedia of Genes and Genomes (KEGG) (77.53%), KOG (58.2%), Pfam (88.57%), SwissProt (85.18%), TrEMBL (99.3%), EggNOG (87.52%), and NR (99.17%) (Table S10 and Figure S6). Additionally, apart from the protein-coding genes, the analysis also revealed a range of non-coding RNAs: 8705 rRNAs, 5422 tRNAs, 152 microRNAs, 48 snRNAs, and 72 snoRNAs (Table S11). Alongside this, 149 pseudogenes were cataloged.

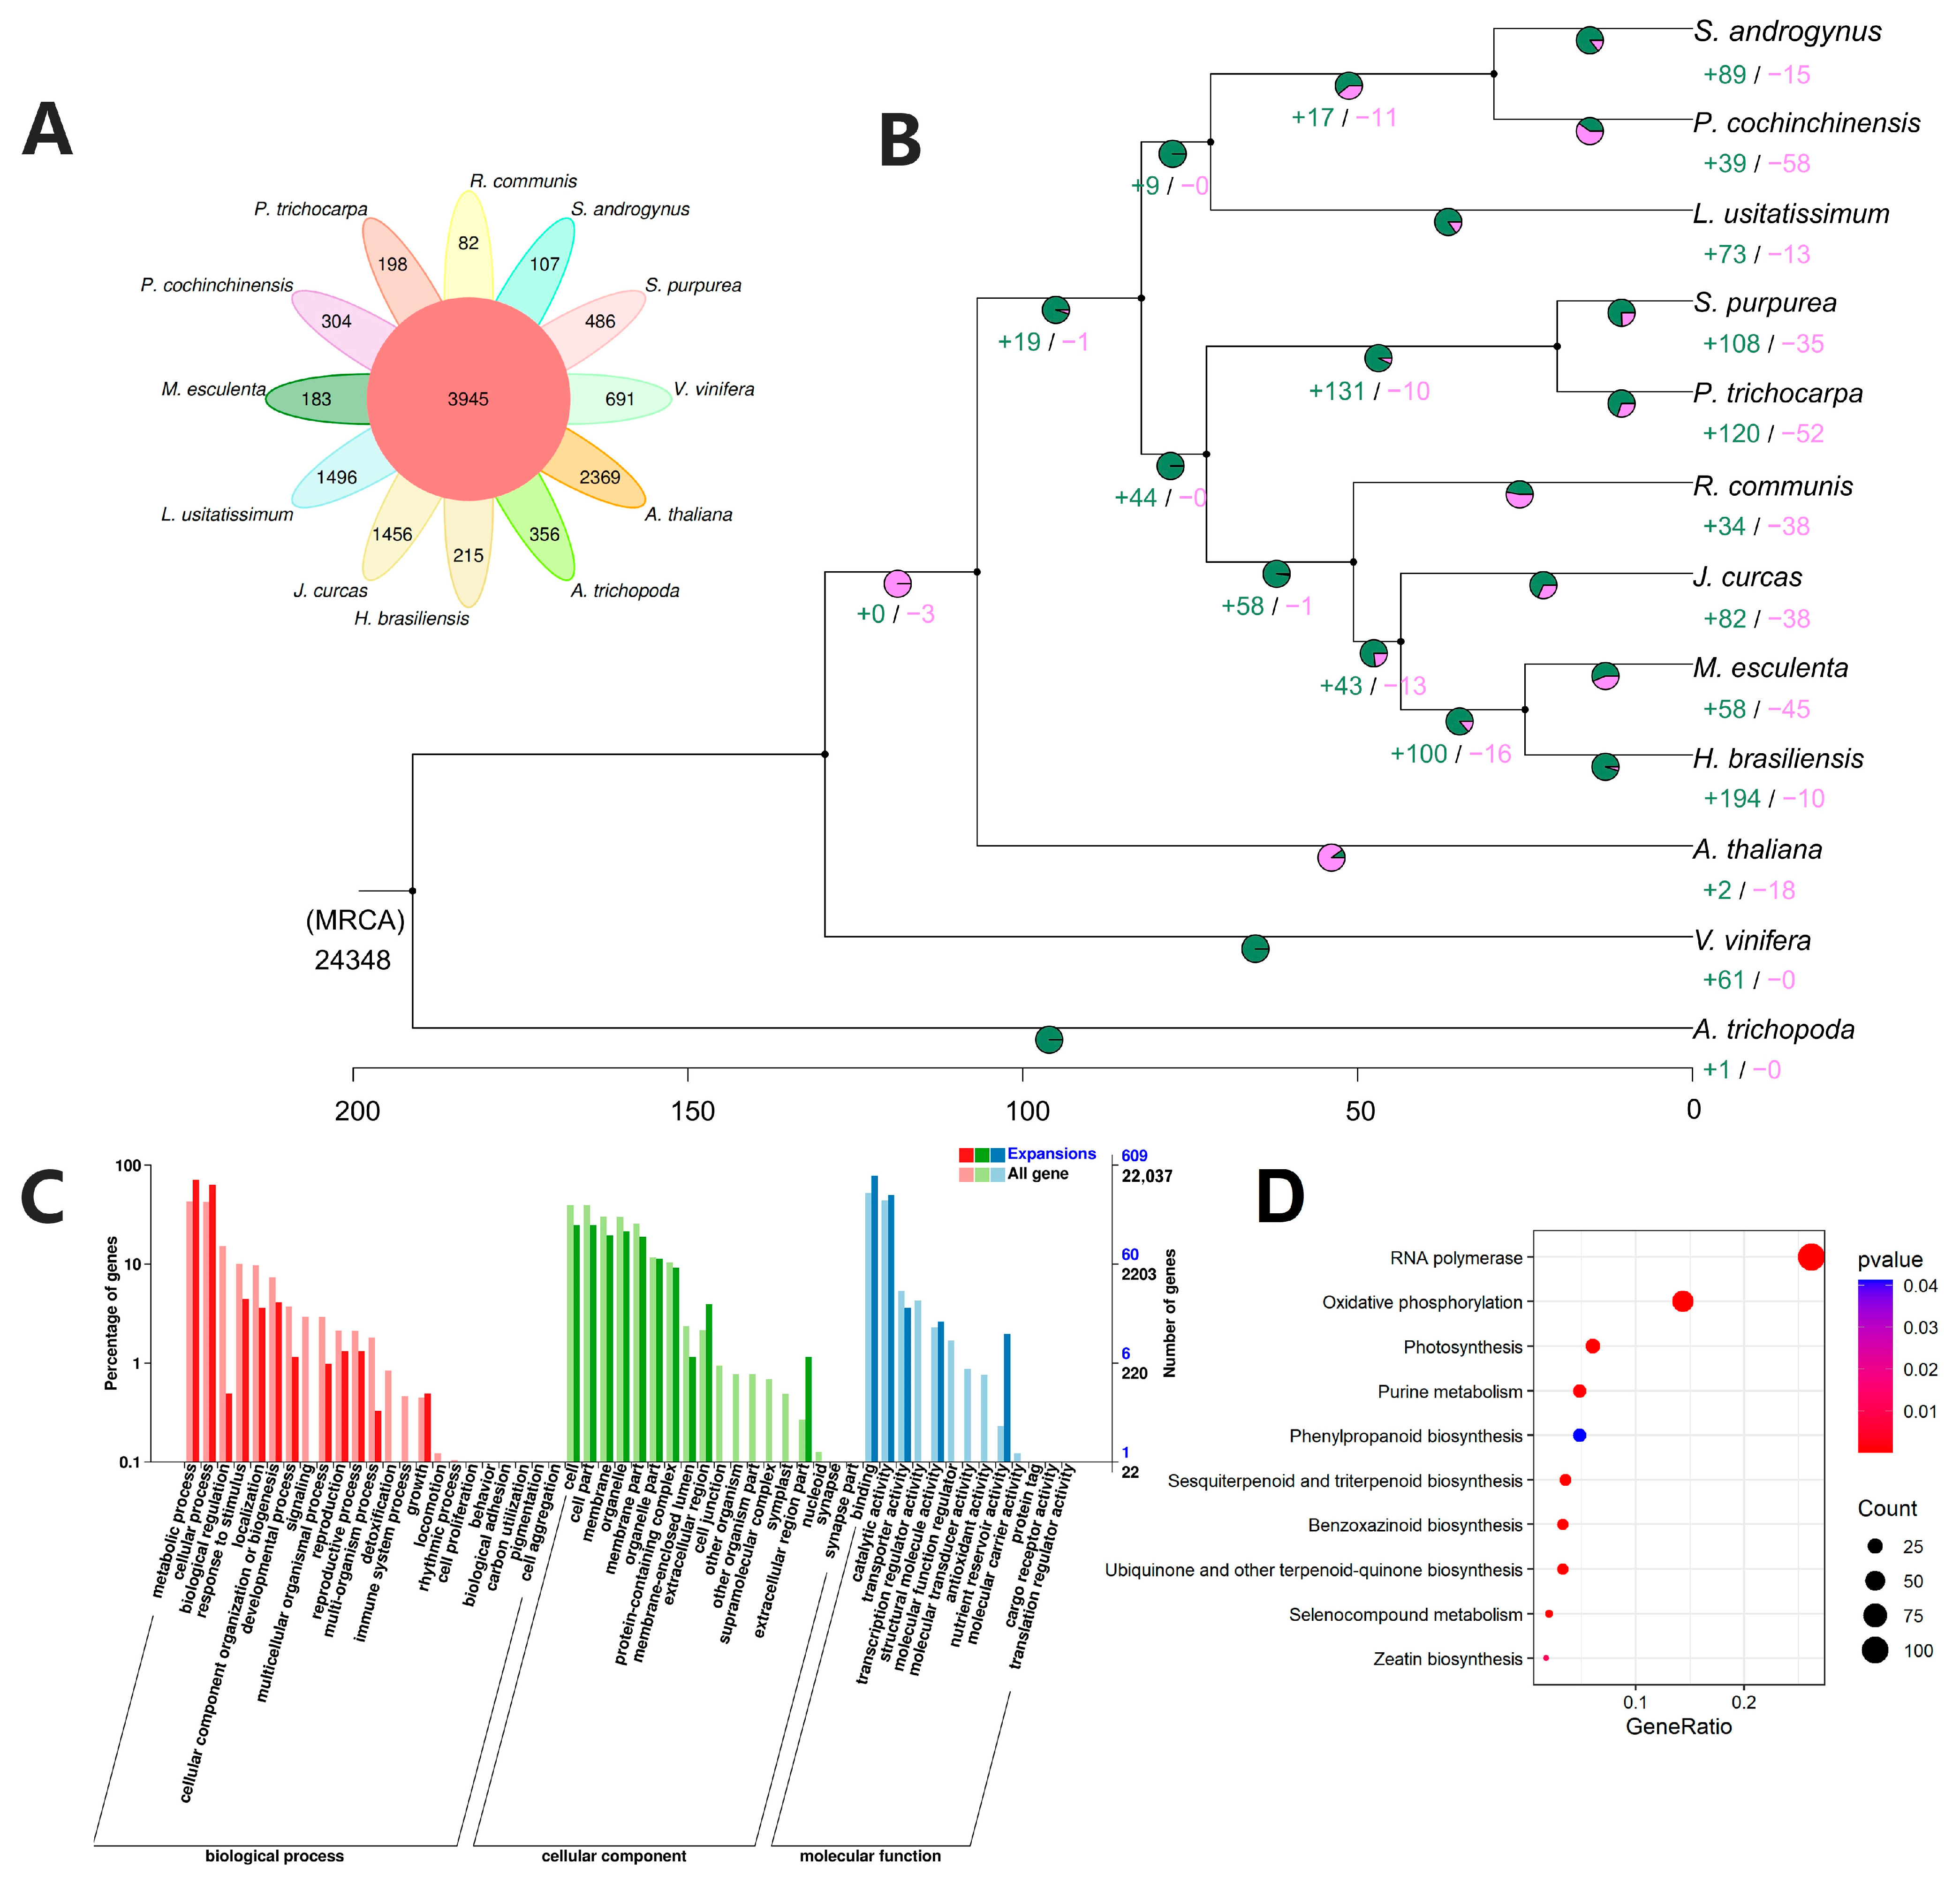
2.5. Evolution History and Comparative Analysis of S. androgynus

To investigate the genome evolution and divergence of S. androgynus, phylogenomic analysis were conducted using protein sequences from S. androgynus and 11 angiosperm species, including one Phyllanthaceae plant (P. cochinchinensis), four Euphorbiaceae plants (Hevea brasiliensis, Jatropha curcas, Manihot esculenta and Ricinus communis), two Salicaceae plants (Sarracenia purpurea and Populus trichocarpa), one Linaceae plant (Linum usitatissimum) and three model plants (Arabidopsis thaliana, Amborella trichopoda and Vitis vinifera) (Table S12). All the protein-coding genes were clustered into 32,293 orthogroups based on the sequence homology. Additionally, we identified a total of 3945 gene families shared among all 12 species, along with 107 species-specific gene families in S. androgynus (Figure 2A and Table S13). KEGG enrichment analysis of these genes revealed enrichment in various pathways, including RNA polymerase, biotin metabolism, fatty acid biosynthesis and metabolism, purine metabolism, 2-oxocarboxylic acid metabolism, protein export, ascorbate and aldarate metabolism (Figure S7).
The phylogenetic tree was developed based on 213 single-copy orthologs. Phylogenetic analysis indicated that S. androgynus and P. cochinchinensis diverged about 29.67 Mya (Figure 2B and Figure S8). Phyllanthaceae and Euphorbiaceae shared a common ancestor about 82.3 Mya. The formation of these two families was associated with the divergence of Linaceae and Salicaceae.
The dynamic of gene family analysis detected 89 and 15 gene family expansions and contractions in the S. androgynus genome (Figure 2B). GO enrichment analysis indicated the genes in the expansion family related to the metabolic process, cellular process, response to stimulus, growth, catalytic activity, transporter activity, nutrient reservoir activity, and so forth (Figure 2C). These findings suggested the occurrence of frequent biochemical reactions internally, which corresponded to the biosynthesis and metabolic pathways of multiple compounds, as revealed by KEGG enrichment analysis (Figure 2D).

2.6. Polyploidization and Synteny Analysis of S. androgynus

A whole-genome duplication (WGD) event is an important force in plant evolution [23,24]. Previous analysis in this research indicated the potential polyploid in S. androgynus. Multiple apparently self-syntenic segments were observed within the S. androgynus genome (Figure S9). Synteny analysis between S. androgynus and a diploid near species, P. cochinchinensis, revealed numerous collinear blocks and an apparent 2:1 projection ratio between the two genomes. This suggested a tetraploid (2n = 4x = 52) in S. androgynus.
The distributions of the synonymous substitutions per synonymous site (Ks) values of S. androgynus indicated a recent WGD event about 20.51 Mya. This time was later than the divergence between S. androgynus and P. cochinchinensis, which suggested that the ancestors of these two species were diploid (Figure 3A). It is noteworthy that, from the perspective of tetraploidy, the duplicate rate in the S. androgynus genome is relatively low (7.31%; Table S3). This indicated a substantial loss of redundant genes within this genome, reflecting an ongoing diploidization process. In addition, the S. androgynus and P. cochinchinensis genomes shared an ancient WGD event, which was the common whole-genome triplication (γ event) shared by all the core eudicots (Figure 3A) [25].

2.7. Expansion of Genes Related to Morphological Development

Morphological differences are common among related species with different ploidy [26,27]. Tetraploid S. androgynus exhibits more robust stems and a larger area of mature leaves than diploid P. cochinchinensis (Figure 1A and Figure 3C) [22]. Botanical studies have proven that vascular development and lignin biosynthesis are closely related to these morphological characteristics [28,29]. Functional analysis illustrated the expansion of multiple genes encoding the key enzymes of lignin biosynthesis in tetraploid S. androgynus, including PAL, HCT, CCR and CAD (Figure 4A and Figure S10). A similar pattern was detected in genes associated with phloem development (FAR4/5, KCS2/20, LACS, GPAT5/7 and CYP86A/B1). Downstream, genes related to photosynthesis also exhibited similar characteristics, which tended to provide sufficient metabolic material for the development of the larger morphological features of S. androgynus.

2.8. Transcriptional Regulation of Ascorbic Acid Accumulation in S. androgynus

The high concentration of ascorbic acid, a key component of the antioxidant system, is a distinguishing feature of S. androgynus. To investigate the expression levels of genes associated with ascorbic acid accumulation, transcriptome data from three distinct tissues of S. androgynus were analyzed.
Functional annotation revealed a total of 52 genes associated with the biosynthesis and recycling pathways of ascorbic acid in S. androgynus (Table S13). Within the biosynthesis pathway specific to ascorbic acid, all the genes associated with the L-galactose pathway were identified, whereas deletions were observed in the remaining pathways, including those involving GalUR (D-galacturonate reductase in the galacturonate pathway), Alase (aldonolactonase in the galacturonate pathway), and GLOase (L-gulonolactone oxidase in both the myo-inositol and L-gulose pathways) (Figure S11 and Table S13).
The gene expression patterns within the L-galactose pathway were found to be consistent across the leaf, stem, and flower tissues, and the elevated expression of related genes corresponded to the high vitamin C content of S. androgynus (Figure 4B). Furthermore, all the genes associated with the ascorbic acid recycling pathway were identified. A comparison revealed that while the expression of AO-related genes was low, there was pronounced expression of APX- and MDHAR-related genes (specifically San02G006230 and San01G006410). This pattern indicates that the recycling pathway of ascorbic acid in S. androgynus primarily relies on the conversion of monodehydroascorbate into ascorbic acid.

3. Discussion

S. androgynus, which is rich in a variety of nutrients and biomolecules, is not only an important edible vegetable in some countries and regions but is also used in traditional remedies for its comprehensive pharmacological activities. In this study, we assembled a high-quality S. androgynus genome based on a combination of Illumina, PacBio and Hi-C technology. The genome, with a total length of 1.55 Gb, consists of 26 pseudo-chromosomes and comprises 26,048 predicted protein-coding genes. The chromosome-level genome assembly and annotation of S. androgynus provides new insights into the intricate ploidy within the Phyllanthaceae family and facilitates further medicinal applications of S. androgynus.
Phylogenetic analysis indicated that S. androgynus and P. cochinchinensis diverged about 29.67 Mya (Figure 2B). In addition, Phyllanthaceae and Euphorbiaceae shared a common ancestor around 82.3 Mya. The formation of these two families was accompanied by the divergence of Linaceae and Salicaceae. These results provide deeper genomic insights into the taxonomic relationship between the Phyllanthaceae and Euphorbiaceae families, as well as the differentiation of various families within the order of Malpighiales.
Polyploidy plays an important role in evolution, and it is an important mechanism for species formation and adaptation to environmental variations [30,31,32]. The Ks distribution suggested that S. androgynus experienced a γ event about 132.95 Mya and a species-specific WGD event about 20.51 Mya (Figure 3A). The synteny patterns within the S. androgynus genome (Figure 1C) and between the genomes of S. androgynus and P. cochinchinensis (Figure 3B) suggested two highly similar yet distinct subgenomes within S. androgynus. Furthermore, it is noteworthy that S. androgynus exhibits a relatively low duplication rate (7.31%; Table S3), indicating a substantial loss of redundant genes in its genome, which reflects an ongoing diploidization process.
In general, polyploidy tends to enlarge cell and organ sizes, and it can even influence the overall growth habit of organisms [33]. Additionally, morphological differences are commonly observed among species with varying ploidy levels [26,27]. In comparison to P. cochinchinensis, S. androgynus exhibits more robust stems and larger mature leaf areas (Figure 1A and Figure 3C). Microsynteny analysis reveals the expansion of genes related to morphological development within S. androgynus, including lignin biosynthesis, phloem development, and photosynthesis (Figure 4A and Figure S10), which provide an ample supply of metabolites to support the development of the larger morphological features of S. androgynus. Furthermore, it is noteworthy that most of these expanded genes in S. androgynus are distributed among groups of homologous chromosomes, which tend to originate from polyploidy events. These results suggest that the number of genes amplified by polyploidy contributed to the plant magnification in the S. androgynus tetraploid.
As a traditional herb widely used in certain South and Southeast Asian countries, S. androgynus exhibits comprehensive pharmacological activities, including antioxidant, antibacterial and anti-inflammatory activities. GO enrichment of the annotated genes in the genome of S. androgynus demonstrated the enrichment of antioxidant activity, detoxification, immune system process, and so forth (Figure S6), which was in correspondence with its comprehensive pharmacological activities. In terms of the molecular mechanism, these effects may result from the expansion of the biosynthesis or metabolic pathways of multiple compounds with antioxidant capacity, such as phenylpropanoid, sesquiterpenoid, triterpenoid, benzoxazinoid and selenocompounds (Figure 2D). This suggests that the comprehensive pharmacological activity of S. androgynus could stem from cumulative effects and interactions of multiple genes.
The ability of ascorbic acid to supply electrons makes it a free radical scavenger [34], which is related to the antioxidant activity in plants. In addition to its excellent antioxidant capacity, previous studies have shown that ascorbic acid can act as an essential micronutrient in the human body due to its anti-aging [35] and even anti-cancer [36] effects. The absence of the L-gulono-γ-lactone oxidase (GLO) gene disrupts the synthesis of ascorbic acid [37], making the food intake the main source of ascorbic acid in humans. Consequently, the genetic basis underlying the accumulation and genetic improvement of ascorbic acid, primarily obtained from plants [38], has been extensively studied [39,40,41,42]. Similar to many plants, S. androgynus, which adopted the L-galactose pathway as the primary biosynthetic pathway, exhibited high expression of related genes and a high content of ascorbic acid [41,43]. Although several gene copies were identified in AO, the low expression level of related genes indicates that the recycling pathway of ascorbic acid in S. androgynus does not primarily depend on the transformation of the intermediate product dehydroascorbate to ascorbic acid, as catalyzed by AO (Figure 4B). In contrast, the high expression of APX- and MDHAR-related genes in the ascorbic acid recycling pathway promotes the transformation of the intermediate monodehydroascorbate into ascorbic acid. Taken together, the high ascorbic acid content in S. androgynus results from the high expression of related genes in the L-galactose pathway and recycling pathway.
The expansion of S. androgynus genes in pathways such as photosynthesis, oxidative phosphorylation, and phenylpropanoid biosynthesis implies the presence of specific physiological and metabolic mechanisms in this plant that are adapted to hot and humid regions (Figure 2D). For instance, the enrichment of the photosynthesis and oxidative phosphorylation pathways implies that S. androgynus may possess superior efficiency in the utilization of abundant sunlight and water [44,45]. Additionally, the biosynthesis of phenylpropanoid and benzoxazinoid, typically induced by environmental stimuli [46,47], whose metabolites, such as lignin, have been found to be important in resisting pathogenic invasion and abiotic stress [48], could also confer an advantage for the adaptation of S. androgynus to hot and humid environments.
The exceptionally delightful flavor of the leaves is also an attractive feature of S. androgynus. Enrichment profiling of the gene family expansions of S. androgynus points to its exceptional capacity for biosynthesis of secondary metabolites (Figure 2D). The biosynthetic pathway of phenylpropanoid, one of the main sources of plant color and aroma [49], and terpene compounds, which play an important role in the formation of flavor in species like grape [50] and wintersweet [51], are significantly enriched in S. androgynus.
As a medicinal plant, the discovery that the expansion of gene families related to the biosynthesis of secondary metabolites in S. androgynus is particularly significant, as the clinically curative effects of medicinal plants are associated with secondary metabolites [52]. Recent studies related to genome assembly in important medicinal plants have significantly advanced our understanding of secondary metabolism. For instance, the genome assembly of the traditional Chinese medicinal plant Artemisia argyi [53] has identified genes involved in the biosynthesis pathways of flavonoids and terpenoids, which possess various medicinal properties, including antioxidant, anti-cancer, and anti-inflammatory activities [54,55]. Another example is the genome assembly of Entada phaseoloides [56], which has identified genes involved in the biosynthesis of triterpenoid saponins, the main bioactive compounds in E. phaseoloides. These whole-genome sequencing studies not only enhance our understanding of the biology and evolution of medicinal plants but also facilitate the discovery of novel drug candidates and the development of sustainable plant-based therapies. As a result, they are crucial for promoting the use of traditional medicinal plants in modern healthcare and for preserving the biodiversity of these valuable genetic resources.

4. Materials and Methods

4.1. Plant Materials and Sequencing

For genome sequencing, leaves of a single S. androgynus were collected from the experimental field of the College of Agriculture, Fujian Agriculture and Forestry University (26°04 N, 119°14 E). High-quality genomic DNA was extracted from the leaves using a modified CTAB method [57].
For Illumina sequencing, a short-read (350 bp) library was constructed and sequenced with the Illumina NovaSeq platform (Illumina, San Diego, CA, USA), and 192.75 Gb of clean reads were obtained. For PacBio sequencing, genomic DNA was fragmented to 15 Kb to construct a long-read library according to the manufacturer’s instructions (Pacific Biosciences, Menlo Park, CA, USA), and then the library was sequenced with the PacBio Sequel II platform. After filtering out the low-quality reads and sequence adapters, we obtained 44.32 Gb of clean subreads with an N50 value of 16.01 kb.

4.2. Genome Features Estimation

The genome size of S. androgynus was estimated via k-mer and flow cytometry methods. For the k-mer method, the short-reads from the Illumina platform were quality-filtered using fastp [58]. The quality-filtered reads were used for the genome size estimation. We counted the 19 kmers with Jellyfish (v2.2.10) [59] software and calculated the genome characteristics using Genomescope 2.0 [60] software. For the flow cytometry method, nuclei suspensions of S. androgynus and Zea mays were analyzed using a flow cytometer (BD FACScalibur) and the corresponding software, Modifit (v3.0). The genome size of S. androgynus was determined through flow cytometry, with Z. mays (~2.3 Gb) serving as the internal standard. The karyotype of S. androgynus was determined using the following workflow. Chromosome preparation was performed as described previously [61].

4.3. Genome Assembly by CCS Data

A total of 44.32 Gb high-accuracy CCS data were assembled using hifiasm (v0.14) [62] software to obtain the genome sequences, which accounted for ~31.03× of the genome size estimated via k-mer analysis.

4.4. Hi-C Technology Help Anchor Contigs

We constructed Hi-C fragment libraries from 300–700 bp insert sizes, as illustrated in Rao et al. [63], and sequencing through Illumina platform. The 192.75 Gb clean Hi-C reads were first truncated at the putative Hi-C junctions and then the resulting trimmed reads were aligned to the assembly results with BWA aligner (v0.7.10). Invalid read pairs, including Dangling-End and Self-cycle, Re-ligation and Dumped products, were filtered using HiC-Pro (v2.8.1) [64]. The unique interaction pairs were used for correction of the contigs onto chromosomes via LACHESIS (https://github.com/shendurelab/LACHESIS (accessed on 22 January 2023)) [65]. The Hi-C data were mapped to these segments using BWA (v0.7.10-r789) [66] software.

4.5. Genome Quality Evaluation

The quality of the genome assembly was evaluated using the following three methods. Firstly, the assembled genome was submitted to the Embryophyta database in BUSCO (v5) [67] to evaluate the completeness of the genome. The CEGMA (v2.5) [68] was also used to evaluate the integrity of the final genome assembly. Finally, the short reads from the Illumina platform were aligned to the genome assembly using BWA-MEM (v0.7.10).

4.6. Annotation of Repetitive Sequences

The transposon element (TE) and tandem repeats were annotated via the following workflows. The TEs were identified by a combination of homology-based and de novo approaches. We first customized a de novo repeat library of the genome using RepeatModeler (v2.0.1) [69], which can automatically execute two de novo repeat finding programs, including RECON (v1.08) [70] and RepeatScout (v1.0.6) [71]. Then, the full-length long terminal repeat retrotransposons (fl-LTR-RTs) were identified using both LTRharvest (v1.5.9) [72] and LTR_finder (v1.07) [73]. The high-quality intact fl-LTR-RTs and non-redundant LTR library were then produced using LTR_retriever (v2.8) [74]. The flanking sequences on both sides of the LTR were extracted, compared using MAFFT (v7.205) [75] (-localpair -maxiterate 1000), and the distance was calculated via the Kimura model in EMBOSS (v6.6.0) [76]. The insertion time of the LTR elements was estimated according to the formula T = K/2r, where K is the divergence rate and r is the neutral mutation rate (7 × 10⁻⁹).
A non-redundant species-specific TE library was constructed by combining the de novo TE sequence library above with the known Repbase (v19.06) [77], REXdb (V3.0) [78] and Dfam (v3.2) [79] databases. The final TE sequences in the S. androgynus genome were identified and classified via a homology search against the library using RepeatMasker (v4.10) [80]. The tandem repeats were annotated via the Tandem Repeats Finder (v4.09) and MIcroSAtellite identification tool (MISA v2.1) [81].

4.7. Gene Prediction and Annotation

We integrated three approaches, namely, de novo prediction, homology search, and transcript-based assembly, to annotate the protein-coding genes in the genome. The de novo gene models were predicted using two ab initio gene-prediction software tools, Augustus (v2.4) [82] and SNAP (https://github.com/KorfLab/SNAP (accessed on 22 January 2023)) [83], with the training of the best candidate genes obtained via PASA (v2.0.2) software. For the homolog-based approach, GeMoMa (v1.7) [84] software was utilized by using the reference gene model from species including Arabidopsis thaliana (TAIR10), Hevea brasiliensis (GCA_030052815.1), Jatropha curcas (ftp://ftp.kazusa.or.jp/pub/jatropha/ (accessed on 22 January 2023)) and Manihot esculenta (https://phytozome.jgi.doe.gov/pz/portal.html#!info?alias=Org_Mesculenta (accessed on 22 January 2023)). For the transcript-based prediction, the RNA-sequencing data in this study were mapped to the reference genome using HISAT2 (v2.0.4) [85] and assembled via StringTie (v1.2.3) [86]. GeneMarkS-T (v5.1) was used to predict genes based on the assembled transcripts. PASA was used to predict genes based on the unigenes that were de novo assembled by Trinity (v2.11) [87]. The gene models from these different approaches were combined using the EVM software (v1.1.1) [88] and updated with the predicted genes from PASA with default parameters. The final gene models were annotated via BLAST (v2.2.31) against the NCBI’s non-redundant protein sequences (NR, 20200921), EggNOG (5.0) [89], TrEMBL (202005) [90], Pfam (33.1) [91], Swiss-Prot (202005) [90], eukaryotic orthologous groups of proteins (KOG, 20110125), gene ontology (GO, 20200615) [92,93] and Kyoto Encyclopedia of Genes and Genomes (KEGG, 20191220) [94] databases. The GO IDs for each gene were obtained from TrEMBL and EggNOG.
The GenBlastA (v1.0.4) [95] program was used to scan the whole genomes after masking the predicted functional genes. The putative pseudogene candidates were then analyzed by searching for non-mature mutations and frame-shift mutations using GeneWise (v2.4.1) [96]. For the non-coding RNA prediction, tRNAscan-SE (v1.3.1) [97] was used to predict tRNA with eukaryote parameters. Identification of the rRNA genes was conducted via Barrnap (v0.9) (https://github.com/tseemann/barrnap (accessed on 22 January 2023)). The miRNA genes were identified using BLAST based on searching the miRBase (release v.21) [98] databases. The snoRNA and snRNA genes were predicted using INFERNAL (v1.1) [99] against the Rfam (release v.12.0) [100] database.

4.8. Gene Family Identification

The longest transcript was selected to represent each gene with multiple isoforms. Proteins sequences from S. androgynus and 11 other species were used for the family classification using OrthoFinder (v2.4) [101]. The PANTHER (v14) [102] database was used to annotate the obtained gene families.

4.9. Phylogenetic Analysis

The protein sequences of the single-copy orthologs were aligned with the MAFFT (v7.205) program (-localpair -maxiterate 1000). Gblocks (v0.91b) [103] (−b5 = h) was used to remove regions with poor sequence alignment or large differences. All the well-aligned gene family sequences of each species were connected end-to-end. IQ-TREE (v1.6.11) [104] were used to construct the phylogenetic tree. ModelFinder [105] was used for the model selection, and the best model was obtained as JTT + F + I + G4, and then the maximum likelihood (ML) method was used to construct the evolutionary tree using this best model.
The MCMCtree with gradient and Hessian parameters from the PAML (v4.9i) [106] package was used to estimate the species divergence time based on the fossil times (P. trichocarpa vs. S. purpurea, A. trichopoda vs. S. purpurea, R. communis vs. M. esculenta, A. thaliana vs. M. esculenta) from TimeTree [107] (http://www.timetree.org (accessed on 22 January 2023)). A. trichopoda was selected as the outgroup and the root of the tree. The ML method, correlated molecular clock, and JC69 model were used to estimate the divergence times. Two repeated calculations were performed to evaluate the consistency. Finally, the phylogenetic tree with divergence times was graphically displayed using MCMCTreeR (v1.1) [108].

4.10. Gene Family Expansion and Contraction Analysis

Based on the gene family distribution and the phylogenetic tree with the predicted divergence time of those species, CAFÉ (v4.2) [109] was utilized to analyze the gene family expansion and contraction. In CAFÉ, a random birth and death model is proposed to study the gene gain or loss in gene families across a specified phylogenetic tree. Then, a conditional p-value was calculated for each gene family. The criteria for defining significant expansion or contraction of gene families were a family-wide p-value < 0.05 and a viterbi p-value < 0.05.

4.11. WGD Analysis

WGD events were identified via the Ks method using WGDI (v0.6.3) [110] software. The time of occurrence of WGD events was calculated using the formula divergence time = Ks/2r [111], where the r (average synonymous substitution rate) of Phyllanthaceae was estimated through the Ks distribution of the paralogous genes of S. androgynus and P. cochinchinensis as 0.4066/(2 × 29.67 × 106) = 6.85 × 10⁻⁹.

4.12. Genome Collinearity Analysis

The gene sequences of the two species were compared using DIAMOND (v0.9.29.130) [112] to identify similar gene pairs (E-value < 1E5, C-score > 0.5, where C-score values were filtered using JCVI (v0.9.13) [113] software). All the genes in the co-linearity blocks were obtained via MCScanX (https://github.com/wyp1125/MCScanX (accessed on 22 January 2023)) [114] (−m5). The macro- and micro-synteny between the S. androgynus and P. cochinchinensis genomes were visualized using JCVI. The collinearity on the chromosomes of the S. androgynus genome was visualized using Circos (v0.69) [115].

4.13. Transcriptome Analysis

The transcriptome data concerning the leaf, stem and flower from S. androgynus (SRA7983121, SRA7983122, SRA7983124) were downloaded from the NCBI database [116] and used to analyze the expression pattern of genes related to ascorbic acid biosynthesis and the recycling pathways. The adapters were removed and the first 12 low-quality bases of the reads were filtered using Trimmomatic (v0.39) [117]. The genome index was built and the reads were mapped to the genome using HISAT2 (v2.2.1) [118]. Samtools (v1.7) [119] was used to convert the sam file to a bam file. Stringtie (v1.2.3) [86] was applied to calculate the FPKM values, which were used to represent the transcript expression levels.
Ascorbic acid-related resources provided by a previous study [41] was used in this study. Specifically, based on the EggNOG annotation, we anchored the enzyme commission of the protein-coding genes of S. androgynus to the genes related to ascorbic acid biosynthesis and the recycling pathways. The expression level of the genes in the related pathways was graphically displayed using the ComplexHeatmap (v2.14.0) package [120] in R (v4.2.2).

5. Conclusions

This study presents a chromosome-level S. androgynus genome using PacBio sequencing and Hi-C techniques. The Ks distribution suggested that S. androgynus experienced a recent WGD event about 20.51 Mya and a γ event about 132.95 Mya. Collinearity analysis elucidated a 1:2 relationship between P. cochinchinensis and S. androgynus. The microsynteny patterns indicated that the expansion of pathways related to phloem development, lignin synthesis, and photosynthesis tended to contribute to the morphological differences among Phyllanthaceae species with various ploidies. This study identified the key regulatory genes of ascorbic acid biosynthesis and the recycling pathways, revealing the mechanism of ascorbic acid accumulation in S. androgynus, which provides a genetic basis for its targeted genetic improvement. In addition, this study provided genetic insights into the comprehensive pharmacological activities of S. androgynus, encompassing antioxidant activity, geographical distribution patterns and delightful flavor. Taken together, the findings of this study provide a valuable genomic resource for S. androgynus, demonstrating the complex ploidy of species within the Phyllanthaceae family. These findings will not only enhance our comprehension of their inherent value but also pave the way for exploitation and utilization.

Supplementary Materials

The following supporting information can be downloaded at https://www.mdpi.com/article/10.3390/ijms25010300/s1.

Author Contributions

Conceptualization, L.Y. and F.L.; methodology, L.Y. and F.L.; software, F.X., B.L. and K.S.; validation, B.L., Z.H., H.L. and X.Z.; formal analysis, F.X., B.L., K.S. and Y.W.; investigation, F.X., B.L., K.S., Y.W. and Z.H.; resources, F.X. and Y.W.; data curation, L.Y. and F.L.; writing—original draft preparation, F.X., B.L., K.S. and F.L.; writing—review and editing, F.X., B.L., K.S., L.Y. and F.L.; visualization, F.X., B.L. and K.S.; supervision, L.Y. and F.L.; project administration, L.Y. and F.L.; funding acquisition, F.X. and L.Y. All authors have read and agreed to the published version of the manuscript.

Funding

This research was funded by the Foundation of Wuzhishan Science and Technology and Industrial Information Bureau (WZSKJXM202002) and Shandong Province Modern Agricultural Technology System Innovation Team (SDAIT-25-01).

Institutional Review Board Statement

Not applicable.

Informed Consent Statement

Not applicable.

Data Availability Statement

The assembly data were submitted to the Chinese National Genomics Data Center (NGDC; https://ngdc.cncb.ac.cn/ (accessed on 3 September 2023)) under accession number PRJCA018066. The raw data generated in this study were deposited in the National Center for Biotechnology Information (NCBI; https://www.ncbi.nlm.nih.gov/ (accessed on 3 September 2023)) Sequence Read Archive under BioProject accession number PRJNA990470.

Acknowledgments

We sincerely thank each author who contributed to this study. Specifically, we thank Liangwei Li (BGI-Qingdao) for the analysis suggestions, Yongji Huang (Minjiang University, Fuzhou, 350108, China) for providing the image of the karyotype in S. androgynus, and Shifang Pan (Fujian Agriculture and Forestry University, Fuzhou 350002, China) for the resources management.

Conflicts of Interest

The authors declare no conflicts of interest.

References

  1. Zhang, B.D.; Cheng, J.X.; Zhang, C.F.; Bai, Y.D.; Liu, W.Y.; Li, W.; Koike, K.; Akihisa, T.; Feng, F.; Zhang, J. Sauropus androgynus L. Merr.—A phytochemical, pharmacological and toxicological review. J. Ethnopharmacol. 2020, 257, 112778. [Google Scholar] [CrossRef] [PubMed]
  2. Singh, S.; Singh, D.R.; Salim, K.M.; Srivastava, A.; Singh, L.B.; Srivastava, R.C. Estimation of proximate composition, micronutrients and phytochemical compounds in traditional vegetables from Andaman and Nicobar Islands. Int. J. Food Sci. Nutr. 2011, 62, 765–773. [Google Scholar] [CrossRef] [PubMed]
  3. Neamsuvan, O.; Ruangrit, T. A survey of herbal weeds that are used to treat gastrointestinal disorders from southern Thailand: Krabi and Songkhla provinces. J. Ethnopharmacol. 2017, 209, 318–327. [Google Scholar] [CrossRef] [PubMed]
  4. Madhu, C.S.; Manukumar, H.M.G.; Basavaraju, P. New-vista in fi nding antioxidant and anti-infl ammatory property of crude protein extract from Sauropus androgynus leaf. Acta Sci. Polon-Technol. 2014, 13, 375–383. [Google Scholar] [CrossRef] [PubMed]
  5. Nahak, D.G.; Sahu, R. Free Radical Scavenging activity of Multi-vitamin Plant (Sauropus androgynus L. Merr). Researcher 2010, 2, 6–14. [Google Scholar]
  6. Bunawan, H.; Bunawan, S.N.; Baharum, S.N.; Noor, N.M. Sauropus androgynus (L.) Merr. Induced Bronchiolitis Obliterans: From Botanical Studies to Toxicology. Evid. Based Complement. Alternat. Med. 2015, 2015, 714158. [Google Scholar] [CrossRef] [PubMed]
  7. Petrus, A.J.A. Sauropus androgynus (L.) Merrill-A Potentially Nutritive Functional Leafy-Vegetable. Asian J. Chem. 2013, 25, 9425–9433. [Google Scholar] [CrossRef]
  8. Padmavathi, P.; Rao, M.P. Nutritive value of Sauropus androgynus leaves. Plant Foods Hum. Nutr. 1990, 40, 107–113. [Google Scholar] [CrossRef]
  9. Hulshof, P.J.M.; Xu, C.; van de Bovenkamp, P.; Muhilal; West, C.E. Application of a Validated Method for the Determination of Provitamin A Carotenoids in Indonesian Foods of Different Maturity and Origin. J. Agric. Food Chem. 1997, 45, 1174–1179. [Google Scholar] [CrossRef]
  10. Andarwulan, N.; Kurniasih, D.; Apriady, R.; Rahmat, H.; Roto, A.; Bolling, B. Polyphenols, carotenoids, and ascorbic acid in underutilized medicinal vegetables. J. Funct. Foods 2012, 4, 339–347. [Google Scholar] [CrossRef]
  11. Miean, K.; Mohamed, S. Flavonoid (Myricetin, Quercetin, Kaempferol, Luteolin, and Apigenin) Content of Edible Tropical Plants. J. Agric. Food Chem. 2001, 49, 3106–3112. [Google Scholar] [CrossRef]
  12. Kuttinath, S.; Kh, H.; Rammohan, R. Phytochemical screening, antioxidant, antimicrobial, and antibiofilm activity of Sauropus androgynus leaf extracts. Asian J. Pharm. Clin. Res. 2019, 12, 244–250. [Google Scholar] [CrossRef]
  13. Palombo, E.A.; Semple, S.J. Antibacterial activity of traditional Australian medicinal plants. J. Ethnopharmacol. 2001, 77, 151–157. [Google Scholar] [CrossRef]
  14. Kathriarachchi, H.; Samuel, R.; Hoffmann, P.; Mlinarec, J.; Wurdack, K.J.; Ralimanana, H.; Stuessy, T.F.; Chase, M.W. Phylogenetics of tribe Phyllantheae (Phyllanthaceae; Euphorbiaceae sensu lato) based on nrITS and plastid matK DNA sequence data. Am. J. Bot. 2006, 93, 637–655. [Google Scholar] [CrossRef]
  15. Webster, G.L. Synopsis of the Genera and Suprageneric Taxa of Euphorbiaceae. Ann. Mo. Bot. Gard. 1994, 81, 33–144. [Google Scholar] [CrossRef]
  16. GROUP, T.A.P. An update of the Angiosperm Phylogeny Group classification for the orders and families of flowering plants: APG II. Bot. J. Linn. Soc. 2003, 141, 399–436. [Google Scholar] [CrossRef]
  17. Ekasari, W.; Fatmawati, D.; Khoiriah, S.M.; Baqiuddin, W.A.; Nisa, H.Q.; Maharupini, A.A.S.; Wahyuni, T.S.; Oktarina, R.D.; Suhartono, E.; Sahu, R.K. Antimalarial Activity of Extract and Fractions of Sauropus androgynus (L.) Merr. Scientifica 2022, 2022, 3552491. [Google Scholar] [CrossRef]
  18. Mustarichie, R.; Salsabila, T.; Iskandar, Y. Determination of the Major Component of Water Fraction of Katuk (Sauropus androgynous (L.) Merr.) Leaves by Liquid Chromatography-Mass Spectrometry. J. Pharm. Bioallied Sci. 2019, 11, S611–S618. [Google Scholar] [CrossRef]
  19. Sattler, M.C.; Carvalho, C.R.; Clarindo, W.R. The polyploidy and its key role in plant breeding. Planta 2016, 243, 281–296. [Google Scholar] [CrossRef]
  20. Orr-Weaver, T.L. When bigger is better: The role of polyploidy in organogenesis. Trends Genet. 2015, 31, 307–315. [Google Scholar] [CrossRef]
  21. Chen, R.; Chen, C.; Song, W.; Liang, G.; Li, X.; Chen, L.; Wang, G.; Ma, X.; Wang, W. Chromosome Atlas of Major Eco-Nomic Plants Genome in China Tomus V Chromosome Atlas of Medicinal Plants in China, 1st ed.; Science Press: Beijing, China, 2009; pp. 274–288. [Google Scholar]
  22. Zhang, W.; Xu, S.; Gu, Y.; Jiao, M.; Mei, Y.; Wang, J. The first high-quality chromosome-level genome assembly of Phyllanthaceae (Phyllanthus cochinchinensis) provides insights into flavonoid biosynthesis. Planta 2022, 256, 109. [Google Scholar] [CrossRef]
  23. Jiao, Y.; Wickett, N.J.; Ayyampalayam, S.; Chanderbali, A.S.; Landherr, L.; Ralph, P.E.; Tomsho, L.P.; Hu, Y.; Liang, H.; Soltis, P.S.; et al. Ancestral polyploidy in seed plants and angiosperms. Nature 2011, 473, 97–100. [Google Scholar] [CrossRef]
  24. Qiao, X.; Li, Q.; Yin, H.; Qi, K.; Li, L.; Wang, R.; Zhang, S.; Paterson, A.H. Gene duplication and evolution in recurring polyploidization-diploidization cycles in plants. Genome Biol. 2019, 20, 38. [Google Scholar] [CrossRef]
  25. Jiao, Y.; Leebens-Mack, J.; Ayyampalayam, S.; Bowers, J.E.; McKain, M.R.; McNeal, J.; Rolf, M.; Ruzicka, D.R.; Wafula, E.; Wickett, N.J.; et al. A genome triplication associated with early diversification of the core eudicots. Genome Biol. 2012, 13, R3. [Google Scholar] [CrossRef]
  26. Lu, J.-M.; Landrein, S.; Song, X.-Z.; Wu, M.; Xiao, C.-F.; Sun, P.; Jia, H.-Z.; Yue, J.-R.; Xu, Y.-K. Polyploidy leads to phenotypic differences between tetraploid Kaempferia galanga var. latifolia and pentaploid K. galanga var. galanga (Zingiberaceae). Sci. Hortic. 2023, 307, 111527. [Google Scholar] [CrossRef]
  27. Tavan, M.; Azizi, A.; Sarikhani, H.; Mirjalili, M.H.; Rigano, M.M. Induced polyploidy and broad variation in phytochemical traits and altered gene expression in Salvia multicaulis. Sci. Hortic. 2022, 291, 110592. [Google Scholar] [CrossRef]
  28. Sugimoto, H.; Tanaka, T.; Muramoto, N.; Kitagawa-Yogo, R.; Mitsukawa, N. Transcription factor NTL9 negatively regulates Arabidopsis vascular cambium development during stem secondary growth. Plant Physiol. 2022, 190, 1731–1746. [Google Scholar] [CrossRef]
  29. Ragni, L.; Greb, T. Secondary growth as a determinant of plant shape and form. Semin. Cell Dev. Biol. 2018, 79, 58–67. [Google Scholar] [CrossRef]
  30. Shimizu-Inatsugi, R.; Terada, A.; Hirose, K.; Kudoh, H.; Sese, J.; Shimizu, K.K. Plant adaptive radiation mediated by polyploid plasticity in transcriptomes. Mol. Ecol. 2017, 26, 193–207. [Google Scholar] [CrossRef] [PubMed]
  31. Huang, G.; Zhu, Y.X. Plant polyploidy and evolution. J. Integr. Plant Biol. 2019, 61, 4–6. [Google Scholar] [CrossRef] [PubMed]
  32. Rothfels, C.J. Polyploid phylogenetics. New Phytol. 2021, 230, 66–72. [Google Scholar] [CrossRef] [PubMed]
  33. Chansler, M.T.; Ferguson, C.J.; Fehlberg, S.D.; Prather, L.A. The role of polyploidy in shaping morphological diversity in natural populations of Phlox amabilis. Am. J. Bot. 2016, 103, 1546–1558. [Google Scholar] [CrossRef] [PubMed]
  34. Smirnoff, N. Ascorbic acid metabolism and functions: A comparison of plants and mammals. Free Radic Biol. Med. 2018, 122, 116–129. [Google Scholar] [CrossRef] [PubMed]
  35. Pullar, J.M.; Carr, A.C.; Vissers, M.C.M. The Roles of Vitamin C in Skin Health. Nutrients 2017, 9, 866. [Google Scholar] [CrossRef] [PubMed]
  36. Ngo, B.; Van Riper, J.M.; Cantley, L.C.; Yun, J. Targeting cancer vulnerabilities with high-dose vitamin C. Nat. Rev. Cancer 2019, 19, 271–282. [Google Scholar] [CrossRef] [PubMed]
  37. Drouin, G.; Godin, J.R.; Page, B. The genetics of vitamin C loss in vertebrates. Curr. Genom. 2011, 12, 371–378. [Google Scholar] [CrossRef] [PubMed]
  38. Macknight, R.C.; Laing, W.A.; Bulley, S.M.; Broad, R.C.; Johnson, A.A.; Hellens, R.P. Increasing ascorbate levels in crops to enhance human nutrition and plant abiotic stress tolerance. Curr. Opin. Biotechnol. 2017, 44, 153–160. [Google Scholar] [CrossRef]
  39. Li, T.; Yang, X.; Yu, Y.; Si, X.; Zhai, X.; Zhang, H.; Dong, W.; Gao, C.; Xu, C. Domestication of wild tomato is accelerated by genome editing. Nat. Biotechnol. 2018, 36, 1160–1163. [Google Scholar] [CrossRef]
  40. Li, Y.; Liu, G.F.; Ma, L.M.; Liu, T.K.; Zhang, C.W.; Xiao, D.; Zheng, H.K.; Chen, F.; Hou, X.L. A chromosome-level reference genome of non-heading Chinese cabbage [Brassica campestris (syn. Brassica rapa) ssp. chinensis]. Hortic. Res. 2020, 7, 212. [Google Scholar] [CrossRef]
  41. Feng, C.; Feng, C.; Lin, X.; Liu, S.; Li, Y.; Kang, M. A chromosome-level genome assembly provides insights into ascorbic acid accumulation and fruit softening in guava (Psidium guajava). Plant Biotechnol. J. 2021, 19, 717–730. [Google Scholar] [CrossRef]
  42. Liu, H.; Wei, L.; Ni, Y.; Chang, L.; Dong, J.; Zhong, C.; Sun, R.; Li, S.; Xiong, R.; Wang, G.; et al. Genome-Wide Analysis of Ascorbic Acid Metabolism Related Genes in Fragaria × ananassa and Its Expression Pattern Analysis in Strawberry Fruits. Front. Plant Sci. 2022, 13, 954505. [Google Scholar] [CrossRef] [PubMed]
  43. Liu, M.J.; Zhao, J.; Cai, Q.L.; Liu, G.C.; Wang, J.R.; Zhao, Z.H.; Liu, P.; Dai, L.; Yan, G.; Wang, W.J.; et al. The complex jujube genome provides insights into fruit tree biology. Nat. Commun. 2014, 5, 5315. [Google Scholar] [CrossRef] [PubMed]
  44. Deans, R.M.; Brodribb, T.J.; Busch, F.A.; Farquhar, G.D. Plant water-use strategy mediates stomatal effects on the light induction of photosynthesis. New Phytol. 2019, 222, 382–395. [Google Scholar] [CrossRef] [PubMed]
  45. Braun, H.P. The Oxidative Phosphorylation system of the mitochondria in plants. Mitochondrion 2020, 53, 66–75. [Google Scholar] [CrossRef] [PubMed]
  46. Cesarino, I.; Eudes, A.; Urbanowicz, B.; Xie, M. Editorial: Phenylpropanoid Systems Biology and Biotechnology. Front. Plant Sci. 2022, 13, 866164. [Google Scholar] [CrossRef] [PubMed]
  47. de Bruijn, W.J.C.; Gruppen, H.; Vincken, J.P. Structure and biosynthesis of benzoxazinoids: Plant defence metabolites with potential as antimicrobial scaffolds. Phytochemistry 2018, 155, 233–243. [Google Scholar] [CrossRef] [PubMed]
  48. Dong, N.Q.; Lin, H.X. Contribution of phenylpropanoid metabolism to plant development and plant-environment interactions. J. Integr. Plant Biol. 2021, 63, 180–209. [Google Scholar] [CrossRef]
  49. Mei, X.; Wan, S.; Lin, C.; Zhou, C.; Hu, L.; Deng, C.; Zhang, L. Integration of Metabolome and Transcriptome Reveals the Relationship of Benzenoid-Phenylpropanoid Pigment and Aroma in Purple Tea Flowers. Front. Plant Sci. 2021, 12, 762330. [Google Scholar] [CrossRef]
  50. Wu, Y.; Duan, S.; Zhao, L.; Gao, Z.; Luo, M.; Song, S.; Xu, W.; Zhang, C.; Ma, C.; Wang, S. Aroma characterization based on aromatic series analysis in table grapes. Sci. Rep. 2016, 6, 31116. [Google Scholar] [CrossRef]
  51. Shang, J.; Tian, J.; Cheng, H.; Yan, Q.; Li, L.; Jamal, A.; Xu, Z.; Xiang, L.; Saski, C.A.; Jin, S.; et al. The chromosome-level wintersweet (Chimonanthus praecox) genome provides insights into floral scent biosynthesis and flowering in winter. Genome Biol. 2020, 21, 200. [Google Scholar] [CrossRef]
  52. Li, Y.; Kong, D.; Fu, Y.; Sussman, M.R.; Wu, H. The effect of developmental and environmental factors on secondary metabolites in medicinal plants. Plant Physiol. Biochem. 2020, 148, 80–89. [Google Scholar] [CrossRef] [PubMed]
  53. Miao, Y.; Luo, D.; Zhao, T.; Du, H.; Liu, Z.; Xu, Z.; Guo, L.; Chen, C.; Peng, S.; Li, J.X.; et al. Genome sequencing reveals chromosome fusion and extensive expansion of genes related to secondary metabolism in Artemisia argyi. Plant Biotechnol. J. 2022, 20, 1902–1915. [Google Scholar] [CrossRef] [PubMed]
  54. Al-Khayri, J.M.; Sahana, G.R.; Nagella, P.; Joseph, B.V.; Alessa, F.M.; Al-Mssallem, M.Q. Flavonoids as Potential Anti-Inflammatory Molecules: A Review. Molecules 2022, 27, 2901. [Google Scholar] [CrossRef]
  55. Jaeger, R.; Cuny, E. Terpenoids with Special Pharmacological Significance: A Review. Nat. Prod. Commun. 2016, 11, 1373–1390. [Google Scholar] [CrossRef]
  56. Lin, M.; Jian, J.B.; Zhou, Z.Q.; Chen, C.H.; Wang, W.; Xiong, H.; Mei, Z.N. Chromosome-level genome of Entada phaseoloides provides insights into genome evolution and biosynthesis of triterpenoid saponins. Mol. Ecol. Resour. 2022, 22, 3049–3067. [Google Scholar] [CrossRef]
  57. Abu Almakarem, A.S.; Heilman, K.L.; Conger, H.L.; Shtarkman, Y.M.; Rogers, S.O. Extraction of DNA from plant and fungus tissues in situ. BMC Res. Notes 2012, 5, 266. [Google Scholar] [CrossRef]
  58. Chen, S.; Zhou, Y.; Chen, Y.; Gu, J. fastp: An ultra-fast all-in-one FASTQ preprocessor. Bioinformatics 2018, 34, i884–i890. [Google Scholar] [CrossRef]
  59. Marcais, G.; Kingsford, C. A fast, lock-free approach for efficient parallel counting of occurrences of k-mers. Bioinformatics 2011, 27, 764–770. [Google Scholar] [CrossRef]
  60. Ranallo-Benavidez, T.R.; Jaron, K.S.; Schatz, M.C. GenomeScope 2.0 and Smudgeplot for reference-free profiling of polyploid genomes. Nat. Commun. 2020, 11, 1432. [Google Scholar] [CrossRef]
  61. Huang, Y.; Ding, W.; Zhang, M.; Han, J.; Jing, Y.; Yao, W.; Hasterok, R.; Wang, Z.; Wang, K. The formation and evolution of centromeric satellite repeats in Saccharum species. Plant J. 2021, 106, 616–629. [Google Scholar] [CrossRef] [PubMed]
  62. Cheng, H.; Concepcion, G.T.; Feng, X.; Zhang, H.; Li, H. Haplotype-resolved de novo assembly using phased assembly graphs with hifiasm. Nat. Methods 2021, 18, 170–175. [Google Scholar] [CrossRef] [PubMed]
  63. Rao, S.S.; Huntley, M.H.; Durand, N.C.; Stamenova, E.K.; Bochkov, I.D.; Robinson, J.T.; Sanborn, A.L.; Machol, I.; Omer, A.D.; Lander, E.S.; et al. A 3D map of the human genome at kilobase resolution reveals principles of chromatin looping. Cell 2014, 159, 1665–1680. [Google Scholar] [CrossRef] [PubMed]
  64. Servant, N.; Varoquaux, N.; Lajoie, B.R.; Viara, E.; Chen, C.J.; Vert, J.P.; Heard, E.; Dekker, J.; Barillot, E. HiC-Pro: An optimized and flexible pipeline for Hi-C data processing. Genome Biol. 2015, 16, 259. [Google Scholar] [CrossRef] [PubMed]
  65. Burton, J.N.; Adey, A.; Patwardhan, R.P.; Qiu, R.; Kitzman, J.O.; Shendure, J. Chromosome-scale scaffolding of de novo genome assemblies based on chromatin interactions. Nat. Biotechnol. 2013, 31, 1119–1125. [Google Scholar] [CrossRef] [PubMed]
  66. Li, H.; Durbin, R. Fast and accurate short read alignment with Burrows-Wheeler transform. Bioinformatics 2009, 25, 1754–1760. [Google Scholar] [CrossRef]
  67. Simao, F.A.; Waterhouse, R.M.; Ioannidis, P.; Kriventseva, E.V.; Zdobnov, E.M. BUSCO: Assessing genome assembly and annotation completeness with single-copy orthologs. Bioinformatics 2015, 31, 3210–3212. [Google Scholar] [CrossRef]
  68. Parra, G.; Bradnam, K.; Korf, I. CEGMA: A pipeline to accurately annotate core genes in eukaryotic genomes. Bioinformatics 2007, 23, 1061–1067. [Google Scholar] [CrossRef]
  69. Flynn, J.M.; Hubley, R.; Goubert, C.; Rosen, J.; Clark, A.G.; Feschotte, C.; Smit, A.F. RepeatModeler2 for automated genomic discovery of transposable element families. Proc. Natl. Acad. Sci. USA 2020, 117, 9451–9457. [Google Scholar] [CrossRef]
  70. Bao, Z.; Eddy, S.R. Automated de novo identification of repeat sequence families in sequenced genomes. Genome Res. 2002, 12, 1269–1276. [Google Scholar] [CrossRef]
  71. Price, A.L.; Jones, N.C.; Pevzner, P.A. De novo identification of repeat families in large genomes. Bioinformatics 2005, 21 (Suppl. S1), i351–i358. [Google Scholar] [CrossRef]
  72. Ellinghaus, D.; Kurtz, S.; Willhoeft, U. LTRharvest, an efficient and flexible software for de novo detection of LTR retrotransposons. BMC Bioinform. 2008, 9, 18. [Google Scholar] [CrossRef] [PubMed]
  73. Xu, Z.; Wang, H. LTR_FINDER: An efficient tool for the prediction of full-length LTR retrotransposons. Nucleic Acids Res. 2007, 35, W265–W268. [Google Scholar] [CrossRef] [PubMed]
  74. Ou, S.; Jiang, N. LTR_retriever: A Highly Accurate and Sensitive Program for Identification of Long Terminal Repeat Retrotransposons. Plant Physiol. 2018, 176, 1410–1422. [Google Scholar] [CrossRef] [PubMed]
  75. Katoh, K.; Asimenos, G.; Toh, H. Multiple alignment of DNA sequences with MAFFT. Methods Mol. Biol. 2009, 537, 39–64. [Google Scholar] [CrossRef]
  76. Rice, P.; Longden, I.; Bleasby, A. EMBOSS: The European Molecular Biology Open Software Suite. Trends Genet. 2000, 16, 276–277. [Google Scholar] [CrossRef]
  77. Jurka, J.; Kapitonov, V.V.; Pavlicek, A.; Klonowski, P.; Kohany, O.; Walichiewicz, J. Repbase Update, a database of eukaryotic repetitive elements. Cytogenet. Genome Res. 2005, 110, 462–467. [Google Scholar] [CrossRef]
  78. Neumann, P.; Novak, P.; Hostakova, N.; Macas, J. Systematic survey of plant LTR-retrotransposons elucidates phylogenetic relationships of their polyprotein domains and provides a reference for element classification. Mob. DNA 2019, 10, 1. [Google Scholar] [CrossRef]
  79. Wheeler, T.J.; Clements, J.; Eddy, S.R.; Hubley, R.; Jones, T.A.; Jurka, J.; Smit, A.F.; Finn, R.D. Dfam: A database of repetitive DNA based on profile hidden Markov models. Nucleic Acids Res. 2013, 41, D70–D82. [Google Scholar] [CrossRef]
  80. Tarailo-Graovac, M.; Chen, N. Using RepeatMasker to identify repetitive elements in genomic sequences. Curr. Protoc. Bioinform. 2009, 5, 4–10. [Google Scholar] [CrossRef]
  81. Beier, S.; Thiel, T.; Munch, T.; Scholz, U.; Mascher, M. MISA-web: A web server for microsatellite prediction. Bioinformatics 2017, 33, 2583–2585. [Google Scholar] [CrossRef]
  82. Stanke, M.; Steinkamp, R.; Waack, S.; Morgenstern, B. AUGUSTUS: A web server for gene finding in eukaryotes. Nucleic Acids Res. 2004, 32, W309–W312. [Google Scholar] [CrossRef]
  83. Korf, I. Gene finding in novel genomes. BMC Bioinform. 2004, 5, 59. [Google Scholar] [CrossRef]
  84. Keilwagen, J.; Hartung, F.; Grau, J. GeMoMa: Homology-Based Gene Prediction Utilizing Intron Position Conservation and RNA-seq Data. Methods Mol. Biol. 2019, 1962, 161–177. [Google Scholar] [CrossRef]
  85. Kim, D.; Langmead, B.; Salzberg, S.L. HISAT: A fast spliced aligner with low memory requirements. Nat. Methods 2015, 12, 357–360. [Google Scholar] [CrossRef]
  86. Pertea, M.; Pertea, G.M.; Antonescu, C.M.; Chang, T.C.; Mendell, J.T.; Salzberg, S.L. StringTie enables improved reconstruction of a transcriptome from RNA-seq reads. Nat. Biotechnol. 2015, 33, 290–295. [Google Scholar] [CrossRef]
  87. Grabherr, M.G.; Haas, B.J.; Yassour, M.; Levin, J.Z.; Thompson, D.A.; Amit, I.; Adiconis, X.; Fan, L.; Raychowdhury, R.; Zeng, Q.; et al. Full-length transcriptome assembly from RNA-Seq data without a reference genome. Nat. Biotechnol. 2011, 29, 644–652. [Google Scholar] [CrossRef]
  88. Haas, B.J.; Salzberg, S.L.; Zhu, W.; Pertea, M.; Allen, J.E.; Orvis, J.; White, O.; Buell, C.R.; Wortman, J.R. Automated eukaryotic gene structure annotation using EVidenceModeler and the Program to Assemble Spliced Alignments. Genome Biol. 2008, 9, R7. [Google Scholar] [CrossRef]
  89. Huerta-Cepas, J.; Szklarczyk, D.; Heller, D.; Hernandez-Plaza, A.; Forslund, S.K.; Cook, H.; Mende, D.R.; Letunic, I.; Rattei, T.; Jensen, L.J.; et al. eggNOG 5.0: A hierarchical, functionally and phylogenetically annotated orthology resource based on 5090 organisms and 2502 viruses. Nucleic Acids Res. 2019, 47, D309–D314. [Google Scholar] [CrossRef]
  90. Boeckmann, B.; Bairoch, A.; Apweiler, R.; Blatter, M.C.; Estreicher, A.; Gasteiger, E.; Martin, M.J.; Michoud, K.; O’Donovan, C.; Phan, I.; et al. The SWISS-PROT protein knowledgebase and its supplement TrEMBL in 2003. Nucleic Acids Res. 2003, 31, 365–370. [Google Scholar] [CrossRef] [PubMed]
  91. Finn, R.D.; Tate, J.; Mistry, J.; Coggill, P.C.; Sammut, S.J.; Hotz, H.R.; Ceric, G.; Forslund, K.; Eddy, S.R.; Sonnhammer, E.L.; et al. The Pfam protein families database. Nucleic Acids Res. 2008, 36, D281–D288. [Google Scholar] [CrossRef] [PubMed]
  92. Gene Ontology, C. The Gene Ontology resource: Enriching a GOld mine. Nucleic Acids Res. 2021, 49, D325–D334. [Google Scholar] [CrossRef] [PubMed]
  93. Ashburner, M.; Ball, C.A.; Blake, J.A.; Botstein, D.; Butler, H.; Cherry, J.M.; Davis, A.P.; Dolinski, K.; Dwight, S.S.; Eppig, J.T.; et al. Gene ontology: Tool for the unification of biology. The Gene Ontology Consortium. Nat. Genet. 2000, 25, 25–29. [Google Scholar] [CrossRef] [PubMed]
  94. Kanehisa, M.; Goto, S.; Sato, Y.; Furumichi, M.; Tanabe, M. KEGG for integration and interpretation of large-scale molecular data sets. Nucleic Acids Res. 2012, 40, D109–D114. [Google Scholar] [CrossRef] [PubMed]
  95. She, R.; Chu, J.S.; Wang, K.; Pei, J.; Chen, N. GenBlastA: Enabling BLAST to identify homologous gene sequences. Genome Res. 2009, 19, 143–149. [Google Scholar] [CrossRef] [PubMed]
  96. Birney, E.; Clamp, M.; Durbin, R. GeneWise and Genomewise. Genome Res. 2004, 14, 988–995. [Google Scholar] [CrossRef] [PubMed]
  97. Chan, P.P.; Lowe, T.M. tRNAscan-SE: Searching for tRNA Genes in Genomic Sequences. Methods Mol. Biol. 2019, 1962, 1–14. [Google Scholar] [CrossRef] [PubMed]
  98. Griffiths-Jones, S.; Grocock, R.J.; van Dongen, S.; Bateman, A.; Enright, A.J. miRBase: microRNA sequences, targets and gene nomenclature. Nucleic Acids Res. 2006, 34, D140–D144. [Google Scholar] [CrossRef] [PubMed]
  99. Nawrocki, E.P.; Eddy, S.R. Infernal 1.1: 100-fold faster RNA homology searches. Bioinformatics 2013, 29, 2933–2935. [Google Scholar] [CrossRef]
  100. Finn, R.D.; Coggill, P.; Eberhardt, R.Y.; Eddy, S.R.; Mistry, J.; Mitchell, A.L.; Potter, S.C.; Punta, M.; Qureshi, M.; Sangrador-Vegas, A.; et al. The Pfam protein families database: Towards a more sustainable future. Nucleic Acids Res. 2016, 44, D279–D285. [Google Scholar] [CrossRef]
  101. Emms, D.M.; Kelly, S. OrthoFinder: Phylogenetic orthology inference for comparative genomics. Genome Biol. 2019, 20, 238. [Google Scholar] [CrossRef]
  102. Mi, H.; Muruganujan, A.; Ebert, D.; Huang, X.; Thomas, P.D. PANTHER version 14: More genomes, a new PANTHER GO-slim and improvements in enrichment analysis tools. Nucleic Acids Res. 2019, 47, D419–D426. [Google Scholar] [CrossRef] [PubMed]
  103. Talavera, G.; Castresana, J. Improvement of phylogenies after removing divergent and ambiguously aligned blocks from protein sequence alignments. Syst. Biol. 2007, 56, 564–577. [Google Scholar] [CrossRef] [PubMed]
  104. Nguyen, L.T.; Schmidt, H.A.; von Haeseler, A.; Minh, B.Q. IQ-TREE: A fast and effective stochastic algorithm for estimating maximum-likelihood phylogenies. Mol. Biol. Evol. 2015, 32, 268–274. [Google Scholar] [CrossRef] [PubMed]
  105. Kalyaanamoorthy, S.; Minh, B.Q.; Wong, T.K.F.; von Haeseler, A.; Jermiin, L.S. ModelFinder: Fast model selection for accurate phylogenetic estimates. Nat. Methods 2017, 14, 587–589. [Google Scholar] [CrossRef] [PubMed]
  106. Yang, Z. PAML: A program package for phylogenetic analysis by maximum likelihood. Comput. Appl. Biosci. 1997, 13, 555–556. [Google Scholar] [CrossRef]
  107. Kumar, S.; Stecher, G.; Suleski, M.; Hedges, S.B. TimeTree: A Resource for Timelines, Timetrees, and Divergence Times. Mol. Biol. Evol. 2017, 34, 1812–1819. [Google Scholar] [CrossRef]
  108. Puttick, M.N. MCMCtreeR: Functions to prepare MCMCtree analyses and visualize posterior ages on trees. Bioinformatics 2019, 35, 5321–5322. [Google Scholar] [CrossRef]
  109. Han, M.V.; Thomas, G.W.; Lugo-Martinez, J.; Hahn, M.W. Estimating gene gain and loss rates in the presence of error in genome assembly and annotation using CAFE 3. Mol. Biol. Evol. 2013, 30, 1987–1997. [Google Scholar] [CrossRef]
  110. Sun, P.; Jiao, B.; Yang, Y.; Shan, L.; Li, T.; Li, X.; Xi, Z.; Wang, X.; Liu, J. WGDI: A user-friendly toolkit for evolutionary analyses of whole-genome duplications and ancestral karyotypes. Mol. Plant 2022, 15, 1841–1851. [Google Scholar] [CrossRef]
  111. Badouin, H.; Gouzy, J.; Grassa, C.J.; Murat, F.; Staton, S.E.; Cottret, L.; Lelandais-Briere, C.; Owens, G.L.; Carrere, S.; Mayjonade, B.; et al. The sunflower genome provides insights into oil metabolism, flowering and Asterid evolution. Nature 2017, 546, 148–152. [Google Scholar] [CrossRef]
  112. Buchfink, B.; Xie, C.; Huson, D.H. Fast and sensitive protein alignment using DIAMOND. Nat. Methods 2015, 12, 59–60. [Google Scholar] [CrossRef] [PubMed]
  113. Tang, H.; Krishnakumar, V.; Li, J.; jcvi: JCVI Utility Libraries. Zenodo. 2015. Available online: https://zenodo.org/records/31631 (accessed on 22 January 2023).
  114. Wang, Y.; Tang, H.; Debarry, J.D.; Tan, X.; Li, J.; Wang, X.; Lee, T.H.; Jin, H.; Marler, B.; Guo, H.; et al. MCScanX: A toolkit for detection and evolutionary analysis of gene synteny and collinearity. Nucleic Acids Res. 2012, 40, e49. [Google Scholar] [CrossRef] [PubMed]
  115. Krzywinski, M.; Schein, J.; Birol, I.; Connors, J.; Gascoyne, R.; Horsman, D.; Jones, S.J.; Marra, M.A. Circos: An information aesthetic for comparative genomics. Genome Res. 2009, 19, 1639–1645. [Google Scholar] [CrossRef] [PubMed]
  116. Katz, K.; Shutov, O.; Lapoint, R.; Kimelman, M.; Brister, J.R.; O’Sullivan, C. The Sequence Read Archive: A decade more of explosive growth. Nucleic Acids Res. 2021, 50, D387–D390. [Google Scholar] [CrossRef] [PubMed]
  117. Bolger, A.M.; Lohse, M.; Usadel, B. Trimmomatic: A flexible trimmer for Illumina sequence data. Bioinformatics 2014, 30, 2114–2120. [Google Scholar] [CrossRef] [PubMed]
  118. Kim, D.; Paggi, J.M.; Park, C.; Bennett, C.; Salzberg, S.L. Graph-based genome alignment and genotyping with HISAT2 and HISAT-genotype. Nat. Biotechnol. 2019, 37, 907–915. [Google Scholar] [CrossRef]
  119. Li, H.; Handsaker, B.; Wysoker, A.; Fennell, T.; Ruan, J.; Homer, N.; Marth, G.; Abecasis, G.; Durbin, R.; Genome Project Data Processing, S. The Sequence Alignment/Map format and SAMtools. Bioinformatics 2009, 25, 2078–2079. [Google Scholar] [CrossRef]
  120. Gu, Z.; Eils, R.; Schlesner, M. Complex heatmaps reveal patterns and correlations in multidimensional genomic data. Bioinformatics 2016, 32, 2847–2849. [Google Scholar] [CrossRef]
Figure 1. The basic morphology of S. androgynus and basic characteristics of its genomes. (A) Morphological characteristics of S. androgynus. The top picture provides an overview of the whole bush; the bottom picture highlights the morphological characteristics of the plant, including its leaves, flowers and fruits. (B) Image of the karyotype in S. androgynus. (C) Landscape of the S. androgynus genome: (1) Chromosome ideogram, (2) Gene density, (3) TE density, and (4) GC content. The inner circle represents the collinear blocks identified in its genome.
Ijms 25 00300 g001
Figure 2. Evolutionary history and comparative analysis of S. androgynus. (A) Venn diagram of the species-specific and shared gene families across S. androgynus and 11 other species (A. thaliana, A. trichopoda, H. brasiliensis, J. curcas, L. usitatissimum, M. esculenta, P. cochinchinensis, P. trichocarpa, R. communis, S. purpurea and V. vinifera). (B) Phylogenetic relationship of the 12 species. The divergence times are labeled at the bottom. The numbers on each branch represent the expansion (green) and contraction (red) of gene families. (C) GO and (D) KEGG enrichment of the expanded genes in S. androgynus.
Ijms 25 00300 g002
Figure 3. Whole-genome duplication analysis, synteny analysis, and morphological comparison of S. androgynus and P. cochinchinensis. (A) Ks distribution of S. androgynus, P. cochinchinensis, R. communis and V. vinifera. (B) Synteny analysis between S. androgynus and P. cochinchinensis. The green blocks display the potential chromosomal translocation events. The number indicates the chromosome number for each genome. (C) Morphological comparison of a leaf for S. androgynus (up) and P. cochinchinensis (below).
Ijms 25 00300 g003
Figure 4. Microsynteny of genes related to morphological development, and gene expression patterns in the ascorbic acid metabolic pathway of S. androgynus. (A) Microsynteny of genes related to morphological development in S. androgynus and P. cochinchinensis. From the top to the bottom are the microsynteny patterns of lignin synthesis, phloem development, and photosynthesis. (B) Gene expression patterns in the ascorbic acid metabolic pathway of S. androgynus. The heatmaps in each row correspond to one gene, which refers to a leaf, stem and flower from left to right, respectively, and its expression level is quantified by log2 (FPKM + 0.001). Abbreviations: PGI: glucose-6-phosphate isomerase, PMI: mannose-6-phosphate isomerase, PMM: phosphomannomutase, GMP: GDP-D-mannose pyrophosphorylase, GME: GDP-D-mannose-3,5-epimerase, GGP: GDP-L-galactose phosphorylase, GPP: L-galactose-1-phosphate phosphatase, GDH: L-galactose dehydrogenase, GLDH: L-galactono-1,4-lactone dehydrogenase, APX: L-ascorbate peroxidase, AO: L-ascorbate oxidase, MDHAR: monodehydroascorbate reductase, DHAR: dehydroascorbate reductase.
Ijms 25 00300 g004
Table 1. Summary statistics for the S. androgynus genome assembly and annotation.
FeatureValue
Genome size 1.55 Gb
Contig N5025.66 Mb
Scaffold N5058.10 Mb
Anchored to chromosome1.52 Gb (97.79%)
GC content33.77%
Number of chromosomes26
Repetitive sequences1.15 Gb (77.81%)
Number of protein-coding genes26,048
Disclaimer/Publisher’s Note: The statements, opinions and data contained in all publications are solely those of the individual author(s) and contributor(s) and not of MDPI and/or the editor(s). MDPI and/or the editor(s) disclaim responsibility for any injury to people or property resulting from any ideas, methods, instructions or products referred to in the content.

