
Assessment of the Potential Role of Selected Single Nucleotide Polymorphisms (SNPs) of Genes Related to the Functioning of Regulatory T Cells in the Pathogenesis of Psoriasis
 , , , , , , ,
Abstract
:1. Introduction
2. Results
2.1. Comparison of Variation in Frequency for Tested SNPs of Selected 57 Candidate Genes Related to the Functioning of Tregs Using Microarrays Methods
2.2. Analysis of the Frequency of Selected Gene Polymorphisms by ARMS–PCR Method
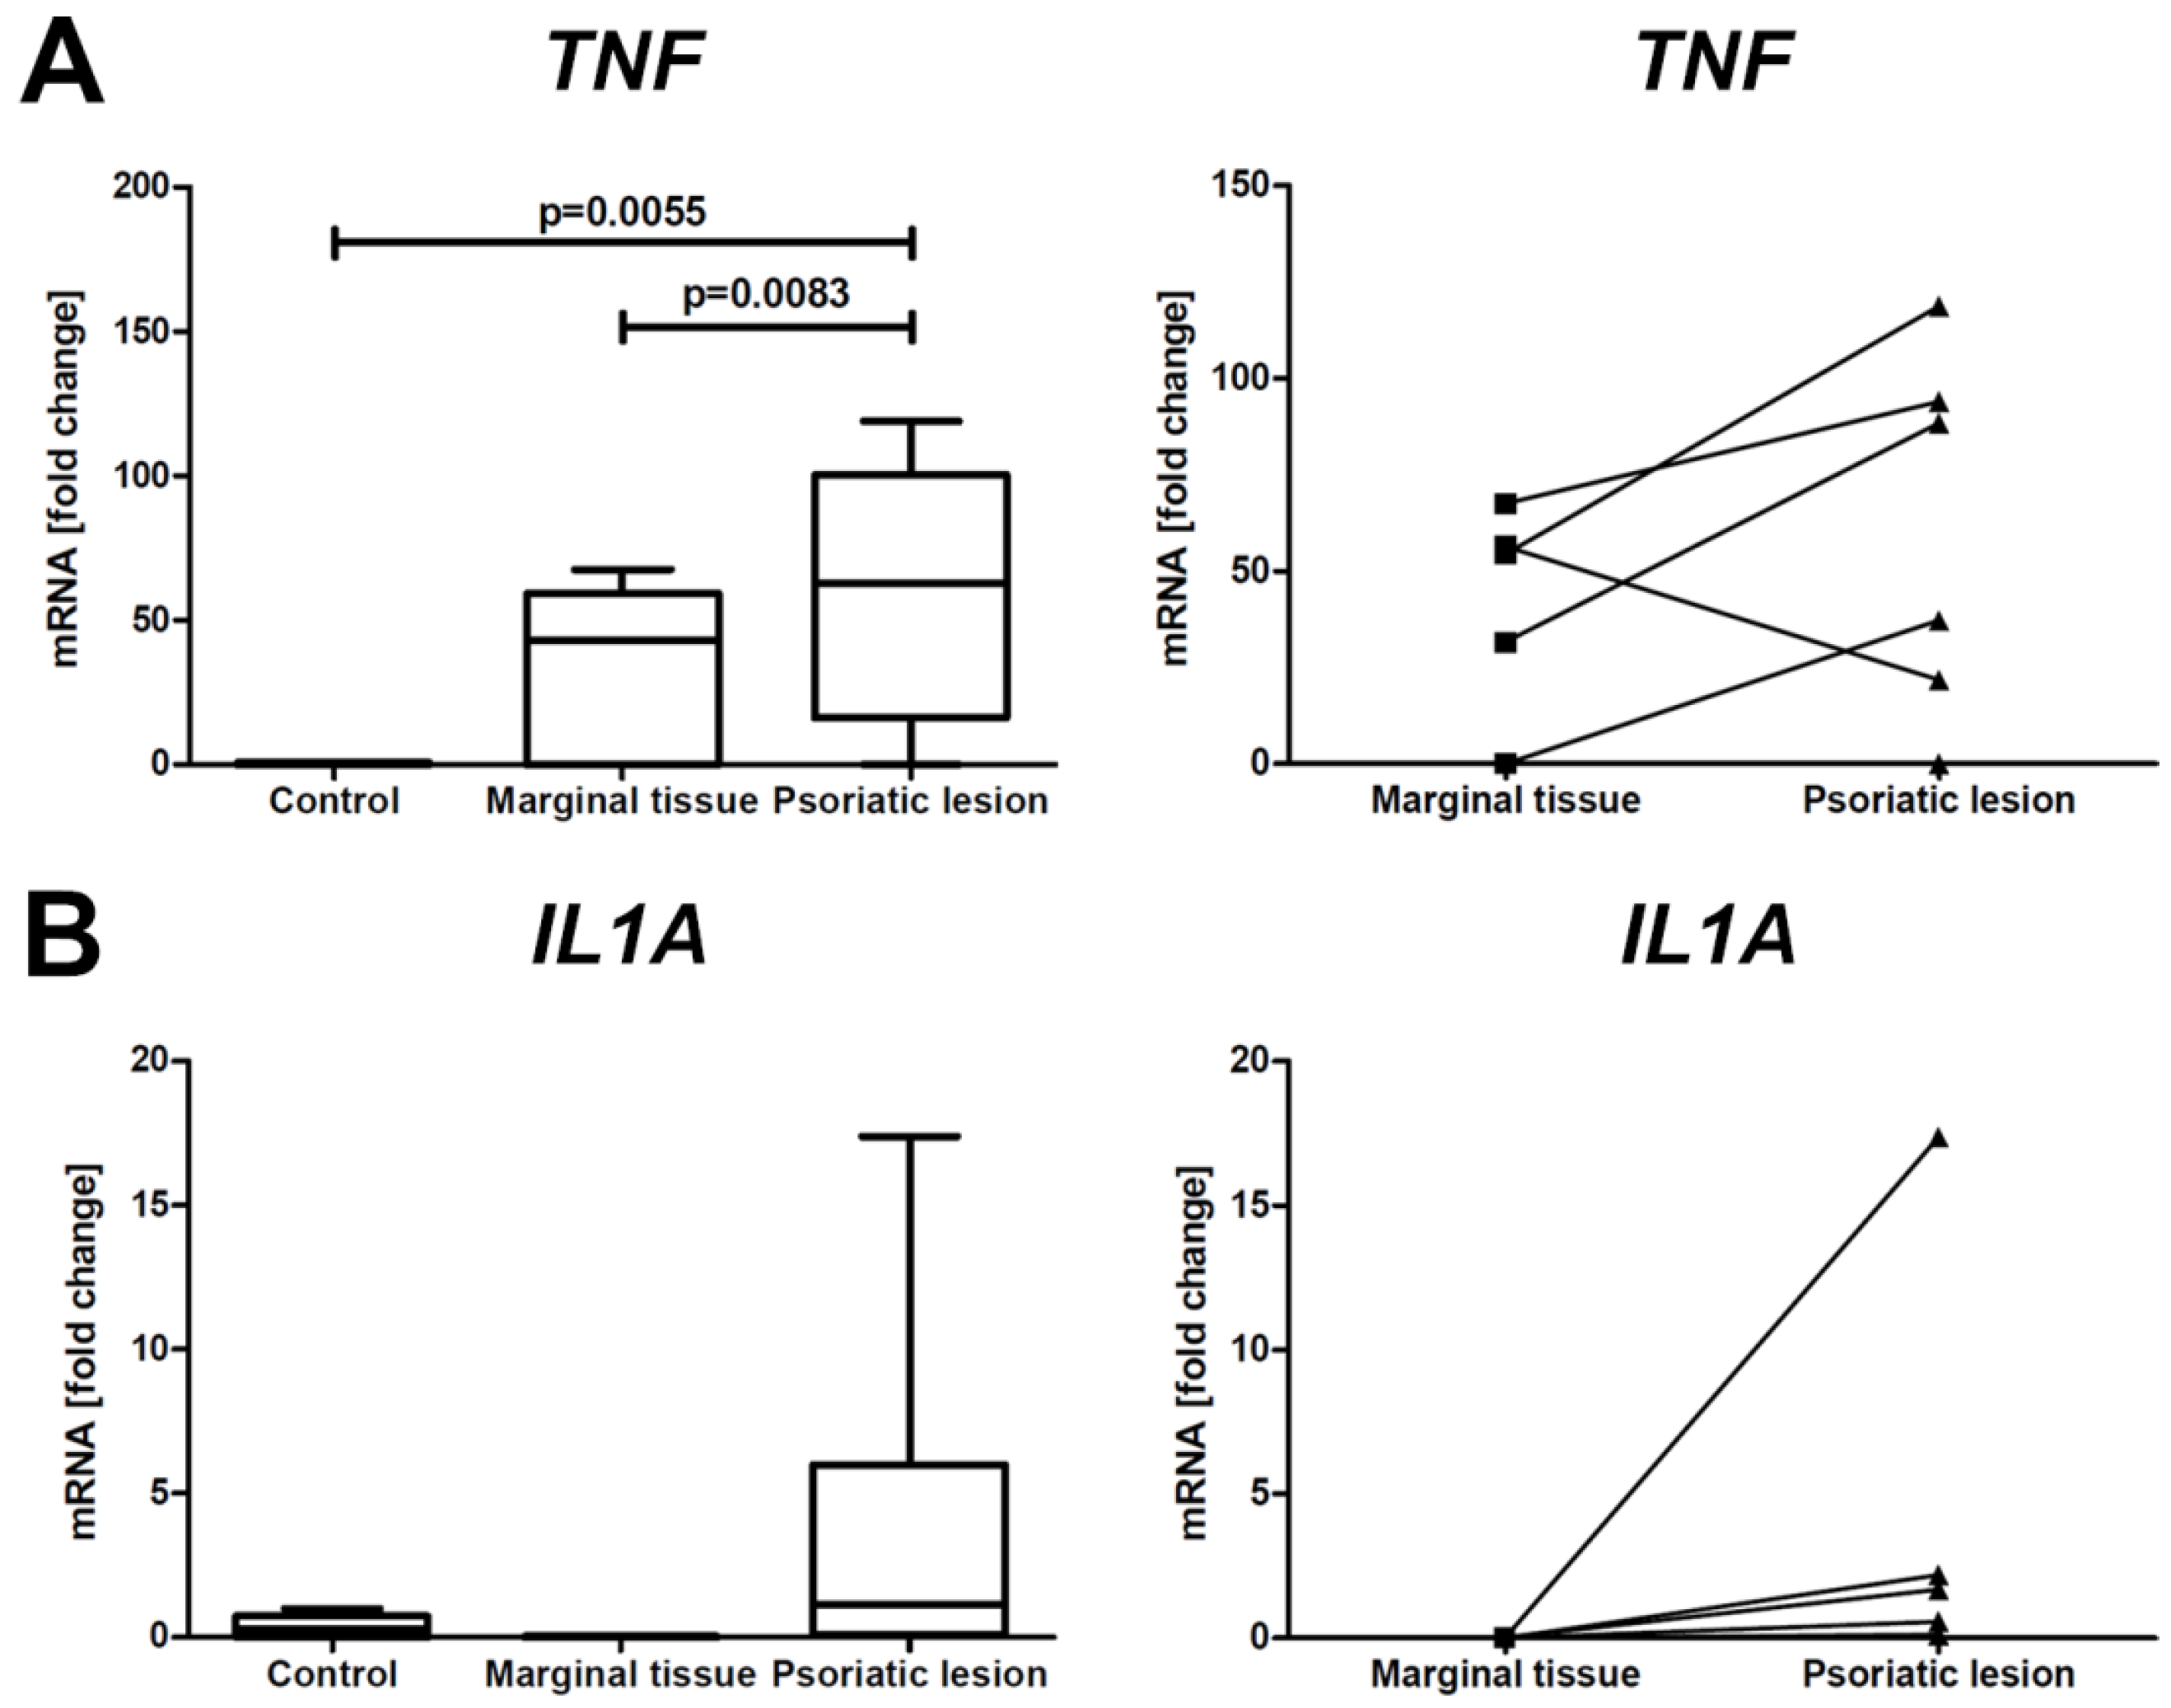
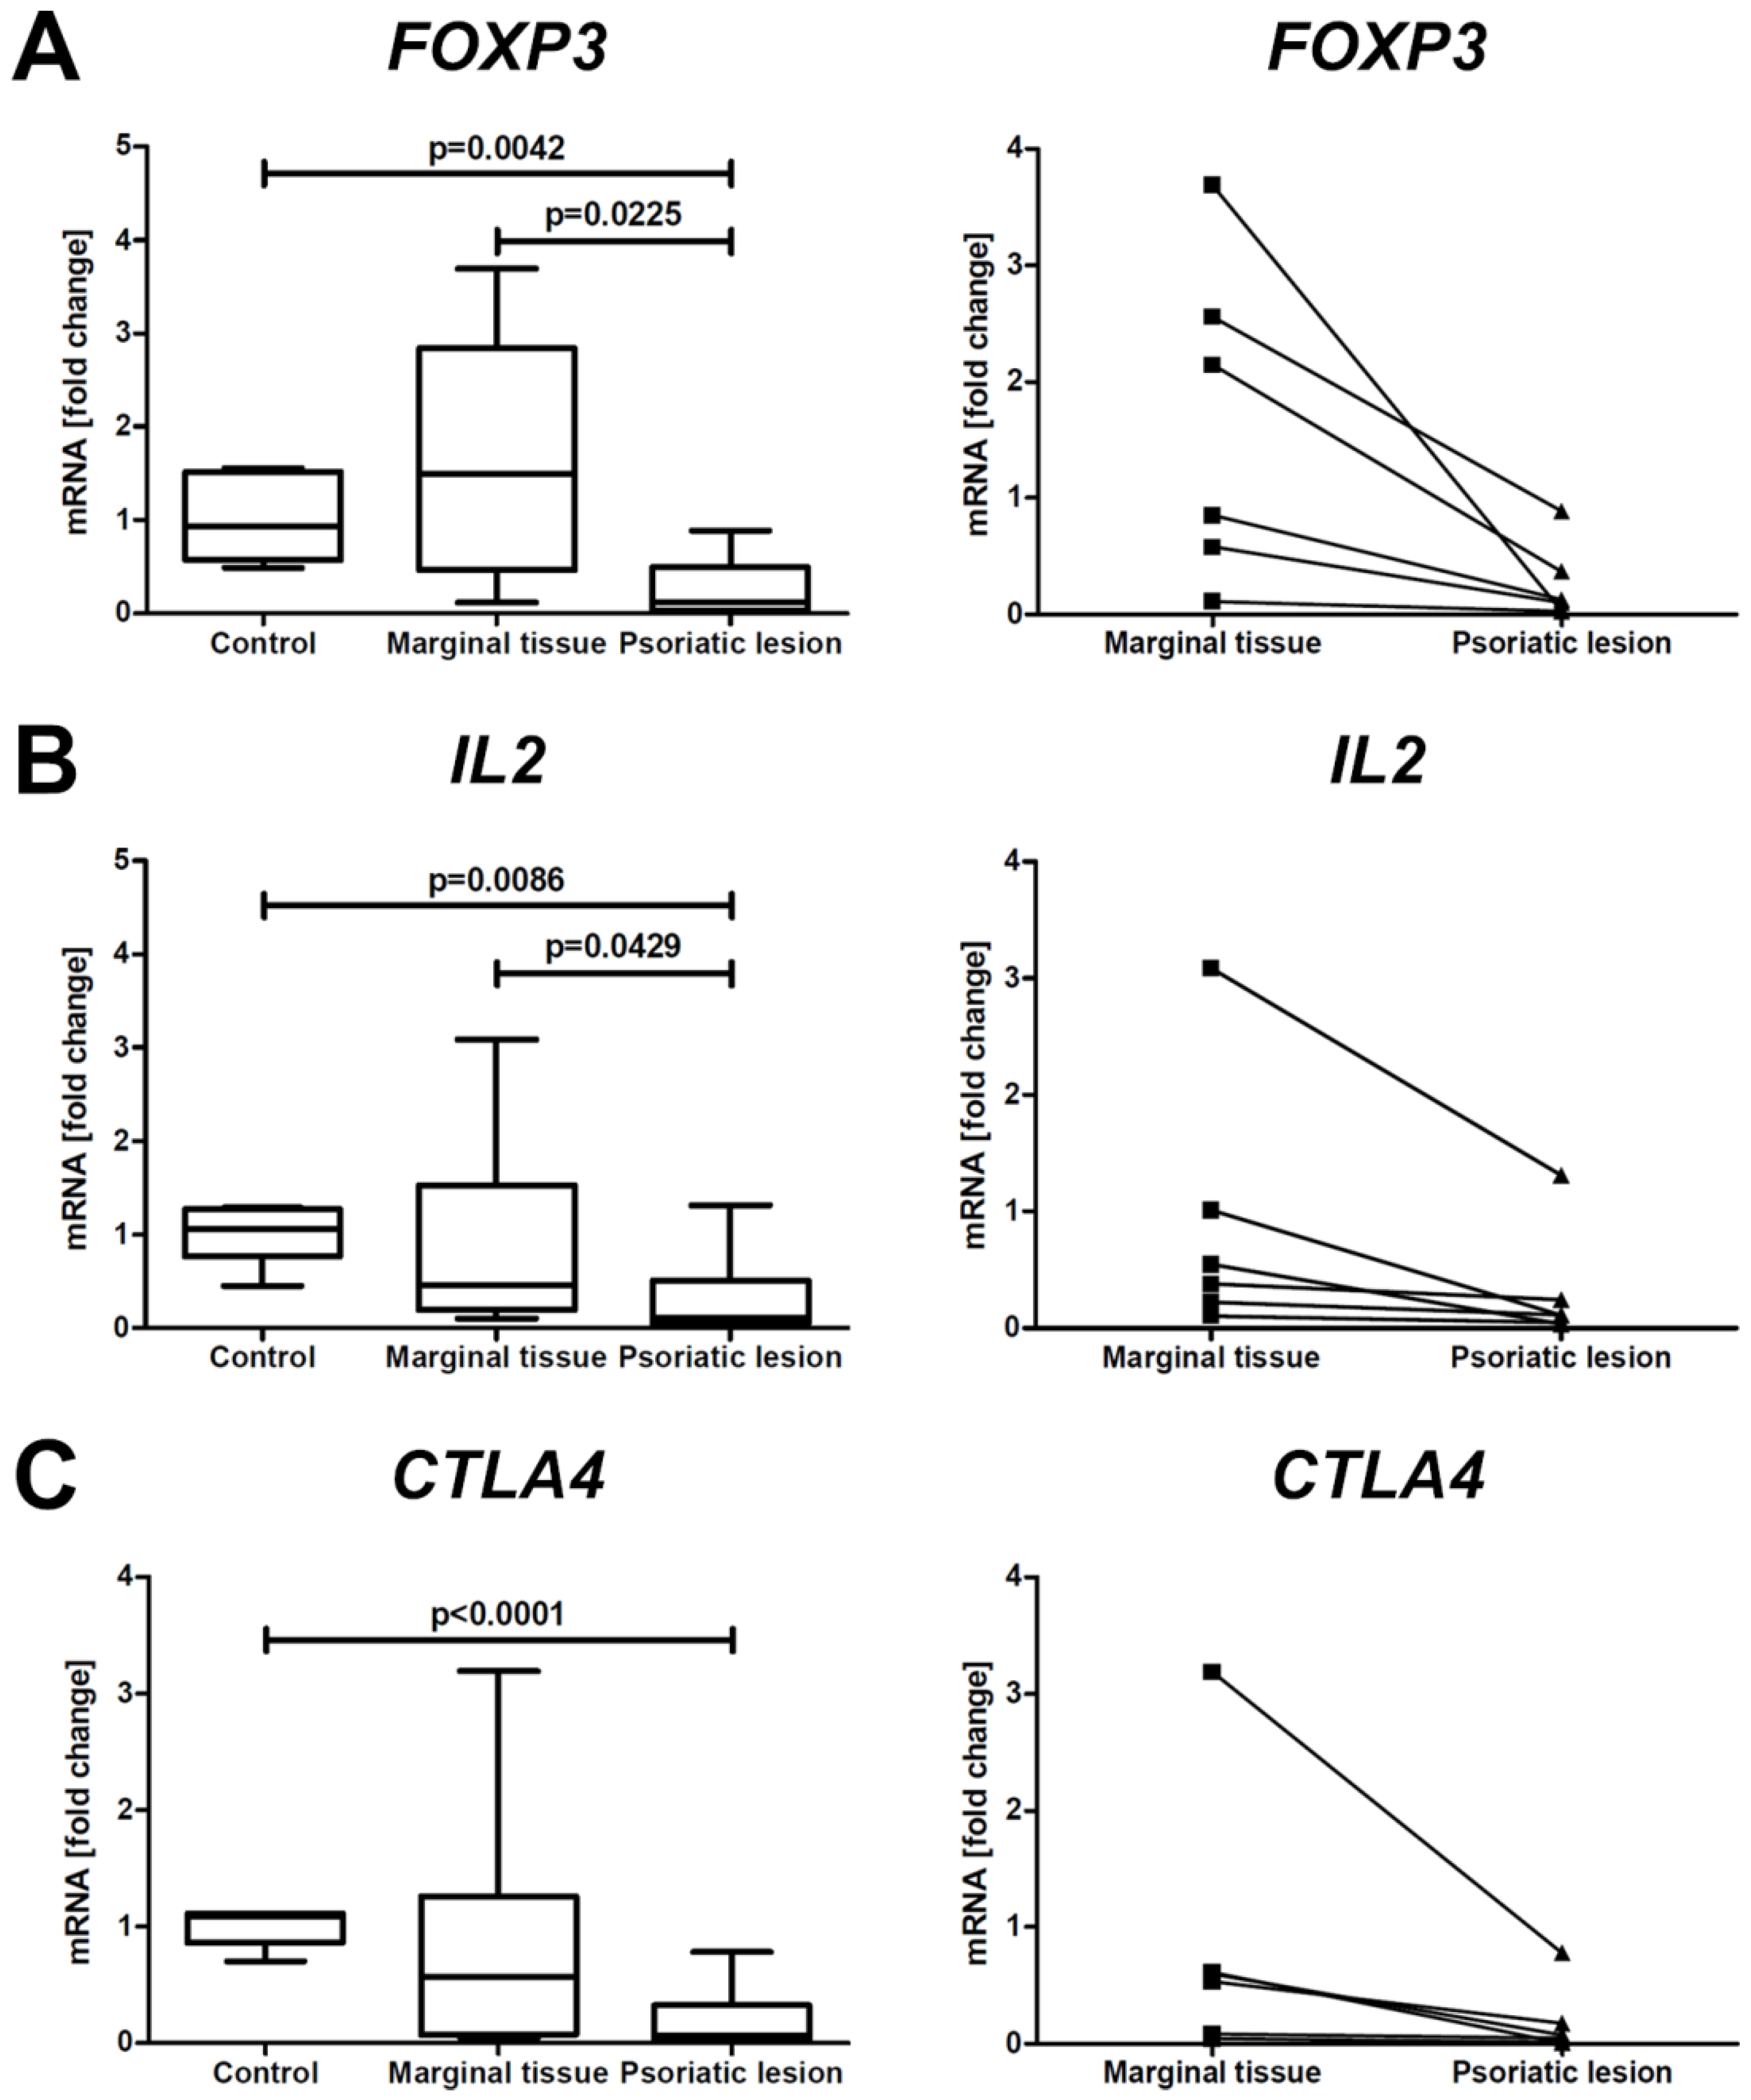
2.3. Analysis of Expression of Selected Genes in Skin Biopsies of PsO Patients and Controls
3. Discussion
Limitations of the Study
4. Materials and Methods
4.1. PsO Group
4.2. Control Group
4.3. DNA Isolation
4.4. Microarrays Analysis
4.5. ARMS–PCR
4.6. mRNA Level of the Genes in Skin Samples
4.7. Statistical Methods
4.7.1. Microarray Data Set
4.7.2. ARMS–PCR Data Set
4.7.3. mRNA Gene Expression Data Set
5. Conclusions
Supplementary Materials
Author Contributions
Funding
Institutional Review Board Statement
Informed Consent Statement
Data Availability Statement
Conflicts of Interest
Abbreviations
| CD28 | Cluster of Differentiation 28 |
| CD274 | Cluster of Differentiation 274 |
| CTLA4 | Cytotoxic T cell antigen 4 |
| ENTPD1 | Ectonucleoside Triphosphate Diphosphohydrolase 1 |
| FOXP3 | Forkhead box P3 |
| IDO1 | Indoleamine 2,3-Dioxygenase 1 |
| IL1A | Interleukin 1 alpha |
| IL2 | Interleukin 2 |
| IL4 | Interleukin 4 |
| IL6R | Interleukin 6 Receptor |
| IL6ST | Interleukin 6 Cytokine Family Signal Transducer |
| IL10RA | Interleukin 10 Receptor Subunit Alpha |
| IL12B | Interleukin 12B |
| IL12RB2 | Interleukin 12 Receptor Subunit Beta 2 |
| IL13 | Interleukin 13 |
| IL17RA | Interleukin 17 Receptor A |
| IL23R | Interleukin 23 Receptor |
| LGALS8 | Galectin 8 |
| NRP1 | Neuropilin 1 |
| PPARG | Peroxisome Proliferator Activated Receptor Gamma |
| RUNX1 | Runt-related Transcription Factor 1 |
| STAT3 | Signal Transducer and Activator of Transcription 3 |
| STAT5A | Signal Transducer and Activator of Transcription 5A |
| STAT5B | Signal Transducer and Activator of Transcription 5B |
| TGF-β1 | Transforming Growth Factor β1 |
| TNF | Tumor Necrosis Factor |
| TNFRSF18 | Tumor Necrosis Factor Receptor Superfamily Member 18 |
References
- Damiani, G.; Bragazzi, N.L.; Karimkhani Aksut, C.; Wu, D.; Alicandro, G.; McGonagle, D.; Guo, C.; Dellavalle, R.; Grada, A.; Wong, P.; et al. The Global, Regional, and National Burden of Psoriasis: Results and Insights From the Global Burden of Disease 2019 Study. Front. Med. 2021, 8, 743180. [Google Scholar] [CrossRef] [PubMed]
- Yamanaka, K.; Yamamoto, O.; Honda, T. Pathophysiology of psoriasis: A review. J. Dermatol. 2021, 48, 722–731. [Google Scholar] [CrossRef] [PubMed]
- Hu, P.; Wang, M.; Gao, H.; Zheng, A.; Li, J.; Mu, D.; Tong, J. The Role of Helper T Cells in Psoriasis. Front. Immunol. 2021, 12, 788940. [Google Scholar] [CrossRef] [PubMed]
- Nussbaum, L.; Chen, Y.L.; Ogg, G.S. Role of regulatory T cells in psoriasis pathogenesis and treatment. Br. J. Dermatol. 2021, 184, 14–24. [Google Scholar] [CrossRef]
- Owczarczyk-Saczonek, A.; Czerwińska, J.; Placek, W. The role of regulatory T cells and anti-inflammatory cytokines in psoriasis. Acta Dermatovenerol. Alp. Pannonica Adriat. 2018, 27, 17–23. [Google Scholar] [CrossRef]
- Nedoszytko, B.; Lange, M.; Sokołowska-Wojdyło, M.; Renke, J.; Trzonkowski, P.; Sobjanek, M.; Szczerkowska-Dobosz, A.; Niedoszytko, M.; Górska, A.; Romantowski, J.; et al. The role of regulatory T cells and genes involved in their differentiation in pathogenesis of selected inflammatory and neoplastic skin diseases. Part II: The Treg role in skin diseases pathogenesis. Postepy Dermatol. Alergol. 2017, 34, 405–417. [Google Scholar] [CrossRef] [Green Version]
- Schmitt, E.G.; Williams, C.B. Generation and function of induced regulatory T cells. Front. Immunol. 2013, 4, 152. [Google Scholar] [CrossRef] [Green Version]
- Nedoszytko, B.; Lange, M.; Sokołowska-Wojdyło, M.; Renke, J.; Trzonkowski, P.; Sobjanek, M.; Szczerkowska-Dobosz, A.; Niedoszytko, M.; Górska, A.; Romantowski, J.; et al. The role of regulatory T cells and genes involved in their differentiation in pathogenesis of selected inflammatory and neoplastic skin diseases. Part I: Treg properties and functions. Postepy Dermatol. Alergol. 2017, 34, 285–294. [Google Scholar] [CrossRef] [Green Version]
- Wang, K.; Fu, W. Transcriptional regulation of Treg homeostasis and functional specification. Cell Mol. Life Sci. 2020, 77, 4269–4287. [Google Scholar] [CrossRef]
- Kaminskiy, Y.; Kuznetsova, V.; Kudriaeva, A.; Zmievskaya, E.; Bulatov, E. Neglected, yet significant role of FOXP1 in T-cell quiescence, differentiation and exhaustion. Front. Immunol. 2022, 13, 971045. [Google Scholar] [CrossRef]
- Kim, J.; Moreno, A.; Krueger, J.G. The imbalance between Type 17 T-cells and regulatory immune cell subsets in psoriasis vulgaris. Front. Immunol. 2022, 13, 1005115. [Google Scholar] [CrossRef] [PubMed]
- Zhong, L.; Luo, N.; Zhong, X.; Xu, T.; Hao, P. The immunoregulatory effects of natural products on psoriasis via its action on Th17 cells versus regulatory T cells balance. Int. Immunopharmacol. 2022, 110, 109032. [Google Scholar] [CrossRef] [PubMed]
- Shi, Y.; Chen, Z.; Zhao, Z.; Yu, Y.; Fan, H.; Xu, X.; Bu, X.; Gu, J. IL-21 Induces an Imbalance of Th17/Treg Cells in Moderate-to-Severe Plaque Psoriasis Patients. Front. Immunol. 2019, 10, 1865. [Google Scholar] [CrossRef] [PubMed] [Green Version]
- Sugiyama, H.; Gyulai, R.; Toichi, E.; Garaczi, E.; Shimada, S.; Stevens, S.R.; McCormick, T.S.; Cooper, K.D. Dysfunctional blood and target tissue CD4+CD25high regulatory T cells in psoriasis: Mechanism underlying unrestrained pathogenic effector T cell proliferation. J. Immunol. 2005, 174, 164–173. [Google Scholar] [CrossRef] [PubMed] [Green Version]
- Nedoszytko, B.; Sokołowska-Wojdyło, M.; Renke, J.; Lange, M.; Trzonkowski, P.; Sobjanek, M.; Szczerkowska-Dobosz, A.; Niedoszytko, M.; Górska, A.; Romantowski, J.; et al. The role of regulatory T cells and genes involved in their differentiation in pathogenesis of selected inflammatory and neoplastic skin diseases. Part III: Polymorphisms of genes involved in Tregs’ activation and function. Postepy Dermatol. Alergol. 2017, 34, 517–525. [Google Scholar] [CrossRef] [PubMed] [Green Version]
- Nedoszytko, B.; Szczerkowska-Dobosz, A.; Stawczyk-Macieja, M.; Owczarczyk-Saczonek, A.; Reich, A.; Bartosiñska, J.; Batycka-Baran, A.; Czajkowski, R.; Dobrucki, I.T.; Dobrucki, L.W.; et al. Pathogenesis of psoriasis in the “omic” era. Part II. Genetic, genomic and epigenetic changes in psoriasis. Postepy Dermatol. Alergol. 2020, 37, 283–298. [Google Scholar] [CrossRef]
- Kanda, N.; Hoashi, T.; Saeki, H. The Defect in Regulatory T Cells in Psoriasis and Therapeutic Approaches. J. Clin. Med. 2021, 10, 3880. [Google Scholar] [CrossRef]
- Liu, Y.; Zhang, C.; Li, B.; Yu, C.; Bai, X.; Xiao, C.; Wang, L.; Dang, E.; Yang, L.; Wang, G. A novel role of IL-17A in contributing to the impaired suppressive function of Tregs in psoriasis. J. Dermatol. Sci. 2021, 101, 84–92. [Google Scholar] [CrossRef]
- Idriss, H.T.; Naismith, J.H. TNF alpha and the TNF receptor superfamily: Structure-function relationship(s). Microsc. Res. Tech. 2000, 50, 184–195. [Google Scholar] [CrossRef]
- Jung, M.K.; Lee, J.S.; Kwak, J.E.; Shin, E.C. Tumor Necrosis Factor and Regulatory T Cells. Yonsei Med. J. 2019, 60, 126–131. [Google Scholar] [CrossRef]
- Pierini, A.; Strober, W.; Moffett, C.; Baker, J.; Nishikii, H.; Alvarez, M.; Pan, Y.; Schneidawind, D.; Meyer, E.; Negrin, R.S. TNF-α priming enhances CD4+FoxP3+ regulatory T-cell suppressive function in murine GVHD prevention and treatment. Blood 2016, 128, 866–871. [Google Scholar] [CrossRef] [PubMed] [Green Version]
- Valencia, X.; Stephens, G.; Goldbach-Mansky, R.; Wilson, M.; Shevach, E.M.; Lipsky, P.E. TNF downmodulates the function of human CD4+CD25hi T-regulatory cells. Blood 2006, 108, 253–261. [Google Scholar] [CrossRef]
- Walter, G.J.; Evans, H.G.; Menon, B.; Gullick, N.J.; Kirkham, B.W.; Cope, A.P.; Geissmann, F.; Taams, L.S. Interaction with activated monocytes enhances cytokine expression and suppressive activity of human CD4+CD45ro+ CD25+CD127(low) regulatory T cells. Arthritis Rheum. 2013, 65, 627–638. [Google Scholar] [CrossRef] [PubMed] [Green Version]
- Xu, X.; Zhang, H.Y. The Immunogenetics of Psoriasis and Implications for Drug Repositioning. Int. J. Mol. Sci. 2017, 18, 2650. [Google Scholar] [CrossRef] [Green Version]
- Tsoi, L.C.; Spain, S.L.; Knight, J.; Ellinghaus, E.; Stuart, P.E.; Capon, F.; Ding, J.; Li, Y.; Tejasvi, T.; Gudjonsson, J.E.; et al. Identification of fifteen new psoriasis susceptibility loci highlights the role of innate immunity. Nat. Genet. 2012, 44, 1341–1348. [Google Scholar] [CrossRef] [Green Version]
- Shah, S.R.; Shaikh, S.B.; Bhandary, Y.P.; Yassir, S.; Shenoy, M.M. Relevance of Inflammatory Cytokine mRNA Expression of Tumour Necrosis Factor- Alpha (TNF α), Interleukin 17A (IL 17A) and Interleukin 6 (IL 6) in Indian Patients with Psoriasis. Indian Dermatol. Online J. 2022, 13, 229–233. [Google Scholar] [PubMed]
- Tobin, A.M.; Kirby, B. TNF alpha inhibitors in the treatment of psoriasis and psoriatic arthritis. BioDrugs 2005, 19, 47–57. [Google Scholar] [CrossRef]
- Liu, Y.; Helms, C.; Liao, W.; Zaba, L.C.; Duan, S.; Gardner, J.; Wise, C.; Miner, A.; Malloy, M.J.; Pullinger, C.R.; et al. A genome-wide association study of psoriasis and psoriatic arthritis identifies new disease loci. PLoS Genet. 2008, 4, e1000041. [Google Scholar] [CrossRef] [PubMed]
- Cargill, M.; Schrodi, S.J.; Chang, M.; Garcia, V.E.; Brandon, R.; Callis, K.P.; Matsunami, N.; Ardlie, K.G.; Civello, D.; Catanese, J.J.; et al. A large-scale genetic association study confirms IL12B and leads to the identification of IL23R as psoriasis-risk genes. Am. J. Hum. Genet. 2007, 80, 273–290. [Google Scholar] [CrossRef] [Green Version]
- Safrany, E.; Szell, M.; Csongei, V.; Jaromi, L.; Sipeky, C.; Szabo, T.; Kemeny, L.; Nagy, J.; Melegh, B. Polymorphisms of the IL23R gene are associated with psoriasis but not with immunoglobulin A nephropathy in a Hungarian population. Inflammation 2011, 34, 603–608. [Google Scholar] [CrossRef]
- Nair, R.P.; Duffin, K.C.; Helms, C.; Ding, J.; Stuart, P.E.; Goldgar, D.; Gudjonsson, J.E.; Li, Y.; Tejasvi, T.; Feng, B.J.; et al. Genome-wide scan reveals association of psoriasis with IL-23 and NF-kappaB pathways. Nat. Genet. 2009, 41, 199–204. [Google Scholar] [CrossRef] [PubMed] [Green Version]
- Capon, F.; Di Meglio, P.; Szaub, J.; Prescott, N.J.; Dunster, C.; Baumber, L.; Timms, K.; Gutin, A.; Abkevic, V.; Burden, A.D.; et al. Sequence variants in the genes for the interleukin-23 receptor (IL23R) and its ligand (IL12B) confer protection against psoriasis. Hum. Genet. 2007, 122, 201–206. [Google Scholar] [CrossRef] [PubMed]
- Smith, R.L.; Warren, R.B.; Eyre, S.; Ho, P.; Ke, X.; Young, H.S.; Griffiths, C.E.; Worthington, J. Polymorphisms in the IL-12beta and IL-23R genes are associated with psoriasis of early onset in a UK cohort. J. Investig. Dermatol. 2008, 128, 1325–1327. [Google Scholar] [CrossRef]
- Hunter, C.A. New IL-12-family members: IL-23 and IL-27, cytokines with divergent functions. Nat. Rev. Immunol. 2005, 5, 521–531. [Google Scholar] [CrossRef]
- Lyakh, L.; Trinchieri, G.; Provezza, L.; Carra, G.; Gerosa, F. Regulation of interleukin-12/interleukin-23 production and the T-helper 17 response in humans. Immunol. Rev. 2008, 226, 112–131. [Google Scholar] [CrossRef] [Green Version]
- Wasik, U.; Wunsch, E.; Norman, G.L.; Rigopoulou, E.I.; Bogdanos, D.P.; Milkiewicz, P.; Milkiewicz, M. Polymorphisms of IL12RB2 May Affect the Natural History of Primary Biliary Cholangitis: A Single Centre Study. J. Immunol. Res. 2017, 2017, 2185083. [Google Scholar] [CrossRef] [Green Version]
- Zhao, J.; Zhao, J.; Perlman, S. Differential effects of IL-12 on Tregs and non-Treg T cells: Roles of IFN-γ, IL-2 and IL-2R. PLoS ONE 2012, 7, e46241. [Google Scholar] [CrossRef]
- Theodorakopoulou, E.; Yiu, Z.Z.; Bundy, C.; Chularojanamontri, L.; Gittins, M.; Jamieson, L.A.; Motta, L.; Warren, R.B.; Griffiths, C.E. Early- and late-onset psoriasis: A cross-sectional clinical and immunocytochemical investigation. Br. J. Dermatol. 2016, 175, 1038–1044. [Google Scholar] [CrossRef] [PubMed] [Green Version]
- Fatema, F.; Ghoshal, L.; Saha, A.; Agarwal, S.; Bandyopadhyay, D. Early-Onset Versus Late-Onset Psoriasis: A Comparative Study of Clinical Variables, Comorbidities, and Association with HLA CW6 in a Tertiary Care Center. Indian J. Dermatol. 2021, 66, 705. [Google Scholar]
- Chen, H.; Poon, A.; Yeung, C.; Helms, C.; Pons, J.; Bowcock, A.M.; Kwok, P.Y.; Liao, W. A genetic risk score combining ten psoriasis risk loci improves disease prediction. PLoS ONE 2011, 6, e19454. [Google Scholar] [CrossRef] [PubMed] [Green Version]
- Chaudhry, A.; Samstein, R.M.; Treuting, P.; Liang, Y.; Pils, M.C.; Heinrich, J.M.; Jack, R.S.; Wunderlich, F.T.; Brüning, J.C.; Müller, W.; et al. Interleukin-10 signaling in regulatory T cells is required for suppression of Th17 cell-mediated inflammation. Immunity 2011, 34, 566–578. [Google Scholar] [CrossRef] [PubMed] [Green Version]
- Diefenhardt, P.; Nosko, A.; Kluger, M.A.; Richter, J.V.; Wegscheid, C.; Kobayashi, Y.; Tiegs, G.; Huber, S.; Flavell, R.A.; Stahl, R.A.K.; et al. IL-10 Receptor Signaling Empowers Regulatory T Cells to Control Th17 Responses and Protect from GN. J. Am. Soc. Nephrol. 2018, 29, 1825–1837. [Google Scholar] [CrossRef] [PubMed] [Green Version]
- Isac, L.; Jiquan, S. Interleukin 10 promotor gene polymorphism in the pathogenesis of psoriasis. Acta Dermatovenerol. Alp. Pannonica Adriat. 2019, 28, 119–123. [Google Scholar] [CrossRef] [PubMed]
- Karam, R.A.; Zidan, H.E.; Khater, M.H. Polymorphisms in the TNF-alpha and IL-10 gene promoters and risk of psoriasis and correlation with disease severity. Cytokine 2014, 66, 101–105. [Google Scholar] [CrossRef] [PubMed]
- Lee, Y.H.; Choi, S.J.; Ji, J.D.; Song, G.G. Associations between interleukin-10 polymorphisms and susceptibility to psoriasis: A meta-analysis. Inflamm. Res. 2012, 61, 657–663. [Google Scholar] [CrossRef]
- Settin, A.; Hassan, H.; El-Baz, R.; Hassan, T. Association of cytokine gene polymorphisms with psoriasis in cases from the Nile Delta of Egypt. Acta Dermatovenerol. Alp. Pannonica Adriat. 2009, 18, 105–112. [Google Scholar]
- Craven, N.M.; Jackson, C.W.; Kirby, B.; Perrey, C.; Pravica, V.; Hutchinson, I.V.; Griffiths, C.E. Cytokine gene polymorphisms in psoriasis. Br. J. Dermatol. 2001, 144, 849–853. [Google Scholar] [CrossRef]
- Reich, K.; Westphal, G.; Schulz, T.; Müller, M.; Zipprich, S.; Fuchs, T.; Hallier, E.; Neumann, C. Combined analysis of polymorphisms of the tumor necrosis factor-alpha and interleukin-10 promoter regions and polymorphic xenobiotic metabolizing enzymes in psoriasis. J. Investig. Dermatol. 1999, 113, 214–220. [Google Scholar] [CrossRef] [Green Version]
- Baran, W.; Szepietowski, J.C.; Mazur, G.; Baran, E. IL-6 and IL-10 promoter gene polymorphisms in psoriasis vulgaris. Acta Derm. Venereol. 2008, 88, 113–116. [Google Scholar] [CrossRef] [Green Version]
- Peddle, L.; Butt, C.; Snelgrove, T.; Rahman, P. Interleukin (IL) 1alpha, IL1beta, IL receptor antagonist, and IL10 polymorphisms in psoriatic arthritis. Ann. Rheum. Dis. 2005, 64, 1093–1094. [Google Scholar] [CrossRef] [Green Version]
- Cooney, L.A.; Towery, K.; Endres, J.; Fox, D.A. Sensitivity and resistance to regulation by IL-4 during Th17 maturation. J. Immunol. 2011, 187, 4440–4450. [Google Scholar] [CrossRef] [Green Version]
- Maerten, P.; Shen, C.; Bullens, D.M.; Van Assche, G.; Van Gool, S.; Geboes, K.; Rutgeerts, P.; Ceuppens, J.L. Effects of interleukin 4 on CD25+CD4+ regulatory T cell function. J. Autoimmun. 2005, 25, 112–120. [Google Scholar] [CrossRef] [PubMed]
- Yang, W.C.; Hwang, Y.S.; Chen, Y.Y.; Liu, C.L.; Shen, C.N.; Hong, W.H.; Lo, S.M.; Shen, C.R. Interleukin-4 Supports the Suppressive Immune Responses Elicited by Regulatory T Cells. Front. Immunol. 2017, 8, 1508. [Google Scholar] [CrossRef] [PubMed] [Green Version]
- Divyapriya, D.; Priyadarssini, M.; Indhumathi, S.; Rajappa, M.; Chandrasekhar, L.; Selvam Mohanraj, P. Evaluation of cytokine gene expression in psoriasis. Postepy Dermatol. Alergol. 2021, 38, 858–863. [Google Scholar] [CrossRef] [PubMed]
- Qiu, L.J.; Ni, J.; Cen, H.; Wen, P.F.; Zhang, M.; Liang, Y.; Pan, H.F.; Mao, C.; Ye, D.Q. Relationship between the IL-4 gene promoter -590C/T (rs2243250) polymorphism and susceptibility to autoimmune diseases: A meta-analysis. J. Eur. Acad. Dermatol. Venereol. 2015, 29, 48–55. [Google Scholar] [CrossRef] [PubMed]
- Indhumathi, S.; Rajappa, M.; Chandrashekar, L.; Ananthanarayanan, P.H.; Thappa, D.M.; Negi, V.S. T helper-2 cytokine/regulatory T-cell gene polymorphisms and their relation with risk of psoriasis in a South Indian Tamil cohort. Hum. Immunol. 2017, 78, 209–215. [Google Scholar] [CrossRef]
- Larson, C.; Oronsky, B.; Carter, C.A.; Oronsky, A.; Knox, S.J.; Sher, D.; Reid, T.R. TGF-beta: A master immune regulator. Expert Opin. Ther. Targets 2020, 24, 427–438. [Google Scholar] [CrossRef]
- Xu, H.; Wu, L.; Nguyen, H.H.; Mesa, K.R.; Raghavan, V.; Episkopou, V.; Littman, D.R. Arkadia-SKI/SnoN signaling differentially regulates TGF-β-induced iTreg and Th17 cell differentiation. J. Exp. Med. 2021, 218, e20210777. [Google Scholar] [CrossRef]
- Ahmed, B.T.; Saeed, M.Y.; Noori, S.H.; Amin, D.M. TGF-β1 Gene Polymorphism and Its Correlation with Serum Level of TGF-β1 in Psoriasis Vulgaris Among Iraqi People. Clin. Cosmet. Investig. Dermatol. 2020, 13, 889–896. [Google Scholar] [CrossRef]
- El-Hadidi, H.H.; Hassan, A.S.; El-Hanafy, G.; Amr, K.S.; Abdelmesih, S.F.; Abdelhamid, M.F. Transforming growth factor-β1 gene polymorphism in psoriasis vulgaris. Clin. Cosmet. Investig. Dermatol. 2018, 11, 415–419. [Google Scholar]
- Song, Q.H.; Shen, Z.; Xing, X.J.; Yin, R.; Wu, Y.Z.; You, Y.; Guo, H.; Chen, L.; Hao, F.; Bai, Y. An association study of single nucleotide polymorphisms of the FOXP3 intron-1 and the risk of Psoriasis vulgaris. Indian J. Biochem. Biophys. 2012, 49, 25–35. [Google Scholar]
- Elsohafy, M.A.; Elghzaly, A.A.; Abdelsalam, H.M.; Gaballah, M.A. Assessment of the Possible Role of FOXP3 Gene (rs3761548) Polymorphism in Psoriasis Vulgaris Susceptibility and Pathogenesis: Egyptian Study. Indian Dermatol. Online J. 2019, 10, 401–405. [Google Scholar]
- Kuang, Y.; Zhang, H.; Zhu, W.; Wu, L.; Chen, W.; Lu, Y.; Qin, Q.; Jia, X.; Liao, L. Effect of methotrexate on regulation for the number of regulatory T cells and expression of Foxp3 in psoriasis. Zhong Nan Da Xue Xue Bao Yi Xue Ban 2018, 43, 835–842. [Google Scholar]
- Hirai, T.; Ramos, T.L.; Lin, P.Y.; Simonetta, F.; Su, L.L.; Picton, L.K.; Baker, J.; Lin, J.X.; Li, P.; Seo, K.; et al. Selective expansion of regulatory T cells using an orthogonal IL-2/IL-2 receptor system facilitates transplantation tolerance. J. Clin. Investig. 2021, 131, e139991. [Google Scholar] [CrossRef]
- Graßhoff, H.; Comdühr, S.; Monne, L.R.; Müller, A.; Lamprecht, P.; Riemekasten, G.; Humrich, J.Y. Low-Dose IL-2 Therapy in Autoimmune and Rheumatic Diseases. Front. Immunol. 2021, 12, 648408. [Google Scholar] [CrossRef]
- Wang, J.; Zhang, S.X.; Hao, Y.F.; Qiu, M.T.; Luo, J.; Li, Y.Y.; Gao, C.; Li, X.F. The numbers of peripheral regulatory T cells are reduced in patients with psoriatic arthritis and are restored by low-dose interleukin-2. Ther. Adv. Chronic Dis. 2020, 11, 2040622320916014. [Google Scholar] [CrossRef]
- Liu, S.; Xu, J.; Wu, J. The Role of Co-Signaling Molecules in Psoriasis and Their Implications for Targeted Treatment. Front. Pharmacol. 2021, 12, 717042. [Google Scholar] [CrossRef] [PubMed]
- Zhao, H.; Liao, X.; Kang, Y. Tregs: Where We Are and What Comes Next? Front. Immunol. 2017, 8, 1578. [Google Scholar] [CrossRef] [PubMed]
- Bebes, A.; Kovács-Sólyom, F.; Prihoda, J.; Kui, R.; Kemény, L.; Gyulai, R. Interleukin-1 receptors are differentially expressed in normal and psoriatic T cells. Mediators Inflamm. 2014, 2014, 472625. [Google Scholar] [CrossRef] [PubMed] [Green Version]
- Dobrowolska, S.; Michalska-Madej, J.; Słomka, M.; Sobalska-Kwapis, M.; Strapagiel, D. Biobank Łódź—Population based biobank at the University of Łódź, Poland. Eur. J. Transl. Clin. Med. 2019, 1, 85–95. [Google Scholar] [CrossRef]
- Sobalska-Kwapis, M.; Suchanecka, A.; Słomka, M.; Siewierska-Górska, A.; Kępka, E.; Strapagiel, D. Genetic association of FTO/IRX region with obesity and overweight in the Polish population. PLoS ONE 2017, 12, e0180295. [Google Scholar] [CrossRef] [PubMed]
- Jarczak, J.; Grochowalski, Ł.; Marciniak, B.; Lach, J.; Słomka, M.; Sobalska-Kwapis, M.; Lorkiewicz, W.; Pułaski, Ł.; Strapagiel, D. Mitochondrial DNA variability of the Polish population. Eur. J. Hum. Genet. 2019, 27, 1304–1314. [Google Scholar] [CrossRef] [PubMed] [Green Version]
- Kisielnicka, A.; Sobalska-Kwapis, M.; Purzycka-Bohdan, D.; Nedoszytko, B.; Zabłotna, M.; Seweryn, M.; Strapagiel, D.; Nowicki, R.J.; Reich, A.; Samotij, D.; et al. The Analysis of a Genome-Wide Association Study (GWAS) of Overweight and Obesity in Psoriasis. Int. J. Mol. Sci. 2022, 23, 7396. [Google Scholar] [CrossRef] [PubMed]
- Purcell, S.; Neale, B.; Todd-Brown, K.; Thomas, L.; Ferreira, M.A.; Bender, D.; Maller, J.; Sklar, P.; de Bakker, P.I.; Daly, M.J.; et al. PLINK: A tool set for whole-genome association and population-based linkage analyses. Am. J. Hum. Genet. 2007, 81, 559–575. [Google Scholar] [CrossRef] [PubMed] [Green Version]


| CHR | SNP | A1 | F_A | F_U | CHISQ | p | p adj | OR | SE | L95 | U95 | Overlapped Gene | Annotation |
|---|---|---|---|---|---|---|---|---|---|---|---|---|---|
| 6 | rs3093662 | G | 0.1094 | 0.05343 | 22.25 | 2.40 × 10⁻⁶ | 0.0007031 | 2.175 | 0.1688 | 1.563 | 3.029 | TNF | intronic |
| 5 | rs1295686 | A | 0.1719 | 0.2494 | 12.01 | 0.0005296 | 0.1552 | 0.6246 | 0.137 | 0.4775 | 0.817 | IL13/TH2LCRR | intronic, non-coding intronic |
| 5 | rs20541 | T | 0.1719 | 0.2475 | 11.48 | 0.0007035 | 0.2061 | 0.631 | 0.137 | 0.4824 | 0.8254 | IL13/TH2LCRR | coding nonsyn, non-coding |
| 1 | rs2201584 | T | 0.1953 | 0.1399 | 9.381 | 0.002192 | 0.6422 | 1.493 | 0.1316 | 1.153 | 1.932 | IL12RB2 | intronic |
| 5 | rs3213094 | A | 0.1354 | 0.198 | 9.24 | 0.002367 | 0.6936 | 0.6343 | 0.151 | 0.4718 | 0.8527 | IL12B | intronic |
| 5 | rs3212220 | T | 0.1354 | 0.198 | 9.24 | 0.002367 | 0.6936 | 0.6343 | 0.151 | 0.4718 | 0.8527 | IL12B | intronic |
| 1 | rs12142823 | T | 0.1731 | 0.1238 | 7.819 | 0.005171 | 1 | 1.482 | 0.1415 | 1.123 | 1.955 | IL12RB2 | 5utr, 5upstream |
| 1 | rs10489630 | G | 0.4453 | 0.3795 | 6.808 | 0.009076 | 1 | 1.312 | 0.1045 | 1.069 | 1.611 | IL23R | intronic |
| 1 | rs4845625 | T | 0.5547 | 0.4908 | 6.061 | 0.01382 | 1 | 1.292 | 0.1044 | 1.053 | 1.586 | IL6R | intronic, non-coding intronic |
| 1 | rs2064689 | A | 0.3411 | 0.2869 | 5.323 | 0.02104 | 1 | 1.287 | 0.1096 | 1.038 | 1.596 | IL23R | intronic |
| 1 | rs10789224 | C | 0.3385 | 0.2847 | 5.264 | 0.02177 | 1 | 1.286 | 0.1099 | 1.037 | 1.595 | IL23R | intronic |
| 21 | rs2268288 | C | 0.1623 | 0.2099 | 5.076 | 0.02426 | 1 | 0.7292 | 0.1407 | 0.5535 | 0.9608 | RUNX1 | intronic, 5upstream |
| 1 | rs6693065 | G | 0.25 | 0.203 | 5.045 | 0.0247 | 1 | 1.309 | 0.1202 | 1.034 | 1.656 | IL12RB2 | intronic |
| 10 | rs734187 | T | 0.237 | 0.2893 | 4.968 | 0.02583 | 1 | 0.7628 | 0.1218 | 0.6008 | 0.9685 | NRP1 | intronic, 3downstream |
| 22 | rs2241042 | A | 0.3455 | 0.4017 | 4.862 | 0.02746 | 1 | 0.7863 | 0.1093 | 0.6346 | 0.9741 | IL17RA | intronic, non-coding intronic |
| 3 | rs4135280 | C | 0.03646 | 0.06396 | 4.754 | 0.02923 | 1 | 0.5537 | 0.275 | 0.323 | 0.9493 | PPARG | intronic, 3downstream |
| 10 | rs1044268 | A | 0.1328 | 0.1753 | 4.655 | 0.03096 | 1 | 0.7208 | 0.1524 | 0.5346 | 0.9717 | NRP1 | 3utr |
| 21 | rs2014300 | A | 0.1276 | 0.1682 | 4.398 | 0.03598 | 1 | 0.7234 | 0.155 | 0.5339 | 0.9803 | RUNX1 | intronic |
| 1 | rs7553796 | A | 0.5312 | 0.477 | 4.383 | 0.0363 | 1 | 1.243 | 0.104 | 1.014 | 1.524 | IL6R | intronic |
| 1 | rs4537545 | T | 0.3125 | 0.364 | 4.258 | 0.03905 | 1 | 0.7943 | 0.1118 | 0.6379 | 0.9889 | IL6R | intronic, non-coding intronic |
| 10 | rs4582902 | T | 0.5262 | 0.4726 | 4.254 | 0.03915 | 1 | 1.239 | 0.1042 | 1.01 | 1.52 | ENTPD1 | intronic, non-coding intronic |
| 2 | rs231779 | T | 0.4583 | 0.4074 | 3.989 | 0.0458 | 1 | 1.231 | 0.1042 | 1.004 | 1.51 | CTLA4 | intronic, 5upstream, non-coding intronic |
| 17 | rs9900213 | T | 0.1094 | 0.1458 | 3.975 | 0.04617 | 1 | 0.7197 | 0.1657 | 0.5201 | 0.9958 | STAT5B | intronic, non-coding intronic |
| 9 | rs10481593 | A | 0.1875 | 0.231 | 3.972 | 0.04627 | 1 | 0.7683 | 0.1327 | 0.5924 | 0.9964 | CD274 | intronic, non-coding intronic |
| 10 | rs734186 | T | 0.3698 | 0.4206 | 3.936 | 0.04726 | 1 | 0.8083 | 0.1074 | 0.6549 | 0.9978 | NRP1 | intronic, 3downstream |
| 1 | rs4129267 | T | 0.3073 | 0.3564 | 3.904 | 0.04816 | 1 | 0.8013 | 0.1124 | 0.6429 | 0.9986 | IL6R | intronic, 5upstream, non-coding intronic |
| CHR | SNP | A1 | F_A | F_U | CHISQ | p | p adj | OR | SE | L95 | U95 | Overlapped Gene | Annotation |
|---|---|---|---|---|---|---|---|---|---|---|---|---|---|
| 6 | rs3093662 | G | 0.129 | 0.0515 | 34.13 | 5.15 × 10⁻⁹ | 1.51 × 10⁻⁶ | 2.73 | 0.18 | 1.92 | 3.88 | TNF | intronic |
| 1 | rs2201584 | T | 0.228 | 0.1396 | 18.36 | 1.83 × 10⁻⁵ | 0.00539 | 1.82 | 0.14 | 1.38 | 2.40 | IL12RB2 | intronic |
| 5 | rs3213094 | A | 0.105 | 0.1989 | 15.84 | 6.90 × 10⁻⁵ | 0.02029 | 0.47 | 0.19 | 0.33 | 0.69 | IL12B | intronic |
| 5 | rs3212220 | T | 0.105 | 0.1989 | 15.84 | 6.90 × 10⁻⁵ | 0.02029 | 0.47 | 0.19 | 0.33 | 0.69 | IL12B | intronic |
| 1 | rs6693065 | G | 0.289 | 0.2024 | 13.25 | 0.0002732 | 0.08032 | 1.60 | 0.13 | 1.24 | 2.07 | IL12RB2 | intronic |
| 1 | rs12142823 | T | 0.196 | 0.1237 | 13.14 | 0.0002895 | 0.08512 | 1.73 | 0.15 | 1.28 | 2.34 | IL12RB2 | 5utr, 5upstream |
| 5 | rs1295686 | A | 0.170 | 0.2505 | 9.92 | 0.001633 | 0.48 | 0.61 | 0.16 | 0.45 | 0.83 | IL13/TH2LCRR | intronic, non-coding intronic |
| 5 | rs20541 | T | 0.170 | 0.2486 | 9.50 | 0.002059 | 0.6052 | 0.62 | 0.16 | 0.46 | 0.84 | IL13/TH2LCRR | coding nonsyn, non-coding |
| 3 | rs4135280 | C | 0.027 | 0.0643 | 6.64 | 0.00997 | 1 | 0.41 | 0.36 | 0.20 | 0.83 | PPARG | intronic, 3downstream |
| 10 | rs1044268 | A | 0.119 | 0.1756 | 6.37 | 0.01159 | 1 | 0.63 | 0.18 | 0.44 | 0.91 | NRP1 | 3utr |
| 10 | rs4582902 | T | 0.545 | 0.4715 | 6.08 | 0.01367 | 1 | 1.34 | 0.12 | 1.06 | 1.69 | ENTPD1 | intronic, non-coding intronic |
| 22 | rs2241042 | A | 0.329 | 0.4003 | 6.08 | 0.01367 | 1 | 0.73 | 0.13 | 0.57 | 0.94 | IL17RA | intronic, non-coding intronic |
| 21 | rs2268288 | C | 0.151 | 0.2096 | 5.99 | 0.01442 | 1 | 0.67 | 0.17 | 0.48 | 0.93 | RUNX1 | intronic, 5upstream |
| 10 | rs734187 | T | 0.228 | 0.2901 | 5.40 | 0.02011 | 1 | 0.72 | 0.14 | 0.55 | 0.95 | NRP1 | intronic, 3downstream |
| 21 | rs2834655 | A | 0.252 | 0.3121 | 4.89 | 0.02707 | 1 | 0.74 | 0.14 | 0.57 | 0.97 | RUNX1 | intronic |
| 21 | rs2268278 | A | 0.286 | 0.3472 | 4.78 | 0.02876 | 1 | 0.75 | 0.13 | 0.58 | 0.97 | RUNX1 | intronic |
| 11 | rs2228055 | G | 0.024 | 0.0519 | 4.65 | 0.03101 | 1 | 0.45 | 0.38 | 0.21 | 0.95 | IL10RA | coding nonsyn, 5upstream, 3utr, non-coding, 3downstream |
| 10 | rs11188484 | A | 0.384 | 0.3257 | 4.47 | 0.03447 | 1 | 1.29 | 0.12 | 1.02 | 1.64 | ENTPD1 | intronic, non-coding intronic |
| 2 | rs10515944 | A | 0.188 | 0.1442 | 4.46 | 0.03474 | 1 | 1.38 | 0.15 | 1.02 | 1.86 | CD28 | intronic |
| 1 | rs2064689 | A | 0.344 | 0.2872 | 4.43 | 0.0353 | 1 | 1.30 | 0.12 | 1.02 | 1.66 | IL23R | intronic |
| 1 | rs10789224 | C | 0.340 | 0.2850 | 4.27 | 0.0389 | 1 | 1.29 | 0.12 | 1.01 | 1.65 | IL23R | intronic |
| 1 | rs10489630 | G | 0.439 | 0.3802 | 4.16 | 0.04142 | 1 | 1.27 | 0.12 | 1.01 | 1.61 | IL23R | intronic |
| 9 | rs10481593 | A | 0.180 | 0.2303 | 4.05 | 0.04411 | 1 | 0.74 | 0.15 | 0.54 | 0.99 | CD274 | intronic, non-coding intronic |
| 9 | rs1411262 | A | 0.245 | 0.2981 | 3.88 | 0.04875 | 1 | 0.76 | 0.14 | 0.58 | 1.00 | CD274 | intronic, non-coding intronic |
| 11 | rs2256111 | G | 0.537 | 0.4795 | 3.84 | 0.04993 | 1 | 1.26 | 0.12 | 1.00 | 1.59 | IL10RA | coding syn, 5upstream, coding nonsyn, non-coding, 3utr |
| CHR | SNP | A1 | F_A | F_U | CHISQ | p | p adj | OR | SE | L95 | U95 | Overlapped Gene | Annotation |
|---|---|---|---|---|---|---|---|---|---|---|---|---|---|
| 17 | rs8069645 | G | 0.12 | 0.27 | 9.56 | 0.00199 | 0.5857 | 0.38 | 0.32 | 0.20 | 0.72 | STAT3 | intronic |
| 8 | rs7820268 | T | 0.23 | 0.36 | 6.38 | 0.01154 | 1 | 0.54 | 0.25 | 0.33 | 0.88 | IDO1 | intronic, 3downstream, non-coding intronic |
| 1 | rs7553796 | A | 0.61 | 0.48 | 6.37 | 0.01163 | 1 | 1.72 | 0.22 | 1.12 | 2.63 | IL6R | intronic |
| 1 | rs4845618 | G | 0.62 | 0.49 | 6.02 | 0.01414 | 1 | 1.70 | 0.22 | 1.11 | 2.60 | IL6R | intronic, 5upstream |
| 17 | rs9900213 | T | 0.06 | 0.15 | 5.88 | 0.01531 | 1 | 0.34 | 0.46 | 0.14 | 0.85 | STAT5B | intronic, non-coding intronic |
| 17 | rs3816769 | C | 0.21 | 0.32 | 5.27 | 0.02165 | 1 | 0.56 | 0.26 | 0.33 | 0.92 | STAT3 | intronic, non-coding intronic, 3downstream |
| 1 | rs4845625 | T | 0.61 | 0.49 | 5.16 | 0.02314 | 1 | 1.63 | 0.22 | 1.07 | 2.49 | IL6R | intronic, non-coding intronic |
| 1 | rs1041937 | A | 0.18 | 0.28 | 4.51 | 0.03376 | 1 | 0.56 | 0.28 | 0.33 | 0.96 | LGALS8 | intronic, coding nonsyn, non-coding, coding syn, 5upstream, 3downstream |
| 1 | rs3819001 | G | 0.09 | 0.04 | 4.46 | 0.03480 | 1 | 2.16 | 0.37 | 1.04 | 4.49 | TNFRSF18 | 3utr, 3downstream |
| 17 | rs1026916 | A | 0.22 | 0.33 | 4.33 | 0.03750 | 1 | 0.59 | 0.25 | 0.36 | 0.98 | STAT3 | intronic |
| 17 | rs1053005 | G | 0.10 | 0.18 | 4.23 | 0.03978 | 1 | 0.49 | 0.35 | 0.25 | 0.98 | STAT3 | 3utr, 3downstream |
| 11 | rs2228055 | G | 0.10 | 0.05 | 4.17 | 0.04115 | 1 | 2.03 | 0.35 | 1.01 | 4.06 | IL10RA | coding nonsyn, 5upstream, 3utr, non-coding, 3downstream |
| 17 | rs2293154 | A | 0.09 | 0.17 | 4.14 | 0.04190 | 1 | 0.48 | 0.37 | 0.23 | 0.99 | STAT5A | intronic, non-coding intronic, 3downstream |
| 5 | rs10940495 | G | 0.34 | 0.25 | 4.10 | 0.04294 | 1 | 1.57 | 0.22 | 1.01 | 2.42 | IL6ST | intronic, non-coding intronic |
| 10 | rs10490938 | A | 0.28 | 0.19 | 4.03 | 0.04462 | 1 | 1.60 | 0.24 | 1.01 | 2.55 | NRP1 | intronic |
| 2 | rs231779 | T | 0.51 | 0.41 | 3.98 | 0.04601 | 1 | 1.52 | 0.21 | 1.00 | 2.30 | CTLA4 | intronic, 5upstream, non-coding intronic |
| 17 | rs744166 | C | 0.28 | 0.38 | 3.90 | 0.04819 | 1 | 0.63 | 0.24 | 0.40 | 1.00 | STAT3 | intronic |
| Genotypes and Alleles | Control N = 173 | Psoriasis N = 150 | OR (95% CI) | p-Value |
|---|---|---|---|---|
| IL4-590 rs2243250 | ||||
| CC | 115 66.5% | 64 42.7% | 0.38 (0.24–0.59) | <0.0001 |
| CT | 51 29.5% | 77 51.3% | 2.52 (1.60–3.99) | 0.0001 |
| TT | 7 4.0% | 9 6.0% | 1.51 (0.55–4.17) | 0.42 |
| C | 281 81.2% | 205 68.3% | 0.50 (0.35–0.72) | 0.0002 |
| T | 65 18.8% | 95 31.7% | 2.00 (1.39–2.88) | 0.0002 |
| IL6-174 rs1800795 | ||||
| GG | 30 15.3% | 31 20.7% | 1.24 (0.71–2.17) | 0.45 |
| GC | 107 63.2% | 82 54.7% | 0.74 (0.48–1.16) | 0.19 |
| CC | 36 21.5% | 37 24.6% | 1.25 (0.74–2.10) | 0.41 |
| G | 167 48.3% | 144 48.0% | 0.99 (0.73–1.35) | 0.95 |
| C | 179 51.7% | 156 52.0% | 1.01 (0.74–1.38) | 0.95 |
| IL10-1082 rs1800896 | ||||
| GG | 47 27.2% | 26 17.3% | 0.56 (0.33–0.96) | 0.04 |
| GA | 90 52.0% | 81 54.0% | 1.08 (0.70–1.68) | 0.72 |
| AA | 36 20.8% | 43 28.7% | 1.53 (0.92–2.55) | 0.10 |
| G | 184 53.2% | 133 44.3% | 0.70 (0.51–0.96) | 0.02 |
| A | 162 46.8% | 167 55.7% | 1.43 (1.05–1.95) | 0.02 |
| TGFB1 codon10 rs1982073 | ||||
| TT | 71 41.0% | 119 79.3% | 5.50 (3.35–9.07) | <0.0001 |
| TC | 56 32.4% | 19 12.7% | 0.30 (0.17–0.54) | 0.0001 |
| CC | 46 26.6% | 12 8.0% | 0.24 (0.12–0.47) | <0.0001 |
| T | 198 57.2% | 257 85.7% | 4.47 (3.03–6.58) | <0.0001 |
| C | 148 42.3% | 43 14.3% | 0.22 (0.15–0.33) | p < 0.0001 |
| CTLA4-318 rs5742909 | ||||
| CC | 140 80.9% | 110 73.3% | 0.65 (0.38–1.09) | 0.11 |
| CT | 32 18.5% | 40 26.7% | 1.60 (0.95–2.72) | 0.08 |
| TT | 1 0.6% | 0 0.0% | 0.38 (0.02–9.45) | 0.56 |
| C | 312 90.2% | 260 86.7% | 0.71 (0.44–1.15) | 0.16 |
| T | 34 9.8% | 40 13.3% | 1.41 (0.87–2.30) | 0.16 |
| STAT3 rs2293152 | ||||
| GG | 73 42.8% | 57 38.0% | 0.84 (0.54–1.31) | 0.44 |
| GC | 86 49.7% | 89 59.3% | 1.48 (0.95–2.30) | 0.08 |
| CC | 14 7.5% | 4 2.7% | 0.31 (0.10–0.97) | 0.04 |
| G | 232 67.1% | 203 67.7% | 1.03 (0.74–1.43) | 0.87 |
| C | 114 32.9% | 97 32.3% | 0.97 (0.70–1.35) | 0.87 |
| STAT3 rs4796793 | ||||
| CC | 88 50.9% | 87 58.0% | 1.33 (0.85–2.07) | 0.20 |
| CG | 69 39.9% | 51 34.0% | 0.78 (0.49–1.22) | 0.28 |
| GG | 16 9.2% | 12 8.0% | 0.85 (0.39–1.87) | 0.69 |
| C | 245 70.8% | 225 75.0% | 1.24 (0.87–1.75) | 0.23 |
| G | 101 29.2% | 75 25.0% | 0.81 (0.57–1.15) | 0.23 |
| FOXP3 rs2232365 | ||||
| AA | 61 35.3% | 63 42.0% | 1.33 (0.85–2.08) | 0.21 |
| AG | 40 23.1% | 29 19.3% | 0.80 (0.47–1.36) | 0.41 |
| GG | 72 41.6% | 58 38.7% | 0.88 (0.57–1.38) | 0.59 |
| A | 162 46.8% | 155 51.7% | 1.21 (0.89–1.65) | 0.22 |
| G | 184 53.2% | 145 48.3% | 0.82 (0.60–1.12) | 0.22 |
| Gene Name | Forward Primer (5′–3′) | Reverse Primer (5′–3′) |
|---|---|---|
| TNF | CCAGGGACCTCTCTCTAATCA | TCAGCTTGAGGGTTTGCTAC |
| IL1A | CTGAAGAAGAGACGGTTGAGTT | GCTGACCTAGGCTTGATGATT |
| FOXP3 | CTGCTCGCACAGATTACTT | GCAGCTTTGAGGTTGTTTG |
| IL2 | AAGAAGGCCACAGAACTGAAA | GTCCCTGGGTCTTAAGTGAAAG |
| CTLA4 | TTTTTCTTCTCTTCATCCCTGTCTT | CACACACAAAGCTGGCGAT |
Disclaimer/Publisher’s Note: The statements, opinions and data contained in all publications are solely those of the individual author(s) and contributor(s) and not of MDPI and/or the editor(s). MDPI and/or the editor(s) disclaim responsibility for any injury to people or property resulting from any ideas, methods, instructions or products referred to in the content. |
© 2023 by the authors. Licensee MDPI, Basel, Switzerland. This article is an open access article distributed under the terms and conditions of the Creative Commons Attribution (CC BY) license (https://creativecommons.org/licenses/by/4.0/).
Share and Cite
Purzycka-Bohdan, D.; Nedoszytko, B.; Sobalska-Kwapis, M.; Zabłotna, M.; Żmijewski, M.A.; Wierzbicka, J.; Gleń, J.; Strapagiel, D.; Szczerkowska-Dobosz, A.; Nowicki, R.J. Assessment of the Potential Role of Selected Single Nucleotide Polymorphisms (SNPs) of Genes Related to the Functioning of Regulatory T Cells in the Pathogenesis of Psoriasis. Int. J. Mol. Sci. 2023, 24, 6061. https://doi.org/10.3390/ijms24076061
Purzycka-Bohdan D, Nedoszytko B, Sobalska-Kwapis M, Zabłotna M, Żmijewski MA, Wierzbicka J, Gleń J, Strapagiel D, Szczerkowska-Dobosz A, Nowicki RJ. Assessment of the Potential Role of Selected Single Nucleotide Polymorphisms (SNPs) of Genes Related to the Functioning of Regulatory T Cells in the Pathogenesis of Psoriasis. International Journal of Molecular Sciences. 2023; 24(7):6061. https://doi.org/10.3390/ijms24076061
Chicago/Turabian StylePurzycka-Bohdan, Dorota, Bogusław Nedoszytko, Marta Sobalska-Kwapis, Monika Zabłotna, Michał A. Żmijewski, Justyna Wierzbicka, Jolanta Gleń, Dominik Strapagiel, Aneta Szczerkowska-Dobosz, and Roman J. Nowicki. 2023. "Assessment of the Potential Role of Selected Single Nucleotide Polymorphisms (SNPs) of Genes Related to the Functioning of Regulatory T Cells in the Pathogenesis of Psoriasis" International Journal of Molecular Sciences 24, no. 7: 6061. https://doi.org/10.3390/ijms24076061