Article

Differences in Whole-Blood Transcriptional Profiles in Inflammatory Bowel Disease Patients Responding to Vedolizumab Compared with Non-Responders †

1
Department of Biomedical and Clinical Sciences, Linköping University, 581 83 Linköping, Sweden
2
Laboratory Medicine, Region Jönköping County, 551 85 Jönköping, Sweden
3
IBD-Unit, Division of Gastroenterology, Karolinska University Hospital, 171 76 Stockholm, Sweden
4
Department of Medicine, Karolinska Institutet—Solna, 171 76 Stockholm, Sweden
*
Author to whom correspondence should be addressed.
Parts of the preliminary results from this study was presented as a poster at the 16th European Crohn’s and Colitis Organisation conference (ECCO’21 Virtual, 2–3 & 8–10 July 2021).
Int. J. Mol. Sci. 2023, 24(6), 5820; https://doi.org/10.3390/ijms24065820
Submission received: 13 December 2022 / Revised: 10 March 2023 / Accepted: 15 March 2023 / Published: 18 March 2023

Abstract

:
Vedolizumab is efficacious in the treatment of Crohn’s disease (CD) and ulcerative colitis (UC). However, a significant proportion of patients present with a non-response. To investigate whether differences in the clinical response to vedolizumab is reflected in changes in gene expression levels in whole blood, samples were collected at baseline before treatment, and at follow-up after 10–12 weeks. Whole genome transcriptional profiles were established by RNA sequencing. Before treatment, no differentially expressed genes were noted between responders (n = 9, UC 4, CD 5) and non-responders (n = 11, UC 3, CD 8). At follow-up, compared with baseline, responders displayed 201 differentially expressed genes, and 51 upregulated (e.g., translation initiation, mitochondrial translation, and peroxisomal membrane protein import) and 221 downregulated (e.g., Toll-like receptor activating cascades, and phagocytosis related) pathways. Twenty-two of the upregulated pathways in responders were instead downregulated in non-responders. The results correspond with a dampening of inflammatory activity in responders. Although considered a gut-specific drug, our study shows a considerable gene regulation in the blood of patients responding to vedolizumab. It also suggests that whole blood is not optimal for identifying predictive pre-treatment biomarkers based on individual genes. However, treatment outcomes may depend on several interacting genes, and our results indicate a possible potential of pathway analysis in predicting response to treatment, which merits further investigation.

1. Introduction

The need for personalized medicine has become increasingly more evident in the treatment of inflammatory bowel disease (IBD) in view of the complex immunoregulation and an expanding repertoire of drugs available. The use of effective drugs, such as immunomodulatory thiopurines and biologics, is associated with a significant risk of toxicity and with considerable costs. Therefore, biomarkers are strongly needed to guide medical decisions concerning when to use these drugs. The most efficient biological treatment used in IBD is traditionally considered to be treatment with TNF-α antagonists (adalimumab, certolizumab, golimumab, infliximab) in combination with thiopurines [1,2]. More recently, biological drugs targeting other molecules involved in the immune system, such as antibodies inhibiting the p40 subunits of IL-12 and -23 (ustekinumab) and α4β7 integrins on leukocytes (vedolizumab, VDZ), have been developed and have entered into clinical routine use [2,3,4].
The trafficking of leukocytes into the inflamed intestinal tissue is a driver of inflammation and a highly regulated process. T cells present in circulating blood enter the intestinal mucosa through the interaction between the α4β7 integrin expressed on their surface and the mucosal vascular addressin cell adhesion molecule (MAdCAM-1) on the vascular endothelium [5].
VDZ is a humanized antibody which is generally considered to be gut-specific and to specifically target this interaction, thereby reducing the T cell infiltration in the intestinal tissue. VDZ may be an alternative in patients who have failed to response anti-TNF-α treatment and who often present progressive forms of disease. However, despite efficacy in a large proportion of patients, subgroups show persistent disease activity [6,7,8,9]. Thus, stratified approaches are needed in order to deliver an appropriate treatment.
Transcriptional profiling of intestinal biopsies has shown that endoscopic healing following VDZ treatment is associated with the regulation of immune-related genes involved in leukocyte migration and lipid metabolism in the intestinal mucosa [10]. The effect has been found to be most pronounced after one year of VDZ therapy. Clinical remission following VDZ treatment has been associated with a dampening of the innate immune response, granulocyte adhesion and diapedesis, as well as with TNF signalling pathways [11,12]. The trough concentration of VDZ, the expression and saturation of α4β7-integrin on peripheral blood CD4+ T cells, as well as on mucosal CD4+ cells, have been suggested as promising predictive biomarkers for treatment guidance, even though controversy exists [12,13,14,15]. Furthermore, the serum concentration of chemokines has been investigated in relation to the clinical response to treatment [16,17]. However, the results of these studies have not made their way into clinical practice.
Even though VDZ is considered gut-specific, its effects in vivo have not been fully elucidated, which calls for investigations. Here, we hypothesized that differences in clinical response to VDZ therapy might be reflected in changes in gene expression levels in whole blood, which, in contrast to intestinal biopsies and isolated cell populations, could provide easily accessible biomarkers. RNA-sequencing data were investigated for differentially expressed genes (DEGs) and for gene set enrichment in biological pathways. We show a large number of DEGs following VDZ in responders and suggest that pathway analysis may provide a potential tool for predicting responses to treatment, although further studies are needed.

2. Results

2.1. Clinical Characteristics

Overall, routine blood laboratory parameters were unchanged following treatment with VDZ (T1) when compared with baseline (T0), both in responders (n = 13) and in non-responders (n = 11). However, the serum concentration of C-reactive protein (CRP) was higher in responders compared with non-responders at both time points. The concentration did not change over time in any group (Table 1). Four responders and four non-responders were able to withdraw corticosteroids following the introduction of VDZ.
The clinical disease activity indices; the simplified Harvey Bradshaw index (sHBI) and the Simple Clinical Colitis Activity Index (SCCAI) correlated with the ‘physician global assessment’ (PGA): sHBI rs = 0.65, p = 0.0002, and SSCAI rs = 0.84, p < 0.0001, when data from both T0 and T1 were included.
The proportion of patients treated with anti-TNF-α drugs during the six months preceding VDZ were similar in responders (58%) and non-responders (64%), (p = 1.00), as was the time elapsed between withdrawal of the last anti-TNF-α drug and the introduction of VDZ (p = 0.98) (Table 1).
At the 6 month follow-up after the initial three infusions, 19/24 (79%) of patients were still on VDZ treatment: 11/13 (85%) among responders and 8/11 (73%) among non-responders (p = 0.63). At 12 months, 15/24 (63%) of patients were still on VDZ treatment: 10/13 (77%) among responders and 5/11 (45%) among non-responders, p = 0.21. The main reason for withdrawal was persisting disease activity.

2.2. Plasma Concentration of VDZ vs. Response to Treatment

There was no difference in the plasma concentrations of VDZ between responders and non-responders at T1 (Table 1). The concentration of VDZ in CD patients [14.2 (21.8) µg/mL] was comparable to that in UC patients [9.6 (14.1) µg/mL] (p = 0.07).

2.3. Whole-Genome Expression Analysis

RNA, both at baseline (T0) and at follow-up (T1), was available for 20 patients, 9 responders and 11 non-responders (Table S1). The number of reads per sample was 25.3 (range 10.4–65.6) million. Out of a total of 56,303 genes, 12,666 remained for statistical analysis after filtering.
Multidimensional scaling suggested group differences based on gender (separation along dimension 1, p = 5.7 × 10⁻³; separation along dimension 2, p = 3.6 × 10⁻¹⁰). When comparing females (n = 6) with males (n = 14) at baseline (T0), 33 DEGs were observed, and at the follow-up (T1) 30 DEGs were seen. There was an overlap between the genes identified at T0 and T1, represented by 28 genes located at the X- or Y-chromosome, and by removing sex chromosome-related genes prior to multidimensionally scaling the observed clustering of samples eliminated. In addition, the gender distributions between the major study groups (responders and non-responders) were similar. No grouping of samples based on disease type, whether UC or CD, was observed (separation along dimension 1, p = 0.57, separation along dimension 2, p = 0.33). Therefore, further analyses were performed without stratification based on disease type or gender.

2.4. Deconvolution

When RNA sequencing data were used for the estimation of the relative abundance of white blood cells, a decrease in the abundance of B cells was observed in responders at follow-up (T1) compared with baseline (T0), with p = 0.046 (Table S2).

2.5. Gene-Expression in Responders Compared with Non-Responders

No DEGs were observed between responders (n = 9) and non-responders (n = 11), neither when analysing transcriptional profiles at baseline (T0), nor were any detected at follow-up (T1) under treatment (Table S3: Sheets 1–2).

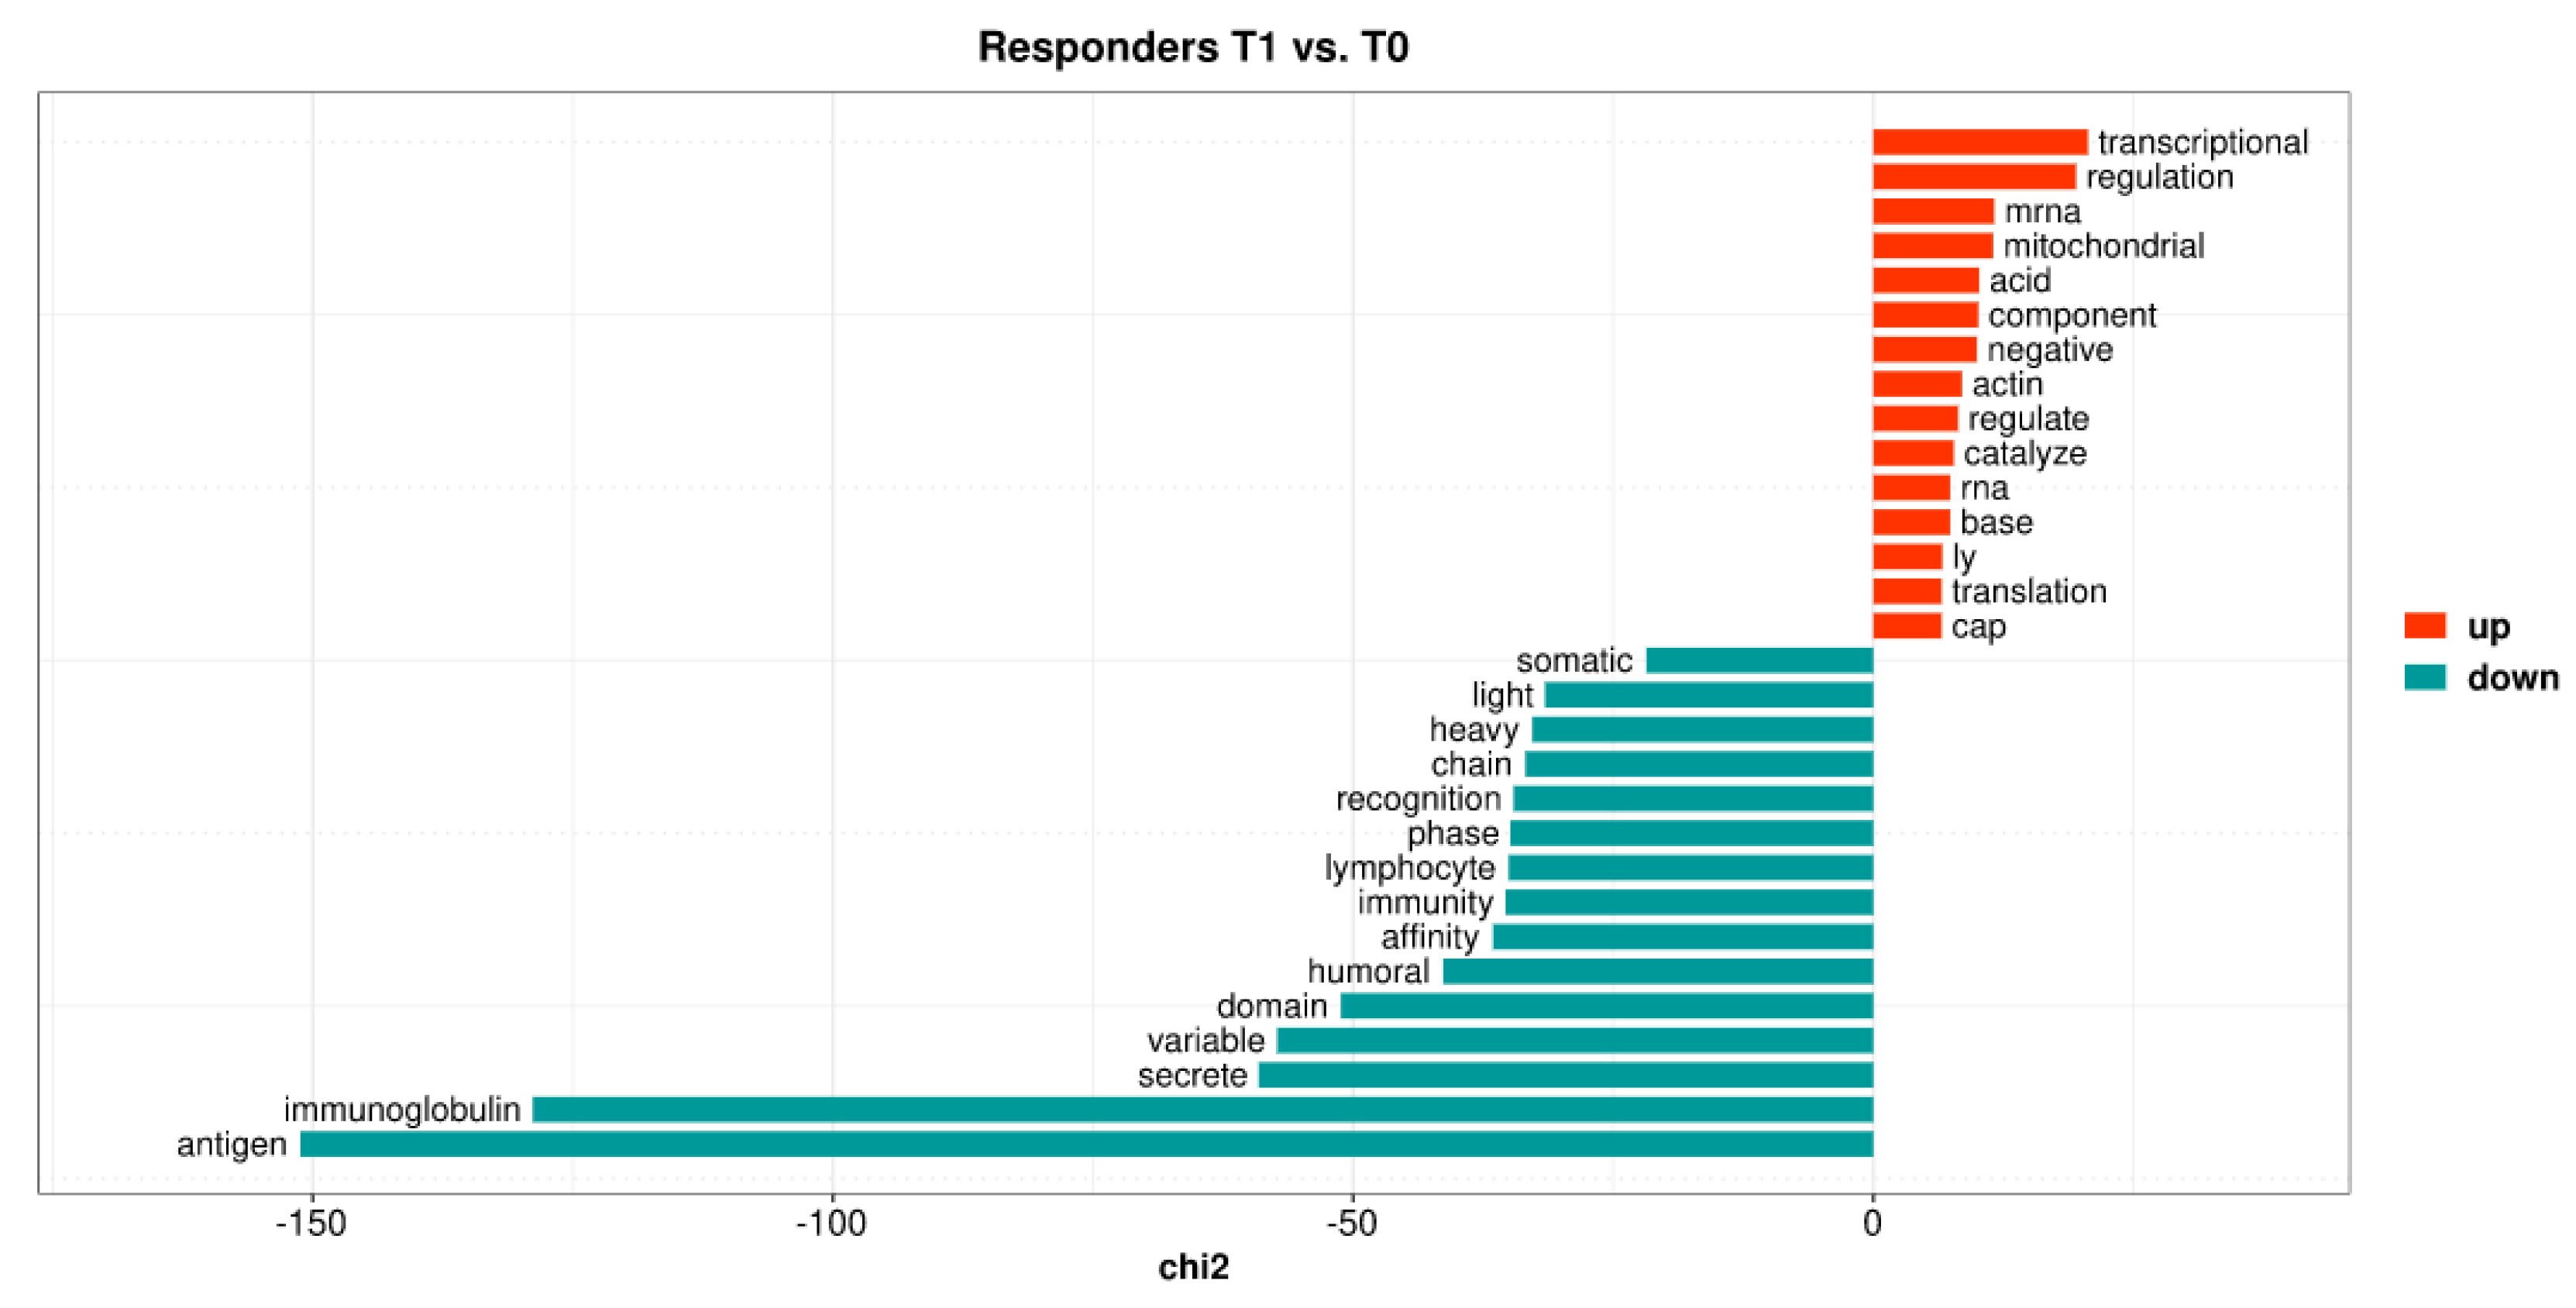
2.6. VDZ Regulates the Expression of Genes in Whole Blood Only in Patients Responding to Treatment

When transcriptional profiles at follow-up (T1), were compared with those at baseline (T0) in responders (n = 9), 201 genes were regulated, of which 13 were pseudogenes (Figure 1, Table S3: Sheet 3). Twenty-five of the 55 downregulated genes were regulated at least two-fold. The majority of them were immunoglobulin light-chain and immunoglobulin heavy-chain genes (e.g., IGHV3-11, IGHA2, IGLV1-47, and IGLV1-44). The gene MZB1 is ascribed many functions. It helps to diversify B-cell functions, promotes IgM assembly and secretion, and may also function as a proinflammatory cytokine. An isoform of MZB1 may be involved in the regulation of apoptosis.
Eight of the 146 upregulated genes were regulated at least two-fold. These genes mainly represented the processes involved in the suppression of the non-canonical pathways of NFKB activation (OLFM1), in T-cell receptor alpha joining (TRAJ7, TRAJ11, TRAJ18), in processes involving disintegrin and metalloproteinases with thrombospondin motifs such as the modulation of the bone morphogenetic protein, the SMAD1/5/8 signaling pathway (ADAMTS17), in proto-oncogenic functions (HRAS), in voltage-dependent Ca2+ channel signaling (CACNG8), and in the regulation of the glucose metabolism and lipogenesis (XYLB), as described by UniProtKB.
An over-representation analysis identified no over-represented biological pathways among the 201 DEGs (Table S3, Sheet 4). However, using quantitative text analysis (169 out of 188 non-pseudogenes were represented by proteins in UniProtKB), it was determined that the term mitochondria was over-represented among the upregulated genes, whereas immunoglobulin was found to be over-represented among the downregulated genes (Figure 2).
No DEGs were observed in non-responders (n = 11) when follow-up data under VDZ treatment (T1) were compared with those at baseline (T0) (Table S3: Sheet 5).

2.7. Gene Set Enrichment Analyses

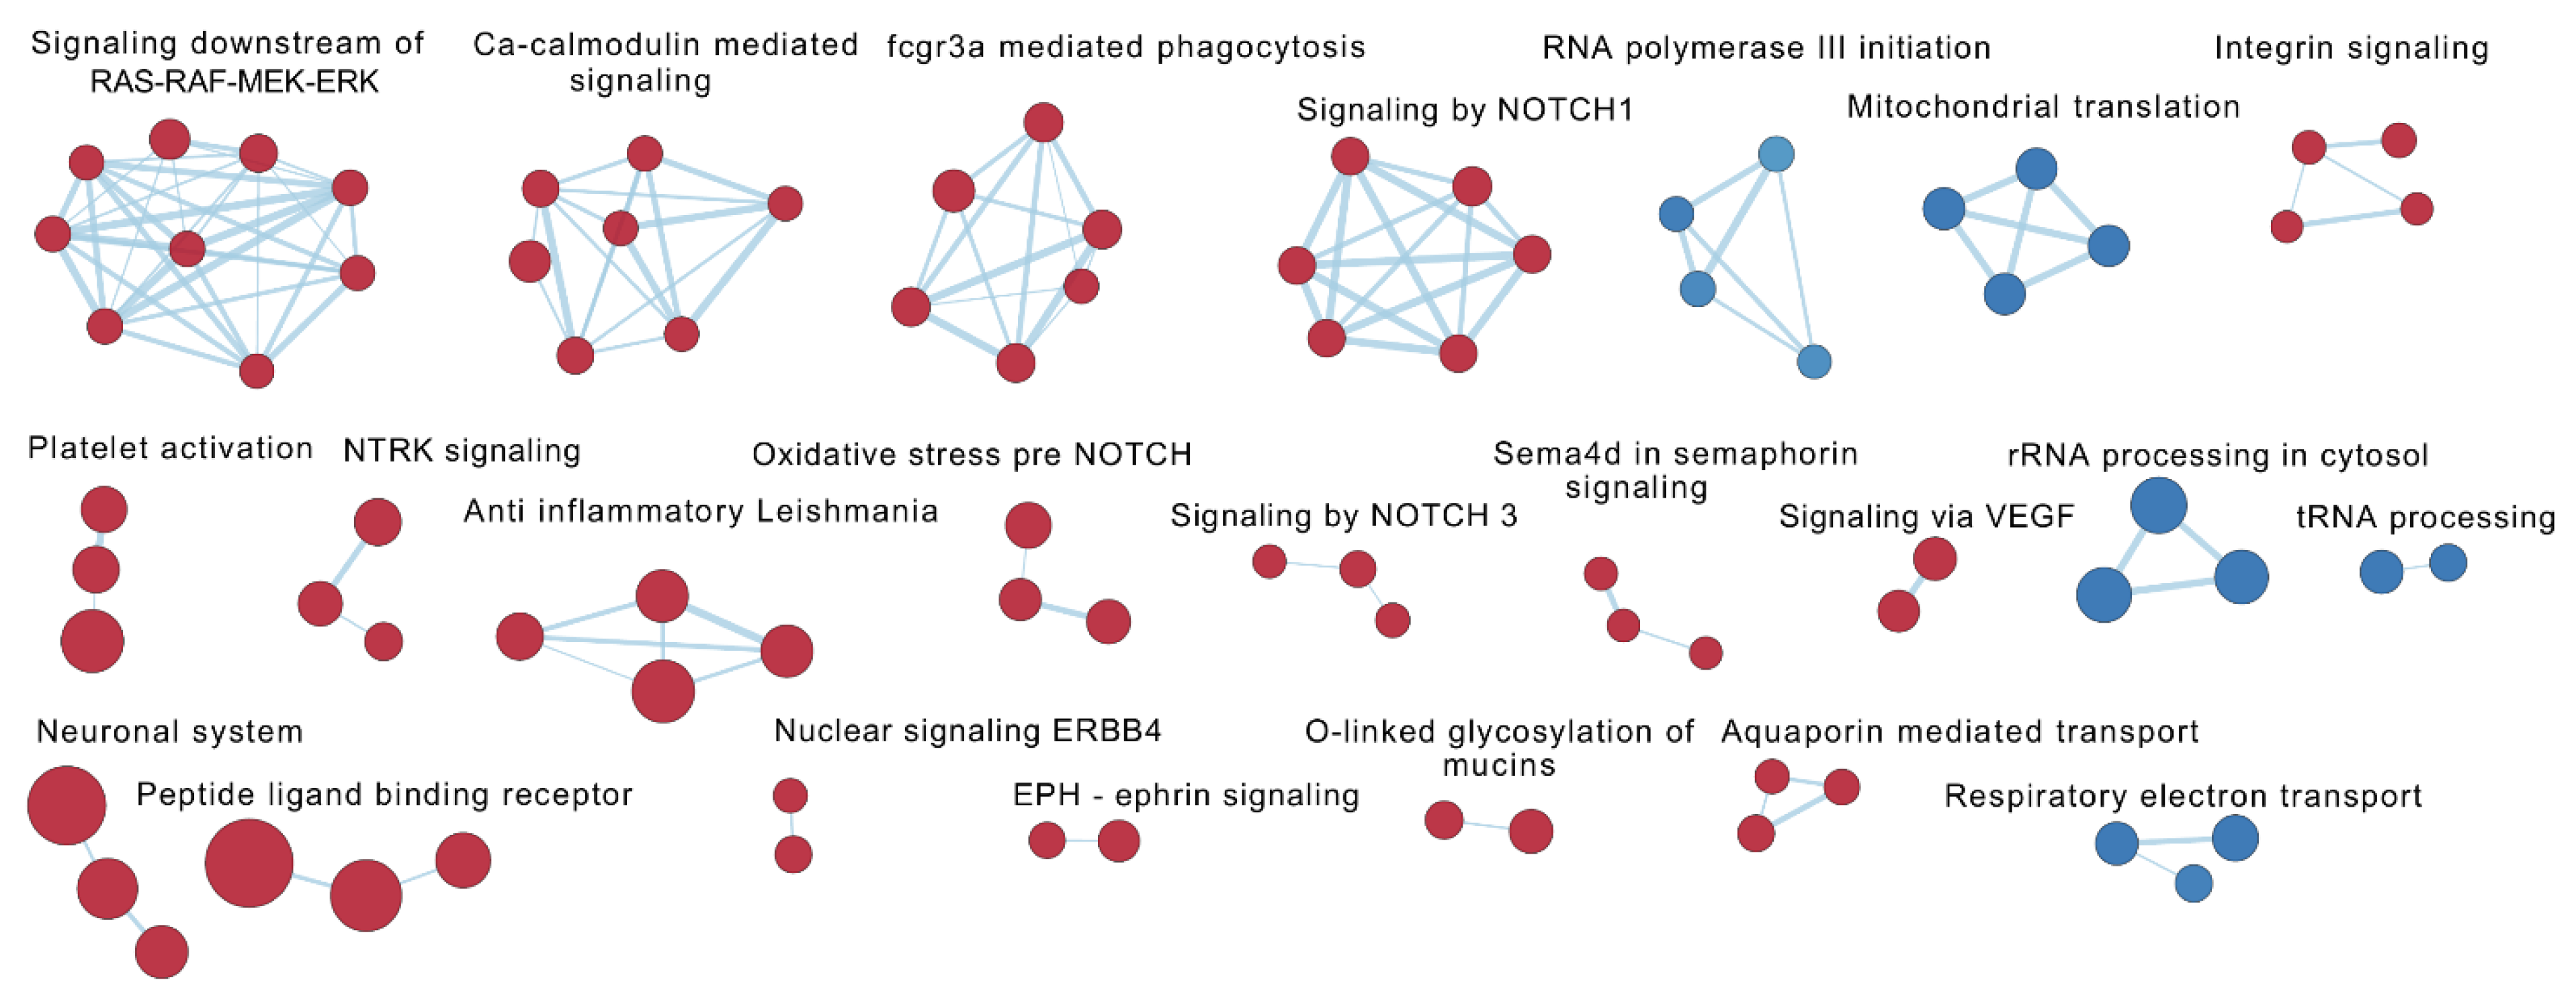
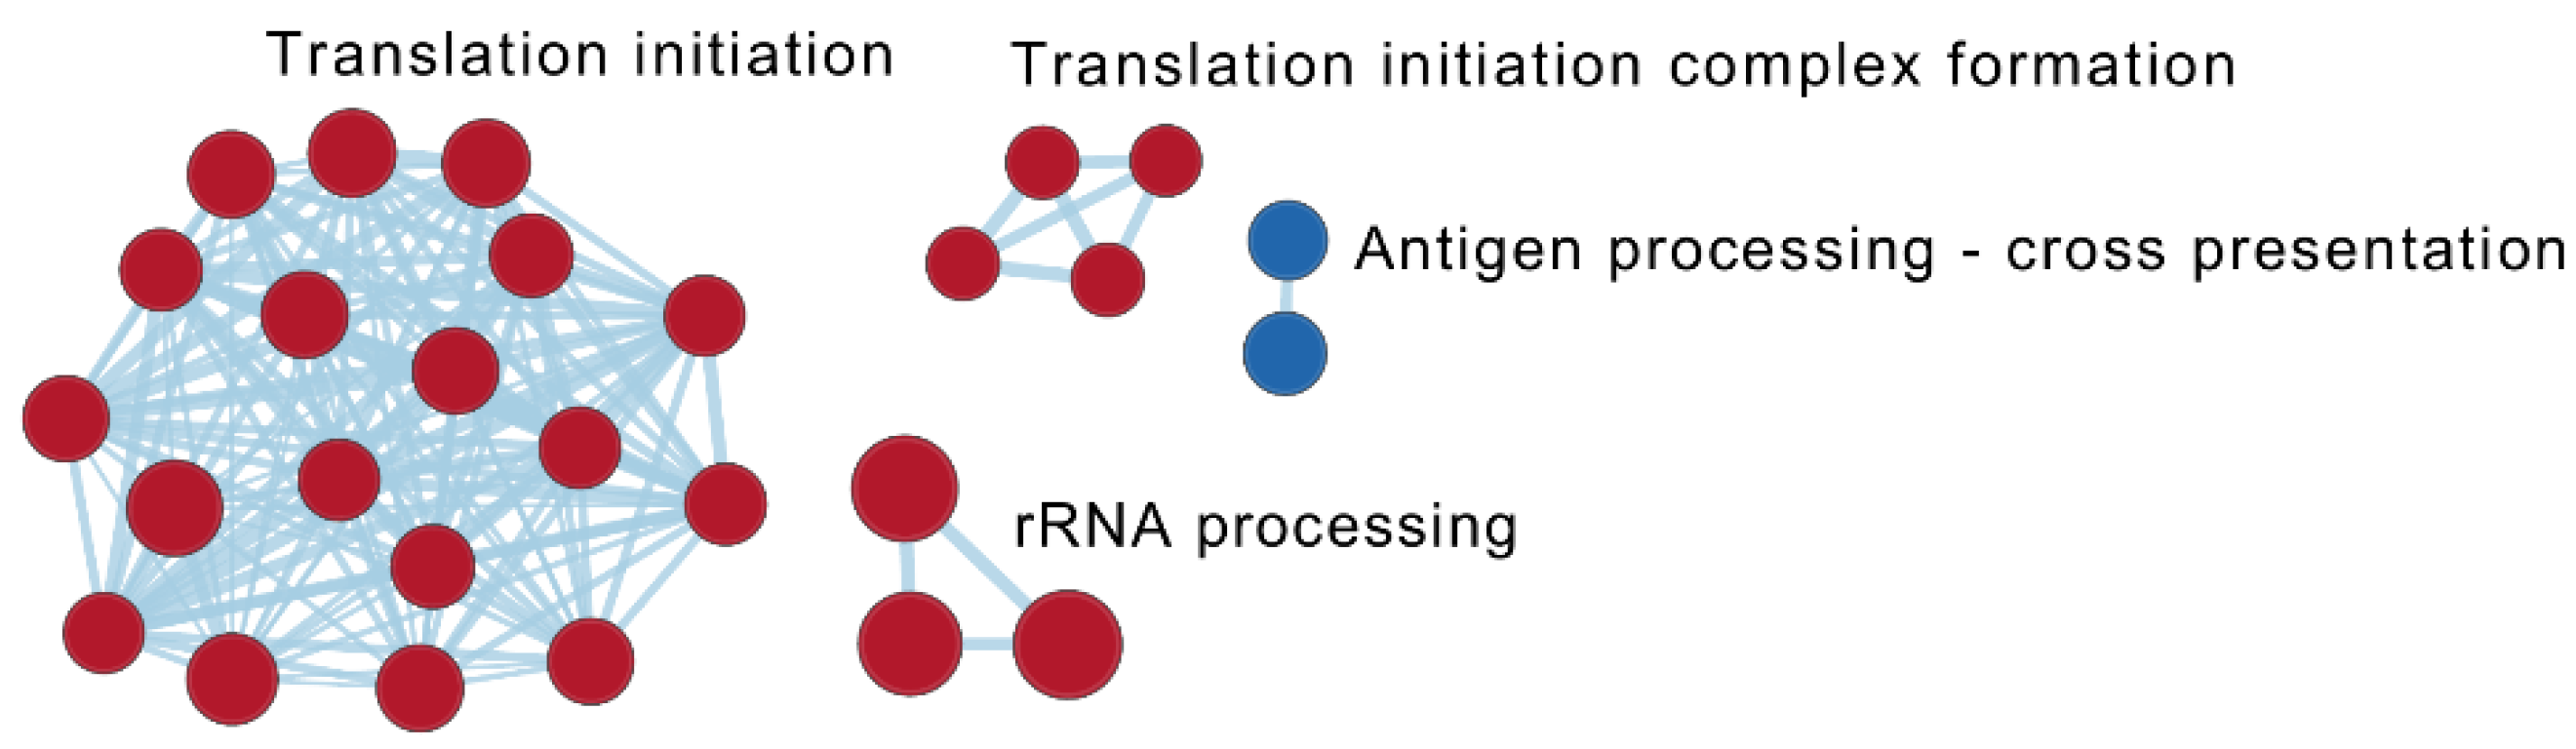
2.7.1. Enrichment Analysis in Responders Compared with Non-Responders

Next we used the entire dataset for gene set enrichment analysis in order to detect subtle and coordinated alterations in gene expression.
At baseline (T0), 325 reactome pathways were differentially regulated (FDR < 0.075) in responders (n = 9) compared with non-responders (n = 11) (Table 2). The most upregulated pathways in responders concerned themes of “innate immunity”, “phagocytic processes”, “cytoskeleton modulation”, “amino acid transport across the plasma membrane”, and “glycosaminoglucan metabolism”. Among the most downregulated pathways were “mitochondrial processes” such as “mitochondrial translation” and “respiratory electron transport”, “processing of rRNA” and “processing of tRNA” (Figure 3, Table 3 and Table S4; Sheet 1).
At follow-up, the difference between responders and non-responders was represented by 40 reactome pathways (Table 2). The most significant upregulated pathways in responders were related to “translation” and its regulation, while pathways associated with the themes “antigen processing-cross presentation” (antigen cross-presentation/cross-priming of exogenous antigens on MHC class I molecules to CD8+ T lymphocytes), “ADP signaling through P2Y purinoceptor 12” as well as “interferon α, β, and γ signaling” were the most downregulated (Figure 4, Table 4 and Table S4; Sheet 2).
The pathways for “rRNA processing”, “rRNA modification in nucleolus and cytosol”, “major pathway of rRNA processing in nucleus and cytosol”, and “rRNA processing” were downregulated at baseline (T0) in responders (negative normalized enrichment score) compared with non-responders. However, the same pathways were upregulated at follow-up (positive normalized enrichment score).

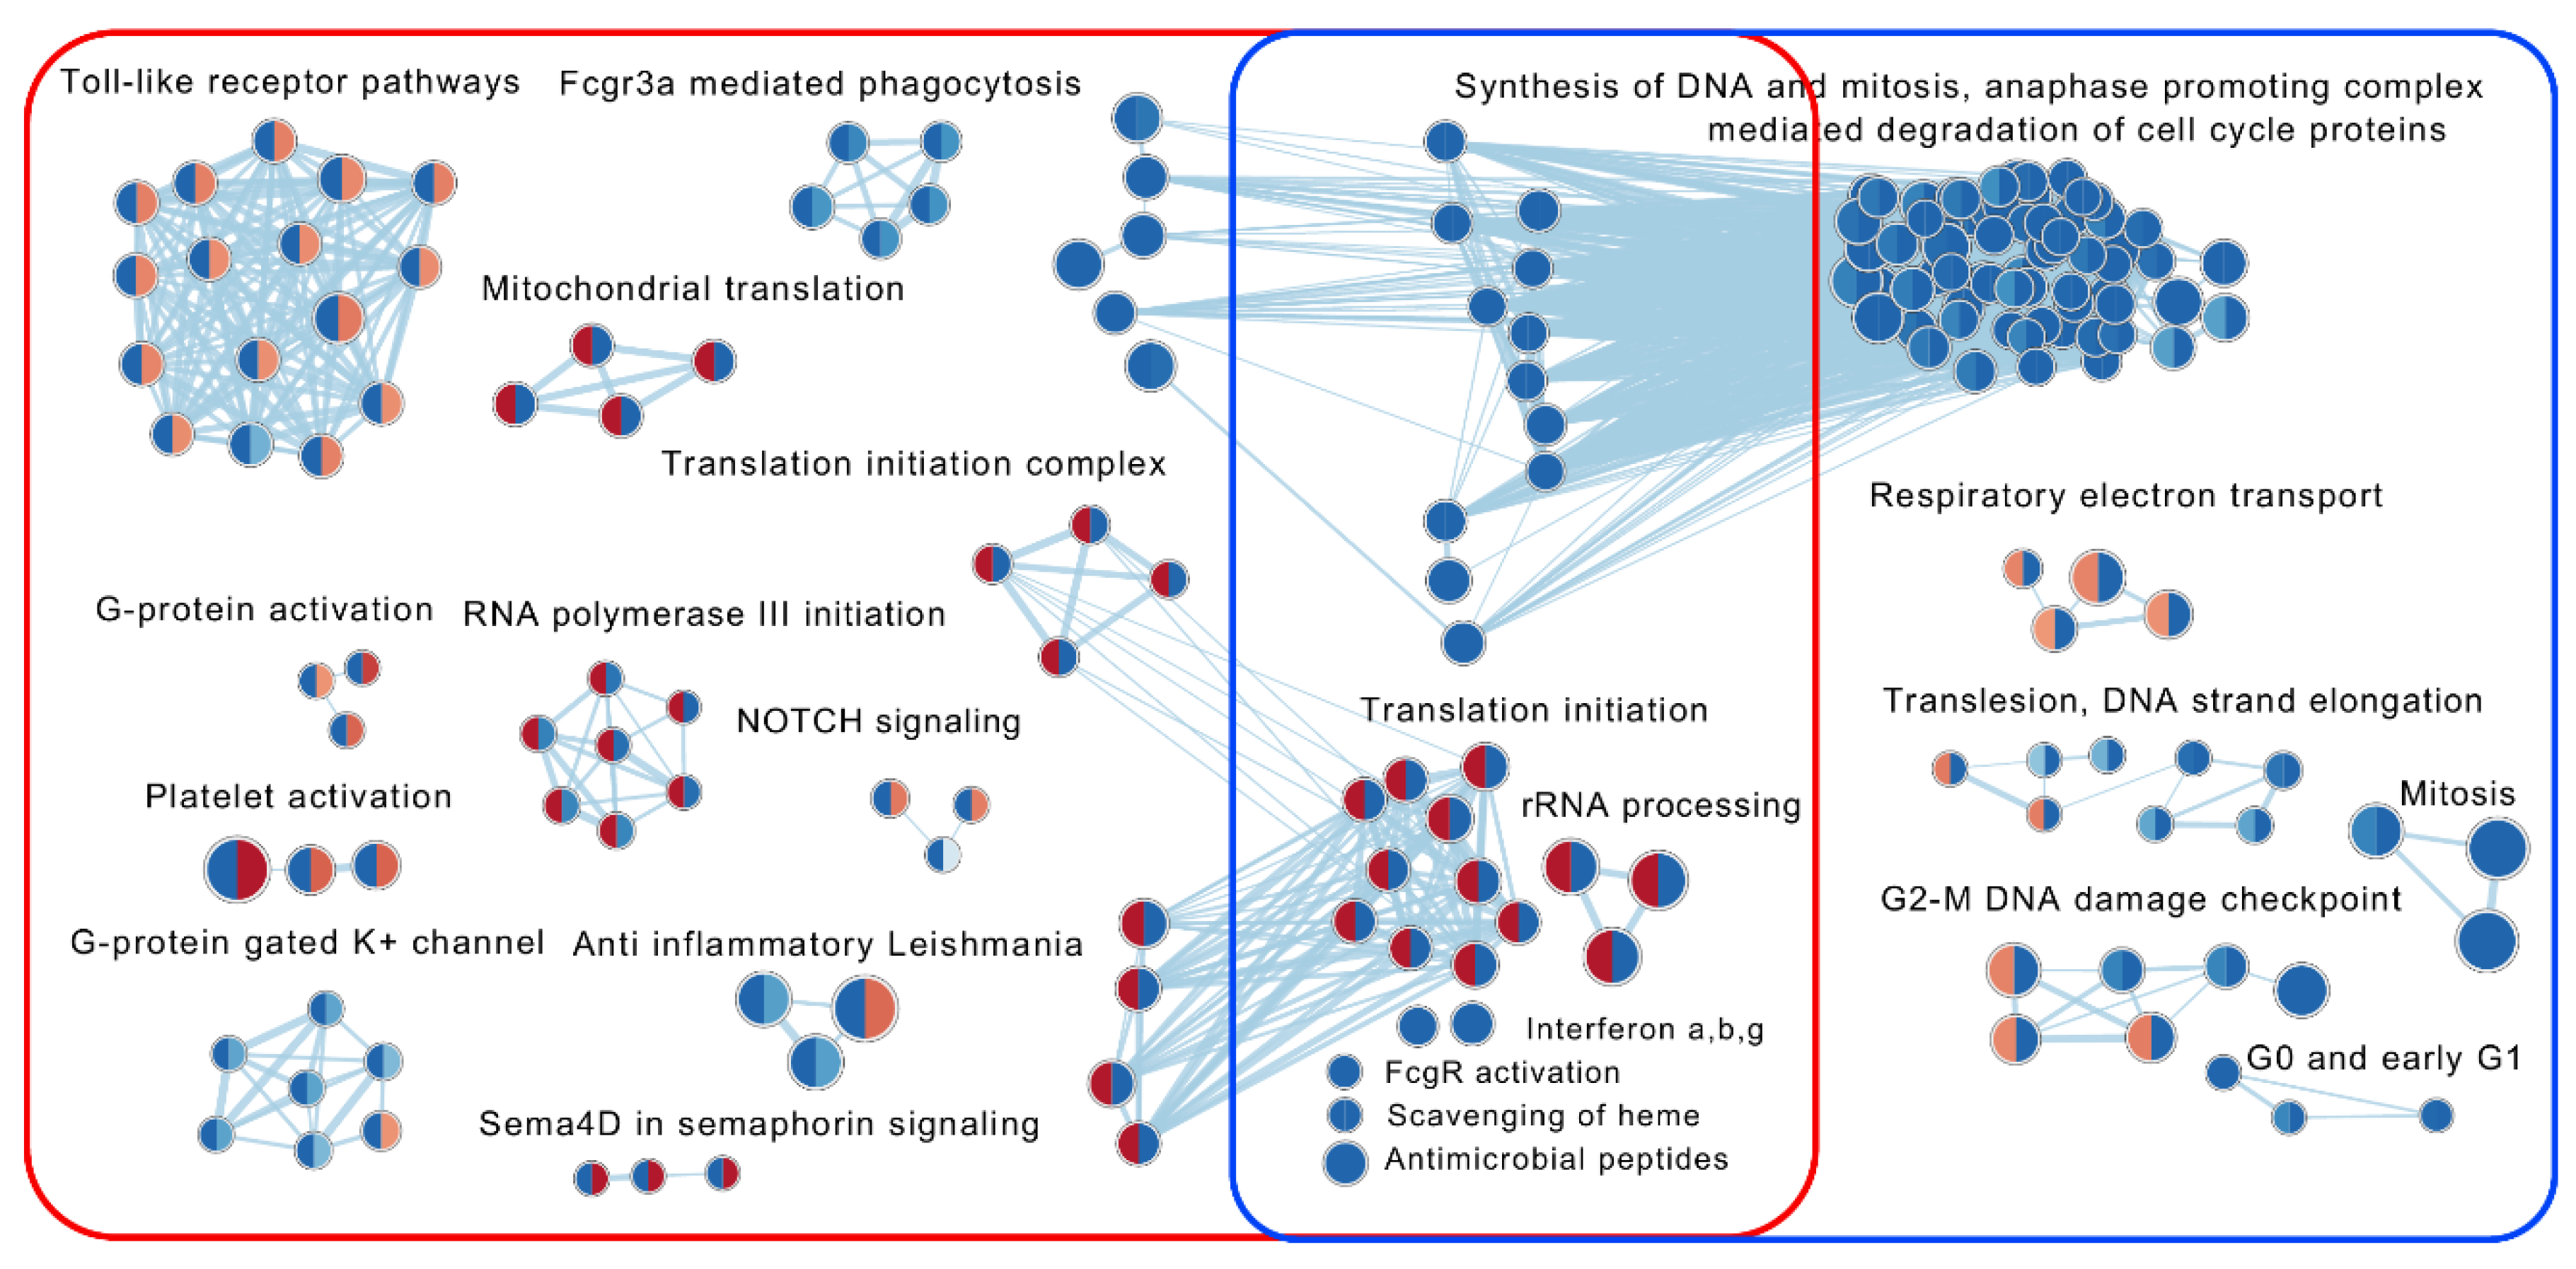
2.7.2. The Effect of VDZ Treatment on Biological Pathways within Responders and Non-Responders

Under treatment with VDZ, 272 and 194 reactome pathways were differentially regulated (FDR < 0.075) compared with baseline in responders and in non-responders, respectively (Figure 5, Table 2 and Table S4; Sheets 3–5). Of the 51 reactome pathways uniquely upregulated in responders, 22 were instead downregulated in non-responders (e.g., pathways of “rRNA processing in the nucleolus and cytosol”, “translation initiation”, “translation elongation”, “translation termination”, “mitochondrial translation elongation and termination”, and “peroxisomal membrane protein import”). Fourteen of these pathways were among the top 25 most significantly upregulated pathways in responders (Table S4, Sheet 5). In addition, pathways related to “tRNA processing” and to “RNA polymerase I and III transcription initiation” were upregulated. The pathways uniquely downregulated in responders (n = 184) were represented by, e.g., “actin dynamics for phagocytic cup formation”, “FCGR3A-mediated phagocytosis”, “Toll-like receptor activating cascades”, “platelet activation and degranulation”, and “detoxification of reactive oxygen species”.
In non-responders, 156 pathways in total (including the 22 above) were uniquely downregulated at follow-up (e.g processes of the “cell cycle” and “DNA replication”, “anaphase promoting complex mediated degradation of cell cycle proteins” and “interferon signaling”), but only one pathway (“protein–protein interactions at synapses”) was uniquely upregulated (Table S4, Sheet 5).
Thirty-seven pathways were downregulated in both responders and non-responders, e.g., “antigen processing-cross-presentation”, “the complement cascade”, “scavenger receptors”, “antimicrobial peptides”, “interferon γ signaling” and “interferon α, β signaling” (Table S4; Sheet 5).

3. Discussion

Information is sparse on biomarkers for guiding treatment decision in patients with inflammatory bowel disease when contemplating treatment with VDZ. Here, we used peripheral whole blood in an attempt to identify candidate genes or candidate biological pathways for further evaluation.
Our observation of there being no DEGs between UC and CD is in agreement with some reports [18], although it is in contrast with others [19]. However, in the gene-by-gene comparisons, the transcriptional dynamics were strikingly different between responders and non-responders following treatment. A large number of DEGs was observed in patients responding to VDZ compared with baseline. The eight most upregulated genes have been described in the contexts of cellular proliferation, differentiation and cellular apoptosis/survival, inhibition of NFKB activation, tissue development, and glucose metabolism [20,21,22,23,24,25]. We did not find any individual DEGs in the whole blood of non-responders at follow-up when compared with baseline. This is in agreement with observations in the intestinal mucosa of non-responders to VDZ [10,11], even though the literature is inconsistent on this point [12].
The investigation of the pre-treatment gene signatures did not reveal any DEGs between responders and non-responders which are suitable for use as predictive biomarkers. However, using colonic biopsies from patients naïve to biological treatment, Verstockt et al. [26] established a four-gene-based model which showed promising results in predicting endoscopic remission in response to VDZ. These four genes (RGS13, DCHS2, MAATS1 and PIWIL1) were all expressed at low levels in blood and were excluded by the filtering of our data. Even though no individual genes were identified as suitable biomarkers, treatment outcomes may depend on several interacting genes and our results indicate the possible potential for pathway analysis in predicting response to VDZ.
Although VDZ is considered gut-specific, the trafficking of leukocytes to the intestine as well as the relative and absolute abundance of peripheral blood cells seem unaffected by the drug [11,27,28]. These observations were largely confirmed in our study. However, in contrast to previous observations, we found a small but significant reduction in the relative abundance of B cells at follow-up with VDZ in responders. This was paralleled with a reduced expression of MZB1, which is related with B-cell activation and infiltration and immunoglobulin folding and secretion [29], as well as with other immunoglobulin-related genes. Indeed, VDZ binds to α4β7 on B cells [30], but little is known about the effect of this binding. Our results are consistent with previous reports, suggesting the potential importance of the B-cell population and signaling through α4β7 as well as of the B-cell receptor following VDZ [11,31,32,33]. However, the baseline enrichment of the sub-population of naïve B cells, noticed in the intestinal mucosa of patients responding with endoscopic remission to VDZ [26], was not observed in blood of our patients.
Differences between responders and non-responders most likely depend on several interacting cell types and genes, each contributing with an individual small effect. This was illustrated by the identification of significant differences in pathway enrichment between groups, both at baseline and in response to VDZ. Zeissig et. al. [11] showed a dampening of innate immunity processes in intestinal biopsies of remitters to VDZ, which was confirmed by our findings in peripheral blood of responders when compared with baseline. In addition to the observed downregulation of pathways associated with “FC gamma receptor mediated phagocytosis” and “regulation of the actin dynamics for phagocytic cup formation”, pathways associated with “Toll-like receptors activation” (a crusial part of the innate immunity) were downregulated in responders. Toll-like receptors sense and recognize specific molecular patterns of microbial products, and their downstream signaling is also involved in regulating the adaptive immune cells implicated in the pathogenesis of IBD [34]. During inflammation, the production of reactive oxygen species by leukocytes and macrophages increases, whereas the production of antioxidant molecules decreases, creating a cellular imbalance [35,36]. In responders, pathways of “detoxification of reactive oxygen” species were downregulated, as were the pathways of “platelet degranulation and activation”, following VDZ treatment. Overall, this implies a dampening of innate inflammatory activity.
Even if expression of the α4β7 integrin is highest on memory CD4+ T cells, it is also expressed by many other cell populations [30]. The recruitment of cells of the innate immune system, such as monocytic progenitor dendritic cells, to the intestine rely on the α4β7-MadCAM-1 interaction [37,38]. These observations imply that the blockage of recruitment of innate immune cells may contribute to the effects of VDZ, in addition to its more well described effect on T cells. Furthermore, it was recently shown that α4β7- T cells may enter the intestinal mucosa via inflammation-induced alternative mechanisms (e.g., via α4β1/VCAM-1 or αLβ2/ICAM-1) and differentiate to αEβ7 effector cells, and that α4β7 blockade only partially reduces T cell trafficking to the gut. Therefore, it has been suggested that α4β7-directed therapy alone may leave additional compensatory homing mechanisms active [39,40], which merits further investigation. Blood-based transcriptomic profiling of treatment-naïve as well as treated IBD patients has shown an enrichment of pathways of “innate immunity”, and especially of myeloid-mediated immunity such as “neutrophil mediated immunity”, as well as the activation of “oxidative phosphorylation” when compared with healthy controls [18].
Following treatment with VDZ, “tRNA and rRNA processes” involved in the translational machinery, “mitochondrial translation”, and the process of “peroxisomal membrane protein import” were upregulated in responders compared with baseline values, but they were downregulated in non-responders. The upregulation of translational, mitochondrial translational and peroxisome-related pathways, as well as those associated with the transcription of RNA polymerase I and III following VDZ treatment, may indicate a restoration of the cellular milieu and functions compared with baseline in responders, but not in non-responders. The mitochondria regulate vital cellular functions besides energy production. Mitochondrial dysfunction, including increased oxidative stress and impaired ATP production, are characteristics of IBD [41]. Both rRNA synthesis and the ribosome production are energy-expensive processes, and in addition comprise critical and pleitropic elements involved in the control of cell growth and proliferation. The response to cellular stress is most commonly achieved by downregulating these processes, ultimately leading to aberrant protein synthesis and regulation of the cell cycle progression [42,43]. The peroxisome is, together with the mitochondria compartment, also responsible for the fatty acid beta-oxidation [44]. The observations here are consistent with our previous findings [45], where pathways of the mitochondrial respiratory chain and peroxisome were downregulated in the inflamed UC mucosa, whereas mitochondrial translation was upregulated in the noninflamed mucosa.
In our population, CRP was higher in responders than in non-responders, both before initiation of VDZ and at follow-up. However, the median CRP concentration did not decrease over time, either in responders or in non-responders, indicating that CRP was not associated with clinical response. Several studies have reported that a high baseline CRP may predict a better response to treatment with anti-TNFs, and in our data a similar observation was made. Furthermore, we consider it plausible that the absent decrease in CRP during treatment, in contrast to anti-TNF-α therapy, can be explained by the various modes of drug action. TNF-α directly upregulates IL6 production, and anti-TNF-α therapy accordingly results in a reduction in CRP, whereas similar decreases may not be seen for agents that do not directly block TNF-α, such as VDZ, which has been reviewed in [46,47]. In analogy with our observations, a reduction in CRP was not seen in the randomized trial of VDZ in UC [6].
The strength of our study is that it was performed on patients in a ‘real-world setting’ which were treated according to established clinical praxis in accordance with national and international guidelines, rather than a formal study protocol. There are some limitations, such as a small number of patients, which usually is the case in this kind of laborsome experimental set-up [10,11,12,26,48], which could affect the results. The estimation of appropriate group sizes and study power rely extensively on previous knowledge and are affected by biological variation, fold-change and the significance level selected [49]. Gene expression profiling in patients with different outcomes on biological drugs, including VDZ, has been performed previously, but mainly on isolated cell populations or intestinal biopsy samples [10,12,26,48,50]. In the responders, 201 genes were indeed regulated (33 with FC > 2). Even though our pathway analyses showed promising results, our data also indicated that the use of blood as matrix is not suitable for identifying single or a few candidate genes able to predict response to VDZ already at baseline.
In conclusion, even if considered a gut-specific drug, our study shows that VDZ has considerable effects on the transcriptional profile in blood of patients responding to treatment, whereas no specific gene regulation was observed in non-responders. It also indicates that whole blood is not optimal for identifying predictive pre-treatment biomarkers based on individual genes in patients with inflammatory bowel disease and in need for this integrin inhibitor. However, our results suggest the potential of pathway analysis in predicting responses to treatment, illustrated by the identification of significant effects on pathways associated with innate immune response, as well as on ribosomal and mitochondrial translation, and the peroxisome. These effects were closely associated with the response to treatment. The use of newer technologies, such as single-cell RNA-sequencing, may possible shed more light on the contribution of different cell types to the efficacy.

4. Materials and Methods

4.1. Study Population

Twenty-four patients > 15 years of age (9 UC, 15 CD) from the outpatient clinics at the Division of Gastroenterology, Karolinska University Hospital in Stockholm, Sweden, who previously had failed to respond to at least one anti-TNF-α drug, were included.
Demographic- and disease-related data, including age, gender, disease duration, concomitant medication and routine laboratory test results, were retrieved from the patients’ medical records. At inclusion, 15 patients were on glucocorticosteroids. Nine patients were treated with mesalazine and nine with thiopurines, and the doses of these drugs were unchanged over the study period. All patients were naïve to VDZ. No patient had received ustekinumab. Sample group sizes were based on the recommendations in the work of Schurch et al., 2017, and Bi et al., 2016 [51,52].
Patients were sampled at baseline before starting VDZ (T0) and at follow-up at week 10–12 (T1), when clinical efficacy was assessed. At this point, all patient had received three infusions (300 mg each) of VDZ at week 0, 2 and 6, respectively. A sHBI (abdominal palpation excluded) ≤ 4 or a SCCAI ≤ 2 was used to define clinical remission. Clinical response was defined as a decrease in either sHBI ≥ 3 or SCCAI ≥ 3 from baseline [53,54,55] or as a ‘physician global assessment’ by one experienced gastroenterologist without access to endoscopy or laboratory results (taking presence of diarrhea, stool frequency, abdominal pain, fatigue, presence of fever and weight into account). Here, grade 0 was remission, grade 1 mild, grade 2 moderate, and grade 4 severe disease activity.

4.2. Sample Collection

Blood samples were collected at T0 and T1. Plasma was isolated from whole blood collected in standard K2EDTA tubes (Becton, Dickinson and Company, Franklin Lakes, NJ, USA) and stored at −70 °C until analysis. For the isolation of RNA, blood was collected and stabilized in Tempus Blood RNA tubes (ThermoFisher Scientific, Waltham, MA, USA) [56].

4.3. Plasma Concentration of Vedolizumab

The plasma concentration of VDZ was determined at T1 (week 10–12) with an in-house enzyme-linked immunosorbent assay method used in clinical routines at the Department of Clinical Immunology and Transfusion medicine, Karolinska University Laboratory, Stockholm, Sweden. The imprecision at VDZ 1.4 µg/mL and 7.3 µg/mL was 30% and 20%, respectively.

4.4. RNA Sequencing

RNA sequencing was performed at the National Genomics Infrastructure (NGI), SciLifeLab, Stockholm, Sweden. Libraries were prepared with TruSeq Stranded Total RNA with ribosomal depletion using Ribo-Zero Globin (Illumina Inc, San Diego, CA, USA) following the manufacturer’s protocols, after which they were sequenced on NovaSeq6000 (Illumina) with a read length of 2 × 51.

4.5. Statistical Analyses

4.5.1. Basic Statistics

Basic statistics were calculated using Statistica v.13.3 (Statsoft Inc, Tulsa, OK, USA) and presented as median (IQR) values. The paired sample Wilcoxon test was used when comparing dependent samples and the Kruskal–Wallis one-way analysis of variance by ranks was used when comparing independent groups. For categorical variables, Fisher’s exact test was used. In all comparisons, two-sided tests were used and considered statistically significant if p ≤ 0.05.

4.5.2. Differentially Expressed Genes

Analysis of DEGs was performed as previously described [56,57], using packages from the Bioconductor project; Rsubread v.2.0.1, edgeR v.3.28.1, limma v.3.42.2, in RStudio v.1.3.1073 [58] and R v.3.6.0. Genes without annotation were excluded, and only genes with expression > 2 counts per million (cpm) in at least nine samples (corresponding to the smallest study group) were retained. Sample differences and similarities were visualized using multidimensional scaling based on the top 500 genes with the largest variance between all samples and the Glimma package v.1.14.0 [59]. The duplicateCorrelation function in limma [60] was applied, before linear modeling with a Bayesian moderated t test, to assess significant differences from zero for each group contrast. Thus, no fold-change (FC) cut-off was used when establishing significant results. The p values were corrected for false discovery rate (FDR) according to Benjamini and Hochberg [61], and genes with corrected p values < 0.05 were considered to be significantly DEGs.

4.5.3. Pathway Analyses

Significant DEGs were investigated for their biological context by over-representation analysis using the R package ReactomePA v.1.3.0 [62]. DEGs were further explored for biological context by means of quantitative text analysis of functional protein information (we manually reviewed UniProtKB/Swiss-Prot database records) associated with the corresponding genes, as previously described by our group [45]. Further, ranked lists of all analyzed genes (in descending order) were computed for each pairwise group comparison by multiplying the direction (sign) of the fold change with the absolute value of the logarithm of the corresponding p value, thus generating lists with upregulated genes at the top and downregulated genes at the bottom. The ranked lists were used for gene set enrichment analysis (GSEA) of reactome [63] biological pathways using the GSEA software v.4.1.0 [64], with 10,000 gene set permutations and gene sets versions as of 1 July 2020. An FDR of 0.075 and an absolute normalized enrichment score > 2 were used as the cutoff point when results were visualized using EnrichmentMap v.3.3.1 [65] in Cytoscape v.3.8.0 [66], applying a Jaccard similarity cut off of 0.5. AutoAnnotate v.1.3.3 and clusterMaker v.1.3.1 with the Markov clustering algorithm [67] was used to identify and annotate clusters.

4.5.4. Deconvolution

The proportion of the various peripheral white blood cell types was predicted using RNA sequencing data, expressed as log2-transformed transcripts per million, and immunoStates deconvolution analysis in MetaIntegrator v.2.1.5 (kindly provided by Aditya Rao, Stanford University, Stanford, CA, USA) [68]. The resulting relative abundance of cell populations was investigated for differences between groups.

Supplementary Materials

The following supporting information can be downloaded at: https://www.mdpi.com/article/10.3390/ijms24065820/s1.

Author Contributions

All authors have made a significant contribution to the research described in this manuscript. Conceptualization: S.H. and S.A. Methodology: S.H. Investigation: S.H., J.S. and S.A. Formal analysis: S.H. and J.S. Data curation: S.H., J.S. and S.A. Interpretation of data: S.H., J.S. and S.A. Resources: S.A. Writing—original draft preparation: S.H. Writing—review and editing: S.H., J.S. and S.A. Project administration: S.H., J.S. and S.A. Funding acquisition: S.H. All authors revised and edited the manuscript for critical content and approved of the final version of the manuscript for publication. All authors have read and agreed to the published version of the manuscript.

Funding

This work was supported by grants from FUTURUM—the Academy for Health and Care, Region Jönköping County, Sweden.

Institutional Review Board Statement

The study was conducted according to the guidelines of the Declaration of Helsinki and approved by the Regional Ethical Review Board in Linköping, Sweden (2011/201-31) and at Karolinska University Hospital, Stockholm, Sweden (2012/1900-31/1), with an amendment for Karolinska University Hospital (2013/211-32), date of approval 30 April 2013, and protocol code 2014/277-32, date of approval 11 December 2014.

Informed Consent Statement

Written informed consent was obtained from all patients participating in the study.

Data Availability Statement

Research materials supporting this publication are not publicly available but may be accessed after reasonable motivation by contacting the corresponding author. The data are not publicly available due to regulation regarding information that potentially could identify and compromise the privacy of research participants.

Acknowledgments

Research nurses, Ingrid Ackzell RN, Lisa Zarouki RN and Karin Thourot RN at the Division of Gatroenterology and the Division of Endoscopy at Karolinska University Hospital, Sweden, are acknowledged for technical assistance and sample collection.

Conflicts of Interest

S.H. and J.S. declare no conflict of interest. S.A. is a member of the advisory board of both Janssen and Takeda, and is also a paid consultant of Janssen. The sponsors had no role in the design, execution, interpretation, or writing of the study.

Abbreviations

IBDinflammatory bowel disease
UCulcerative colitis
CDCrohn’s disease
VDZvedolizumab
sHBIsimplified Harvey Bradshaw index
SCCAISimple Clinical Colitis Activity Index
PGAphysician global assessment
DEGsdifferentially expressed genes
FCfold-change
FDRfalse discovery rate
ORAover-representation analysis
GSEAgene set enrichment analysis
NESnormalized enrichment score
CRPC-reactive protein
Hbhaemoglobin
Albalbumin

References

  1. Colombel, J.F.; Sandborn, W.J.; Reinisch, W.; Mantzaris, G.J.; Kornbluth, A.; Rachmilewitz, D.; Lichtiger, S.; D’Haens, G.; Diamond, R.H.; Broussard, D.L.; et al. Infliximab, azathioprine, or combination therapy for Crohn’s disease. N. Engl. J. Med. 2010, 362, 1383–1395. [Google Scholar] [CrossRef] [Green Version]
  2. Duijvestein, M.; Battat, R.; Vande Casteele, N.; D’Haens, G.R.; Sandborn, W.J.; Khanna, R.; Jairath, V.; Feagan, B.G. Novel Therapies and Treatment Strategies for Patients with Inflammatory Bowel Disease. Curr. Treat. Options Gastroenterol. 2018, 16, 129–146. [Google Scholar] [CrossRef] [PubMed]
  3. Gisbert, J.P.; Chaparro, M. Predictors of Primary Response to Biologic Treatment [Anti-TNF, Vedolizumab, and Ustekinumab] in Patients with Inflammatory Bowel Disease: From Basic Science to Clinical Practice. J. Crohns Colitis 2020, 14, 694–709. [Google Scholar] [CrossRef]
  4. Elhag, D.A.; Kumar, M.; Saadaoui, M.; Akobeng, A.K.; Al-Mudahka, F.; Elawad, M.; Al Khodor, S. Inflammatory Bowel Disease Treatments and Predictive Biomarkers of Therapeutic Response. Int. J. Mol. Sci. 2022, 23, 6966. [Google Scholar] [CrossRef] [PubMed]
  5. Habtezion, A.; Nguyen, L.P.; Hadeiba, H.; Butcher, E.C. Leukocyte Trafficking to the Small Intestine and Colon. Gastroenterology 2016, 150, 340–354. [Google Scholar] [CrossRef] [PubMed] [Green Version]
  6. Feagan, B.G.; Rutgeerts, P.; Sands, B.E.; Hanauer, S.; Colombel, J.F.; Sandborn, W.J.; Van Assche, G.; Axler, J.; Kim, H.J.; Danese, S.; et al. Vedolizumab as induction and maintenance therapy for ulcerative colitis. N. Engl. J. Med. 2013, 369, 699–710. [Google Scholar] [CrossRef] [Green Version]
  7. Sandborn, W.J.; Feagan, B.G.; Rutgeerts, P.; Hanauer, S.; Colombel, J.F.; Sands, B.E.; Lukas, M.; Fedorak, R.N.; Lee, S.; Bressler, B.; et al. Vedolizumab as induction and maintenance therapy for Crohn’s disease. N. Engl. J. Med. 2013, 369, 711–721. [Google Scholar] [CrossRef] [Green Version]
  8. Sands, B.E.; Sandborn, W.J.; Van Assche, G.; Lukas, M.; Xu, J.; James, A.; Abhyankar, B.; Lasch, K. Vedolizumab as Induction and Maintenance Therapy for Crohn’s Disease in Patients Naive to or Who Have Failed Tumor Necrosis Factor Antagonist Therapy. Inflamm. Bowel Dis. 2017, 23, 97–106. [Google Scholar] [CrossRef] [Green Version]
  9. Gisbert, J.P.; Chaparro, M. Primary Failure to an Anti-TNF Agent in Inflammatory Bowel Disease: Switch (to a Second Anti-TNF Agent) or Swap (for Another Mechanism of Action)? J. Clin. Med. 2021, 10, 5318. [Google Scholar] [CrossRef] [PubMed]
  10. Arijs, I.; De Hertogh, G.; Lemmens, B.; Van Lommel, L.; de Bruyn, M.; Vanhove, W.; Cleynen, I.; Machiels, K.; Ferrante, M.; Schuit, F.; et al. Effect of vedolizumab (anti-alpha4beta7-integrin) therapy on histological healing and mucosal gene expression in patients with UC. Gut 2018, 67, 43–52. [Google Scholar] [CrossRef] [Green Version]
  11. Zeissig, S.; Rosati, E.; Dowds, C.M.; Aden, K.; Bethge, J.; Schulte, B.; Pan, W.H.; Mishra, N.; Zuhayra, M.; Marx, M.; et al. Vedolizumab is associated with changes in innate rather than adaptive immunity in patients with inflammatory bowel disease. Gut 2019, 68, 25–39. [Google Scholar] [CrossRef] [PubMed]
  12. Rath, T.; Billmeier, U.; Ferrazzi, F.; Vieth, M.; Ekici, A.; Neurath, M.F.; Atreya, R. Effects of Anti-Integrin Treatment with Vedolizumab on Immune Pathways and Cytokines in Inflammatory Bowel Diseases. Front. Immunol. 2018, 9, 1700. [Google Scholar] [CrossRef] [Green Version]
  13. Boden, E.K.; Shows, D.M.; Chiorean, M.V.; Lord, J.D. Identification of Candidate Biomarkers Associated with Response to Vedolizumab in Inflammatory Bowel Disease. Dig. Dis. Sci. 2018, 63, 2419–2429. [Google Scholar] [CrossRef]
  14. Ungar, B.; Kopylov, U.; Yavzori, M.; Fudim, E.; Picard, O.; Lahat, A.; Coscas, D.; Waterman, M.; Haj-Natour, O.; Orbach-Zingboim, N.; et al. Association of Vedolizumab Level, Anti-Drug Antibodies, and alpha4beta7 Occupancy with Response in Patients With Inflammatory Bowel Diseases. Clin. Gastroenterol. Hepatol. 2018, 16, 697–705.e7. [Google Scholar] [CrossRef] [PubMed] [Green Version]
  15. Schneider, I.; Allner, C.; Muhl, L.; Melde, M.; Lissner, D.; Mantzivi, E.; Glauben, R.; Vitali, F.; Becker, E.; Atreya, I.; et al. Expression and function of alpha4beta7 integrin predict the success of vedolizumab treatment in inflammatory bowel disease. Transl. Res. 2022, 253, 8–15. [Google Scholar] [CrossRef]
  16. Zwicker, S.; Lira-Junior, R.; Hoog, C.; Almer, S.; Bostrom, E.A. Systemic Chemokine Levels with “Gut-Specific” Vedolizumab in Patients with Inflammatory Bowel Disease-A Pilot Study. Int. J. Mol. Sci. 2017, 18, 1827. [Google Scholar] [CrossRef] [Green Version]
  17. Soendergaard, C.; Seidelin, J.B.; Steenholdt, C.; Nielsen, O.H. Putative biomarkers of vedolizumab resistance and underlying inflammatory pathways involved in IBD. BMJ Open Gastroenterol. 2018, 5, e000208. [Google Scholar] [CrossRef] [PubMed] [Green Version]
  18. Juzenas, S.; Hubenthal, M.; Lindqvist, C.M.; Kruse, R.; Steiert, T.A.; Degenhardt, F.; Schulte, D.; Nikolaus, S.; Zeissig, S.; Bergemalm, D.; et al. Detailed Transcriptional Landscape of Peripheral Blood Points to Increased Neutrophil Activation in Treatment-Naive Inflammatory Bowel Disease. J. Crohns Colitis 2022, 16, 1097–1109. [Google Scholar] [CrossRef] [PubMed]
  19. Burakoff, R.; Chao, S.; Perencevich, M.; Ying, J.; Friedman, S.; Makrauer, F.; Odze, R.; Khurana, H.; Liew, C.C. Blood-based biomarkers can differentiate ulcerative colitis from Crohn’s disease and noninflammatory diarrhea. Inflamm. Bowel Dis. 2011, 17, 1719–1725. [Google Scholar] [CrossRef]
  20. Shi, W.; Ye, Z.; Zhuang, L.; Li, Y.; Shuai, W.; Zuo, Z.; Mao, X.; Liu, R.; Wu, J.; Chen, S.; et al. Olfactomedin 1 negatively regulates NF-kappaB signalling and suppresses the growth and metastasis of colorectal cancer cells. J. Pathol. 2016, 240, 352–365. [Google Scholar] [CrossRef] [Green Version]
  21. Lovisa, S.; Genovese, G.; Danese, S. Role of Epithelial-to-Mesenchymal Transition in Inflammatory Bowel Disease. J. Crohns Colitis 2019, 13, 659–668. [Google Scholar] [CrossRef]
  22. Wang, C.Y.; Babitt, J.L. Hepcidin regulation in the anemia of inflammation. Curr. Opin. Hematol. 2016, 23, 189–197. [Google Scholar] [CrossRef] [PubMed]
  23. Chen, K.; Zhang, Y.; Qian, L.; Wang, P. Emerging strategies to target RAS signaling in human cancer therapy. J. Hematol. Oncol. 2021, 14, 116. [Google Scholar] [CrossRef]
  24. Shi, Y.; Suh, Y.H.; Milstein, A.D.; Isozaki, K.; Schmid, S.M.; Roche, K.W.; Nicoll, R.A. Functional comparison of the effects of TARPs and cornichons on AMPA receptor trafficking and gating. Proc. Natl. Acad. Sci. USA 2010, 107, 16315–16319. [Google Scholar] [CrossRef] [Green Version]
  25. Bunker, R.D.; Bulloch, E.M.; Dickson, J.M.; Loomes, K.M.; Baker, E.N. Structure and function of human xylulokinase, an enzyme with important roles in carbohydrate metabolism. J. Biol. Chem. 2013, 288, 1643–1652. [Google Scholar] [CrossRef] [PubMed] [Green Version]
  26. Verstockt, B.; Verstockt, S.; Veny, M.; Dehairs, J.; Arnauts, K.; Van Assche, G.; De Hertogh, G.; Vermeire, S.; Salas, A.; Ferrante, M. Expression Levels of 4 Genes in Colon Tissue Might Be Used to Predict Which Patients Will Enter Endoscopic Remission After Vedolizumab Therapy for Inflammatory Bowel Diseases. Clin. Gastroenterol. Hepatol. 2020, 18, 1142–1151.e10. [Google Scholar] [CrossRef] [PubMed] [Green Version]
  27. Feagan, B.G.; Greenberg, G.R.; Wild, G.; Fedorak, R.N.; Pare, P.; McDonald, J.W.; Cohen, A.; Bitton, A.; Baker, J.; Dube, R.; et al. Treatment of active Crohn’s disease with MLN0002, a humanized antibody to the alpha4beta7 integrin. Clin. Gastroenterol. Hepatol. 2008, 6, 1370–1377. [Google Scholar] [CrossRef]
  28. Feagan, B.G.; Greenberg, G.R.; Wild, G.; Fedorak, R.N.; Pare, P.; McDonald, J.W.; Dube, R.; Cohen, A.; Steinhart, A.H.; Landau, S.; et al. Treatment of ulcerative colitis with a humanized antibody to the alpha4beta7 integrin. N. Engl. J. Med. 2005, 352, 2499–2507. [Google Scholar] [CrossRef]
  29. Xiong, E.; Li, Y.; Min, Q.; Cui, C.; Liu, J.; Hong, R.; Lai, N.; Wang, Y.; Sun, J.; Matsumoto, R.; et al. MZB1 promotes the secretion of J-chain-containing dimeric IgA and is critical for the suppression of gut inflammation. Proc. Natl. Acad. Sci. USA 2019, 116, 13480–13489. [Google Scholar] [CrossRef] [PubMed] [Green Version]
  30. Soler, D.; Chapman, T.; Yang, L.L.; Wyant, T.; Egan, R.; Fedyk, E.R. The binding specificity and selective antagonism of vedolizumab, an anti-alpha4beta7 integrin therapeutic antibody in development for inflammatory bowel diseases. J. Pharmacol. Exp. Ther. 2009, 330, 864–875. [Google Scholar] [CrossRef] [Green Version]
  31. Postigo, A.A.; Sanchez-Mateos, P.; Lazarovits, A.I.; Sanchez-Madrid, F.; de Landazuri, M.O. Alpha 4 beta 7 integrin mediates B cell binding to fibronectin and vascular cell adhesion molecule-1. Expression and function of alpha 4 integrins on human B lymphocytes. J. Immunol. 1993, 151, 2471–2483. [Google Scholar] [CrossRef] [PubMed]
  32. Uzzan, M.; Tokuyama, M.; Rosenstein, A.K.; Tomescu, C.; SahBandar, I.N.; Ko, H.M.; Leyre, L.; Chokola, A.; Kaplan-Lewis, E.; Rodriguez, G.; et al. Anti-alpha4beta7 therapy targets lymphoid aggregates in the gastrointestinal tract of HIV-1-infected individuals. Sci. Transl. Med. 2018, 10, eaau4711. [Google Scholar] [CrossRef] [PubMed] [Green Version]
  33. Tyler, C.J.; Guzman, M.; Lundborg, L.R.; Yeasmin, S.; Zgajnar, N.; Jedlicka, P.; Bamias, G.; Rivera-Nieves, J. Antibody secreting cells are critically dependent on integrin alpha4beta7/MAdCAM-1 for intestinal recruitment and control of the microbiota during chronic colitis. Mucosal. Immunol. 2022, 15, 109–119. [Google Scholar] [CrossRef] [PubMed]
  34. Abraham, C.; Abreu, M.T.; Turner, J.R. Pattern Recognition Receptor Signaling and Cytokine Networks in Microbial Defenses and Regulation of Intestinal Barriers: Implications for Inflammatory Bowel Disease. Gastroenterology 2022, 162, 1602–1616.e6. [Google Scholar] [CrossRef]
  35. Alzoghaibi, M.A. Concepts of oxidative stress and antioxidant defense in Crohn’s disease. World J. Gastroenterol. 2013, 19, 6540–6547. [Google Scholar] [CrossRef] [PubMed]
  36. Pereira, C.; Gracio, D.; Teixeira, J.P.; Magro, F. Oxidative Stress and DNA Damage: Implications in Inflammatory Bowel Disease. Inflamm. Bowel Dis. 2015, 21, 2403–2417. [Google Scholar] [CrossRef]
  37. Schippers, A.; Muschaweck, M.; Clahsen, T.; Tautorat, S.; Grieb, L.; Tenbrock, K.; Gassler, N.; Wagner, N. beta7-Integrin exacerbates experimental DSS-induced colitis in mice by directing inflammatory monocytes into the colon. Mucosal Immunol. 2016, 9, 527–538. [Google Scholar] [CrossRef] [Green Version]
  38. Schleier, L.; Wiendl, M.; Heidbreder, K.; Binder, M.T.; Atreya, R.; Rath, T.; Becker, E.; Schulz-Kuhnt, A.; Stahl, A.; Schulze, L.L.; et al. Non-classical monocyte homing to the gut via alpha4beta7 integrin mediates macrophage-dependent intestinal wound healing. Gut 2020, 69, 252–263. [Google Scholar] [CrossRef]
  39. Keir, M.E.; Fuh, F.; Ichikawa, R.; Acres, M.; Hackney, J.A.; Hulme, G.; Carey, C.D.; Palmer, J.; Jones, C.J.; Long, A.K.; et al. Regulation and Role of alphaE Integrin and Gut Homing Integrins in Migration and Retention of Intestinal Lymphocytes during Inflammatory Bowel Disease. J. Immunol. 2021, 207, 2245–2254. [Google Scholar] [CrossRef]
  40. Dai, B.; Hackney, J.A.; Ichikawa, R.; Nguyen, A.; Elstrott, J.; Orozco, L.D.; Sun, K.H.; Modrusan, Z.; Gogineni, A.; Scherl, A.; et al. Dual targeting of lymphocyte homing and retention through alpha4beta7 and alphaEbeta7 inhibition in inflammatory bowel disease. Cell Rep. Med. 2021, 2, 100381. [Google Scholar] [CrossRef] [PubMed]
  41. Novak, E.A.; Mollen, K.P. Mitochondrial dysfunction in inflammatory bowel disease. Front. Cell Dev. Biol. 2015, 3, 62. [Google Scholar] [CrossRef] [Green Version]
  42. Wang, W.; Nag, S.; Zhang, X.; Wang, M.H.; Wang, H.; Zhou, J.; Zhang, R. Ribosomal proteins and human diseases: Pathogenesis, molecular mechanisms, and therapeutic implications. Med. Res. Rev. 2015, 35, 225–285. [Google Scholar] [CrossRef] [PubMed] [Green Version]
  43. Grummt, I. The nucleolus-guardian of cellular homeostasis and genome integrity. Chromosoma 2013, 122, 487–497. [Google Scholar] [CrossRef]
  44. Houten, S.M.; Wanders, R.J.A.; Ranea-Robles, P. Metabolic interactions between peroxisomes and mitochondria with a special focus on acylcarnitine metabolism. Biochim. Biophys. Acta Mol. Basis Dis. 2020, 1866, 165720. [Google Scholar] [CrossRef]
  45. Soderman, J.; Berglind, L.; Almer, S. Inverse and Concordant Mucosal Pathway Gene Expressions in Inflamed and Non-Inflamed Ulcerative Colitis Patients: Potential Relevance to Aetiology and Pathogenesis. Int. J. Mol. Sci. 2022, 23, 6944. [Google Scholar] [CrossRef]
  46. Murdoch, T.; O’Donnell, S.; Silverberg, M.S.; Panaccione, R. Biomarkers as potential treatment targets in inflammatory bowel disease: A systematic review. Can. J. Gastroenterol. Hepatol. 2015, 29, 203–208. [Google Scholar] [CrossRef] [PubMed] [Green Version]
  47. Ma, C.; Battat, R.; Parker, C.E.; Khanna, R.; Jairath, V.; Feagan, B.G. Update on C-reactive protein and fecal calprotectin: Are they accurate measures of disease activity in Crohn’s disease? Expert Rev. Gastroenterol. Hepatol. 2019, 13, 319–330. [Google Scholar] [CrossRef] [PubMed]
  48. Arijs, I.; Li, K.; Toedter, G.; Quintens, R.; Van Lommel, L.; Van Steen, K.; Leemans, P.; De Hertogh, G.; Lemaire, K.; Ferrante, M.; et al. Mucosal gene signatures to predict response to infliximab in patients with ulcerative colitis. Gut 2009, 58, 1612–1619. [Google Scholar] [CrossRef] [PubMed] [Green Version]
  49. Poplawski, A.; Binder, H. Feasibility of sample size calculation for RNA-seq studies. Brief. Bioinform. 2018, 19, 713–720. [Google Scholar] [CrossRef]
  50. Lee, J.C.; Lyons, P.A.; McKinney, E.F.; Sowerby, J.M.; Carr, E.J.; Bredin, F.; Rickman, H.M.; Ratlamwala, H.; Hatton, A.; Rayner, T.F.; et al. Gene expression profiling of CD8+ T cells predicts prognosis in patients with Crohn disease and ulcerative colitis. J. Clin. Investig. 2011, 121, 4170–4179. [Google Scholar] [CrossRef] [Green Version]
  51. Schurch, N.J.; Schofield, P.; Gierlinski, M.; Cole, C.; Sherstnev, A.; Singh, V.; Wrobel, N.; Gharbi, K.; Simpson, G.G.; Owen-Hughes, T.; et al. How many biological replicates are needed in an RNA-seq experiment and which differential expression tool should you use? RNA 2016, 22, 839–851. [Google Scholar] [CrossRef] [PubMed] [Green Version]
  52. Bi, R.; Liu, P. Sample size calculation while controlling false discovery rate for differential expression analysis with RNA-sequencing experiments. BMC Bioinform. 2016, 17, 146. [Google Scholar] [CrossRef] [PubMed] [Green Version]
  53. Harvey, R.F.; Bradshaw, J.M. A simple index of Crohn’s-disease activity. Lancet 1980, 1, 514. [Google Scholar] [CrossRef]
  54. Walmsley, R.S.; Ayres, R.C.; Pounder, R.E.; Allan, R.N. A simple clinical colitis activity index. Gut 1998, 43, 29–32. [Google Scholar] [CrossRef] [PubMed] [Green Version]
  55. Allegretti, J.R.; Barnes, E.L.; Stevens, B.; Storm, M.; Ananthakrishnan, A.; Yajnik, V.; Korzenik, J. Predictors of Clinical Response and Remission at 1 Year Among a Multicenter Cohort of Patients with Inflammatory Bowel Disease Treated with Vedolizumab. Dig. Dis. Sci. 2017, 62, 1590–1596. [Google Scholar] [CrossRef] [PubMed]
  56. Bragde, H.G.; Jansson, U.; Fredrikson, M.; Grodzinsky, E.; Soderman, J. Characterisation of gene and pathway expression in stabilised blood from children with coeliac disease. BMJ Open Gastroenterol. 2020, 7, e000536. [Google Scholar] [CrossRef]
  57. Law, C.W.; Alhamdoosh, M.; Su, S.; Dong, X.; Tian, L.; Smyth, G.K.; Ritchie, M.E. RNA-seq analysis is easy as 1-2-3 with limma, Glimma and edgeR. F1000Res 2016, 5, J-1408. [Google Scholar] [CrossRef] [Green Version]
  58. RStudioTeam. RStudio: Integrated Development Environment for R; RStudio, PBC: Boston, MA, USA, 2020; Available online: http://www.rstudio.com/ (accessed on 1 November 2022).
  59. Su, S.; Law, C.W.; Ah-Cann, C.; Asselin-Labat, M.L.; Blewitt, M.E.; Ritchie, M.E. Glimma: Interactive graphics for gene expression analysis. Bioinformatics 2017, 33, 2050–2052. [Google Scholar] [CrossRef] [PubMed] [Green Version]
  60. Ritchie, M.E.; Phipson, B.; Wu, D.; Hu, Y.; Law, C.W.; Shi, W.; Smyth, G.K. Limma powers differential expression analyses for RNA-sequencing and microarray studies. Nucleic Acids Res. 2015, 43, e47. [Google Scholar] [CrossRef]
  61. Benjamini, Y.; Hochberg, Y. Controlling the False Discovery Rate: A Practical and Powerful Approach to Multiple Testing. J. R. Stat. Soc. Ser. B Methodol. 1995, 57, 289–300. [Google Scholar] [CrossRef]
  62. Yu, G.; He, Q.Y. ReactomePA: An R/Bioconductor package for reactome pathway analysis and visualization. Mol. Biosyst. 2016, 12, 477–479. [Google Scholar] [CrossRef]
  63. Jassal, B.; Matthews, L.; Viteri, G.; Gong, C.; Lorente, P.; Fabregat, A.; Sidiropoulos, K.; Cook, J.; Gillespie, M.; Haw, R.; et al. The reactome pathway knowledgebase. Nucleic Acids Res. 2020, 48, D498–D503. [Google Scholar] [CrossRef] [PubMed]
  64. Subramanian, A.; Tamayo, P.; Mootha, V.K.; Mukherjee, S.; Ebert, B.L.; Gillette, M.A.; Paulovich, A.; Pomeroy, S.L.; Golub, T.R.; Lander, E.S.; et al. Gene set enrichment analysis: A knowledge-based approach for interpreting genome-wide expression profiles. Proc. Natl. Acad. Sci. USA 2005, 102, 15545–15550. [Google Scholar] [CrossRef] [PubMed] [Green Version]
  65. Merico, D.; Isserlin, R.; Stueker, O.; Emili, A.; Bader, G.D. Enrichment map: A network-based method for gene-set enrichment visualization and interpretation. PLoS ONE 2010, 5, e13984. [Google Scholar] [CrossRef] [Green Version]
  66. Shannon, P.; Markiel, A.; Ozier, O.; Baliga, N.S.; Wang, J.T.; Ramage, D.; Amin, N.; Schwikowski, B.; Ideker, T. Cytoscape: A software environment for integrated models of biomolecular interaction networks. Genome Res. 2003, 13, 2498–2504. [Google Scholar] [CrossRef]
  67. Morris, J.H.; Apeltsin, L.; Newman, A.M.; Baumbach, J.; Wittkop, T.; Su, G.; Bader, G.D.; Ferrin, T.E. clusterMaker: A multi-algorithm clustering plugin for Cytoscape. BMC Bioinform. 2011, 12, 436. [Google Scholar] [CrossRef] [PubMed] [Green Version]
  68. Vallania, F.; Tam, A.; Lofgren, S.; Schaffert, S.; Azad, T.D.; Bongen, E.; Haynes, W.; Alsup, M.; Alonso, M.; Davis, M.; et al. Leveraging heterogeneity across multiple datasets increases cell-mixture deconvolution accuracy and reduces biological and technical biases. Nat. Commun. 2018, 9, 4735. [Google Scholar]
Figure 1. In responders (n = 9), 201 genes were regulated following treatment with vedolizumab compared with baseline. The 10 most significant differentially expressed genes are annotated. indicates FDR < 0.05 and absolute value of FC > 2; FDR < 0.05 and absolute value of FC < 2; x FDR > 0.05 and absolute value of FC > 2, ° FDR > 0.05 and FC < 2; FDR: false discovery rate-adjusted p value; FC: fold change.
Ijms 24 05820 g001
Figure 2. The top 15 keyness words describing a preferential association of unigrams, with either upregulated (red bars) or downregulated (blue-green bars) genes in responders when comparing follow-up samples of vedolizumab treatment with baseline. Keyness words were based on the textual analysis of functional protein information (UniProtKB) associated with the differentially expressed genes. The chi2 value on the x-axis is the test statistic obtained from Chi-square test used to calculate keyness.
Ijms 24 05820 g002
Figure 3. Visualization of common contexts of the enriched reactome pathways based on the statistical comparison of transcriptional profiles between responders (n = 9) and non-responders (n = 11) at baseline (T0). The enrichment map shows pathways with a normalized absolute value of the enrichment score ≥ 2 and/or interacting with other pathways. Red; pathways upregulated in responders, Blue; pathways downregulated responders. Darker colour represents a more positive (red) or negative (blue) score.
Ijms 24 05820 g003
Figure 4. Visualization of common contexts of the enriched reactome pathways based on the statistical comparison of transcriptional profiles between responders (n = 9) and non-responders (n = 11) at the time of follow-up (T1). Pathways with a normalized absolute value of the enrichment score ≥ 2 and/or interacting with another pathway are shown. Red: pathways upregulated in responders; Blue: pathways downregulated in responders. Darker colour represents a more positive (red) or negative (blue) score.
Ijms 24 05820 g004
Figure 5. Illustration of common contexts of enriched reactome pathways based on the statistical comparisons between transcriptional profiles at the time of follow-up with VDZ (T1) and baseline (T0) in responders (n = 9) and non-responders (n = 11), respectively. The enrichment map shows pathways with an absolute normalized enrichment score ≥ 2 and/or interacting with more than two other pathways. Darker colour represents a more positive (red) or negative (blue) score. Each node is divided into two halves, in which the left half represents T1 vs. T0 in responders and the right half represents T1 vs. T0 in non-responders. Nodes associated with the transcriptional dynamics in responders and non-responders are encircled in red and blue, respectively (for further details see Table S4; Sheets 3–5).
Ijms 24 05820 g005
Table 1. Patient characteristics at baseline (T0) and following vedolizumab (T1), n = 24 (9 UC, 15 CD).
Responders (n = 13)p-Value T0-T1Non-Responders (n = 11)p-Value T0–T1p-Value at T0 or T1
Disease UC/CD 6/7 3/8 0.42
Gender (female/male) 4/9 3/8 1.00
Age (years) 30.2 (16.6) 37.6 (30.2) 0.28
Disease duration (years) 10.2 (13.5) 16.3 (15.2) 0.26
Days since last anti-TNF-α drug 77 (1593) 99 (763) 0.98
Duration last anti-TNF-α drug (days) 202 (356) 267 (903) 0.10
Disease activity UCT011 (3) 10 (5) 0.52
T16 (6)0.028 (9)1.000.52
6 months 3 (4)0.098 (15)0.791.00
Disease activity CDT010 (5) 7 (5) 0.14
T14 (4)0.038 (6)0.550.28
6 months §6 (3)0.076 (9)0.110.91
Clinical remissionT01 2 0.57
T14 2 0.65
PGAT02 (0) 2 (0) 0.69
T11 (1)0.042 (1)0.111.00
f-Calprotectin (mg/kg feces)T0 1390 (2112) 549.5 (877) 0.11
T1 ††191 (1417)0.06266 (269)0.580.96
s-CRP (mg/L)T09.0 (21.0) 3.0 (5.0) 0.02
T113.0 (14.0)0.233.0 (1.0)0.830.01
b-Leukocyte count (×109/L)T09.2 (4.1) 9.2 (4.0) 0.86
T1 ‡‡8.35 (3.0)0.167.8 (3.4)0.320.98
b-Hb (g/L)T0130 (17) 133 (22) 0.57
T1 §§125 (25)0.39140 (25)0.790.35
s-Alb (g/L)T035 (6) 37 (6) 0.57
T135 (1)0.4836 (4)0.620.46
Dose VDZ (mg/kg body weight)
4.1 (0.47) 3.9 (1.2) 0.65
p-VDZ at follow-up (T1) (µg/mL) 10.5 (9.9) 16.2 (8.1) 0.19
Data presented as median (IQR). UC: ulcerative colitis; CD: Crohn’s disease; s: serum; p: plasma; f: fecal. Disease activity: Simple Clinical Colitis Activity Index (SCCAI) for UC and Simplified Harvey Bradshaw index for CD (sHBI). Clinical remission was defined as sHBI ≤ 4 or SSCAI ≤ 2. PGA: Physician global assessment; CRP: C-reactive protein; Hb: hemoglobin; Alb: albumin; VDZ: vedolizumab. T0: baseline before vedolizumab infusion. T1: follow-up after 10–12 weeks with vedolizumab. data missing in one responder. comparison with T1, data available in six responders and three non-responders still on VDZ. § comparison with T1, data available in four responders and five non-responders still on VDZ. data missing in four responders and one non-responder. †† data missing in five responders and in one non-responder. ‡‡, §§ data missing in one responder.
Table 2. The number of enriched biological pathways, with a false discovery rate adjusted p value < 0.075, in the gene set enrichment analysis based on all pairwise statistical comparisons.
Pathway EnrichmentReactome
UpDown
T0 Responders vs. Non-responders27946
T1 Responders vs. Non-responders337
Responders T1 vs. T051221
Non-responders T1 vs. T01193
T0; baseline before initiating vedolizumab. T1; follow up after 10–12 weeks of vedolizumab.
Table 3. The most enriched reactome pathways with an absolute NES > 2 in the comparison between transcriptional profiles in responders (n = 9) and non-responders (n = 11) at baseline.
Pathways Upregulated in RespondersSizeNESFDR p-Value
Amino acid transport across the plasma membrane192.302.44 × 10−4
Regulation of actin dynamics for phagocytic cup formation612.278.12 × 10−5
FCGR3A-mediated phagocytosis582.274.87 × 10−5
Glycosaminoglucan metabolism702.183.65 × 10−4
EPH-Ephrin signaling662.138.33 × 10−4
Pathways Downregulated in Responders
Mitochondrial translation initiation82−2.41<1.00 × 10⁻⁵
Mitochondrial translation termination82−2.40<1.00 × 10⁻⁵
Mitochondrial translation88−2.40<1.00 × 10⁻⁵
tRNA processing93−2.263.10 × 10−5
rRNA processing in the nucleus and cytosol1712.05<1.00 × 10⁻⁵
FDR: false discovery rate; NES: normalized enrichment score.
Table 4. The most enriched reactome pathways with an absolute NES ≥ 2 in the comparison between transcriptional profiles in responders (n = 9) and non-responders (n = 11) at follow-up with vedolizumab.
Pathways Upregulated in RespondersSizeNESFDR p-Value
L13-mediated translational silencing of ceruloplasmin expression1072.282.67 × 10−4
GTP hydrolysis and joining of the 60S ribosomal subunit1082.262.26 × 10−4
Eukaryotic translation elongation872.252.42 × 10−4
Peptide chain elongation852.242.04 × 10−4
Viral mRNA translation852.212.35 × 10−4
Pathways Downregulated in Responders
Interferon alpha beta signaling49−2.111.03 × 10−2
Antigen processing cross-presentation94−1.985.31 × 10−2
Interferon gamma signaling75−1.974.15 × 10−2
ADP signaling through P2Y purinoceptor14−1.907.14 × 10−2
ER-phagosome pathway80−1.897.01 × 10−2
FDR; false discovery rate, NES; normalized enrichment score.
Disclaimer/Publisher’s Note: The statements, opinions and data contained in all publications are solely those of the individual author(s) and contributor(s) and not of MDPI and/or the editor(s). MDPI and/or the editor(s) disclaim responsibility for any injury to people or property resulting from any ideas, methods, instructions or products referred to in the content.

