
A Comprehensive Investigation into the Crystallology, Molecule, and Quantum Chemistry Properties of Two New Hydrous Long-Chain Dibasic Ammonium Salts CnH2n+8N2O6 (n = 35 and 37)
Abstract
:1. Introduction
2. Results and Discussions
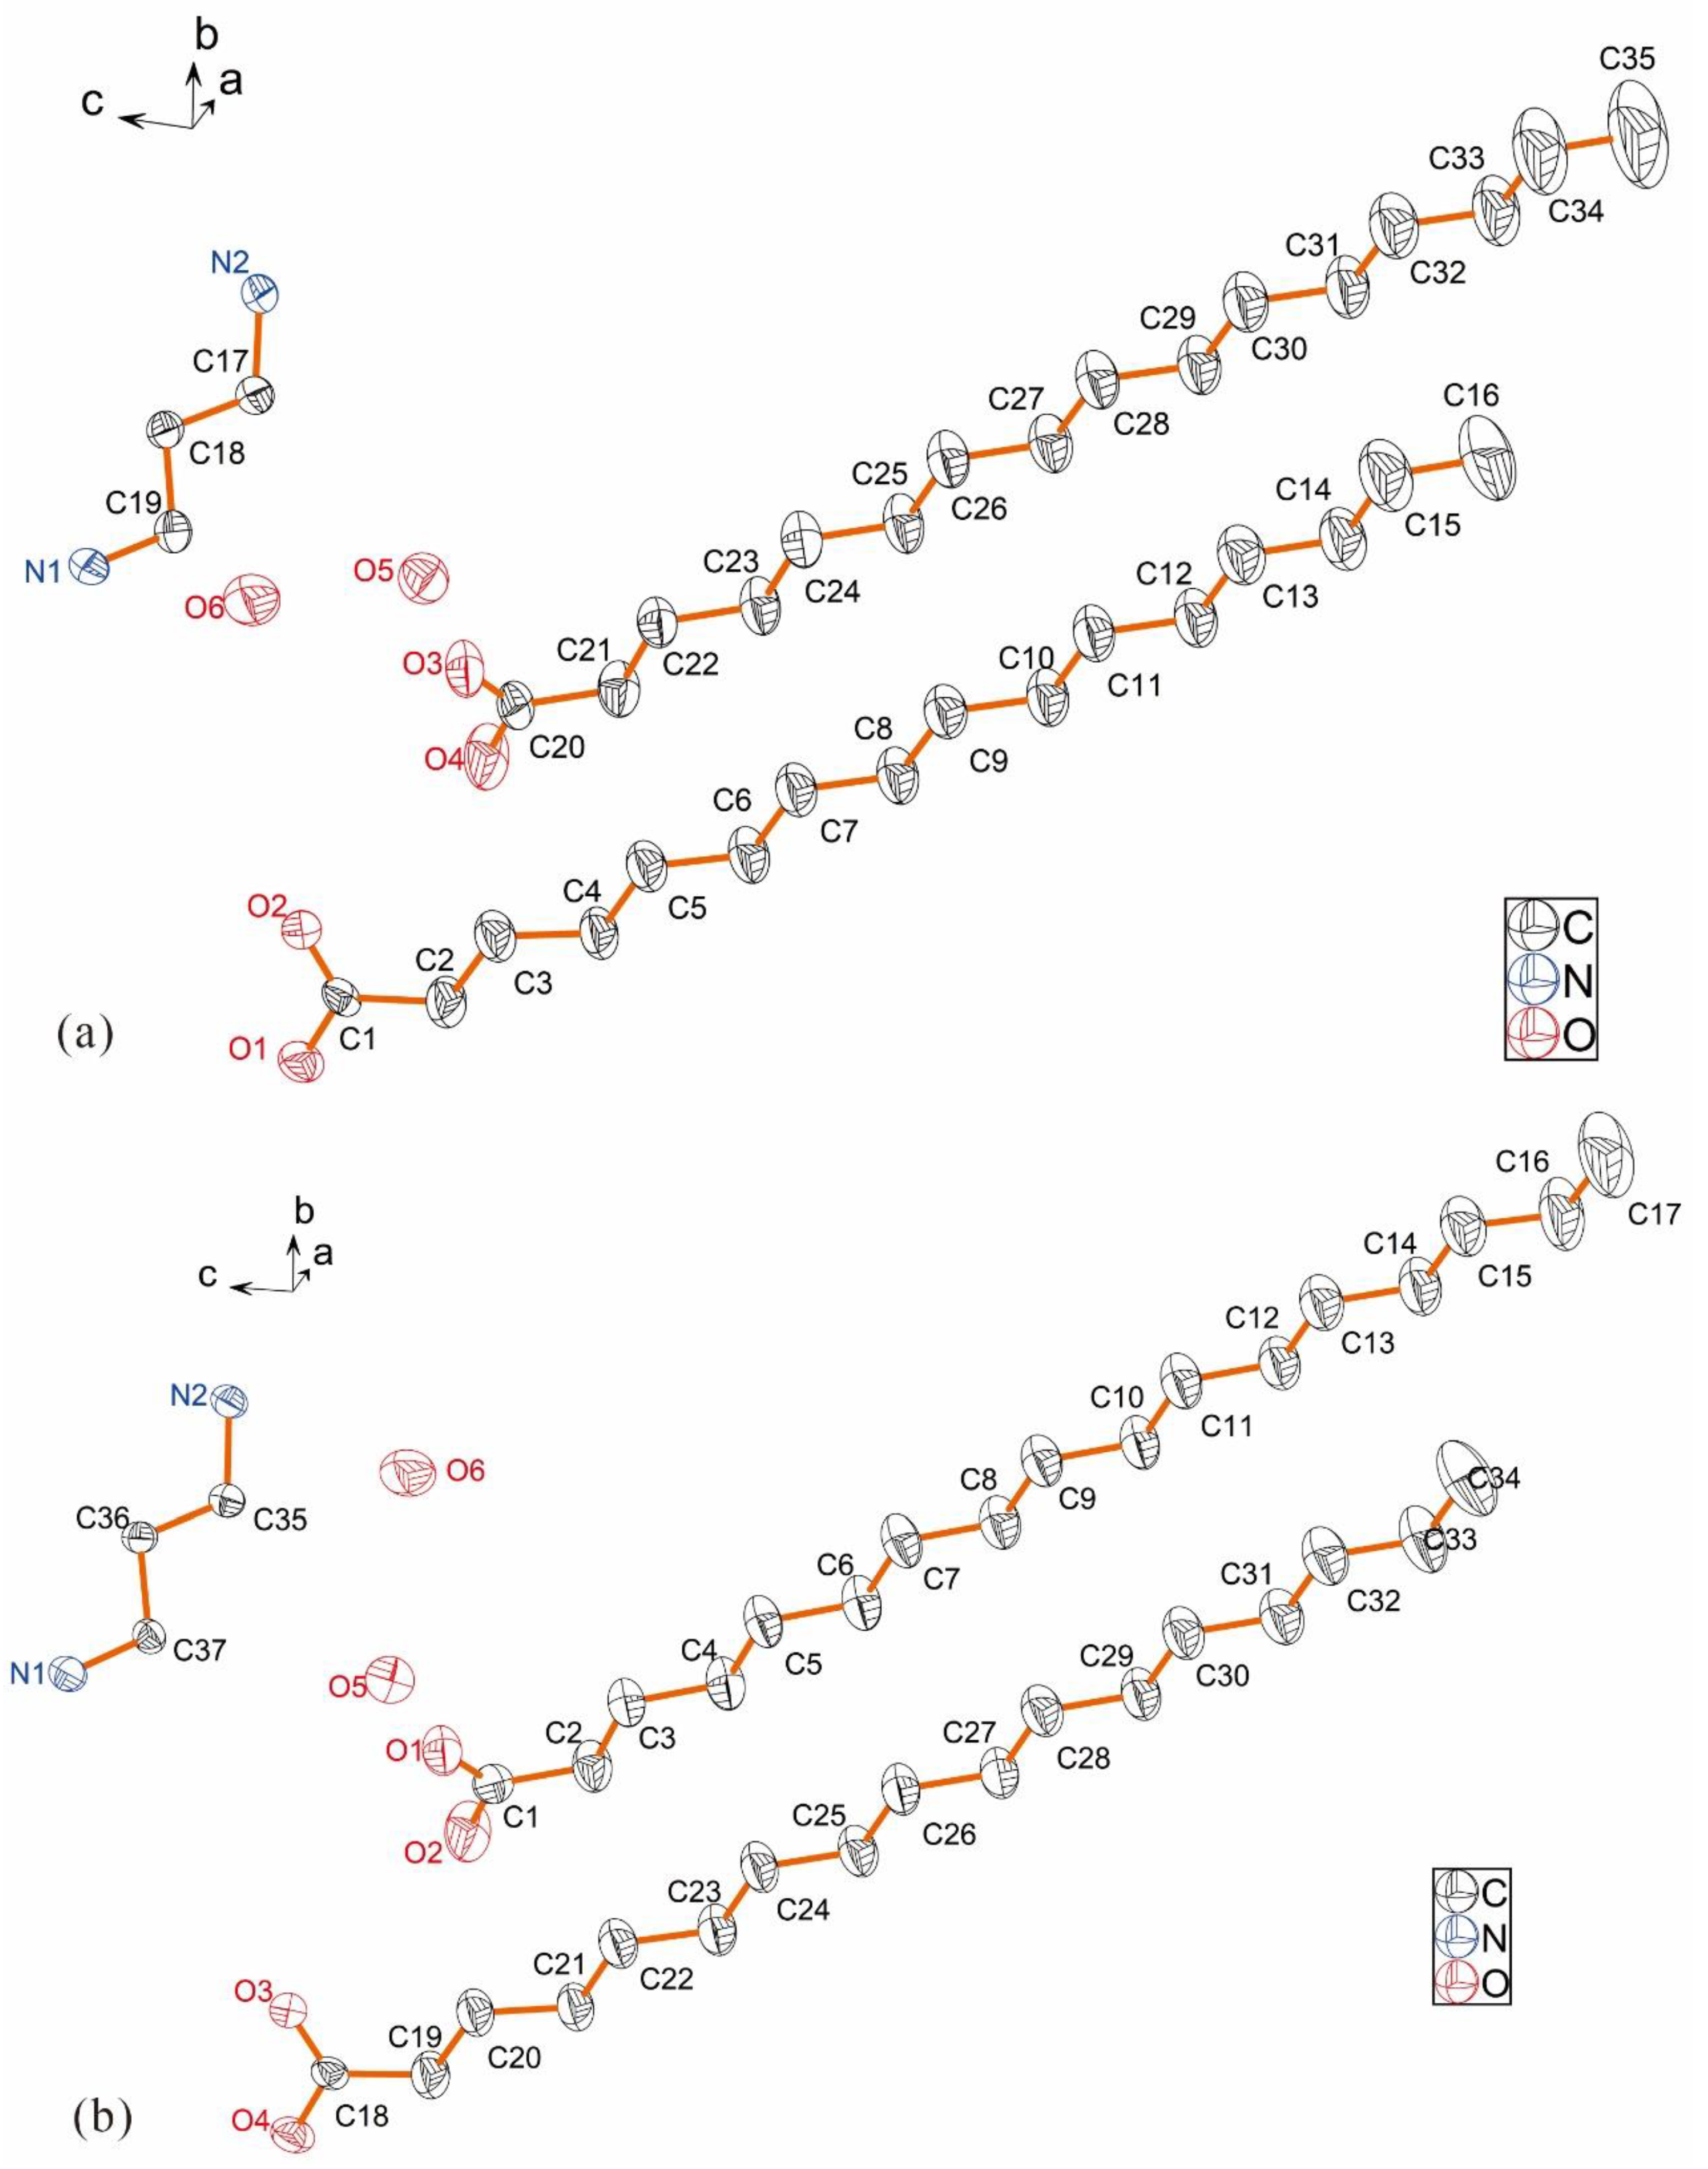
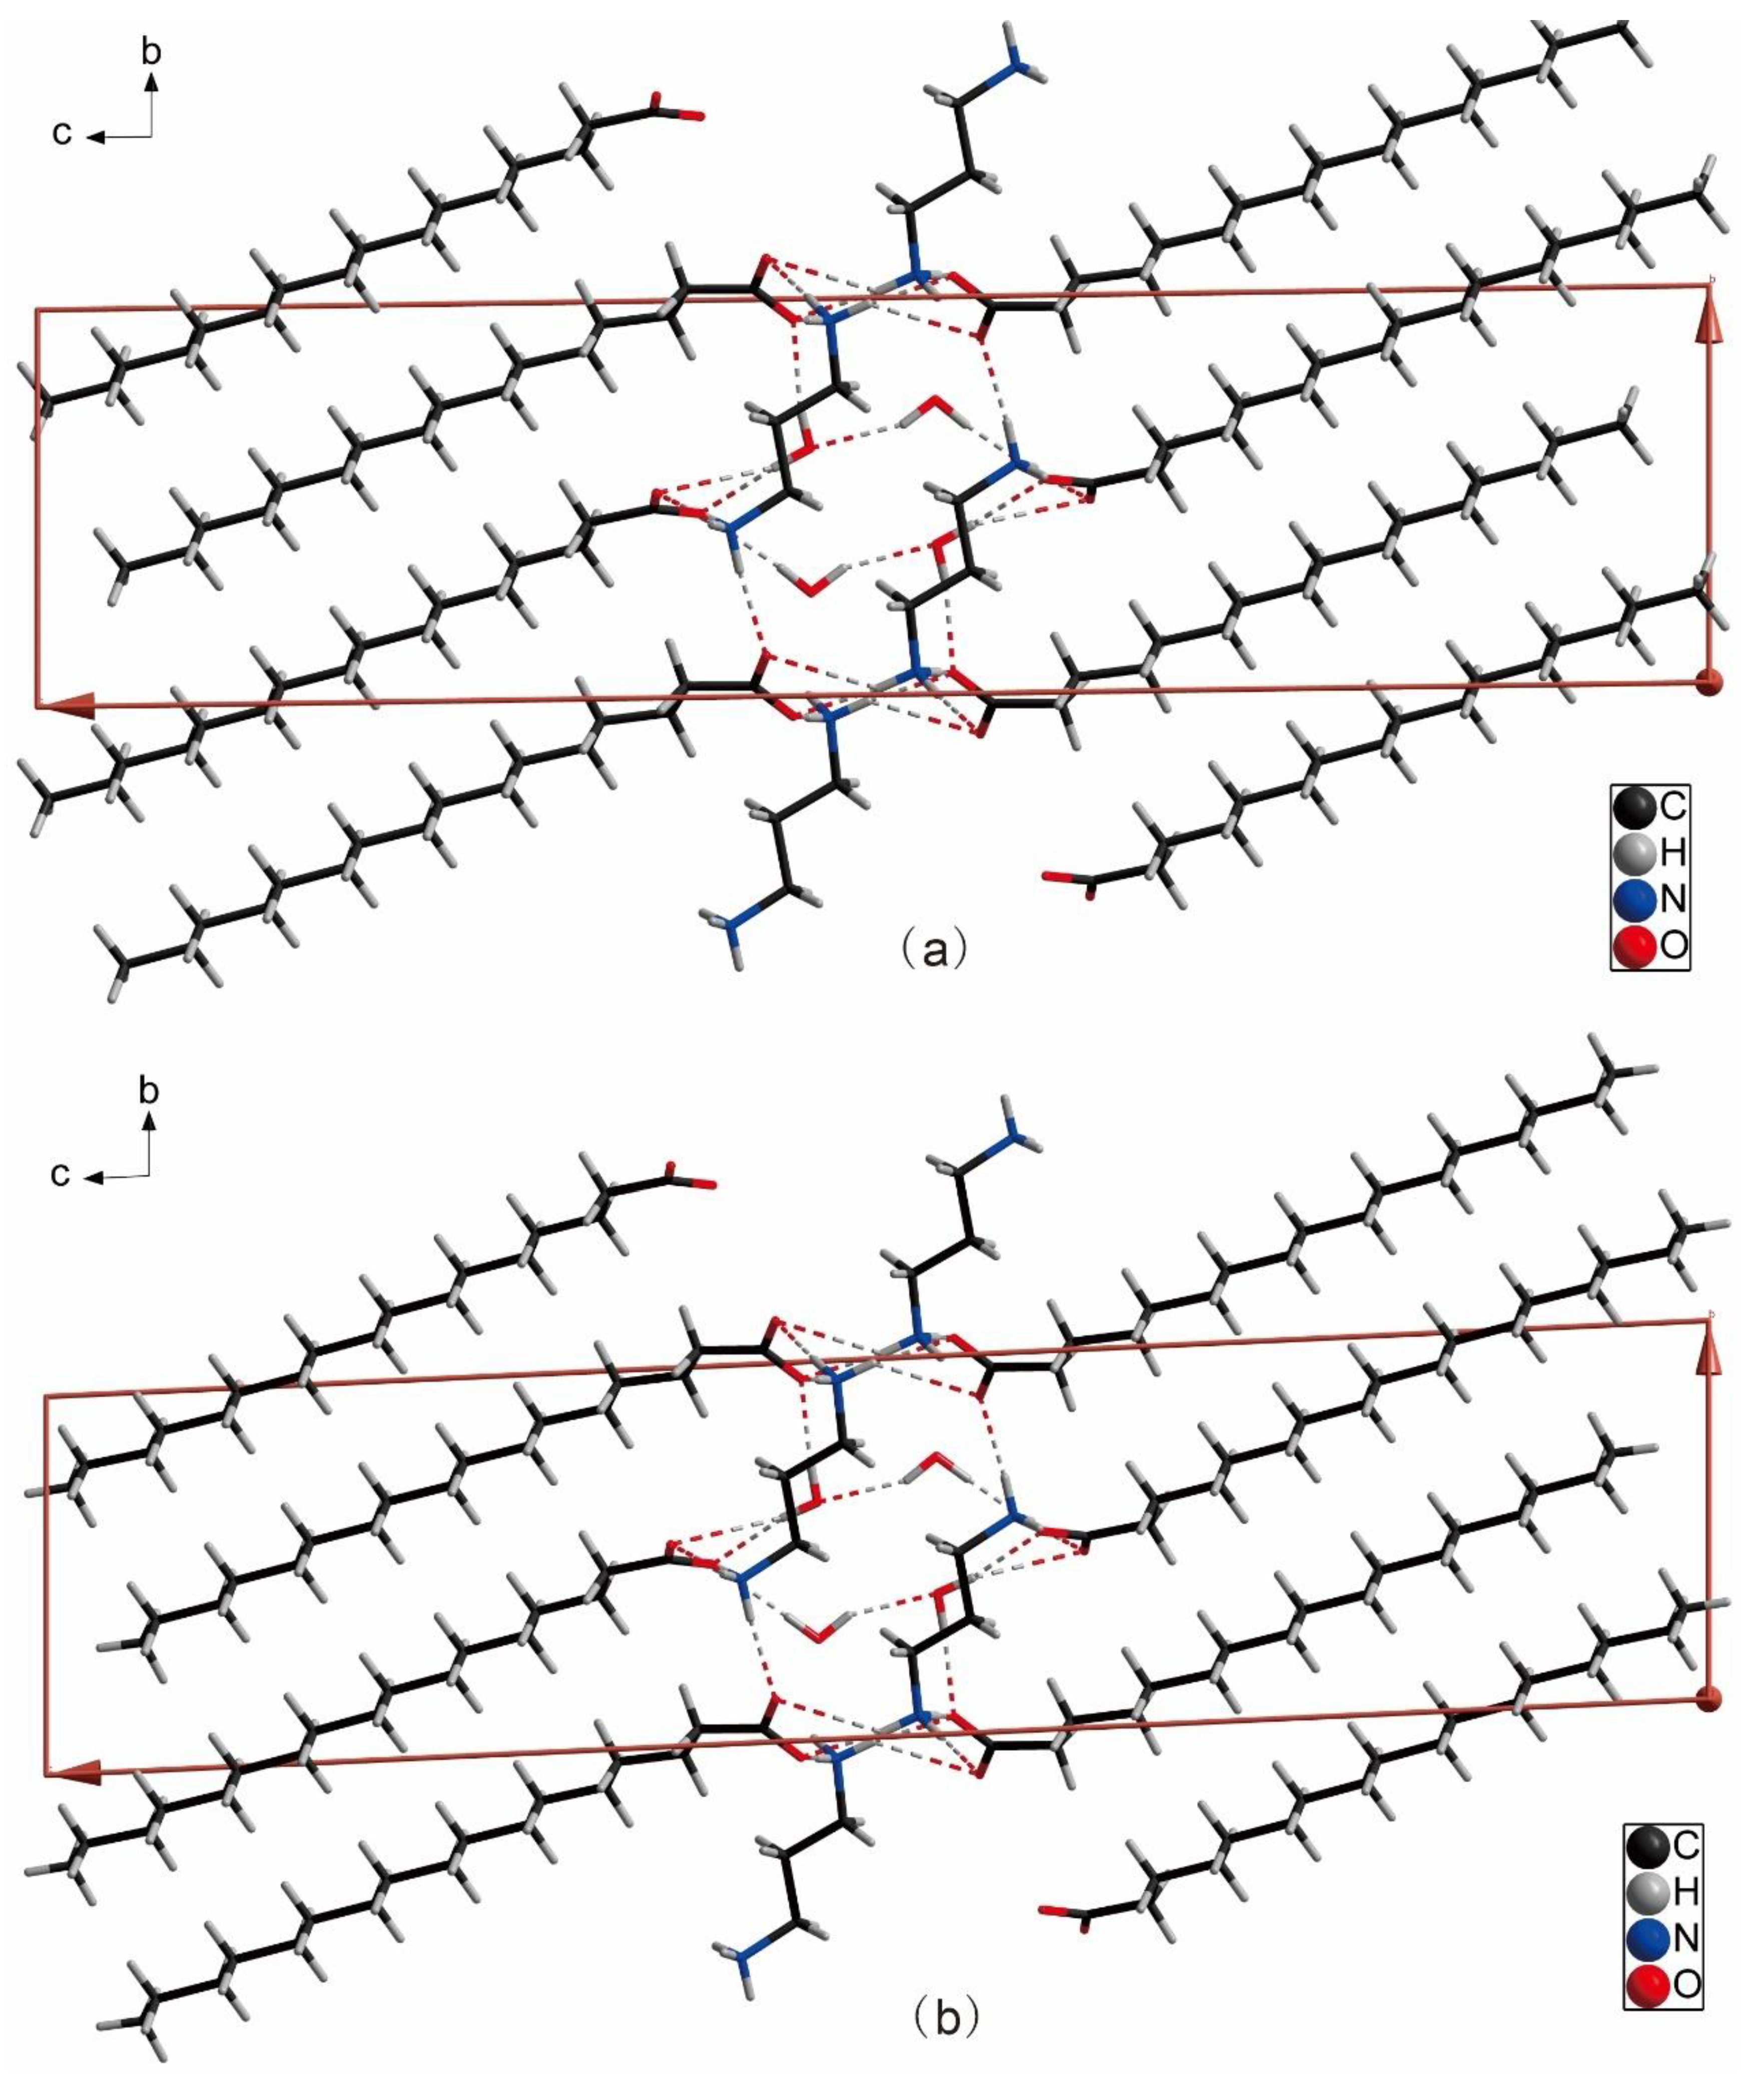
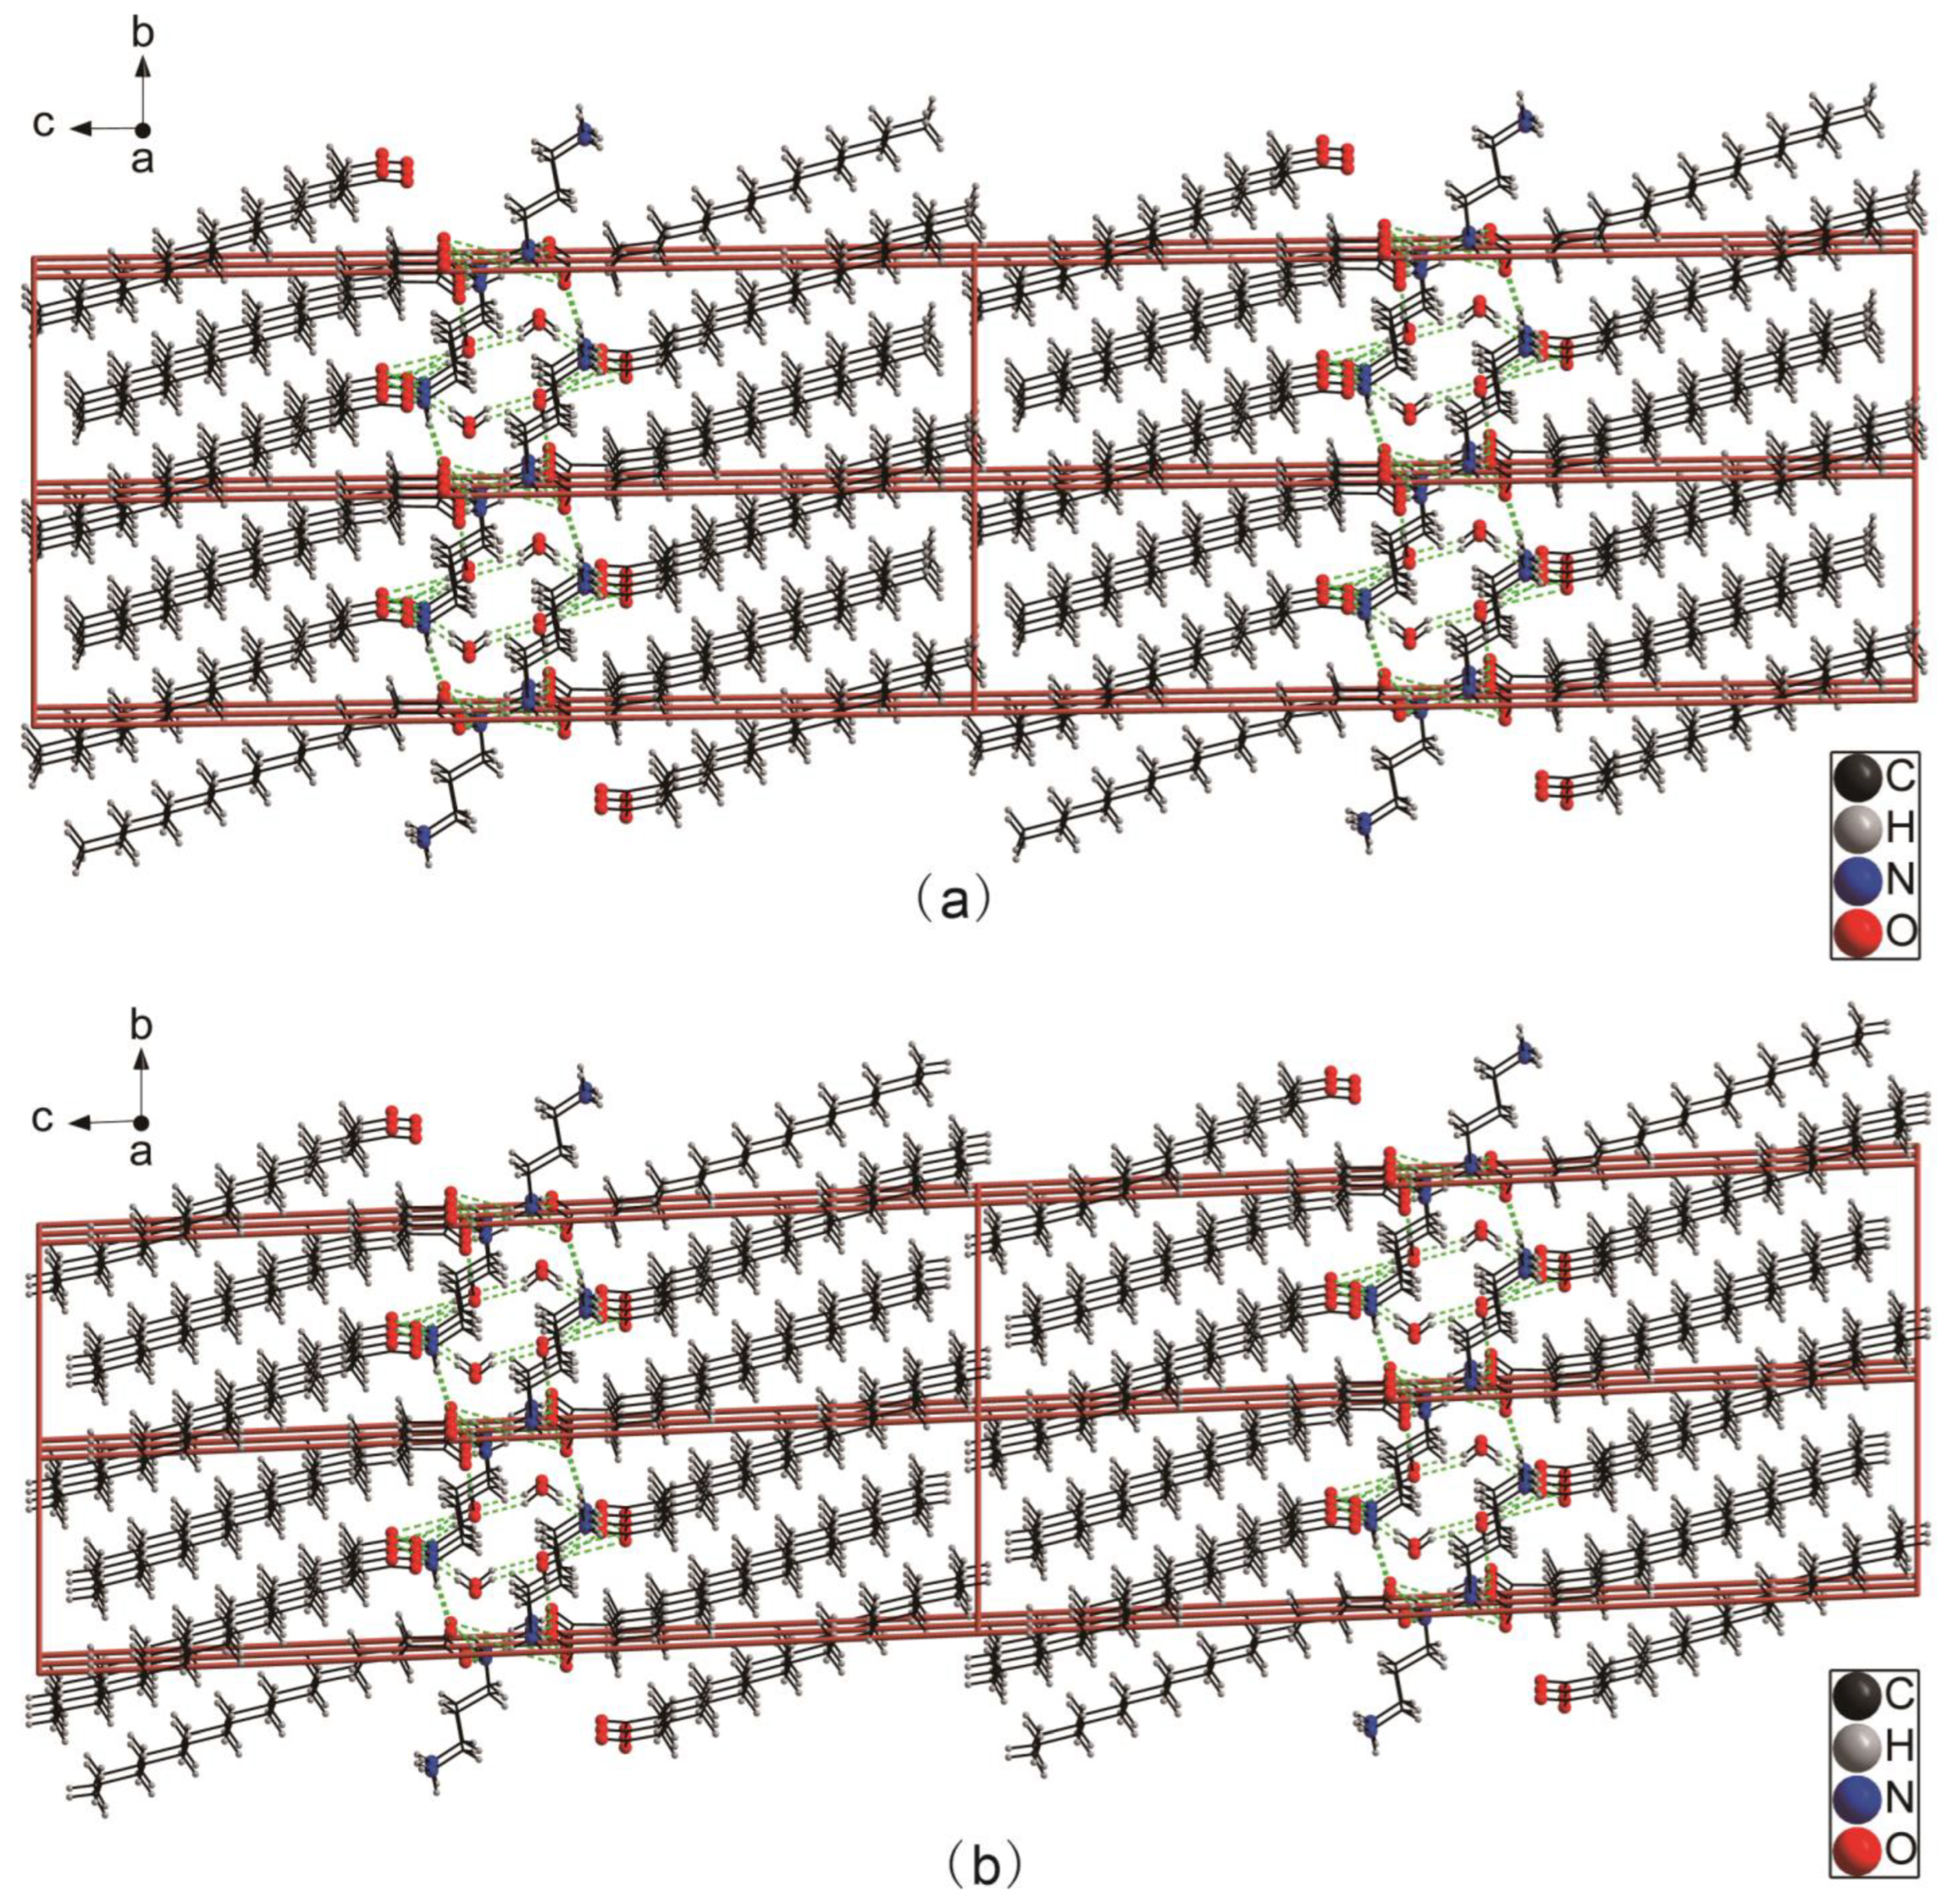
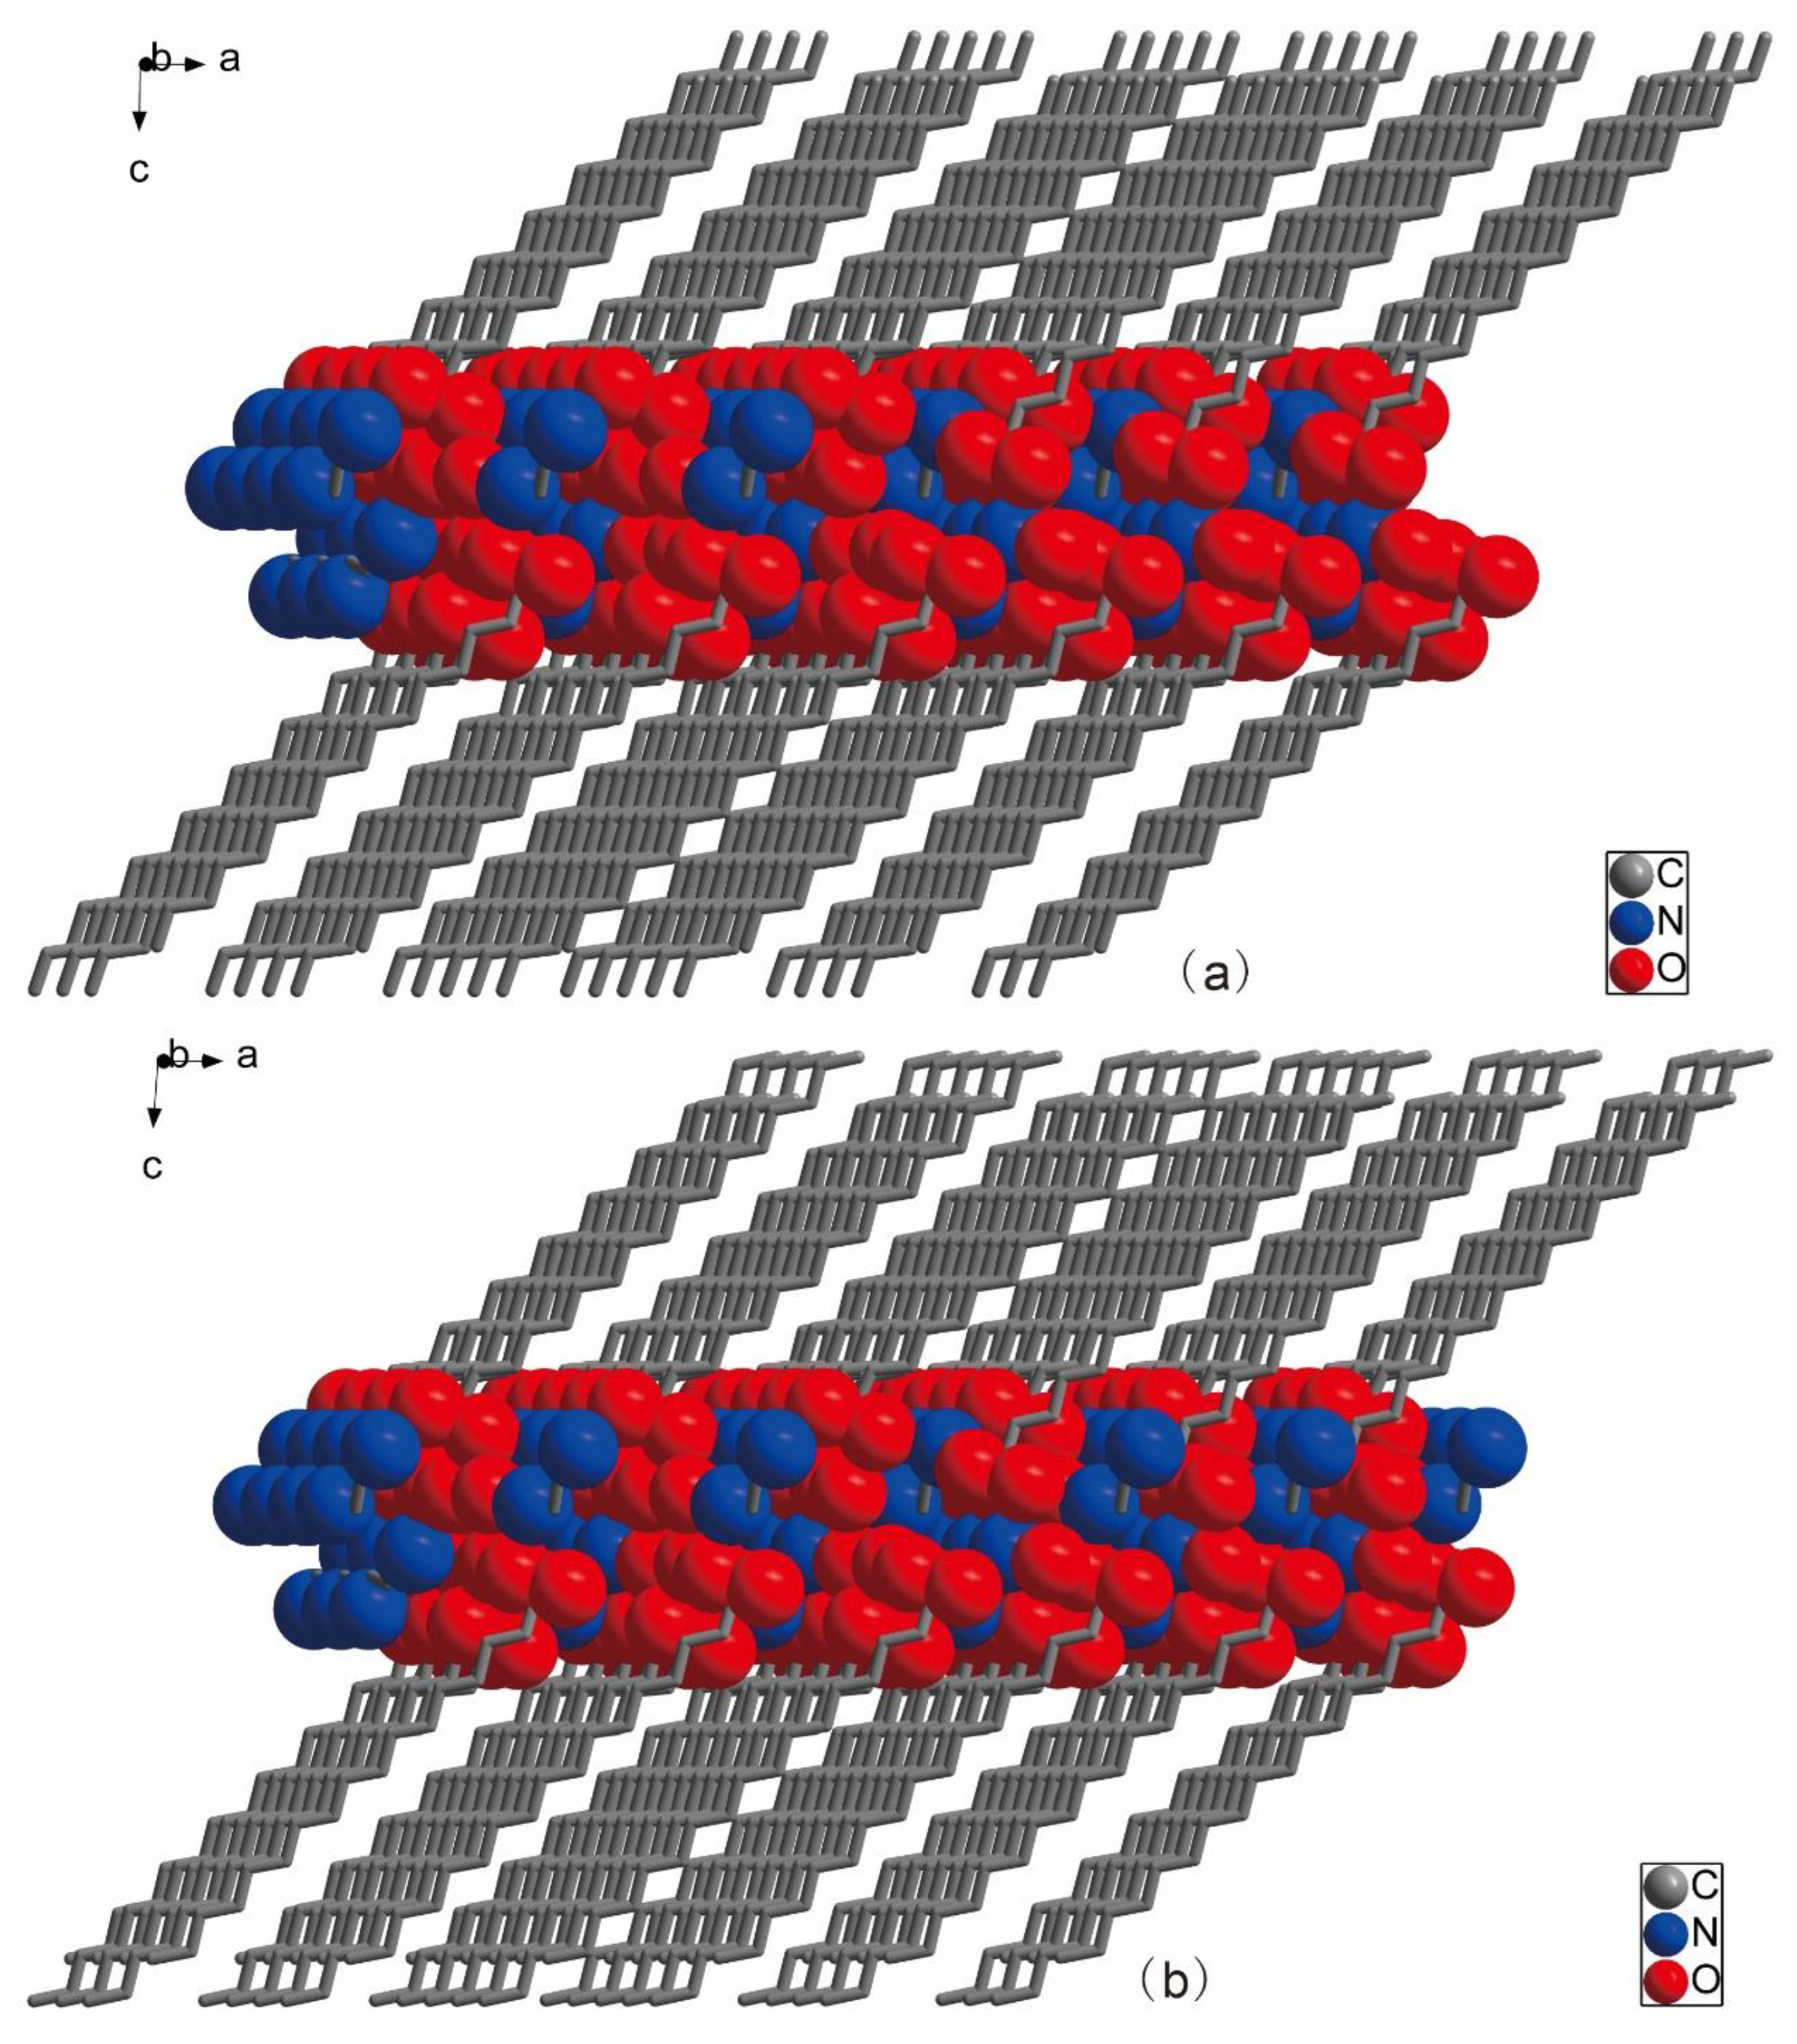
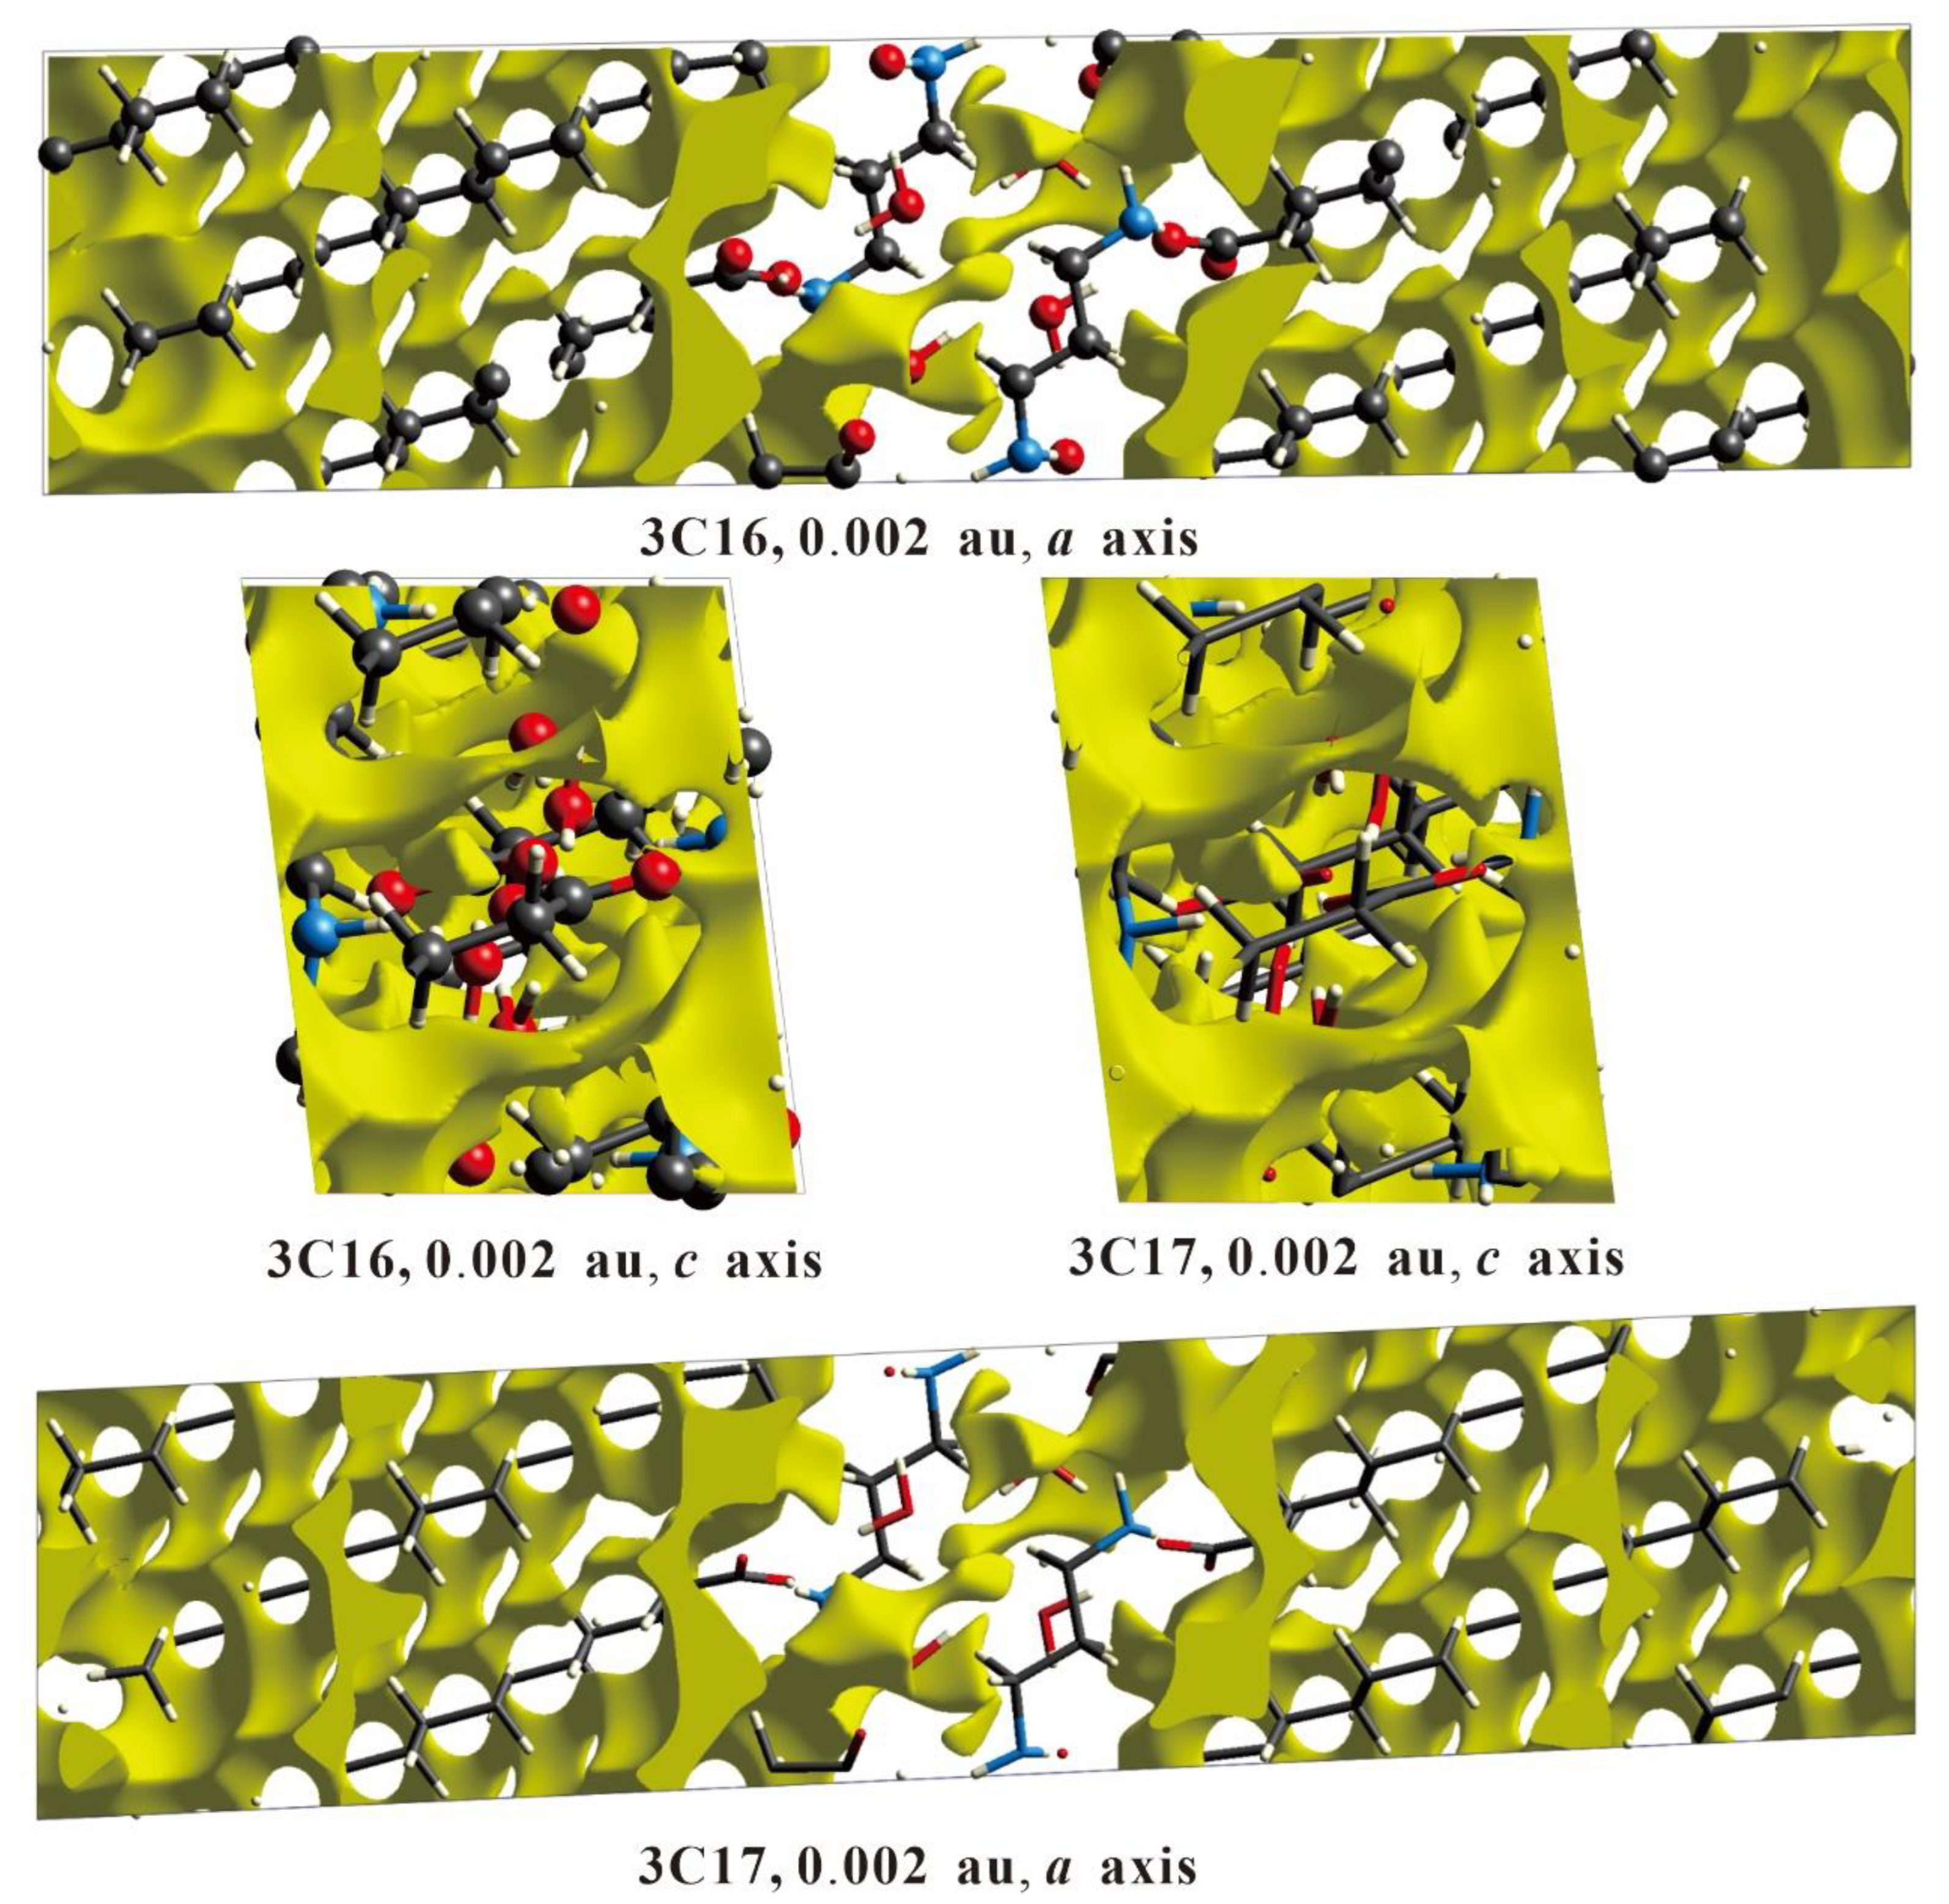
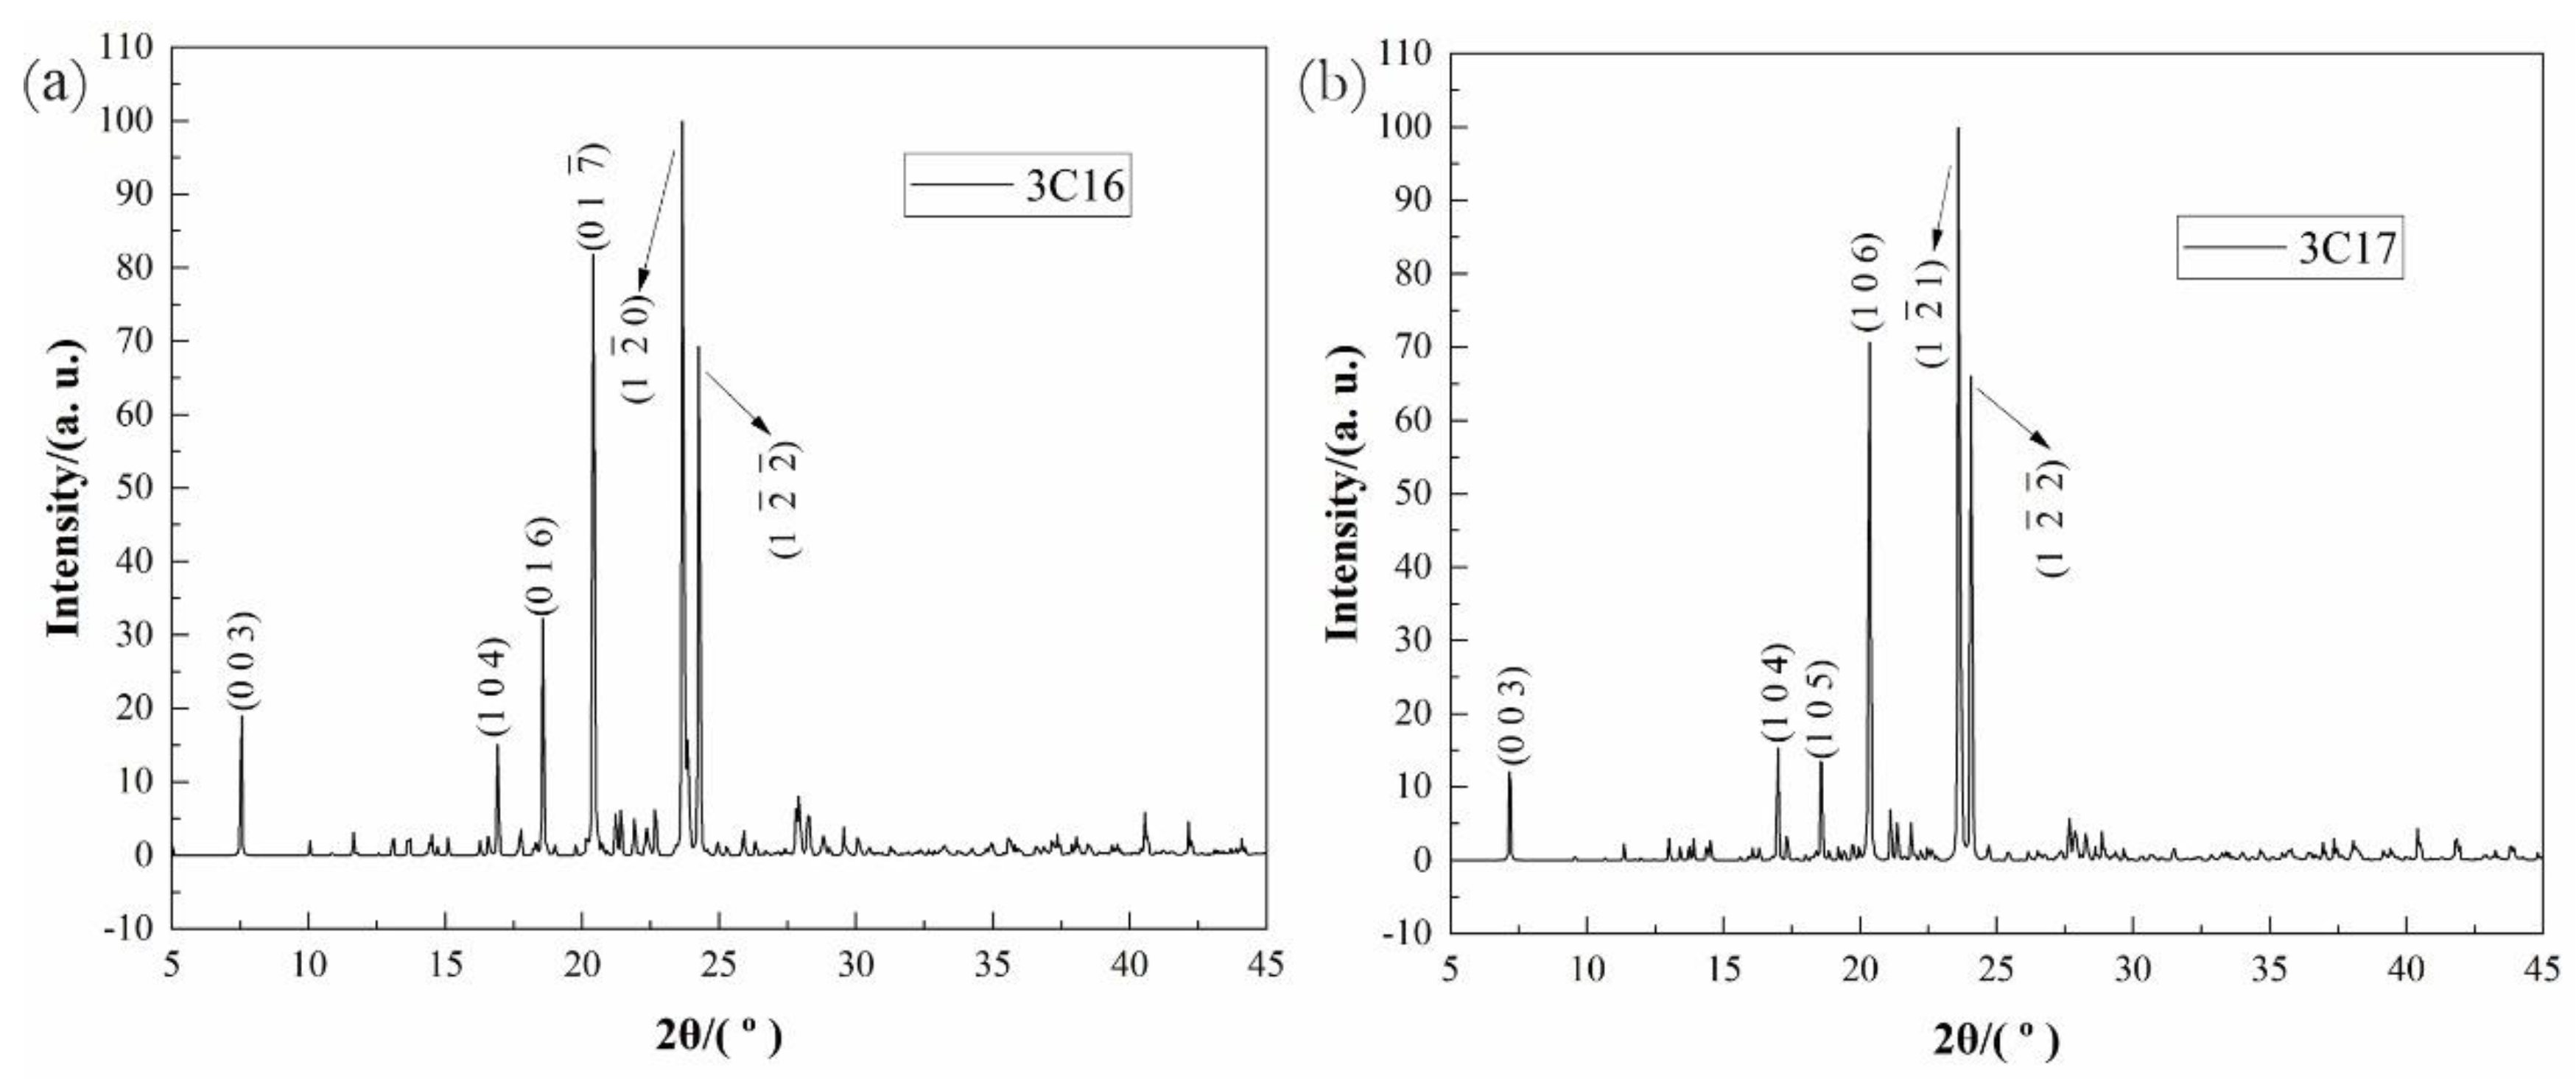
2.1. Descriptions of Crystal Structure
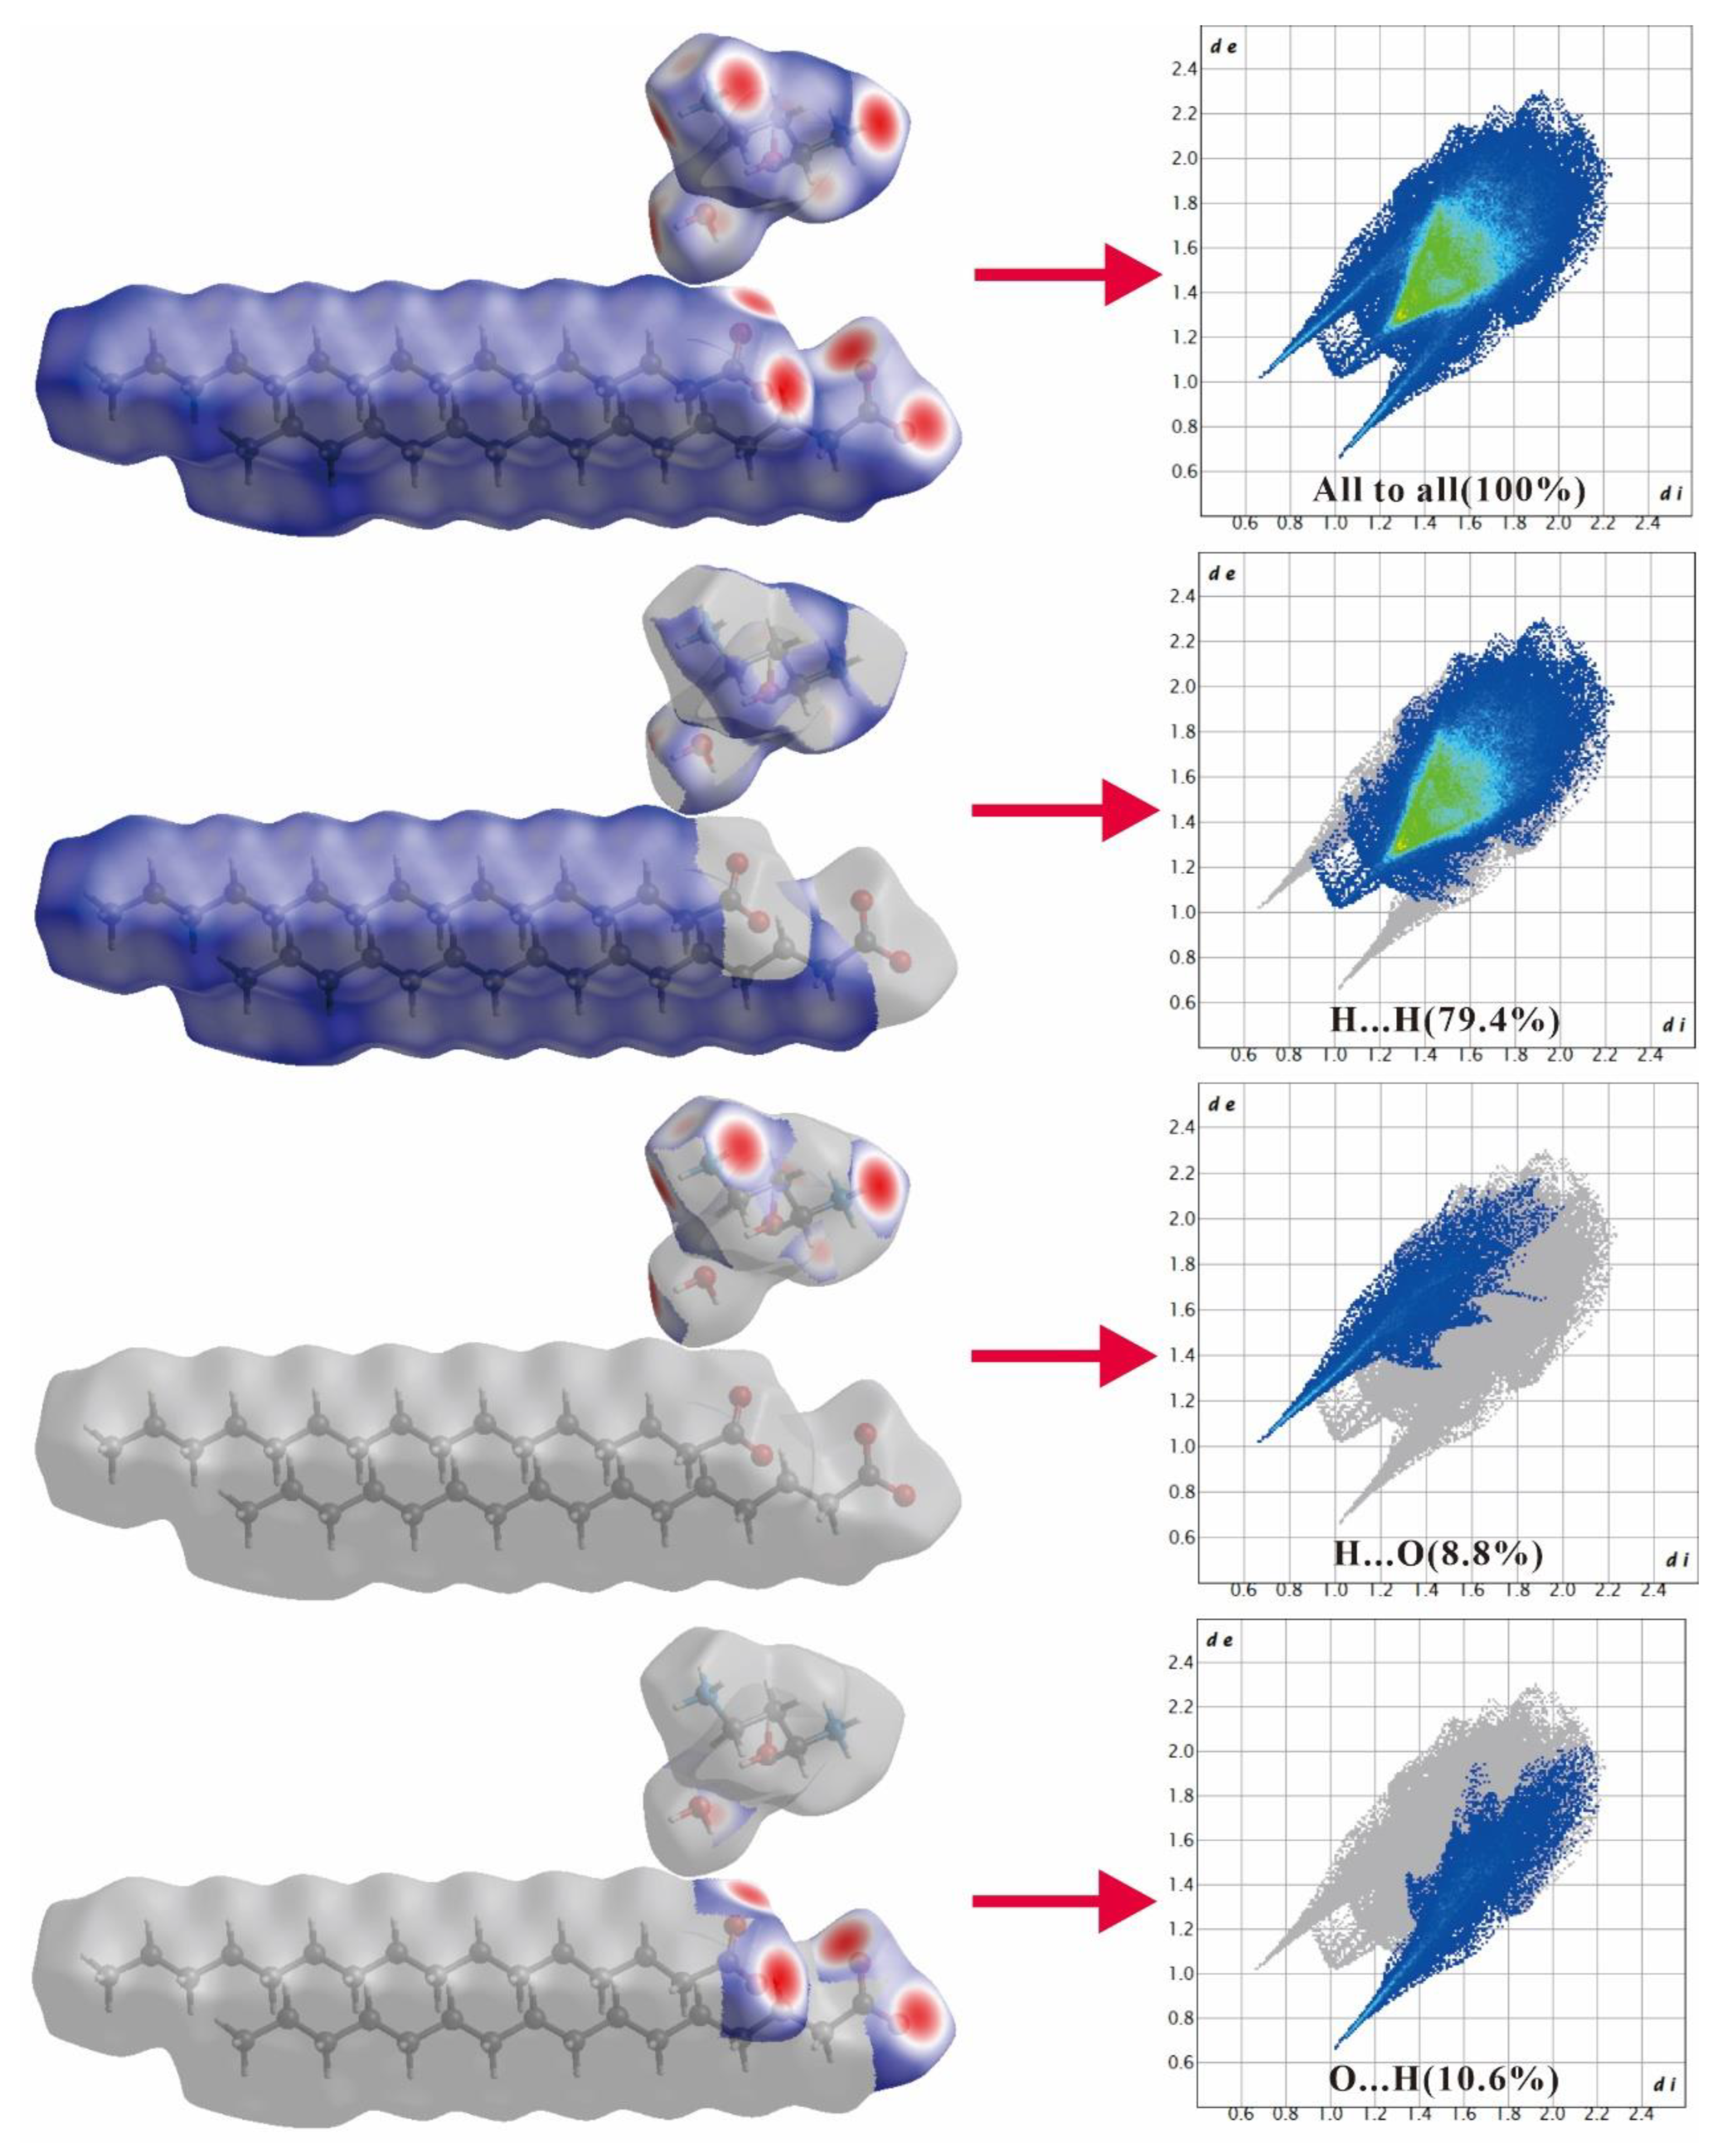
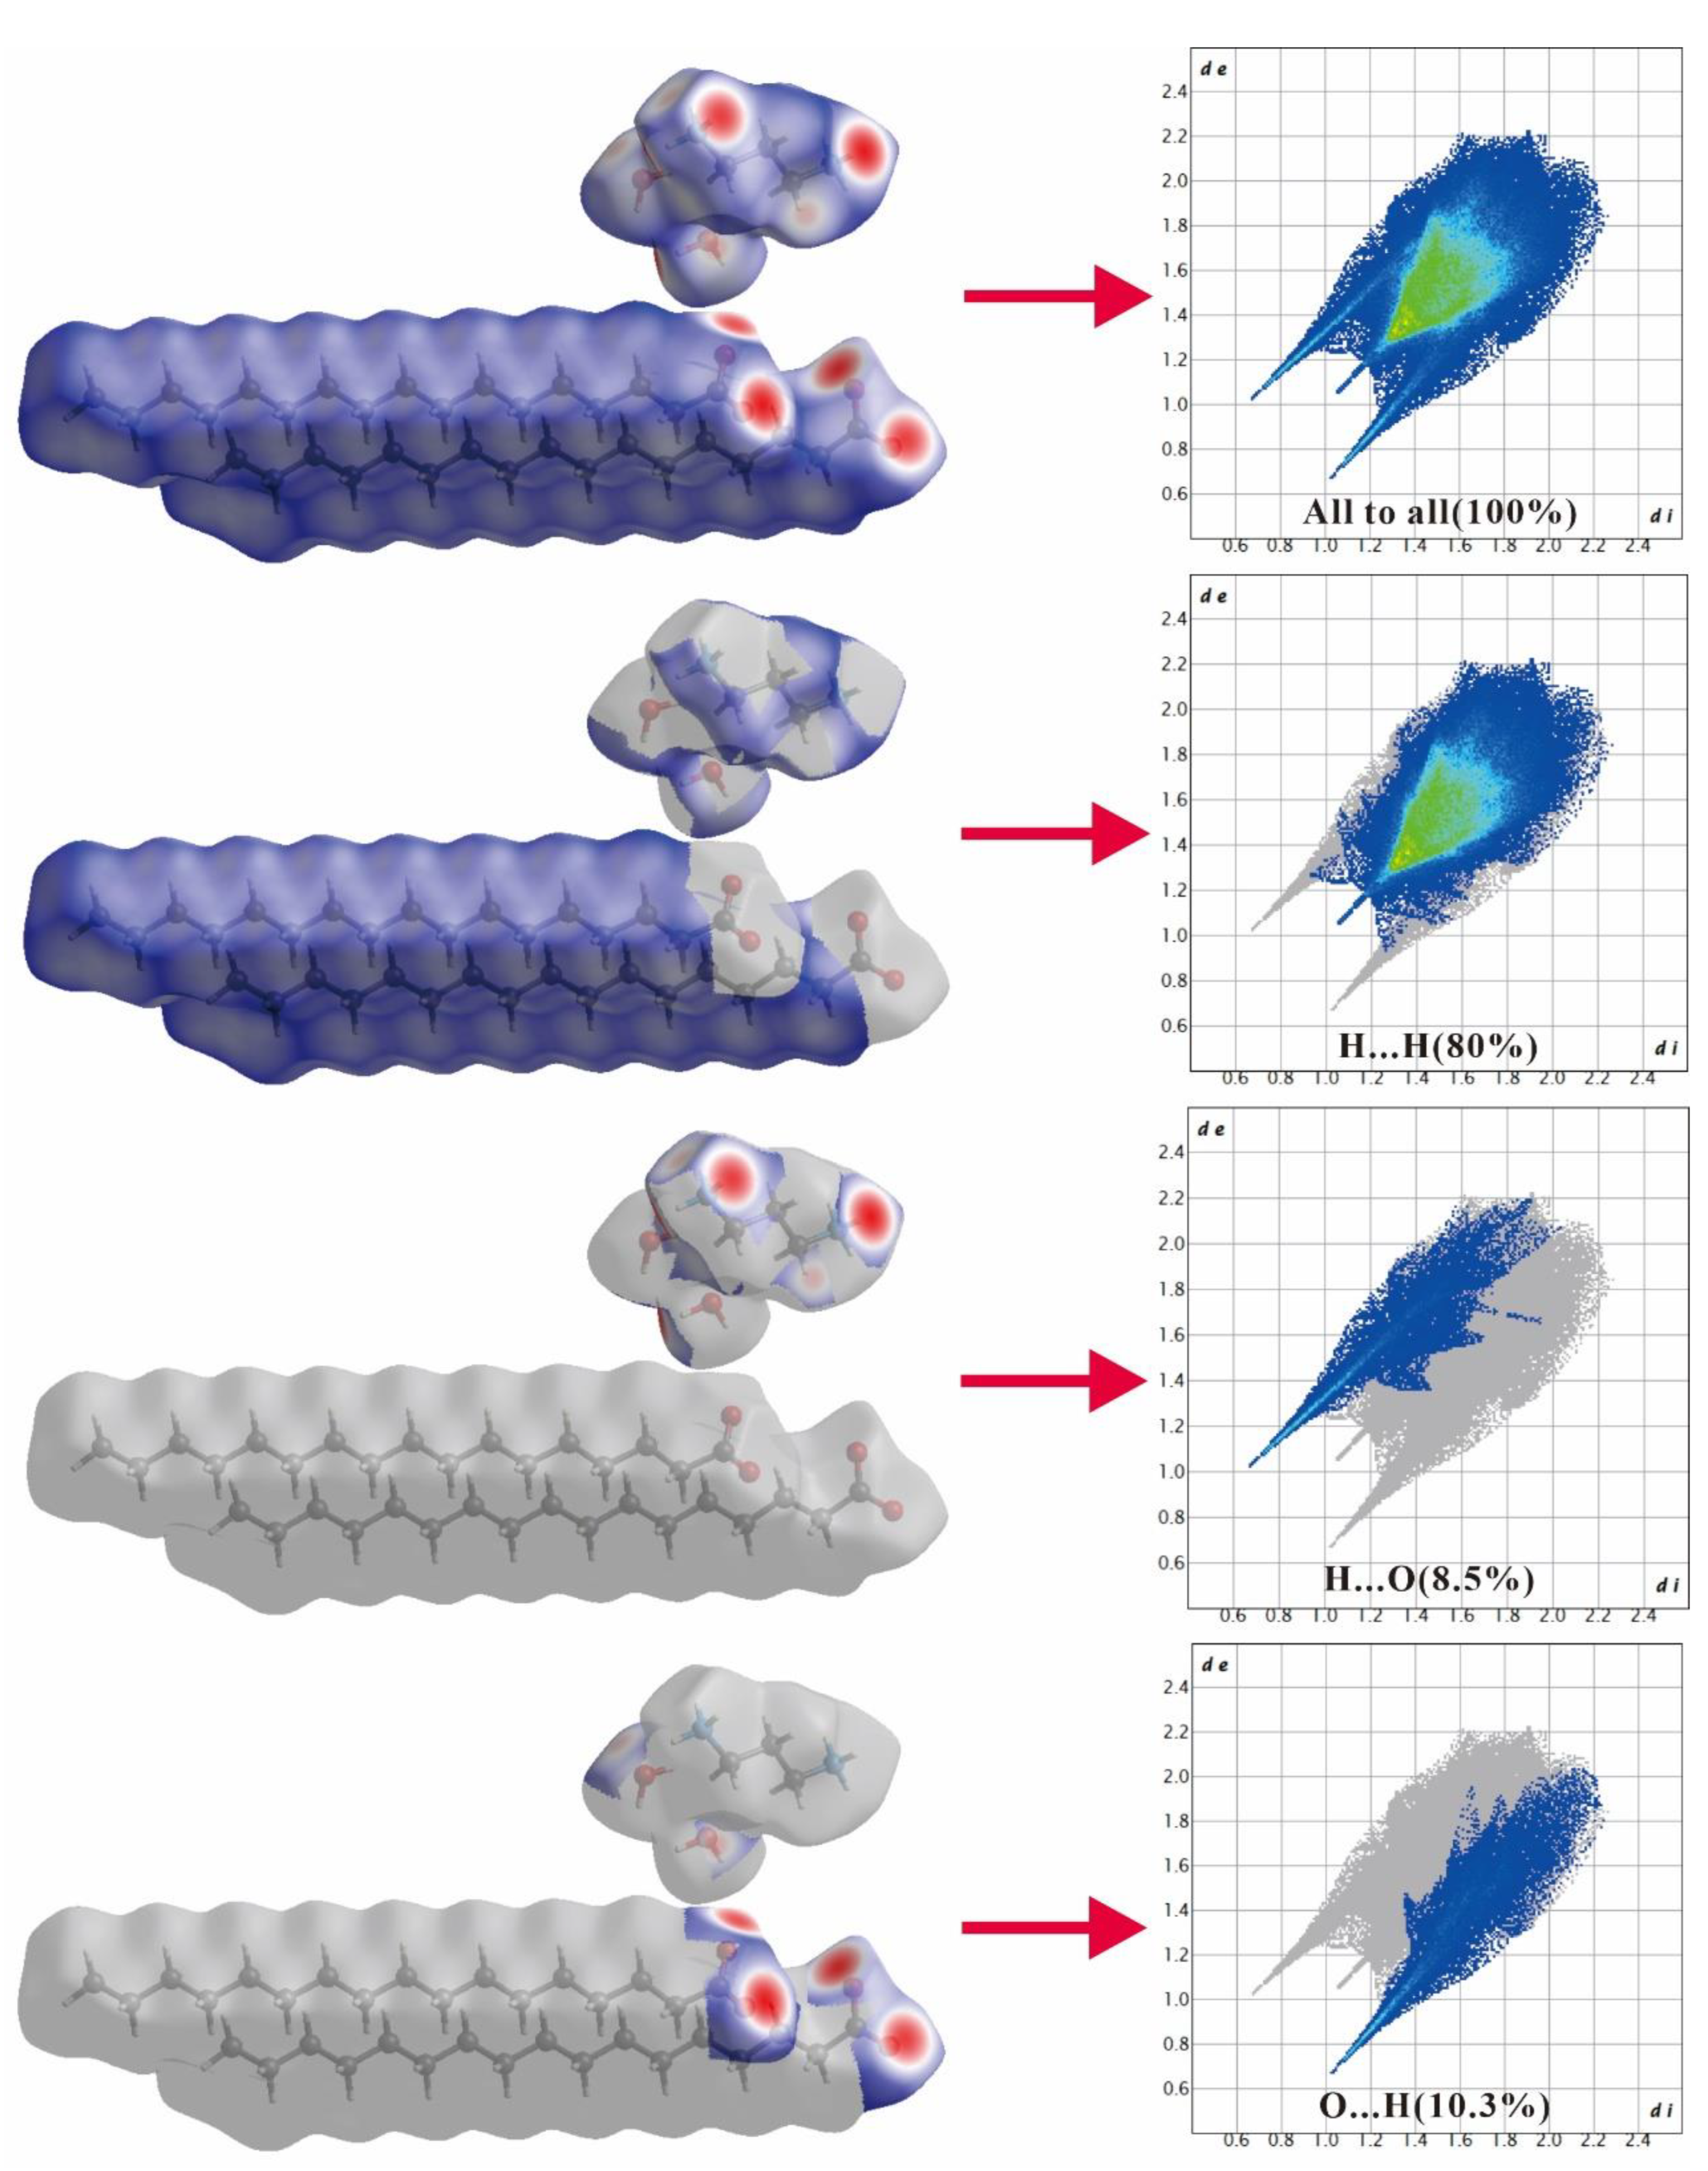
2.2. Hirshfeld Surface Analysis
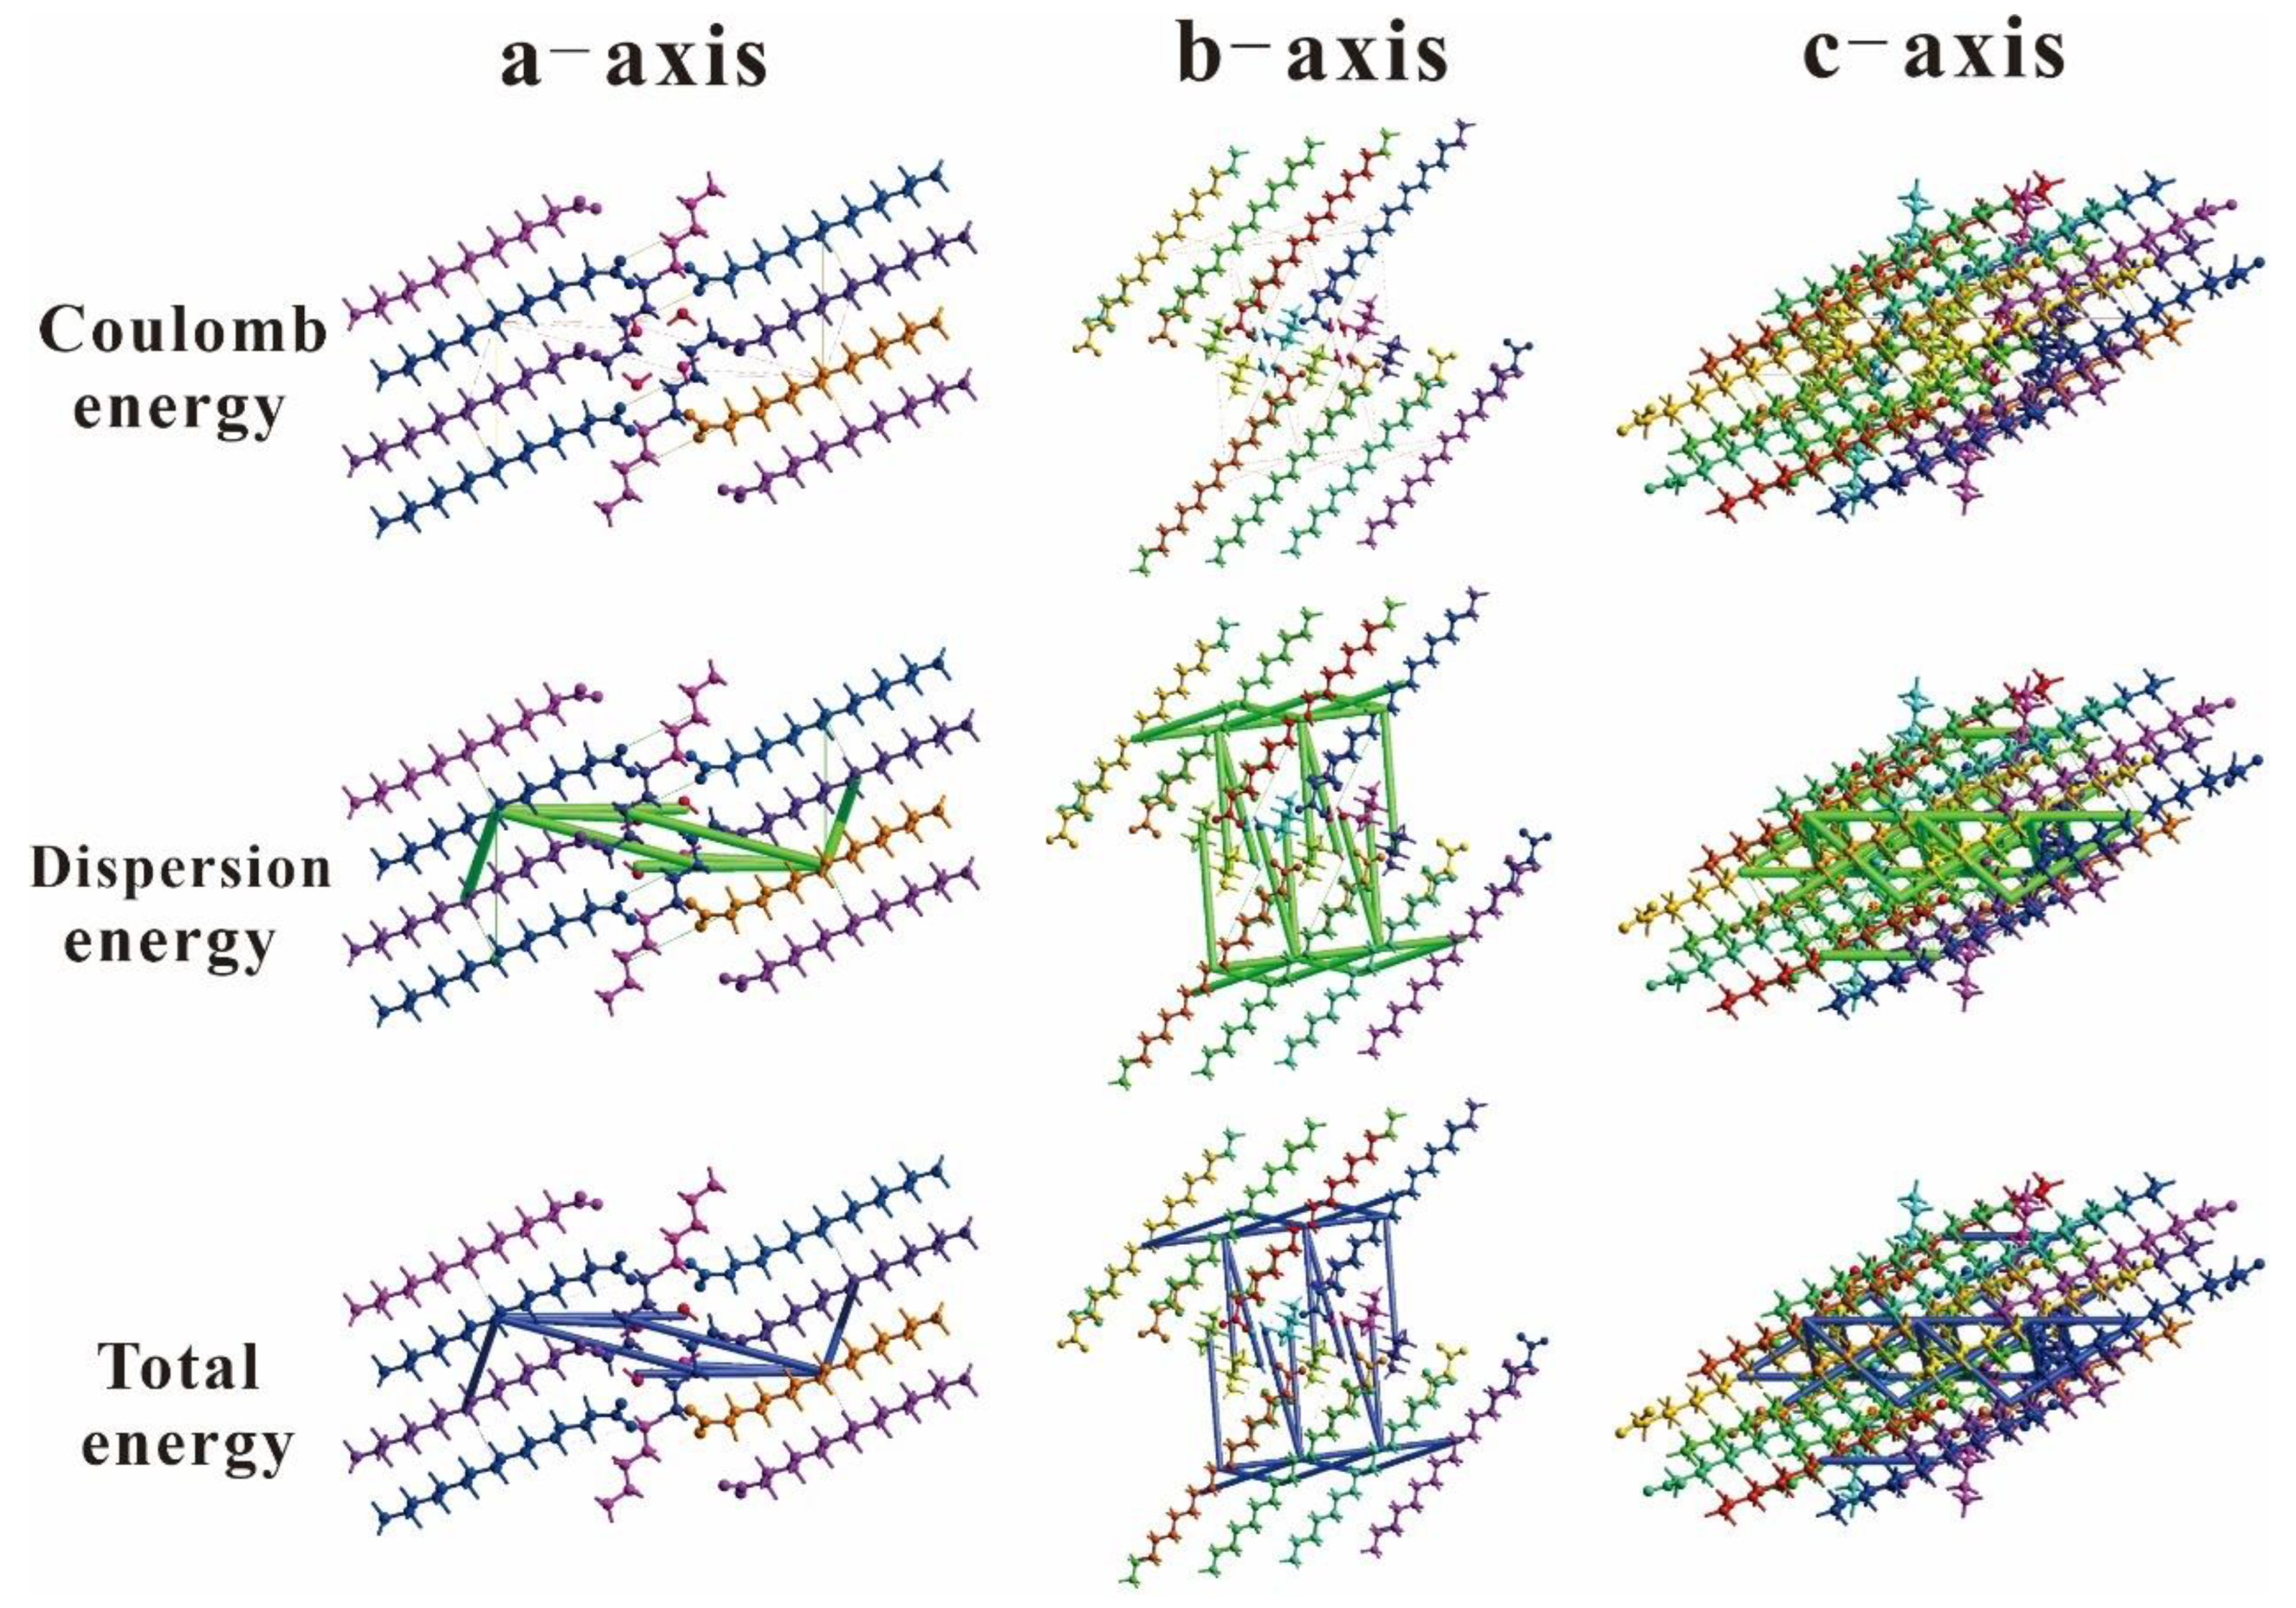
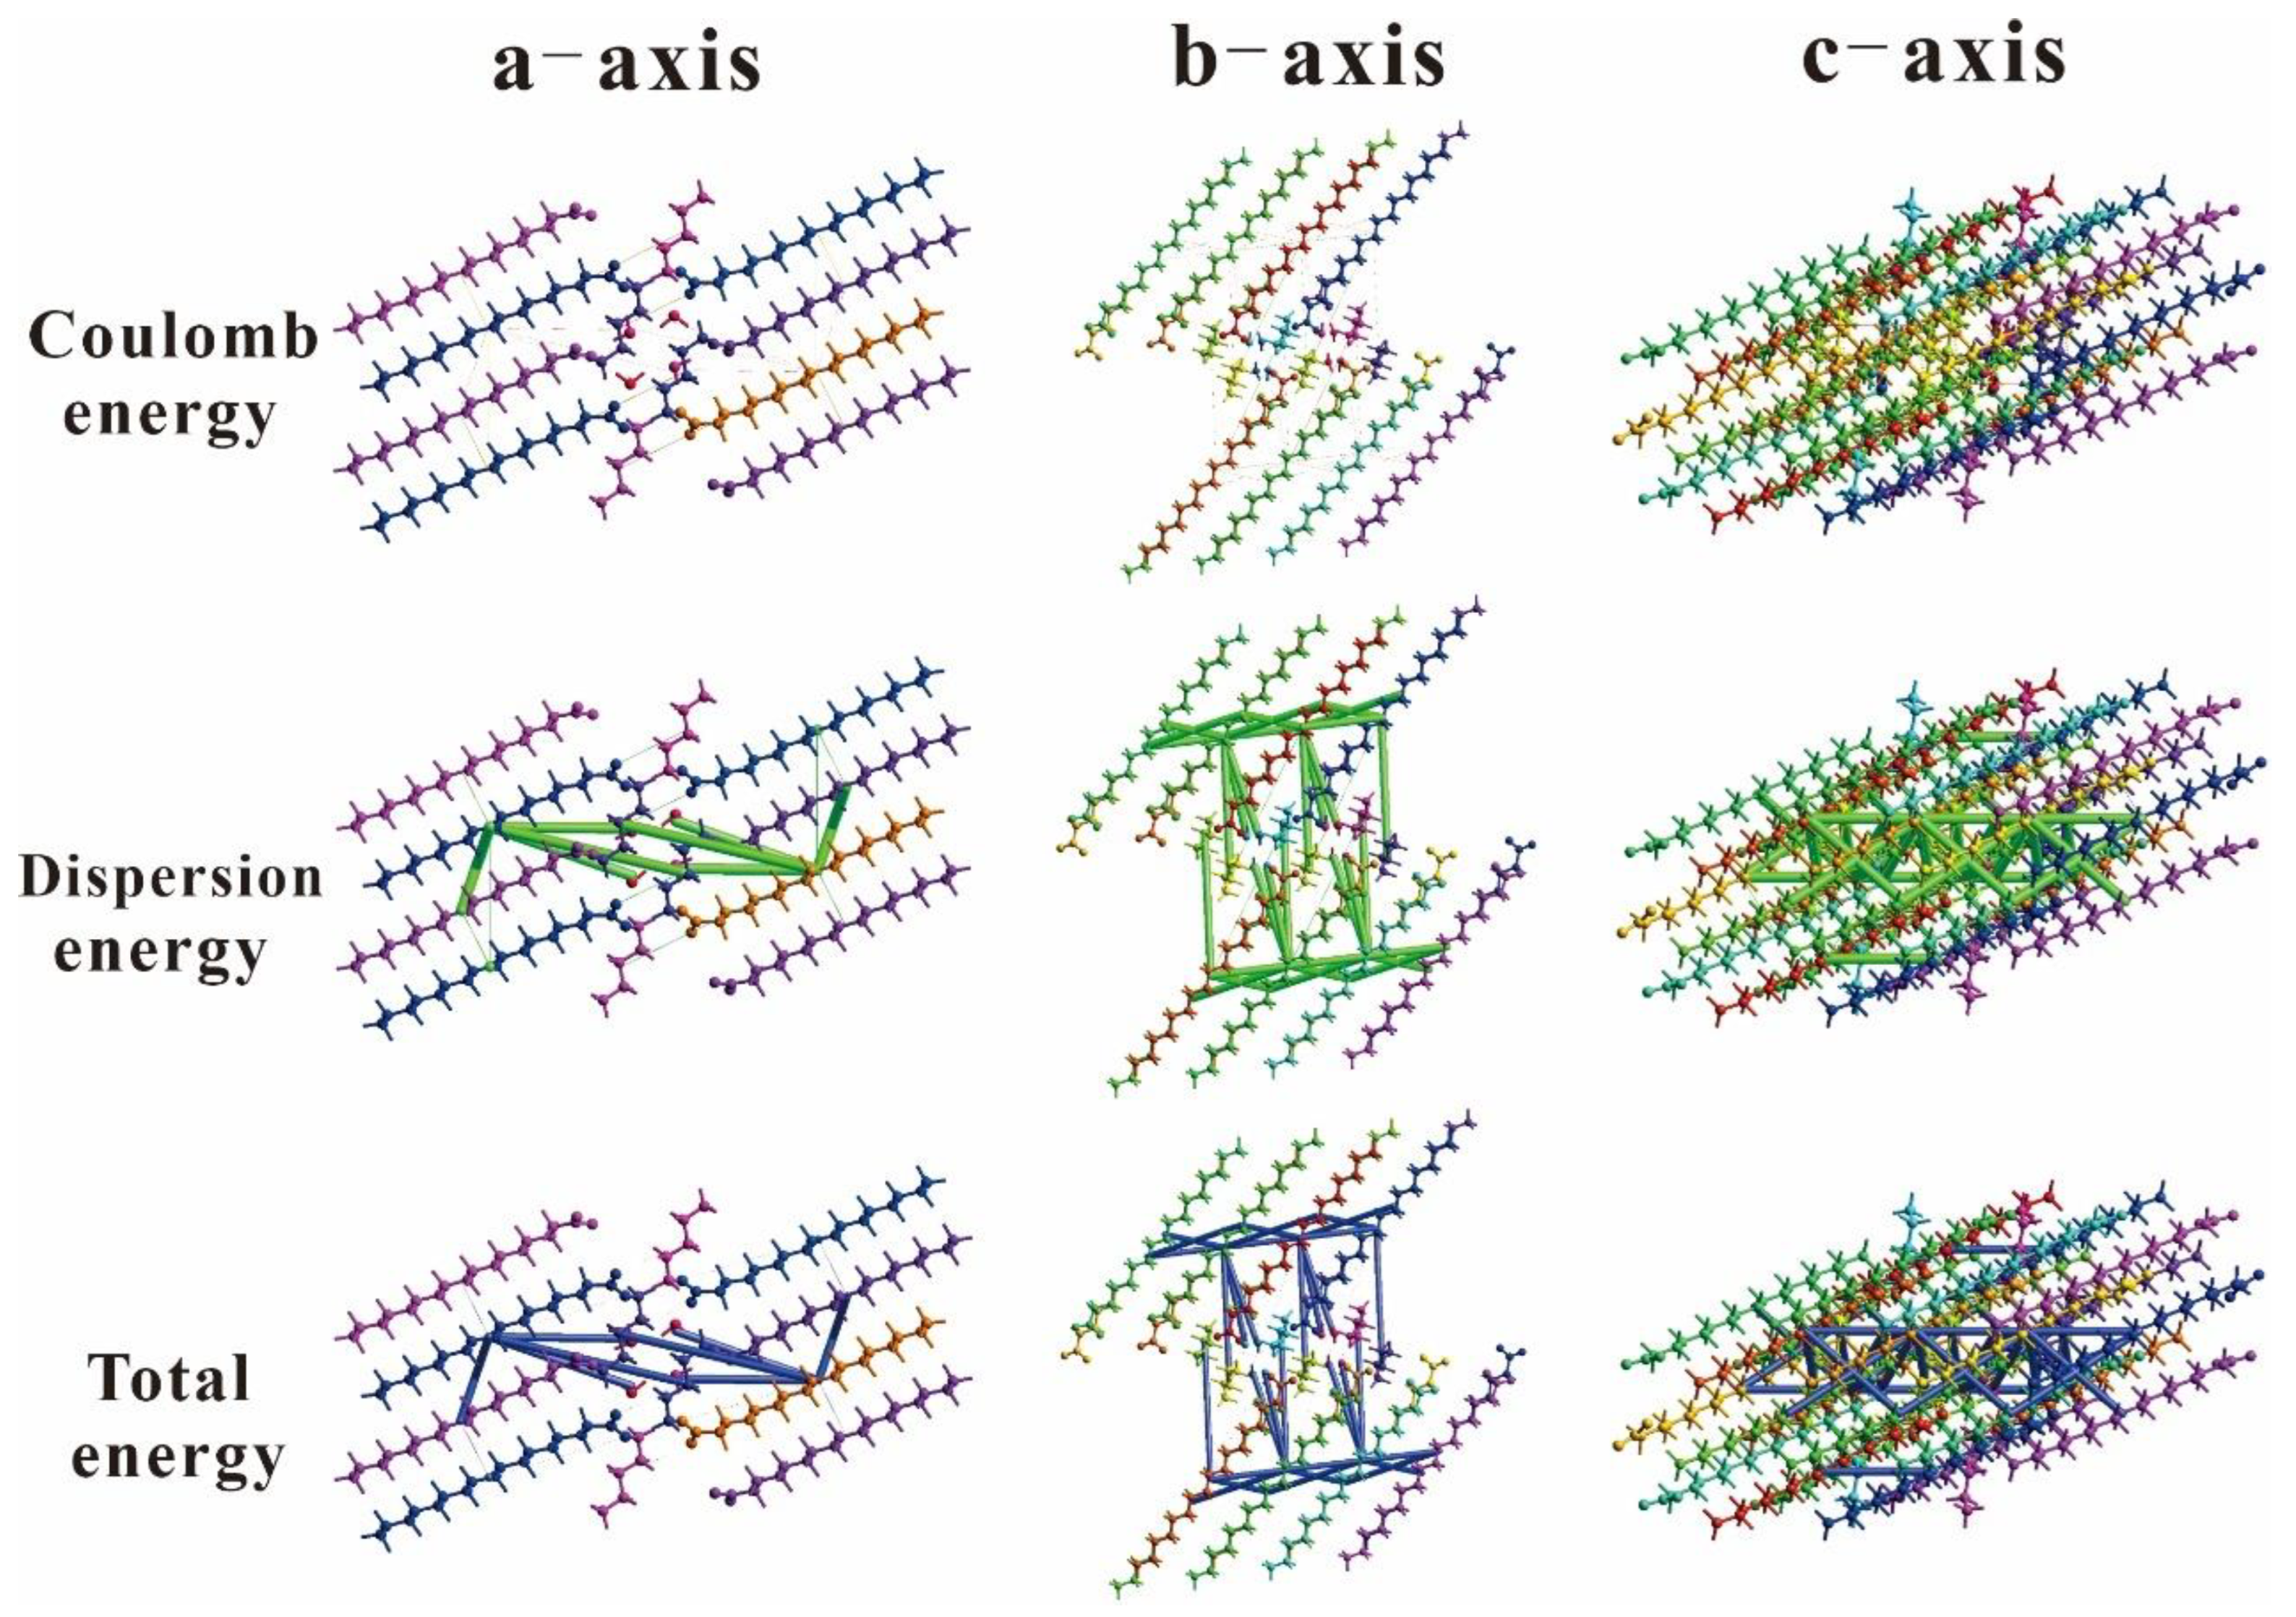
2.3. Energy Frameworks
2.4. Quantum Chemical Calculations
2.4.1. Molecular Geometry Optimization
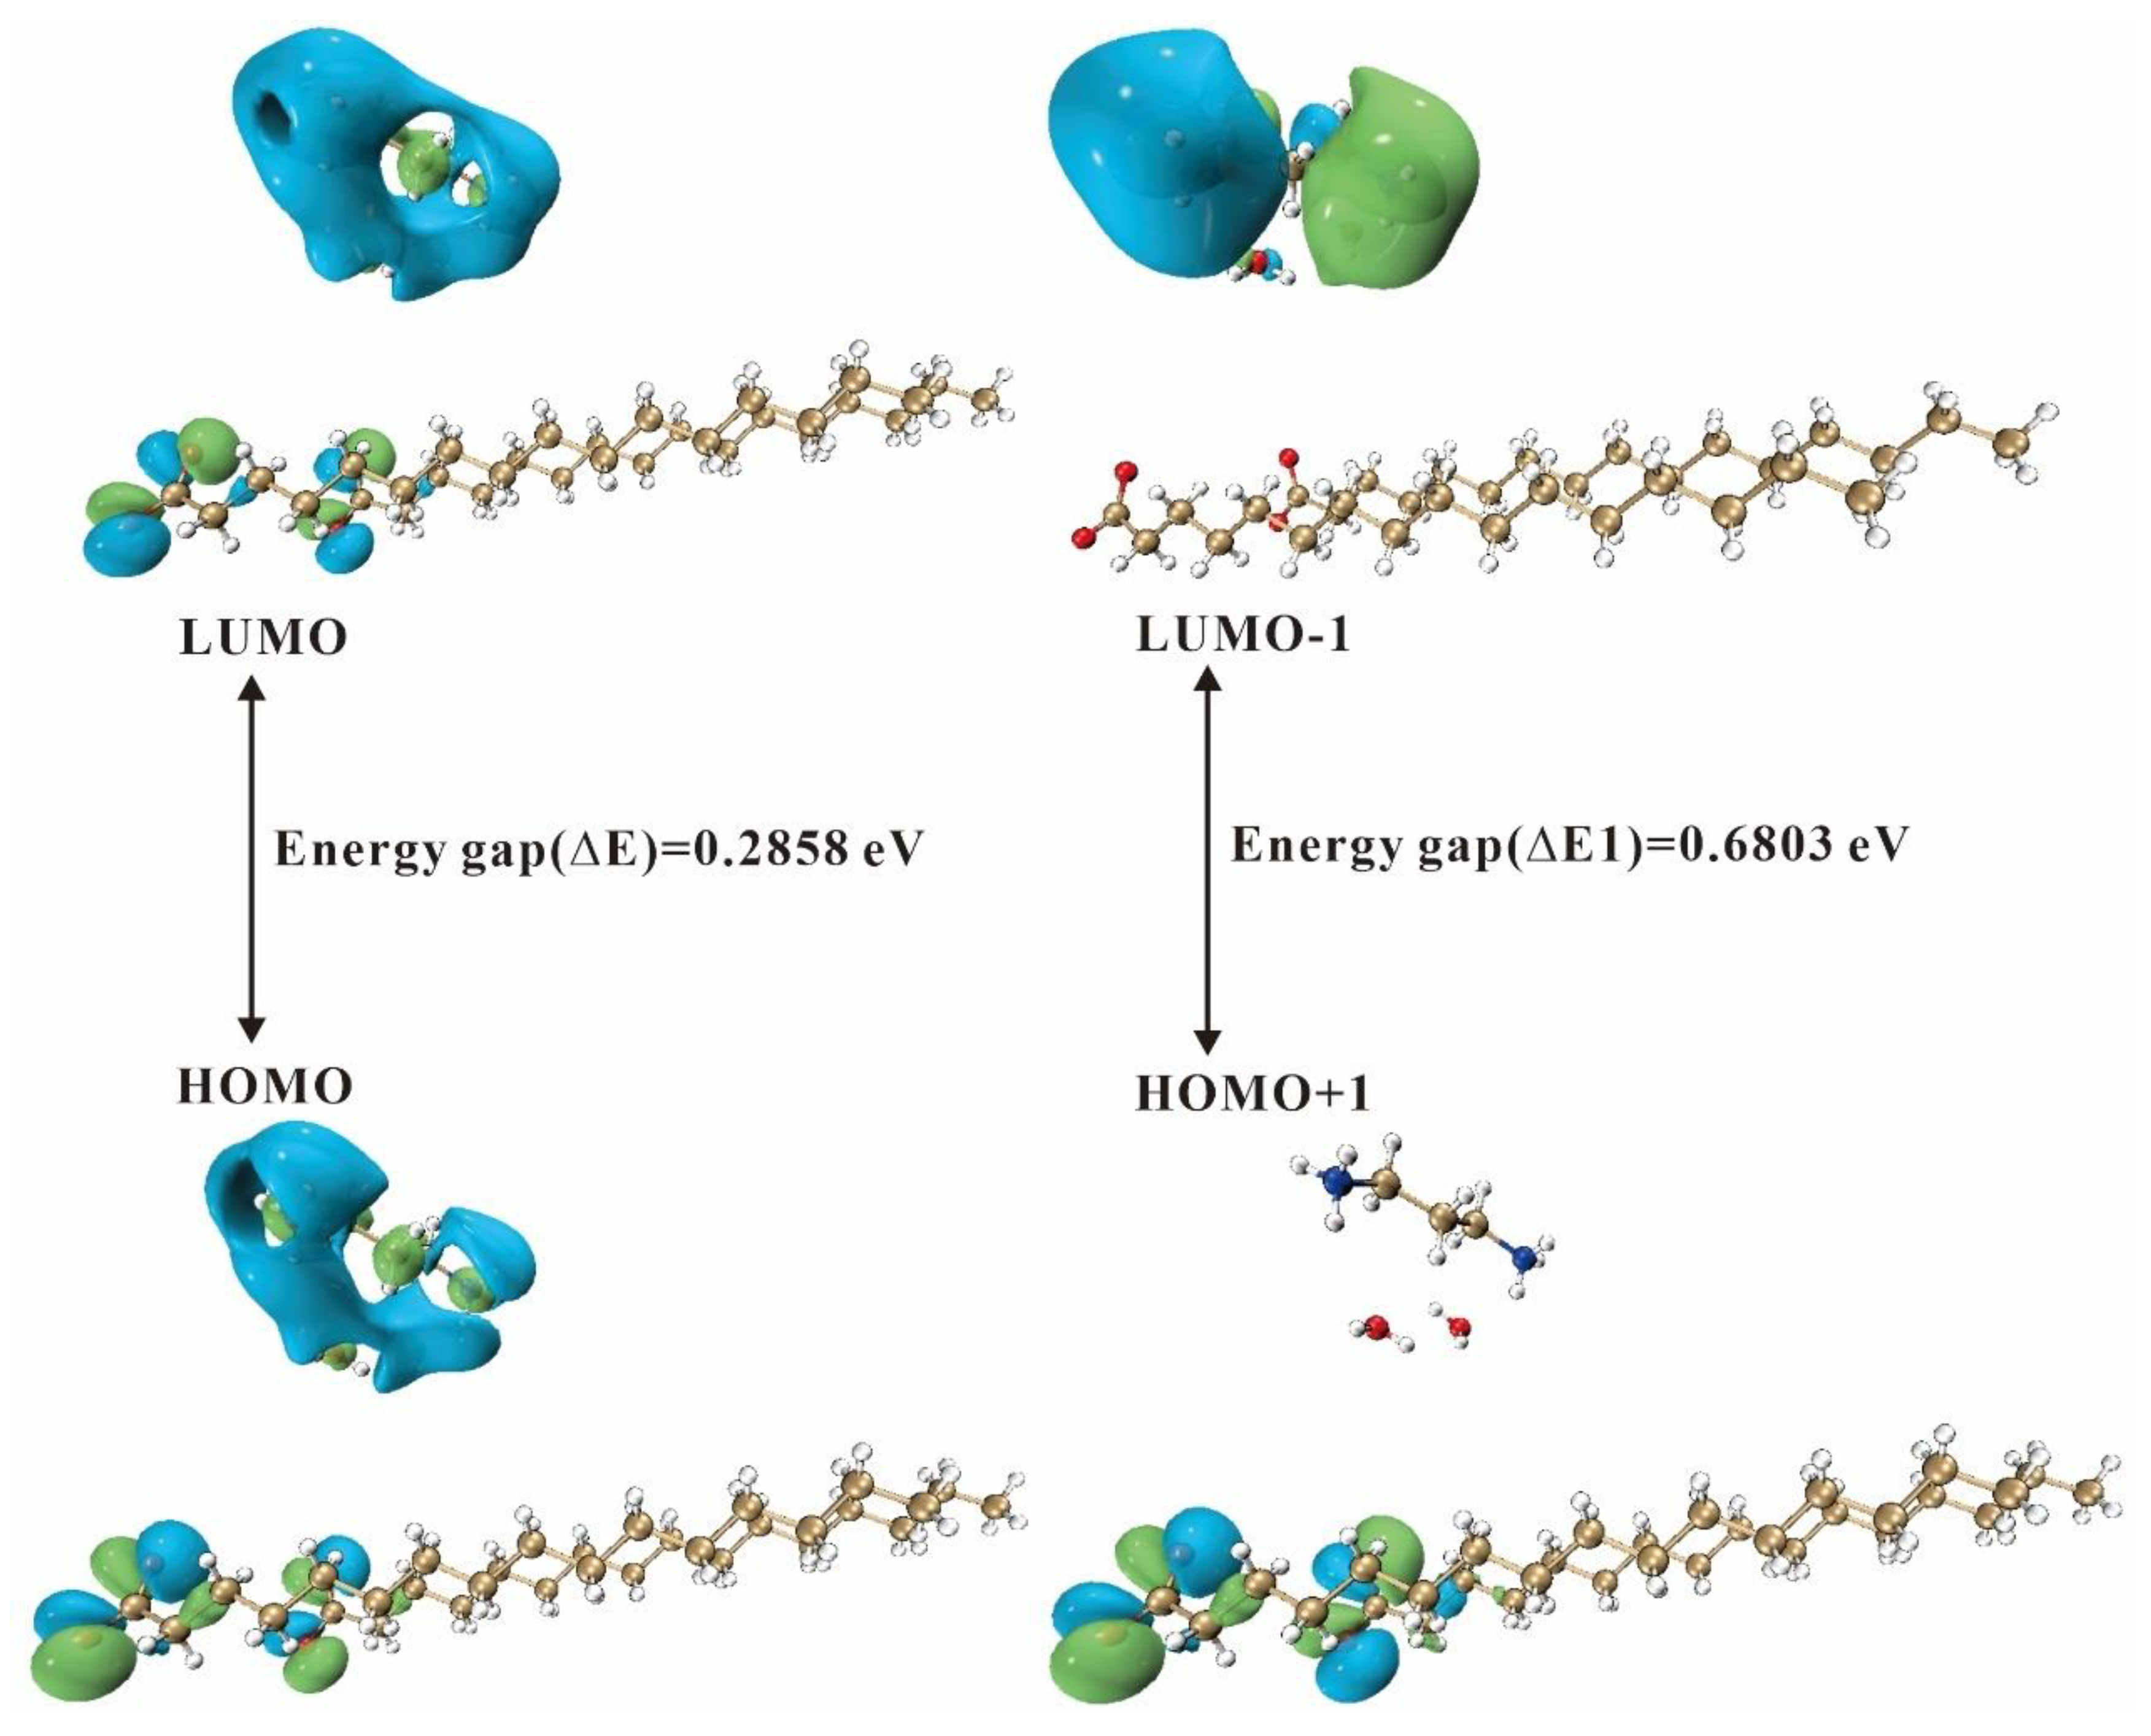
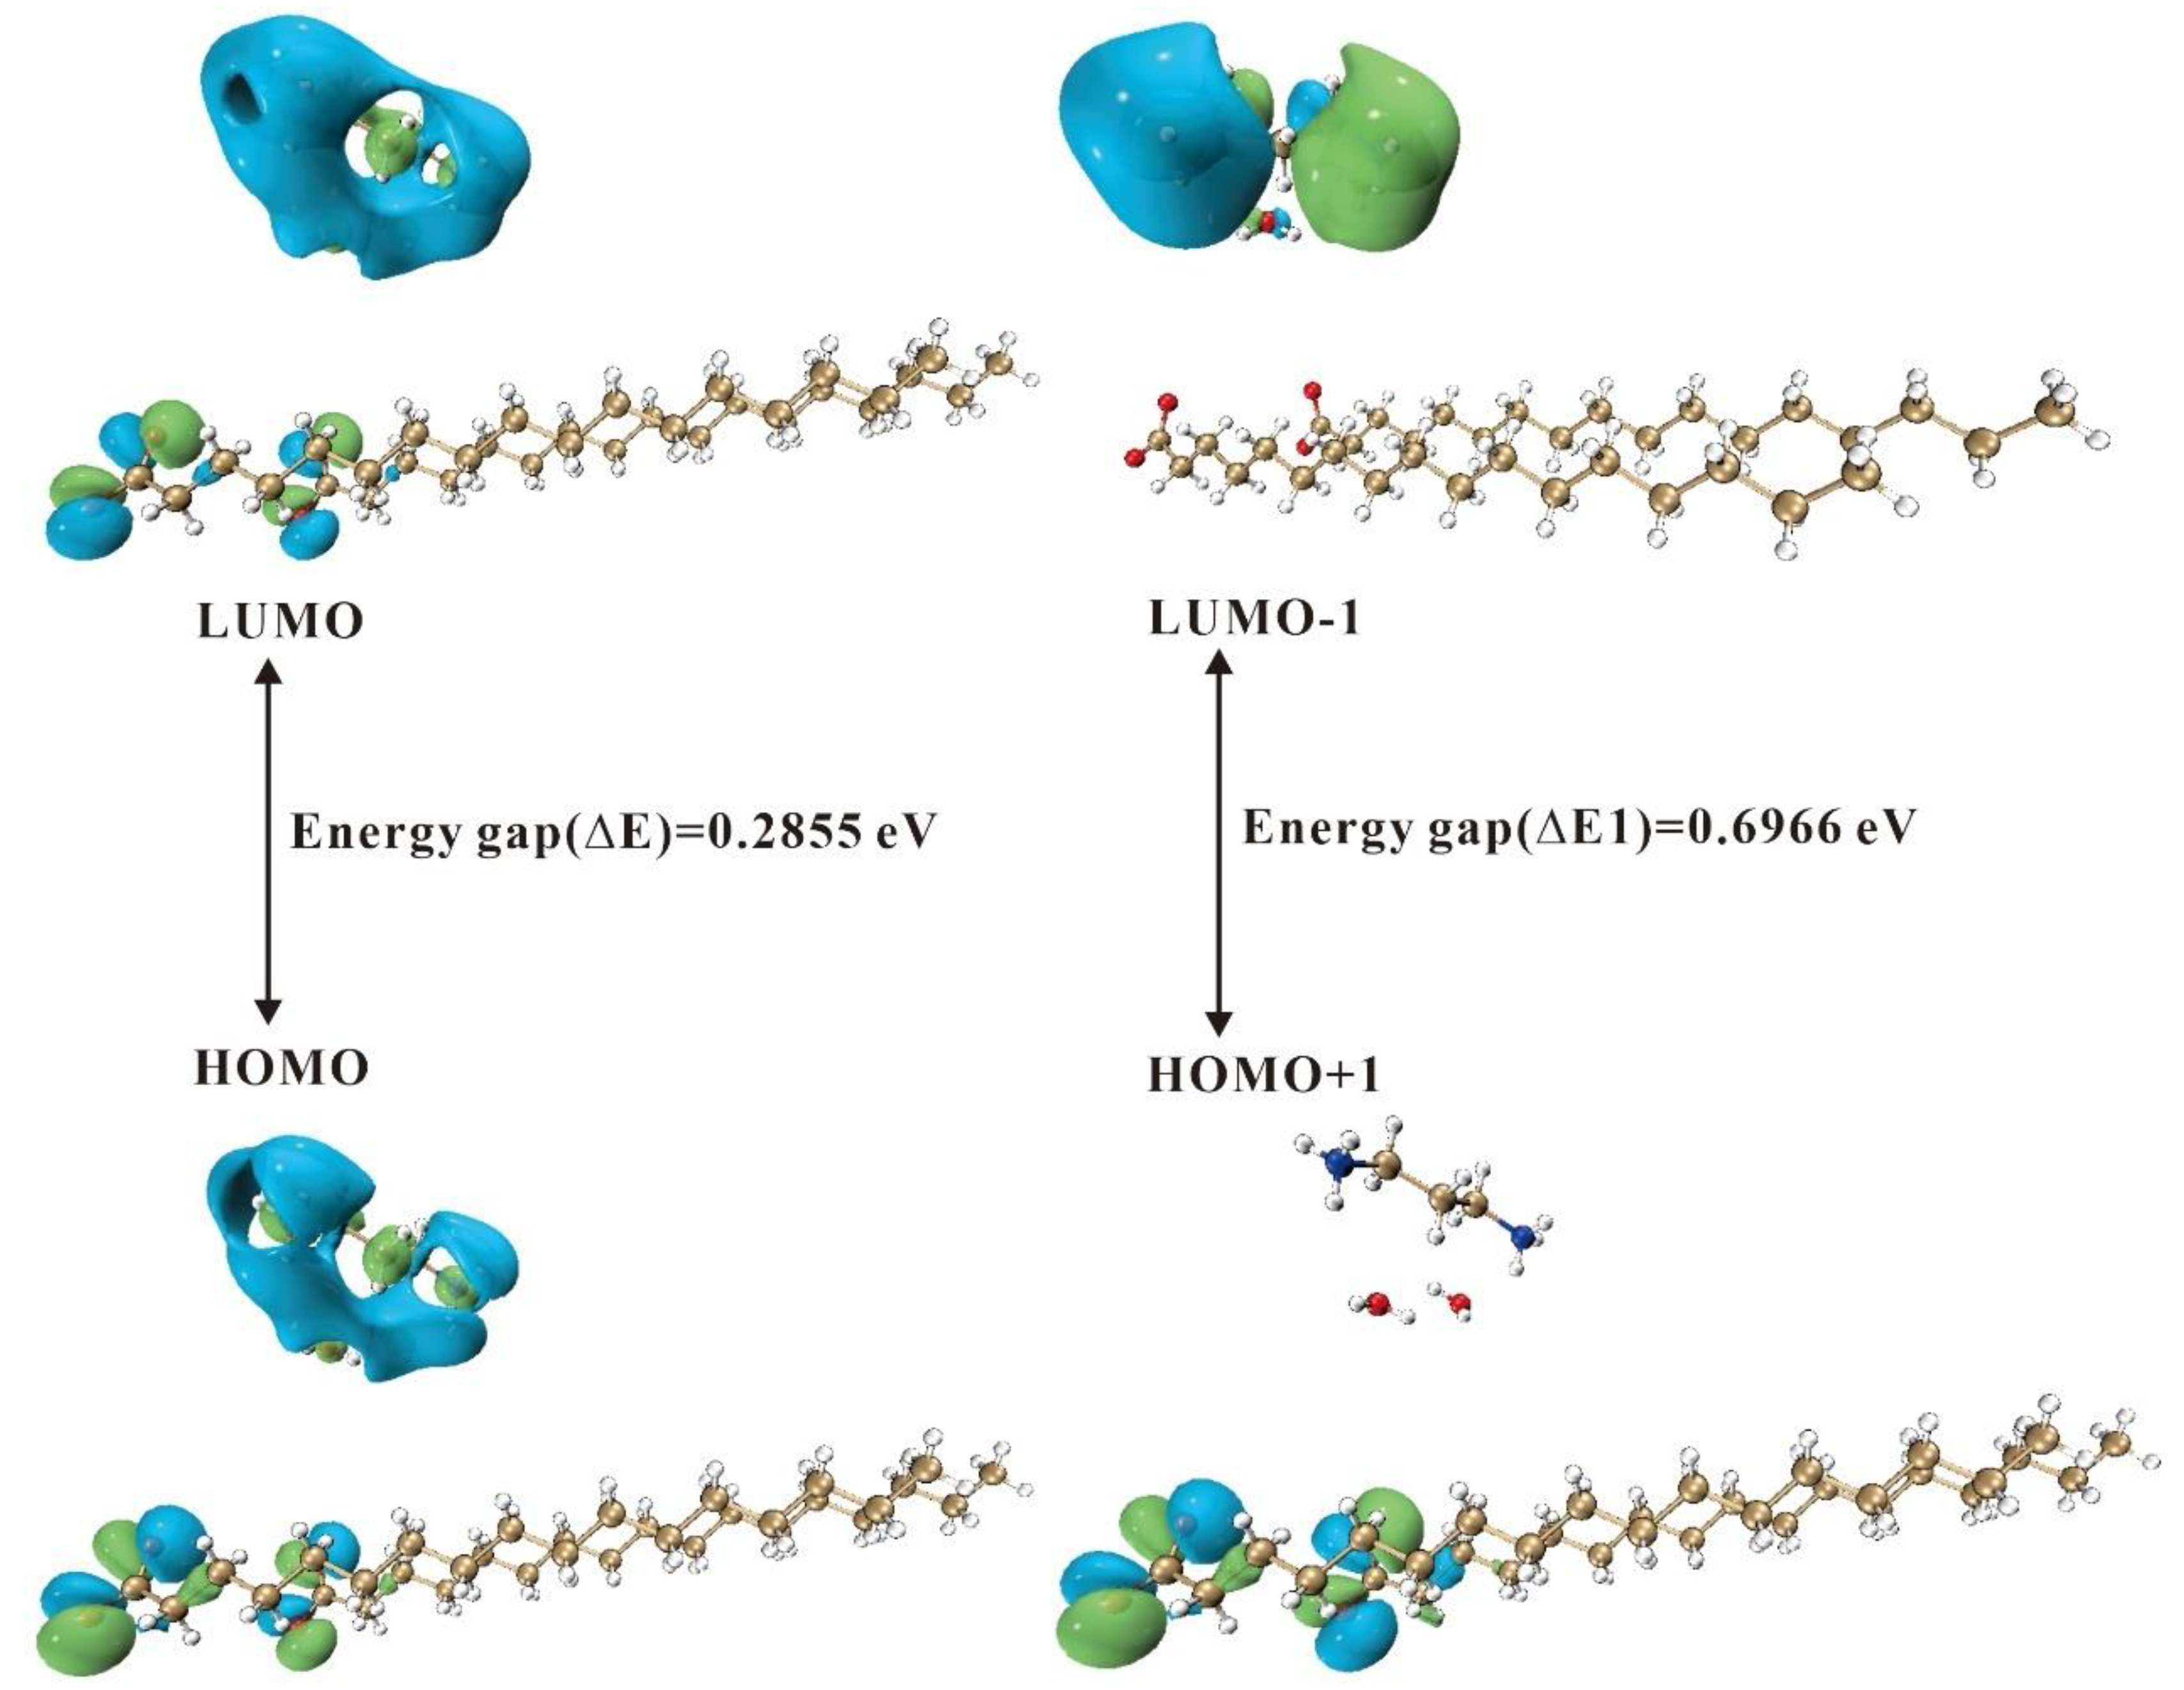
2.4.2. Frontier Molecular Orbitals
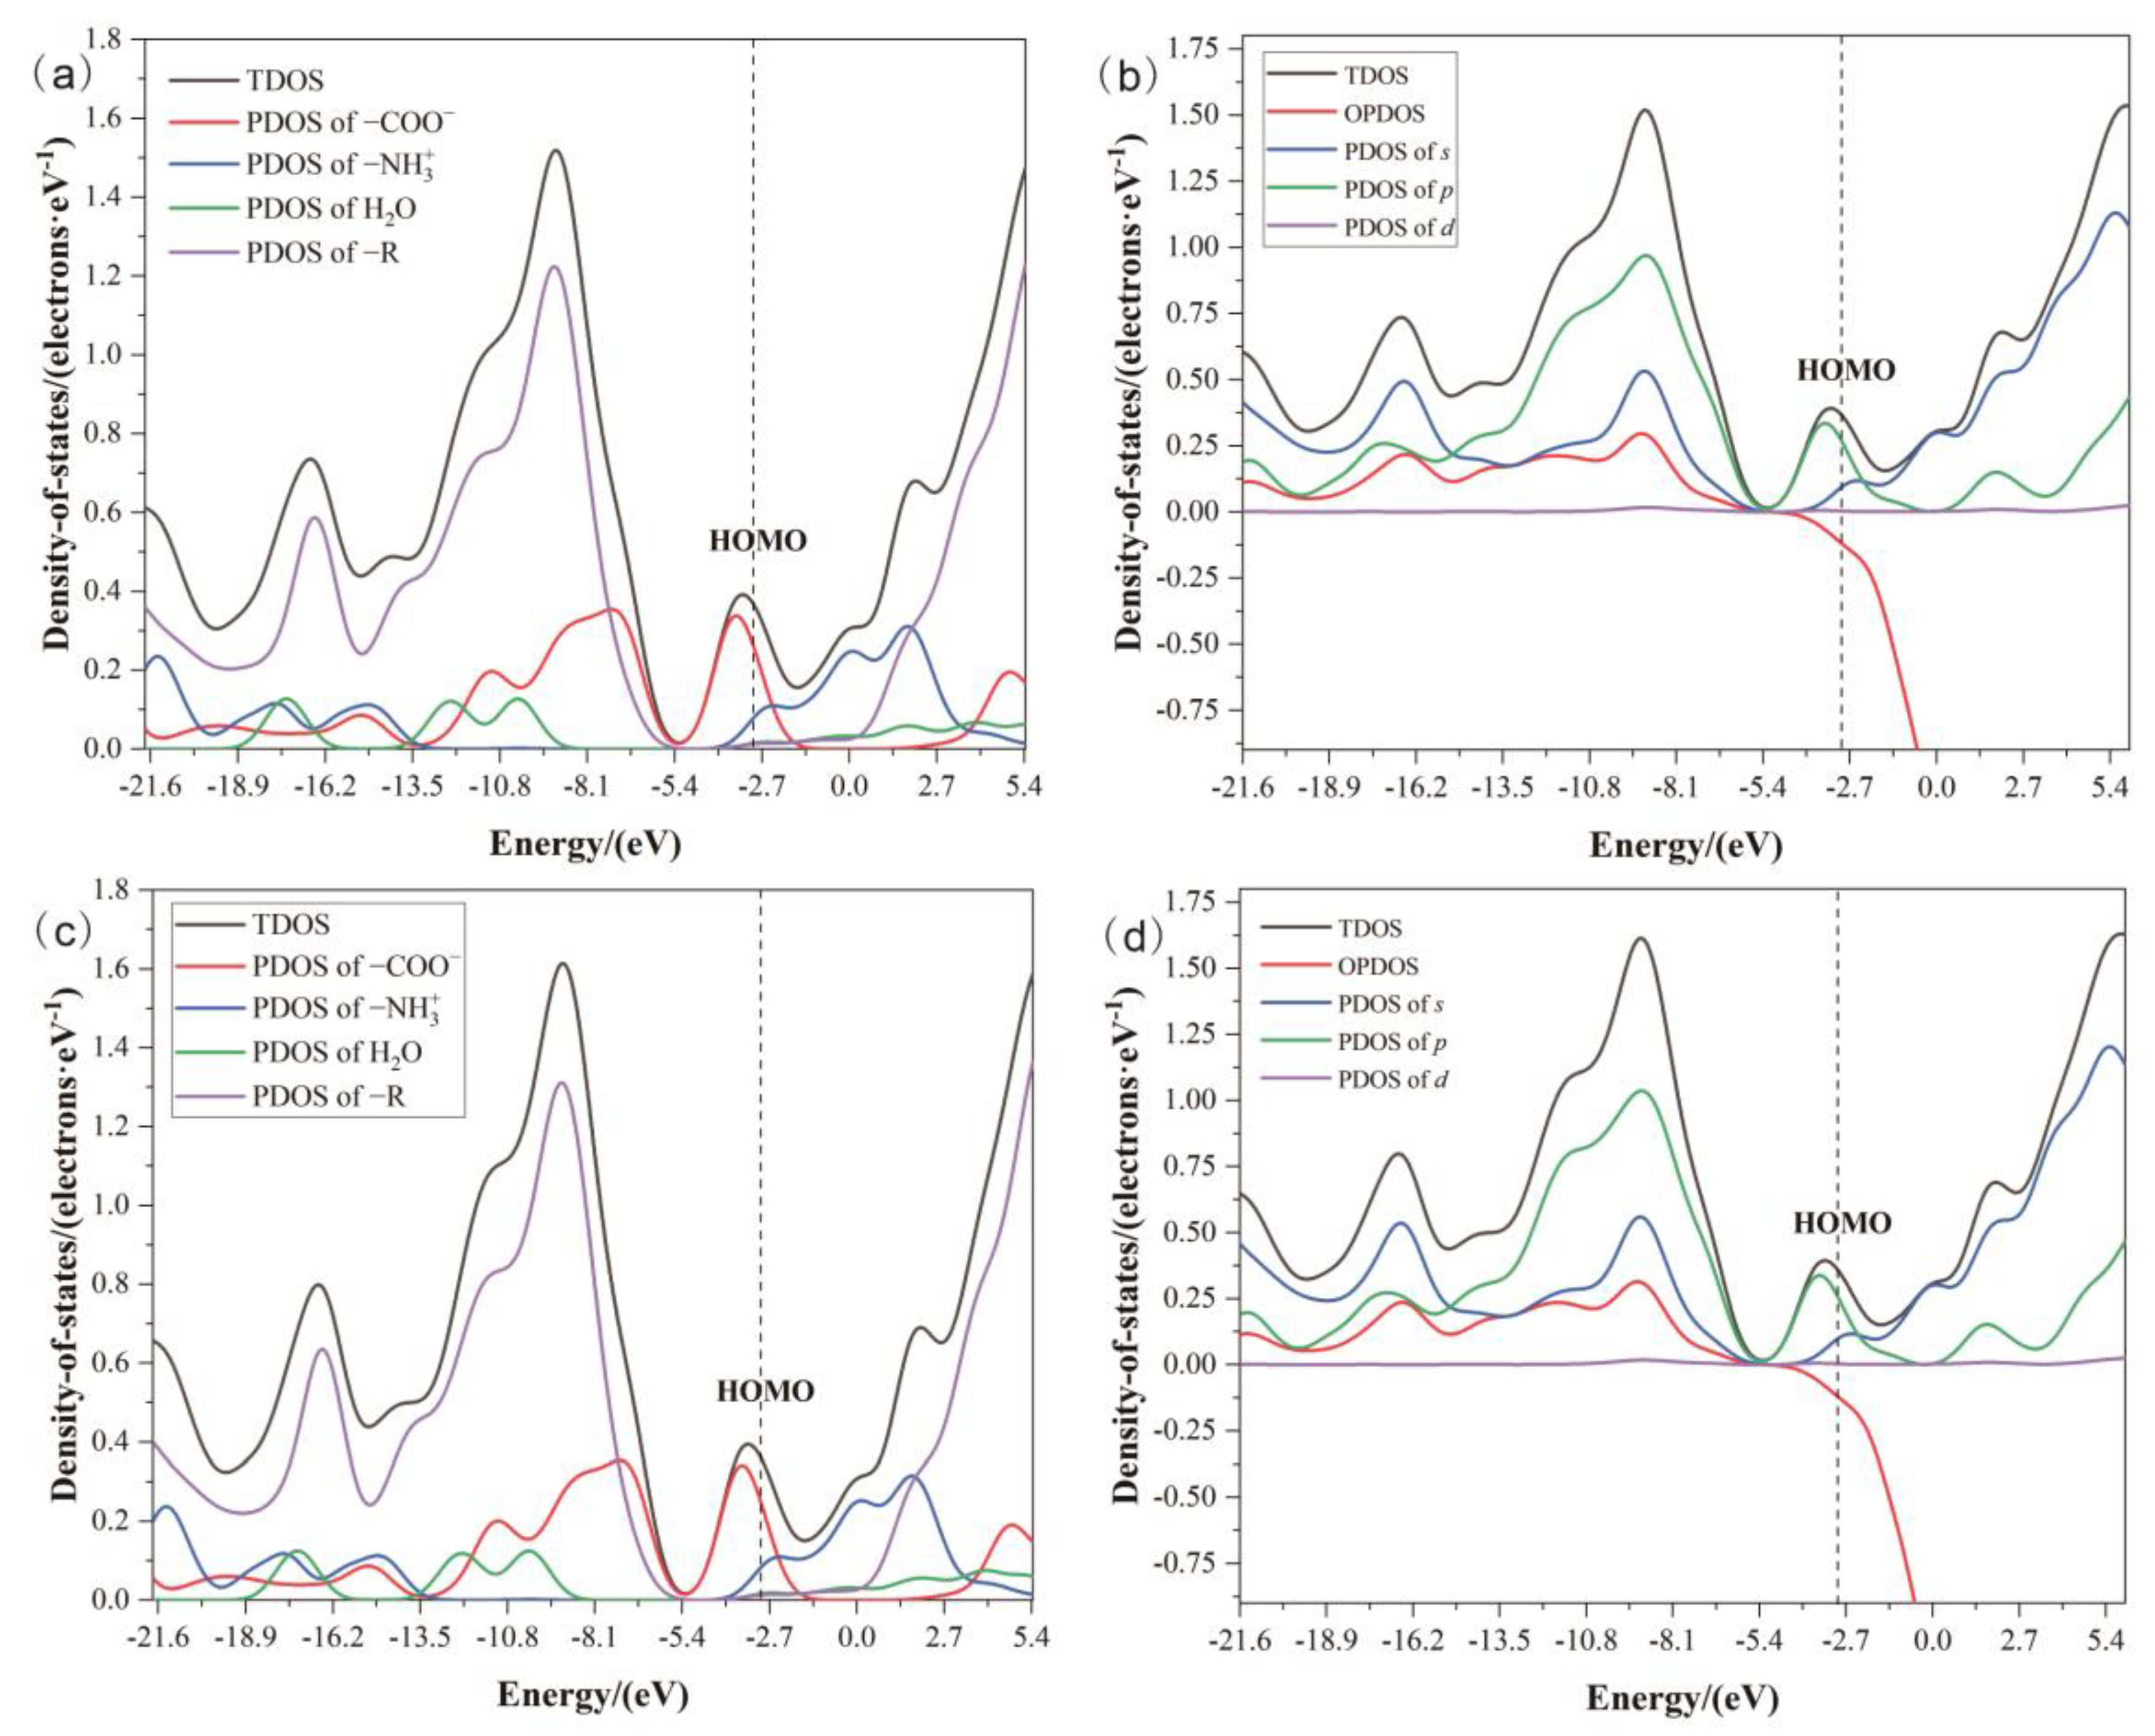
2.4.3. Density of States
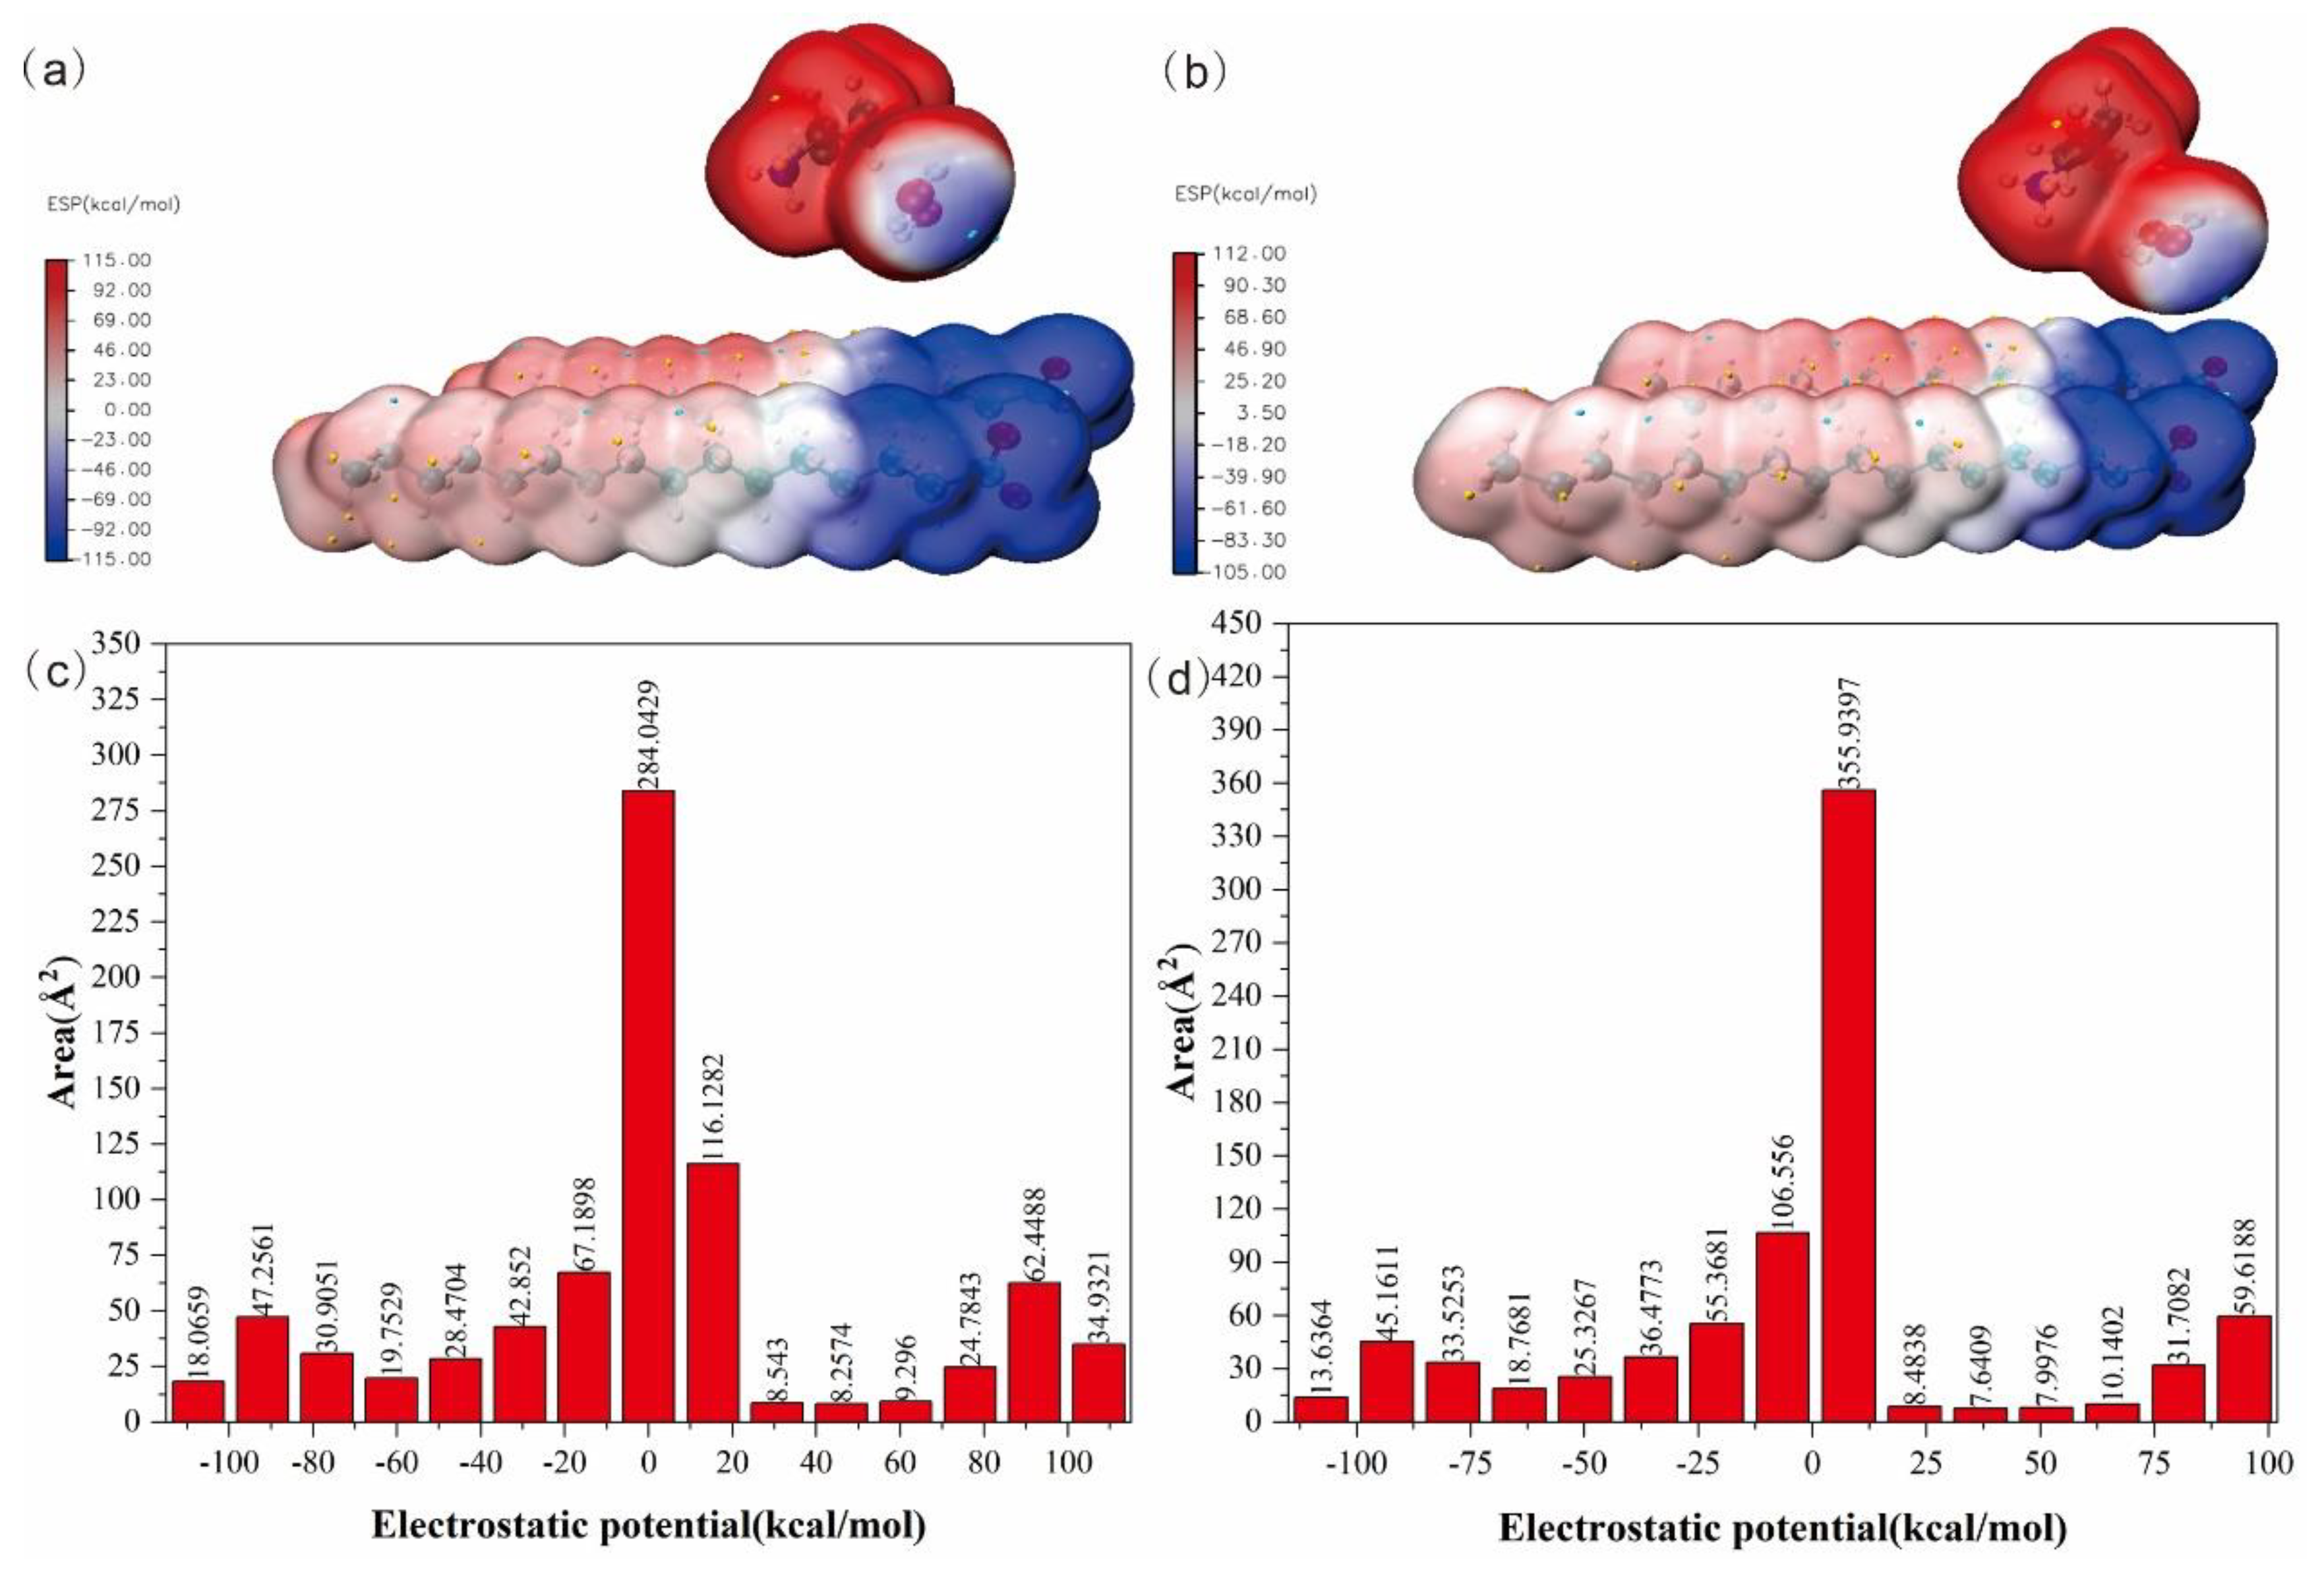
2.4.4. Molecular Electrostatic Potential
3. Materials Methods
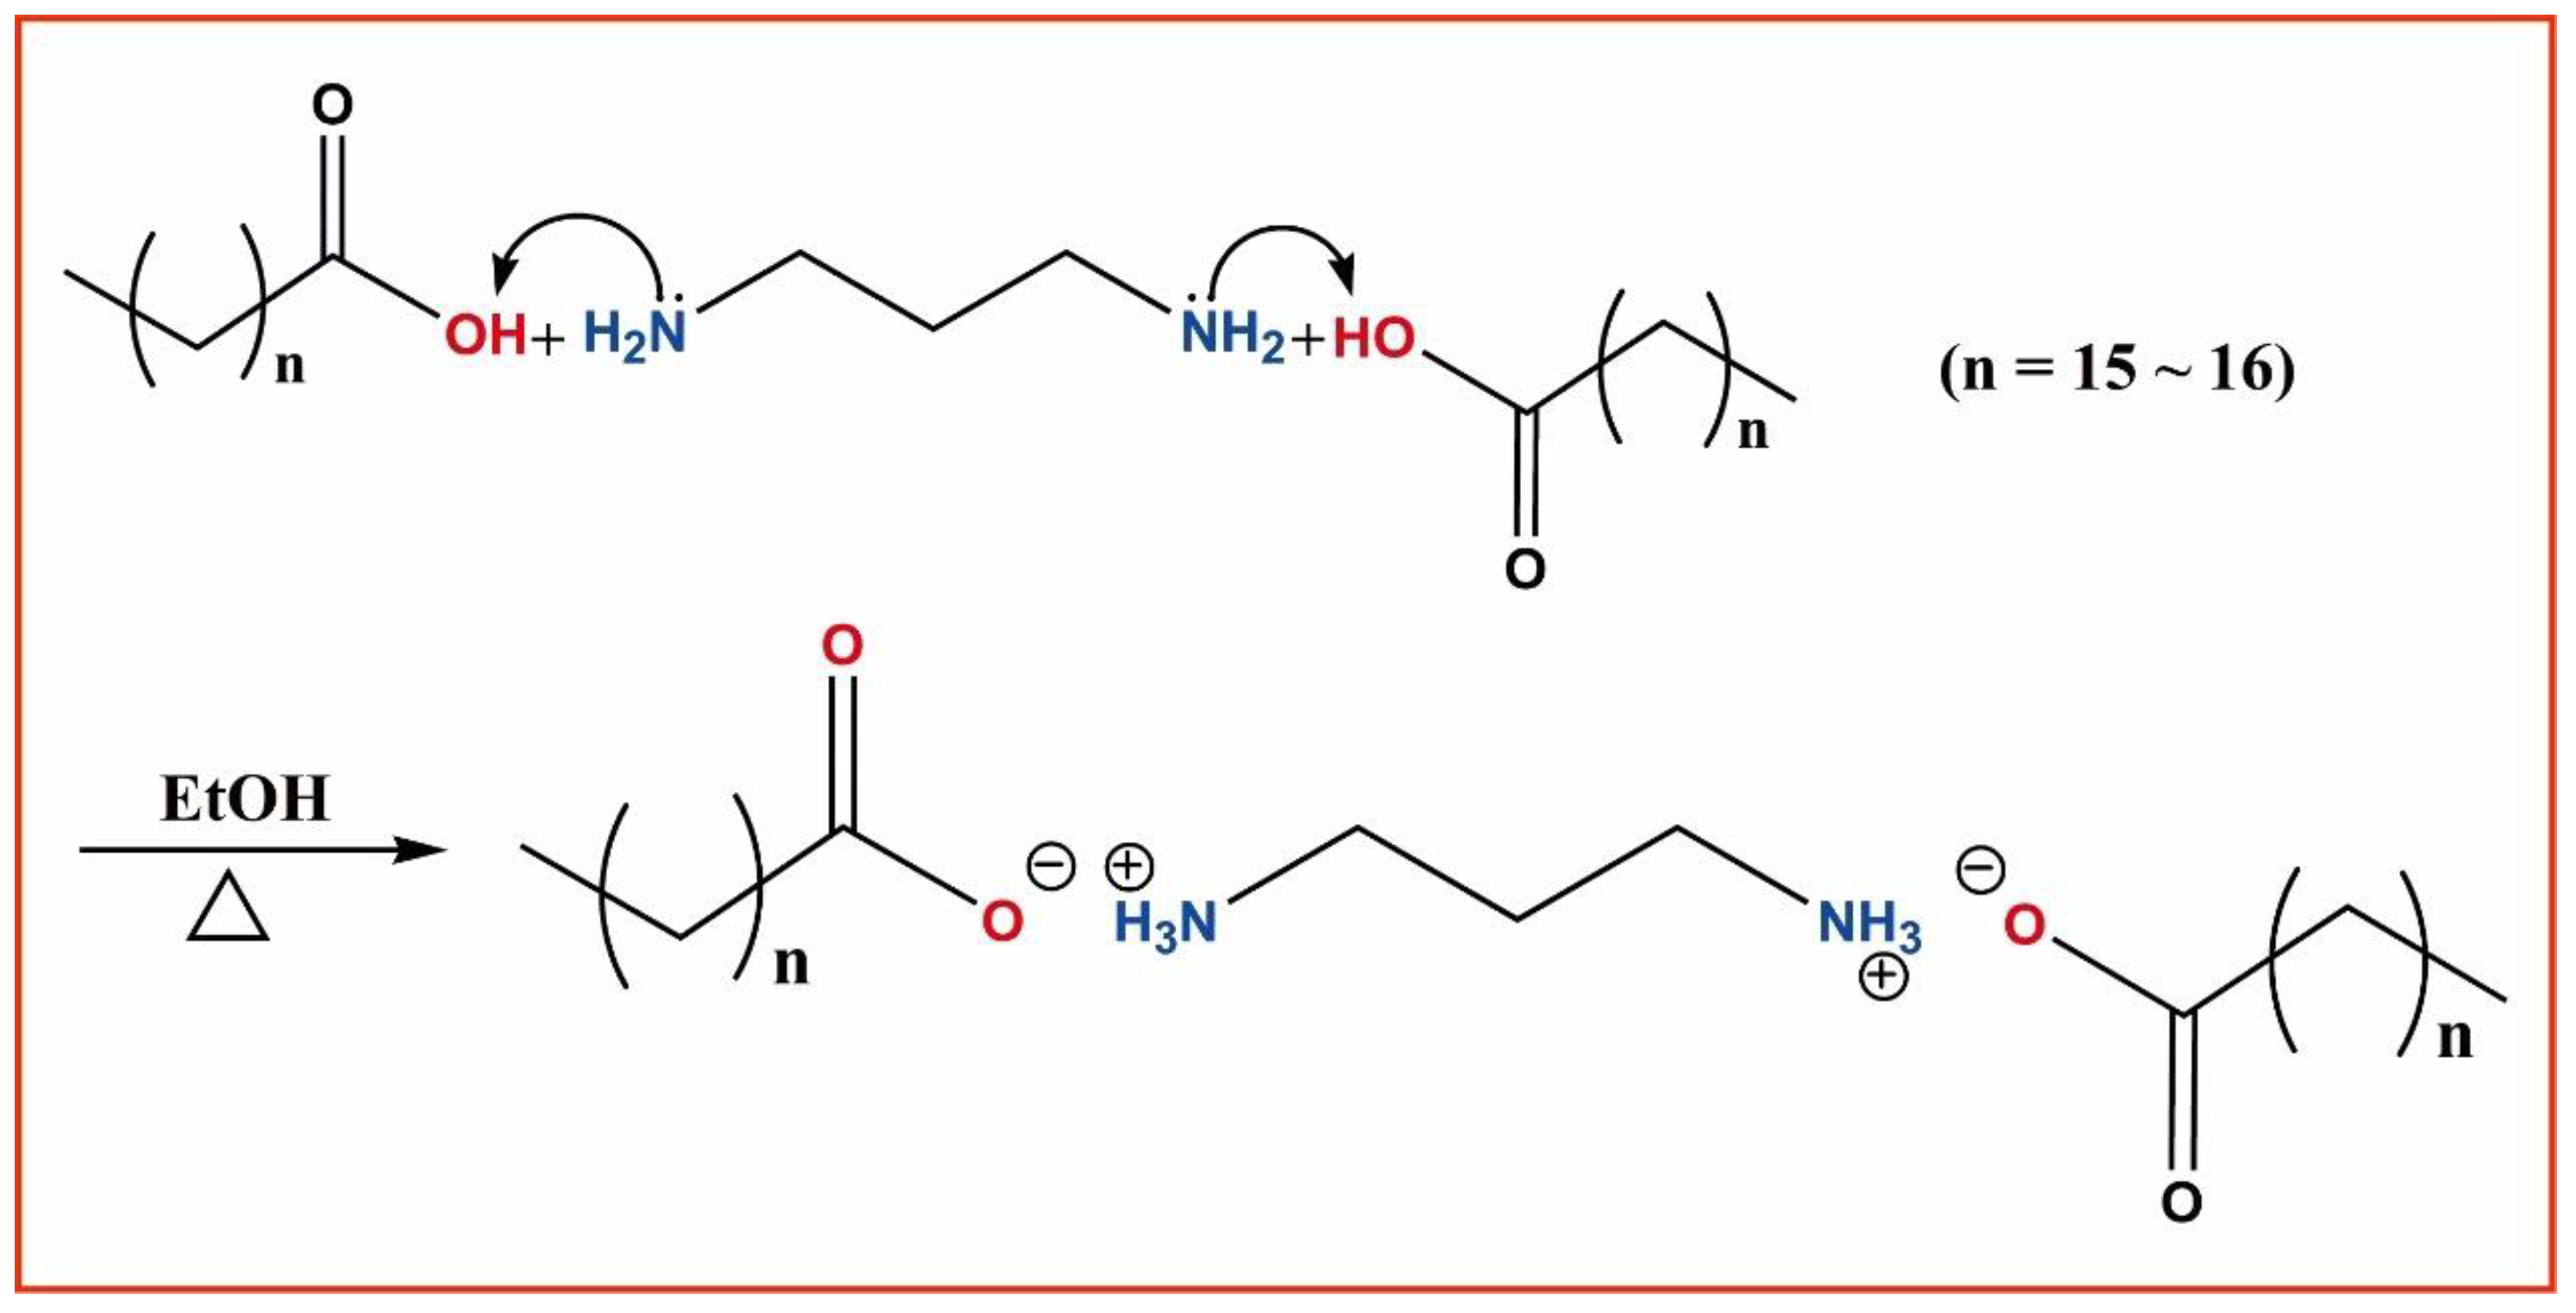
3.1. Sample Synthesis and Instruments
3.2. Basic Experimental Data
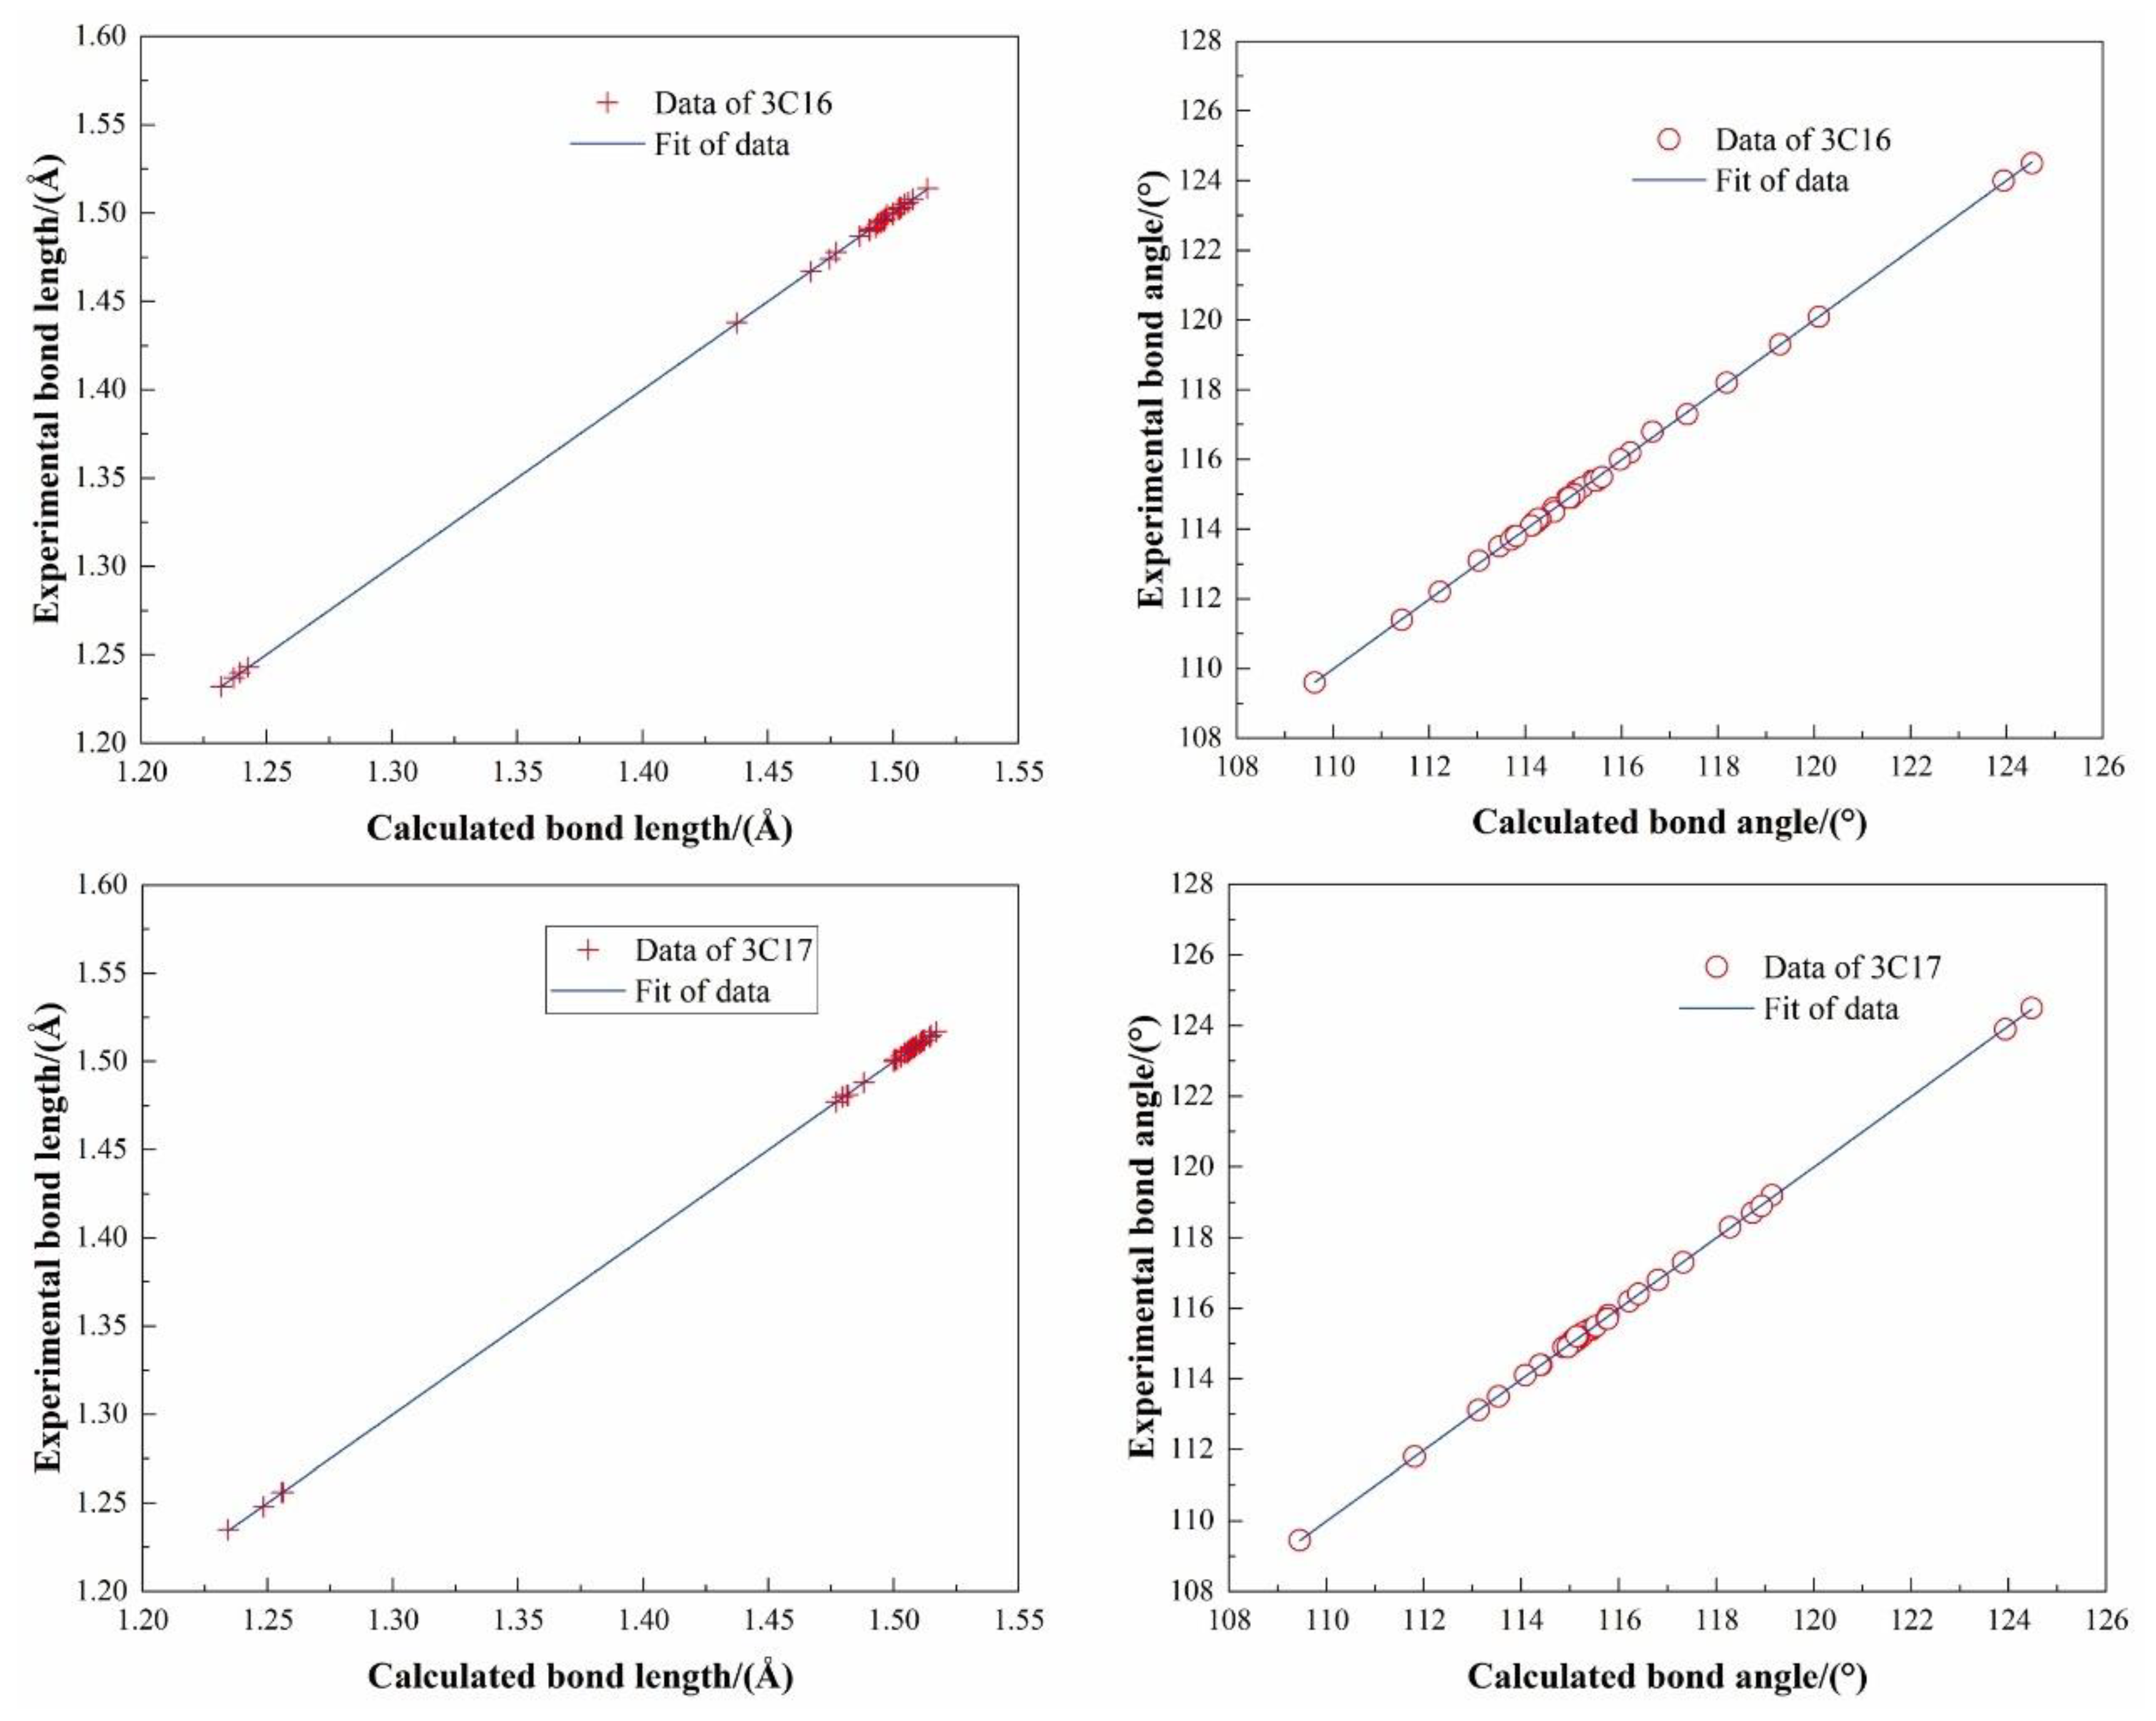
3.3. X-ray Crystallography
3.4. CrystalExplorer
3.5. Multiwfn
4. Conclusions
Supplementary Materials
Author Contributions
Funding
Institutional Review Board Statement
Informed Consent Statement
Data Availability Statement
Conflicts of Interest
References
- Takamizawa, S.; Takasaki, Y. Versatile Shape Recoverability of Odd-Numbered Saturated Long-Chain Fatty Acid Crystals. Cryst. Growth Des. 2019, 19, 1912–1920. [Google Scholar] [CrossRef]
- Lemaitre, R.N.; King, I.B. Very long-chain saturated fatty acids and diabetes and cardiovascular disease. Curr. Opin. Lipidol. 2022, 33, 76–82. [Google Scholar] [CrossRef] [PubMed]
- Jimbo, H.; Takagi, K.; Hirashima, T.; Nishiyama, Y.; Wada, H. Long-Chain Saturated Fatty Acids, Palmitic and Stearic Acids, Enhance the Repair of Photosystem II. Int. J. Mol. Sci. 2020, 21, 7059–7067. [Google Scholar] [CrossRef] [PubMed]
- Lemaitre, R.N.; McKnight, B.; Sotoodehnia, N.; Fretts, A.M.; Qureshi, W.T.; Song, X.; King, I.B.; Sitlani, C.M.; Siscovick, D.S.; Psaty, B.M.; et al. Circulating Very Long-Chain Saturated Fatty Acids and Heart Failure: The Cardiovascular Health Study. J. Am. Heart Assoc. 2018, 7, e010019. [Google Scholar] [CrossRef]
- Perminova, L.V.; Kovalenko, G.A.; Chukanov, N.V.; Patrushev, Y.V. Enzymatic esterification of saturated fatty acids with aliphatic alcohols as an alternative method of a low-temperature synthesis of esters. Russ. Chem. Bull. 2017, 66, 2194–2197. [Google Scholar] [CrossRef]
- Zhong, N.; Gui, Z.; Xu, L.; Huang, J.; Hu, K.; Gao, Y.; Zhang, X.; Xu, Z.; Su, J.; Li, B. Solvent-free enzymatic synthesis of 1,3-Diacylglycerols by direct esterification of glycerol with saturated fatty acids. Lipids Health Dis. 2013, 12, 65. [Google Scholar] [CrossRef]
- Tan, X.-J.; Li, H.-M.; Peng, Q.-X.; Zhou, H.; Chen, Y.-S.; Lu, Y.-Y.; Yan, R.-A. Enzymatic acylation of lutein with a series of saturated fatty acid vinyl esters and the thermal stability and anti-lipid oxidation properties of the acylated derivatives. J. Food Sci. 2021, 86, 5240–5252. [Google Scholar] [CrossRef]
- Matemu, A.O.; Kayahara, H.; Murasawa, H.; Katayama, S.; Nakamura, S. Improved emulsifying properties of soy proteins by acylation with saturated fatty acids. Food Chem. 2011, 124, 596–602. [Google Scholar] [CrossRef]
- Tajima, T.; Kurihara, H.; Fuchigami, T. Development of an Electrolytic System for Non-Kolbe Electrolysis Based on the Acid−Base Reaction between Carboxylic Acids as a Substrate and Solid-Supported Bases. J. Am. Chem. Soc. 2007, 129, 6680–6681. [Google Scholar] [CrossRef] [PubMed]
- Baba, Y.; Yatagai, T.; Harada, T.; Kawase, Y. Hydroxyl radical generation in the photo-Fenton process: Effects of carboxylic acids on iron redox cycling. Chem. Eng. J. 2015, 277, 229–241. [Google Scholar] [CrossRef]
- Ignatchenko, A.V.; Cohen, A.J. Reversibility of the catalytic ketonization of carboxylic acids and of beta-keto acids decarboxylation. Catal. Commun. 2018, 111, 104–107. [Google Scholar] [CrossRef]
- Shi, J.; Yuan, T.; Zheng, M.; Wang, X. Metal-Free Heterogeneous Semiconductor for Visible-Light Photocatalytic Decarboxylation of Carboxylic Acids. ACS Catal. 2021, 11, 3040–3047. [Google Scholar] [CrossRef]
- Adili, A.; Korpusik, A.B.; Seidel, D.; Sumerlin, B.S. Photocatalytic Direct Decarboxylation of Carboxylic Acids to Derivatize or Degrade Polymers. Angew. Chem. Int. Ed. 2022, 61, e202209085. [Google Scholar] [CrossRef] [PubMed]
- Kahwaji, S.; White, M.A. Prediction of the properties of eutectic fatty acid phase change materials. Thermochim. Acta 2018, 660, 94–100. [Google Scholar] [CrossRef]
- Leskovac, V.; Trivić, S.; Peričin, D.; Popović, M.; Kandrač, J. Thermodynamics of Fatty Acid Degradation. J. Phys. Chem. B 2010, 114, 16422–16426. [Google Scholar] [CrossRef] [PubMed]
- Noël, J.A.; Kreplak, L.; Getangama, N.N.; de Bruyn, J.R.; White, M.A. Supercooling and Nucleation of Fatty Acids: Influence of Thermal History on the Behavior of the Liquid Phase. J. Phys. Chem. B 2018, 122, 12386–12395. [Google Scholar] [CrossRef] [PubMed]
- Nazarychev, V.M.; Glova, A.D.; Larin, S.V.; Lyulin, A.V.; Lyulin, S.V.; Gurtovenko, A.A. Cooling-Rate Computer Simulations for the Description of Crystallization of Organic Phase-Change Materials. Int. J. Mol. Sci. 2022, 23, 14567–14582. [Google Scholar] [CrossRef] [PubMed]
- Anand, A.; Kant, K.; Shukla, A.; Chen, C.-R.; Sharma, A. Thermal Stability and Reliability Test of Some Saturated Fatty Acids for Low and Medium Temperature Thermal Energy Storage. Energies 2021, 14, 4509–4530. [Google Scholar] [CrossRef]
- Kant, K.; Shukla, A.; Sharma, A. Performance evaluation of fatty acids as phase change material for thermal energy storage. J. Energy Storage 2016, 6, 153–162. [Google Scholar] [CrossRef]
- Yan, Q.; Liu, C.; Zhang, J. Experimental study on thermal conductivity of composite phase change material of fatty acid and paraffin. Mater. Res. Express 2019, 6, 065507. [Google Scholar] [CrossRef]
- Ghadim, H.B.; Shahbaz, K.; Al-Shannaq, R.; Farid, M.M. Binary mixtures of fatty alcohols and fatty acid esters as novel solid-liquid phase change materials. Int. J. Energy Res. 2019, 43, 8536–8547. [Google Scholar] [CrossRef]
- Kant, K.; Shukla, A.; Sharma, A. Ternary mixture of fatty acids as phase change materials for thermal energy storage applications. Energy Rep. 2016, 2, 274–279. [Google Scholar] [CrossRef]
- Yuan, Y.; Zhang, N.; Tao, W.; Cao, X.; He, Y. Fatty acids as phase change materials: A review. Renew. Sust. Energ. Rev. 2014, 29, 482–498. [Google Scholar] [CrossRef]
- Zhao, Y.; Zhang, X.; Hua, W. Review of preparation technologies of organic composite phase change materials in energy storage. J. Mol. Liq. 2021, 336, 115923. [Google Scholar] [CrossRef]
- Işık, S.; Yıldız, C. Improving thermal energy storage efficiency of solar collector tanks by placing phase change materials in novel finned-type cells. Therm. Sci. Eng. Prog. 2020, 19, 100618. [Google Scholar] [CrossRef]
- Sharma, S.; Micheli, L.; Chang, W.; Tahir, A.A.; Reddy, K.S.; Mallick, T.K. Nano-enhanced Phase Change Material for thermal management of BICPV. Appl. Energy 2017, 208, 719–733. [Google Scholar] [CrossRef]
- Pintaldi, S.; Sethuvenkatraman, S.; White, S.; Rosengarten, G. Energetic evaluation of thermal energy storage options for high efficiency solar cooling systems. Appl. Energy 2017, 188, 160–177. [Google Scholar] [CrossRef]
- Li, M.Y.; Li, B.; Liu, C.; Su, S.; Xiao, H.; Zhu, C. Design and experimental investigation of a phase change energy storage air-type solar heat pump heating system. Appl. Therm. Eng. 2020, 179, 115506. [Google Scholar] [CrossRef]
- Merlin, K.; Soto, J.; Delaunay, D.; Traonvouez, L. Industrial waste heat recovery using an enhanced conductivity latent heat thermal energy storage. Appl. Energy 2016, 183, 491–503. [Google Scholar] [CrossRef]
- Dal Magro, F.; Savino, S.; Meneghetti, A.; Nardin, G. Coupling waste heat extraction by phase change materials with superheated steam generation in the steel industry. Energy 2017, 137, 1107–1118. [Google Scholar] [CrossRef]
- Thakar, R.; Bhosle, S.; Lahane, S. Design of Heat Exchanger for Waste Heat Recovery from Exhaust Gas of Diesel Engine. Procedia Manuf. 2018, 20, 372–376. [Google Scholar] [CrossRef]
- Pandiyarajan, V.; Chinna Pandian, M.; Malan, E.; Velraj, R.; Seeniraj, R.V. Experimental investigation on heat recovery from diesel engine exhaust using finned shell and tube heat exchanger and thermal storage system. Appl. Energy 2011, 88, 77–87. [Google Scholar] [CrossRef]
- Deng, Y.; Li, J.; Qian, T.; Guan, W.; Wang, X. Preparation and Characterization of KNO3/Diatomite Shape-Stabilized Composite Phase Change Material for High Temperature Thermal Energy Storage. J. Mater. Sci. Technol. 2017, 33, 198–203. [Google Scholar] [CrossRef]
- Oró, E.; Miró, L.; Farid, M.M.; Martin, V.; Cabeza, L.F. Energy management and CO2 mitigation using phase change materials (PCM) for thermal energy storage (TES) in cold storage and transport. Int. J. Refrig. 2014, 42, 26–35. [Google Scholar] [CrossRef]
- Topor, A.; Liu, D.; Maxim, C.; Novitchi, G.; Train, C.; AlOthman, Z.A.; Al-Kahtani, A.A.S.; Ungur, L.; Ho, L.T.A.; Chibotaru, L.F.; et al. Design of FeIII–LnIII binuclear complexes using compartmental ligands: Synthesis, crystal structures, magnetic properties, and ab initio analysis. J. Mater. Chem. C 2021, 9, 10912–10926. [Google Scholar] [CrossRef]
- Ni, G.-H.; Sun, Y.-X.; Ji, C.-X.; Jin, Y.-W.; Liu, M.-Y.; Zhao, J.-P.; Liu, F.-C. Plasticity and Ferroelasticity Transitions of Molecular Complex [(C4H9N2)2][Fe3O(O2CH)9] on Heating and Cooling near Room Temperature. Cryst. Growth Des. 2022, 22, 3428–3434. [Google Scholar] [CrossRef]
- Zhgun, A.A.; Eldarov, M.A. Spermidine and 1,3-Diaminopropane Have Opposite Effects on the Final Stage of Cephalosporin C Biosynthesis in High-Yielding Acremonium chrysogenum Strain. Int. J. Mol. Sci. 2022, 23, 14625–14648. [Google Scholar] [CrossRef]
- Gondor, O.K.; Tajti, J.; Hamow, K.Á.; Majláth, I.; Szalai, G.; Janda, T.; Pál, M. Polyamine Metabolism under Different Light Regimes in Wheat. Int. J. Mol. Sci. 2021, 22, 11717–11743. [Google Scholar] [CrossRef]
- Mumtaz, S.; Iqbal, S.; Shah, M.; Hussain, R.; Rahim, F.; Rehman, W.; Khan, S.; Abid, O.-u.-R.; Rasheed, L.; Dera, A.A.; et al. New Triazinoindole Bearing Benzimidazole/Benzoxazole Hybrids Analogs as Potent Inhibitors of Urease: Synthesis, In Vitro Analysis and Molecular Docking Studies. Molecules 2022, 27, 6580–6598. [Google Scholar] [CrossRef]
- Khan, S.; Iqbal, S.; Taha, M.; Rahim, F.; Shah, M.; Ullah, H.; Bahadur, A.; Alrbyawi, H.; Dera, A.A.; Alahmdi, M.I.; et al. Synthesis, In Vitro Biological Evaluation and In Silico Molecular Docking Studies of Indole Based Thiadiazole Derivatives as Dual Inhibitor of Acetylcholinesterase and Butyrylchloinesterase. Molecules 2022, 27, 7368–7379. [Google Scholar] [CrossRef]
- Zhang, L.-J.; Di, Y.-Y.; Dou, J.-M. Crystal structure and standard molar enthalpy of formation of ethylenediamine dilauroleate (C12H24O2)2C2N2H8(s). J. Therm. Anal. Calorim. 2013, 114, 359–363. [Google Scholar] [CrossRef]
- Khan, S.; Ullah, H.; Taha, M.; Rahim, F.; Sarfraz, M.; Iqbal, R.; Iqbal, N.; Hussain, R.; Ali Shah, S.A.; Ayub, K.; et al. Synthesis, DFT Studies, Molecular Docking and Biological Activity Evaluation of Thiazole-Sulfonamide Derivatives as Potent Alzheimer’s Inhibitors. Molecules 2023, 28, 559–585. [Google Scholar] [PubMed]
- Alghuwainem, Y.A.A.; El-Lateef, H.M.A.; Khalaf, M.M.; Amer, A.A.; Abdelhamid, A.A.; Alzharani, A.A.; Alfarsi, A.; Shaaban, S.; Gouda, M.; Abdou, A. Synthesis, DFT, Biological and Molecular Docking Analysis of Novel Manganese(II), Iron(III), Cobalt(II), Nickel(II), and Copper(II) Chelate Complexes Ligated by 1-(4-Nitrophenylazo)-2-naphthol. Int. J. Mol. Sci. 2022, 23, 15614–15633. [Google Scholar] [CrossRef] [PubMed]
- Bykov, A.V.; Shestimerova, T.A.; Bykov, M.A.; Osminkina, L.A.; Kuznetsov, A.N.; Gontcharenko, V.E.; Shevelkov, A.V. Synthesis, Crystal, and Electronic Structure of (HpipeH2)2[Sb2I10](I2), with I2 Molecules Linking Sb2X10 Dimers into a Polymeric Anion: A Strategy for Optimizing a Hybrid Compound’s Band Gap. Int. J. Mol. Sci. 2022, 24, 2201–2215. [Google Scholar]
- Li, L.; Zhang, Q.; Wei, Y.; Wang, Q.; Wang, W. Theoretical Study on the Gas Phase and Gas–Liquid Interface Reaction Mechanism of Criegee Intermediates with Glycolic Acid Sulfate. Int. J. Mol. Sci. 2023, 24, 3355–3365. [Google Scholar]
- Ali, A.; Din, Z.U.; Ibrahim, M.; Ashfaq, M.; Muhammad, S.; Gull, D.; Tahir, M.N.; Rodrigues-Filho, E.; Al-Sehemi, A.G.; Suleman, M. Acid catalyzed one-pot approach towards the synthesis of curcuminoid systems: Unsymmetrical diarylidene cycloalkanones, exploration of their single crystals, optical and nonlinear optical properties. RSC Adv. 2023, 13, 4476–4494. [Google Scholar] [CrossRef]
- Askerov, R.K.; Ashfaq, M.; Chipinsky, E.V.; Osmanov, V.K.; Tahir, M.N.; Baranov, E.V.; Fukin, G.K.; Khrustalev, V.N.; Nazarov, R.H.; Borisova, G.N.; et al. Synthesis, crystal structure, exploration of the supramolecular assembly through Hirshfeld surface analysis and bactericidal activity of the cadmium organometallic complexes obtained from the heterocyclic ligand. Results Chem. 2022, 4, 100600. [Google Scholar] [CrossRef]
- Jelsch, C.; Ejsmont, K.; Huder, L. The enrichment ratio of atomic contacts in crystals, an indicator derived from the Hirshfeld surface analysis. IUCrJ 2014, 1, 119–128. [Google Scholar] [CrossRef]
- Ali, A.; Ashfaq, M.; Din, Z.U.; Ibrahim, M.; Khalid, M.; Assiri, M.A.; Riaz, A.; Tahir, M.N.; Rodrigues-Filho, E.; Imran, M.; et al. Synthesis, Structural, and Intriguing Electronic Properties of Symmetrical Bis-Aryl-α,β-Unsaturated Ketone Derivatives. ACS Omega 2022, 7, 39294–39309. [Google Scholar] [CrossRef]
- Faihan, A.S.; Aziz, N.M.; Ashfaq, M.; Hassan, W.M.I.; Al-Jibori, S.A.; Al-Janabi, A.S.; Tahir, M.N.; Al-barwari, A.S.M.O. Synthesis, characterization, and x-ray crystallography of unexpected chloro-substitution on 1-(4-chlorophenyl)-3-phenylthiourea platinum(II) complex with tertiary phosphine ligand. J. Mol. Struct. 2022, 1270, 133985. [Google Scholar] [CrossRef]
- Akhileshwari, P.; Kiran, K.R.; Sridhar, M.A.; Sadashiva, M.P.; Lokanath, N.K. Synthesis, crystal structure characterization, Hirshfeld surface analysis, and Quantum chemical computations of Ethyl 5-(thiophene-2-carbonyl)thiazole-4-carboxylate. J. Mol. Struct. 2021, 1242, 130747. [Google Scholar] [CrossRef]
- Turner, M.J.; Thomas, S.P.; Shi, M.W.; Jayatilaka, D.; Spackman, M.A. Energy frameworks: Insights into interaction anisotropy and the mechanical properties of molecular crystals. Chem. Commun. 2015, 51, 3735–3738. [Google Scholar] [CrossRef]
- Verma, P.; Truhlar, D.G. Status and Challenges of Density Functional Theory. Trends Chem. 2020, 2, 302–318. [Google Scholar] [CrossRef]
- Bartlett, R.J. Adventures in DFT by a wavefunction theorist. J. Chem. Phys. 2019, 151, 160901. [Google Scholar] [CrossRef] [PubMed]
- Frisch, M.J.; Trucks, G.W.; Schlegel, H.B.; Scuseria, G.E.; Robb, M.A.; Cheeseman, J.R.; Scalmani, G.; Barone, V.; Petersson, G.A.; Nakatsuji, H.; et al. Gaussian 16 Rev. B.01; Gaussian, Inc.: Wallingford, UK, 2016. [Google Scholar]
- Elzupir, A.O.; Ali, M.K.M.; Hussein, R.K.; Ibrahem, M.A.; Al-Muhanna, M.K.; Ibnaouf, K.H. Molecular structure, frontier molecular orbital and spectral analysis of dimethylamino chalcones efficient lasing dyes. J. Mol. Struct. 2019, 1178, 285–289. [Google Scholar] [CrossRef]
- Kumar, R.; Kamal, R.; Kumar, V.; Parkash, J. Bifunctionalization of α,β-unsaturated diaryl ketones into α-aryl-β,β-ditosyloxy ketones: Single crystal XRD, DFT, FMOs, molecular electrostatic potential, hirshfeld surface analysis, and 3D-energy frameworks. J. Mol. Struct. 2022, 1250, 131754. [Google Scholar] [CrossRef]
- Guin, M.; Halder, S.; Chatterjee, S.; Konar, S. Synthesis, X-ray crystal structure of Cu(II) 1D coordination Polymer: In View of Hirshfeld surface, FMO, Molecular electrostatic potential (MEP) and Natural Bond orbital (NBO) analyses. J. Mol. Struct. 2022, 1270, 133949. [Google Scholar] [CrossRef]
- Liu, Z.; Lu, T.; Chen, Q. An sp-hybridized all-carboatomic ring, cyclo[18]carbon: Electronic structure, electronic spectrum, and optical nonlinearity. Carbon 2020, 165, 461–467. [Google Scholar] [CrossRef]
- Liu, Z.; Wang, X.; Lu, T.; Yuan, A.; Yan, X. Potential optical molecular switch: Lithium@cyclo[18]carbon complex transforming between two stable configurations. Carbon 2022, 187, 78–85. [Google Scholar] [CrossRef]
- Lin, Z.; Lu, T.; Ding, X.-L. A theoretical investigation on doping superalkali for triggering considerable nonlinear optical properties of Si12C12 nanostructure. J. Comput. Chem. 2017, 38, 1574–1582. [Google Scholar] [CrossRef]
- Manzetti, S.; Lu, T. The geometry and electronic structure of Aristolochic acid: Possible implications for a frozen resonance. J. Phys. Org. Chem. 2013, 26, 473–483. [Google Scholar] [CrossRef]
- Lu, T.; Chen, F. Quantitative analysis of molecular surface based on improved Marching Tetrahedra algorithm. J. Mol. Graph. Modell. 2012, 38, 314–323. [Google Scholar] [CrossRef]
- Zhang, J.; Lu, T. Efficient evaluation of electrostatic potential with computerized optimized code. PCCP 2021, 23, 20323–20328. [Google Scholar] [CrossRef] [PubMed]
- Lu, T.; Manzetti, S. Wavefunction and reactivity study of benzo[a]pyrene diol epoxide and its enantiomeric forms. Struct. Chem. 2014, 25, 1521–1533. [Google Scholar] [CrossRef]
- Humphrey, W.; Dalke, A.; Schulten, K. VMD: Visual molecular dynamics. J. Mol. Graph. 1996, 14, 33–38. [Google Scholar] [CrossRef]
- Sheldrick, G. A short history of SHELX. Acta Cryst. Sec A 2008, 64, 112–122. [Google Scholar] [CrossRef]
- Spackman, P.R.; Turner, M.J.; McKinnon, J.J.; Wolff, S.K.; Grimwood, D.J.; Jayatilaka, D.; Spackman, M.A. CrystalExplorer: A program for Hirshfeld surface analysis, visualization and quantitative analysis of molecular crystals. J. Appl. Crystallogr. 2021, 54, 1006–1011. [Google Scholar] [CrossRef]
- Spackman, M.A.; Jayatilaka, D. Hirshfeld surface analysis. CrystEngComm 2009, 11, 19–32. [Google Scholar] [CrossRef]
- Lu, T.; Chen, F. Multiwfn: A multifunctional wavefunction analyzer. J. Comput. Chem. 2012, 33, 580–592. [Google Scholar] [CrossRef] [PubMed]


| Empirical Formula | C35H78N2O6 | C37H82N2O6 |
|---|---|---|
| Formula weight | 622.99 | 651.04 |
| Temperature/K | 273.15 | 273(2) |
| Crystal system | triclinic | triclinic |
| Space group | P-1 | P-1 |
| a/Å | 6.6497(8) | 6.6942(13) |
| b/Å | 8.4340(9) | 8.4899(17) |
| c/Å | 35.221(4) | 37.083(7) |
| α/° | 90.747(2) | 92.15(3) |
| β/° | 90.748(2) | 93.65(3) |
| γ/° | 96.969(3) | 97.04(3) |
| Volume/Å3 | 1960.4(4) | 2085.2(7) |
| Z | 2 | 2 |
| ρcalc g/cm3 | 1.055 | 1.037 |
| μ/mm−1 | 0.07 | 0.068 |
| F(000) | 700 | 732 |
| Crystal size/mm3 | 0.44 × 0.18 × 0.07 | 0.12 × 0.11 × 0.1 |
| Radiation | MoKα (λ = 0.71073) | MoKα (λ = 0.71073) |
| 2θ range for data collection/° | 4.626 to 48.998 | 5.984 to 55.108 |
| Index ranges | −7 ≤ h ≤ 7, −9 ≤ k ≤ 9, −35 ≤ l ≤ 41 | −8 ≤ h ≤ 8, −11 ≤ k ≤ 11, −48 ≤ l ≤ 48 |
| Reflections collected | 19,122 | 44,383 |
| Independent reflections | 6446 (Rint = 0.0382, Rsigma = 0.0711) | 9598 (Rint = 0.1409, Rsigma = 0.1786) |
| Data/restraints/parameters | 6446/0/392 | 9598/0/410 |
| Goodness-of-fit on F2 | 1.12 | 0.991 |
| Final R indexes [I ≤ 2σ (I)] | R1 = 0.1128, wR2 = 0.2502 | R1 = 0.0829, wR2 = 0.1593 |
| Final R indexes (all data) | R1 = 0.1765, wR2 = 0.2793 | R1 = 0.2541, wR2 = 0.2113 |
| ∆ρmax/∆ρmin, e/Å3 | 0.21/−0.30 | 0.25/−0.19 |
| Atoms | Bond Lengths (Å) | Atoms | Bond Angles (°) | ||
|---|---|---|---|---|---|
| SCXRD | DFT | SCXRD | DFT | ||
| C1–C2 | 1.505(8) | 1.5047 | O1–C1–C2 | 116.2(5) | 116.18 |
| C1–O1 | 1.237(6) | 1.2369 | O1–C1–O2 | 124.5(5) | 124.53 |
| C1–O2 | 1.243(7) | 1.2428 | O2–C1–C2 | 119.3(5) | 119.29 |
| C2–C3 | 1.478(9) | 1.4772 | C3–C2–C1 | 117.3(6) | 117.36 |
| C3–C4 | 1.500(8) | 1.5001 | C2–C3–C4 | 115.4(6) | 115.39 |
| C4–C5 | 1.503(8) | 1.503 | C3–C4–C5 | 113.8(6) | 113.77 |
| C5–C6 | 1.494(8) | 1.4941 | C6–C5–C4 | 115.1(6) | 115.06 |
| C6–C7 | 1.496(9) | 1.4965 | C5–C6–C7 | 114.6(6) | 114.58 |
| C7–C8 | 1.495(8) | 1.495 | C8–C7–C6 | 114.9(6) | 114.95 |
| C8–C9 | 1.494(9) | 1.4941 | C9–C8–C7 | 115.2(6) | 115.19 |
| C9–C10 | 1.502(8) | 1.5023 | C8–C9–C10 | 115.4(6) | 115.45 |
| C10–C11 | 1.494(9) | 1.4939 | C11–C10–C9 | 114.2(6) | 114.22 |
| C11–C12 | 1.502(9) | 1.5021 | C10–C11–C12 | 115.0(6) | 115.02 |
| C12–C13 | 1.491(9) | 1.4906 | C13–C12–C11 | 114.5(6) | 114.60 |
| C13–C14 | 1.500(9) | 1.4999 | C12–C13–C14 | 115.4(7) | 115.48 |
| C14–C15 | 1.487(11) | 1.4867 | C15–C14–C13 | 113.8(7) | 113.77 |
| C15–C16 | 1.492(12) | 1.4930 | C14–C15–C16 | 114.9(9) | 114.87 |
| C17–C18 | 1.496(7) | 1.4961 | N2–C17–C18 | 113.5(4) | 113.46 |
| C17–N2 | 1.467(7) | 1.4672 | C17–C18–C19 | 109.6(4) | 109.62 |
| C18–C19 | 1.499(7) | 1.4999 | N1–C19–C18 | 111.4(4) | 111.43 |
| C19–N1 | 1.474(6) | 1.4747 | O3–C20–C21 | 120.1(5) | 120.10 |
| C20–C21 | 1.506(8) | 1.5061 | O4–C20–C21 | 116.0(6) | 115.97 |
| C20–O3 | 1.240(7) | 1.2394 | O4–C20–O3 | 124.0(6) | 123.94 |
| C20–O4 | 1.232(7) | 1.2319 | C22–C21–C20 | 118.2(5) | 118.18 |
| C21–C22 | 1.495(8) | 1.4952 | C21–C22–C23 | 112.2(5) | 112.22 |
| C22–C23 | 1.514(8) | 1.5136 | C24–C23–C22 | 114.1(5) | 114.14 |
| C23–C24 | 1.503(9) | 1.503 | C23–C24–C25 | 113.1(5) | 113.03 |
| C24–C25 | 1.503(8) | 1.5028 | C26–C25–C24 | 114.9(6) | 114.91 |
| C25–C26 | 1.491(9) | 1.4908 | C25–C26–C27 | 114.3(6) | 114.31 |
| C26–C27 | 1.508(8) | 1.5079 | C28–C27–C26 | 115.4(6) | 115.45 |
| C27–C28 | 1.497(9) | 1.4968 | C27–C28–C29 | 114.2(6) | 114.18 |
| C28–C29 | 1.503(9) | 1.5025 | C28–C29–C30 | 113.7(6) | 113.70 |
| C29–C30 | 1.503(9) | 1.503 | C31–C30–C29 | 114.3(6) | 114.26 |
| C30–C31 | 1.502(9) | 1.5023 | C32–C31–C30 | 114.1(7) | 114.12 |
| C31–C32 | 1.490(10) | 1.4903 | C31–C32–C33 | 115.5(7) | 115.59 |
| C32–C33 | 1.499(10) | 1.4975 | C34–C33–C32 | 113.8(8) | 113.81 |
| C33–C34 | 1.496(12) | 1.4963 | C35–C34–C33 | 116.8(10) | 116.64 |
| C34–C35 | 1.438(14) | 1.4375 | |||
| Atoms | Bond Lengths (Å) | Atoms | Bond Angles (°) | ||
|---|---|---|---|---|---|
| SCXRD | DFT | SCXRD | DFT | ||
| C1–C2 | 1.510(3) | 1.5105 | O1–C1–C2 | 118.7(2) | 118.74 |
| C1–O1 | 1.256(3) | 1.2563 | O2–C1–C2 | 117.3(2) | 117.32 |
| C1–O2 | 1.248(3) | 1.2484 | O2–C1–O1 | 123.9(2) | 123.93 |
| C2–C3 | 1.480(3) | 1.4794 | C3–C2–C1 | 118.3(2) | 118.28 |
| C3–C4 | 1.508(3) | 1.5080 | C2–C3–C4 | 116.2(2) | 116.21 |
| C4–C5 | 1.501(3) | 1.5013 | C5–C4–C3 | 114.4(2) | 114.41 |
| C5–C6 | 1.506(3) | 1.5058 | C4–C5–C6 | 115.4(2) | 115.44 |
| C6–C7 | 1.503(3) | 1.5031 | C7–C6–C5 | 115.1(2) | 115.13 |
| C7–C8 | 1.512(3) | 1.5121 | C6–C7–C8 | 115.1(2) | 115.15 |
| C8–C9 | 1.501(3) | 1.5003 | C9–C8–C7 | 115.2(2) | 115.22 |
| C9–C10 | 1.505(3) | 1.5046 | C8–C9–C10 | 115.4(2) | 115.39 |
| C10–C11 | 1.507(3) | 1.5067 | C9–C10–C11 | 115.3(2) | 115.26 |
| C11–C12 | 1.514(3) | 1.5144 | C10–C11–C12 | 115.2(2) | 115.24 |
| C12–C13 | 1.508(3) | 1.5075 | C13–C12–C11 | 115.0(2) | 115.02 |
| C13–C14 | 1.510(3) | 1.5105 | C12–C13–C14 | 114.4(2) | 114.38 |
| C14–C15 | 1.503(4) | 1.5028 | C15–C14–C13 | 115.1(2) | 115.12 |
| C15–C16 | 1.501(4) | 1.5006 | C16–C15–C14 | 114.9(3) | 114.87 |
| C16–C17 | 1.511(4) | 1.5111 | C15–C16–C17 | 115.1(3) | 115.06 |
| C18–C19 | 1.508(3) | 1.5083 | N2–C18–C19 | 113.12(18) | 113.1170 |
| C18–N2 | 1.481(3) | 1.4818 | C18–C19–C20 | 109.45(18) | 109.4540 |
| C19–C20 | 1.517(3) | 1.5171 | N1–C20–C19 | 111.81(17) | 111.8120 |
| C20–N1 | 1.477(3) | 1.4770 | O3–C21–C22 | 119.2(2) | 119.14 |
| C21–C22 | 1.511(3) | 1.5111 | O4–C21–C22 | 116.4(2) | 116.40 |
| C21–O3 | 1.256(3) | 1.2557 | O4–C21–O3 | 124.5(2) | 124.47 |
| C21–O4 | 1.235(3) | 1.2342 | C23–C22–C21 | 118.9(2) | 118.93 |
| C22–C23 | 1.505(3) | 1.5056 | C22–C23–C24 | 113.5(2) | 113.53 |
| C23–C24 | 1.515(3) | 1.5149 | C25–C24–C23 | 115.5(2) | 115.53 |
| C24–C25 | 1.500(3) | 1.5001 | C24–C25–C26 | 114.1(2) | 114.08 |
| C25–C26 | 1.509(3) | 1.5091 | C27–C26–C25 | 115.8(2) | 115.79 |
| C26–C27 | 1.505(3) | 1.5044 | C26–C27–C28 | 115.1(2) | 115.11 |
| C27–C28 | 1.506(3) | 1.5064 | C27–C28–C29 | 115.7(2) | 115.75 |
| C28–C29 | 1.507(3) | 1.507 | C28–C29–C30 | 115.2(2) | 115.18 |
| C29–C30 | 1.508(3) | 1.5083 | C31–C30–C29 | 115.2(2) | 115.15 |
| C30–C31 | 1.503(3) | 1.5033 | C30–C31–C32 | 115.0(2) | 114.99 |
| C31–C32 | 1.512(3) | 1.5115 | C33–C32–C31 | 115.0(2) | 115.04 |
| C32–C33 | 1.507(3) | 1.507 | C34–C33–C32 | 114.9(2) | 114.95 |
| C33–C34 | 1.505(3) | 1.5049 | C33–C34–C35 | 115.7(3) | 115.77 |
| C34–C35 | 1.506(4) | 1.5059 | C36–C35–C34 | 115.2(3) | 115.14 |
| C35–C36 | 1.488(4) | 1.4881 | C37–C36–C35 | 116.8(3) | 116.80 |
| C36–C37 | 1.481(4) | 1.4814 | |||
| D-H…A | d(D-H)/Å | d(H-A)/Å | d(D-A)/Å | D-H-A/° |
|---|---|---|---|---|
| N1-H1A…O3 i | 0.89 | 1.89 | 2.756(7) | 162.8 |
| N1-H1B…O1 ii | 0.89 | 1.91 | 2.797(6) | 175.4 |
| N1-H1C…O4 iii | 0.89 | 1.8 | 2.687(7) | 172.2 |
| N2-H2C…O1 iii | 0.89 | 1.93 | 2.811(6) | 172.8 |
| N2-H2D…O2 iv | 0.89 | 1.91 | 2.800(6) | 174.2 |
| N2-H2E…O2 i | 0.89 | 2.13 | 2.976(6) | 157.8 |
| O5-H5C…O2 v | 0.85 | 1.91 | 2.745(6) | 168.1 |
| O5-H5D…O3 v | 0.85 | 1.99 | 2.798(5) | 158.5 |
| O6-H6C…O5 | 0.85 | 2.06 | 2.863 | 157.2 |
| O6-H6D…O3 i | 0.85 | 2.07 | 2.867(6) | 156.4 |
| D-H…A | d(D-H)/Å | d(H-A)/Å | d(D-A)/Å | D-H-A/° |
|---|---|---|---|---|
| N1-H1A…O3 i | 0.89 | 1.91 | 2.773(3) | 161.5 |
| N1-H1B…O2 ii | 0.89 | 1.92 | 2.806(2) | 175.9 |
| N1-H1C…O4 iii | 0.89 | 1.82 | 2.705(3) | 174.6 |
| N2-H2C…O2 iii | 0.89 | 1.94 | 2.824(3) | 170.3 |
| N2-H2D…O1 iv | 0.89 | 1.93 | 2.813(2) | 169.2 |
| O5-H5C…O1 v | 0.85 | 1.93 | 2.773(2) | 172.4 |
| O5-H5D…O3 v | 0.85 | 1.99 | 2.823(2) | 166.4 |
| O6-H6C…O3 v | 0.85 | 2.05 | 2.891(3) | 168.5 |
| O6-H6D…O5 vi | 0.85 | 2.09 | 2.872(3) | 152.6 |
| N | Symop | R | E_ele | E_pol | E_dis | E_rep | E_tot |
|---|---|---|---|---|---|---|---|
| 1 | x, y, z | 8.43 | 1.5 | −0.1 | −1.6 | 0 | 0 |
| 1 | −x, −y, −z | 18.75 | 0 | −0.3 | 0 | 0 | −0.2 |
| 1 | −x, −y, −z | 19.01 | 0 | −0.0 | 0 | 0 | −0.0 |
| 2 | x, y, z | 6.65 | −0.6 | −1.1 | −31.1 | 10.6 | −20.8 |
| 1 | −x, −y, −z | 17.29 | 0 | −0.0 | 0 | 0 | −0.0 |
| 1 | x, y, z | 13.3 | 0 | −0.0 | 0 | 0 | −0.0 |
| 1 | −x, −y, −z | 18.03 | 0 | −0.0 | 0 | 0 | −0.0 |
| 1 | - | 6.83 | 0 | 0 | 0 | 0 | 0 |
| 1 | - | 10.66 | −0.6 | −1.1 | −31.1 | 10.6 | −20.8 |
| 1 | - | 10.45 | 0 | −0.0 | 0 | 0 | −0.0 |
| 1 | - | 20.71 | 0 | 0 | 0 | 0 | 0 |
| 1 | - | 7.64 | −0.6 | −1.1 | −31.1 | 10.6 | −20.8 |
| 1 | - | 18.77 | 0 | −0.0 | 0 | 0 | −0.0 |
| 1 | - | 5.99 | 1 | −0.1 | −1.9 | 0 | −0.8 |
| 1 | - | 20.25 | 0 | −0.0 | 0 | 0 | −0.0 |
| 1 | - | 11.86 | 0 | −0.0 | 0 | 0 | −0.0 |
| 1 | - | 20.21 | 0 | −0.0 | 0 | 0 | −0.0 |
| 1 | - | 12.63 | 1.5 | −0.1 | −1.6 | 0 | 0 |
| 1 | - | 11.37 | 0 | −0.0 | 0 | 0 | −0.0 |
| 1 | - | 10.78 | 0 | 0 | 0 | 0 | 0 |
| 1 | - | 8.96 | 0 | 0 | 0 | 0 | 0 |
| 1 | x, y, z | 10.09 | 1 | −0.1 | −1.9 | 0 | −0.8 |
| 1 | −x, −y, −z | 17.41 | 0 | −0.0 | 0 | 0 | −0.0 |
| 1 | −x, −y, −z | 20.96 | 0 | −0.0 | 0 | 0 | −0.0 |
| 1 | - | 8.53 | 0 | −0.0 | 0 | 0 | −0.0 |
| 1 | - | 12.56 | 0 | −0.0 | 0 | 0 | −0.0 |
| 1 | - | 9.32 | −0.6 | −1.1 | −31.1 | 10.6 | −20.8 |
| 1 | - | 19.08 | 0 | −0.0 | 0 | 0 | −0.0 |
| 1 | - | 4.41 | 1.5 | −0.1 | −1.6 | 0 | 0 |
| 1 | - | 22.25 | 0 | −0.0 | 0 | 0 | −0.0 |
| 1 | - | 11.36 | 0.6 | −0.0 | −0.3 | 0 | 0.3 |
| 1 | - | 11.9 | 0 | −0.0 | 0 | 0 | −0.0 |
| 1 | - | 7.35 | −0.6 | −1.1 | −31.1 | 10.6 | −20.8 |
| 1 | - | 10.73 | 0 | −0.0 | 0 | 0 | −0.0 |
| 1 | - | 10.02 | −0.6 | −1.1 | −31.1 | 10.6 | −20.8 |
| 1 | - | 8.56 | 0 | −0.0 | 0 | 0 | −0.0 |
| N | Symop | R | E_ele | E_pol | E_dis | E_rep | E_tot |
|---|---|---|---|---|---|---|---|
| 1 | x, y, z | 8.49 | 1.5 | −0.1 | −1.7 | 0 | −0.1 |
| 1 | −x, −y, −z | 20.08 | 0 | −0.3 | 0 | 0 | −0.2 |
| 1 | −x, −y, −z | 20.18 | 0 | −0.0 | 0 | 0 | −0.0 |
| 2 | x, y, z | 6.69 | −0.4 | −1.1 | −31.1 | 9.5 | −21.4 |
| 1 | −x, −y, −z | 18.24 | 0 | −0.0 | 0 | 0 | −0.0 |
| 1 | x, y, z | 13.39 | 0 | −0.0 | 0 | 0 | −0.0 |
| 1 | −x, −y, −z | 18.66 | 0 | −0.0 | 0 | 0 | −0.0 |
| 1 | - | 7.38 | 0 | 0 | 0 | 0 | 0 |
| 1 | - | 11.08 | −0.4 | −1.1 | −31.1 | 9.5 | −21.4 |
| 1 | - | 11.1 | 0 | −0.0 | 0 | 0 | −0.0 |
| 1 | - | 22.01 | 0 | −0.0 | 0 | 0 | −0.0 |
| 1 | - | 7.7 | −0.4 | −1.1 | −31.1 | 9.5 | −21.4 |
| 1 | - | 19.89 | 0 | −0.0 | 0 | 0 | −0.0 |
| 1 | - | 5.99 | 1 | −0.1 | −2.0 | 0 | −0.9 |
| 1 | - | 21.16 | 0 | −0.0 | 0 | 0 | −0.0 |
| 1 | - | 13.39 | 0 | −0.0 | 0 | 0 | −0.0 |
| 1 | - | 19.91 | 0 | −0.0 | 0 | 0 | −0.0 |
| 1 | - | 11.91 | 0 | −0.0 | 0 | 0 | −0.0 |
| 1 | - | 20.85 | 0 | −0.0 | 0 | 0 | −0.0 |
| 1 | - | 13.34 | 1.5 | −0.1 | −1.7 | 0 | −0.1 |
| 1 | - | 11.62 | 0 | −0.0 | 0 | 0 | −0.0 |
| 1 | - | 11.33 | 0 | −0.0 | 0 | 0 | −0.0 |
| 1 | - | 11.2 | 0 | 0 | 0 | 0 | 0 |
| 1 | x, y, z | 10.15 | 1 | −0.1 | −2.0 | 0 | −0.9 |
| 1 | −x, −y, −z | 18.52 | 0 | −0.0 | 0 | 0 | −0.0 |
| 1 | −x, −y, −z | 21.28 | 0 | −0.0 | 0 | 0 | −0.0 |
| 1 | - | 8.69 | 0 | −0.0 | 0 | 0 | −0.0 |
| 1 | - | 12.73 | 0 | −0.0 | 0 | 0 | −0.0 |
| 1 | - | 9.4 | −0.4 | −1.1 | −31.1 | 9.5 | −21.4 |
| 1 | - | 4.42 | 1.5 | −0.1 | −1.7 | 0 | −0.1 |
| 1 | - | 22.06 | 0 | −0.0 | 0 | 0 | −0.0 |
| 1 | - | 22.61 | 0 | −0.0 | 0 | 0 | −0.0 |
| 1 | - | 11.9 | 0.6 | −0.0 | −0.3 | 0 | 0.3 |
| 1 | - | 11.92 | 0 | −0.0 | 0 | 0 | −0.0 |
| 1 | - | 7.71 | −0.4 | −1.1 | −31.1 | 9.5 | −21.4 |
| 1 | - | 11.02 | 0 | −0.0 | 0 | 0 | −0.0 |
| 1 | - | 8.76 | −0.4 | −1.1 | −31.1 | 9.5 | −21.4 |
| 1 | - | 10.42 | 0 | −0.0 | 0 | 0 | −0.0 |
| Descriptors | 3C16, Values (eV) | 3C17, Values (eV) |
|---|---|---|
| ELUMO | −2.6476 | −2.7088 |
| EHOMO | −2.9334 | −2.9943 |
| Energy gap (∆E) | 0.2858 | 0.2855 |
| Ionization energy (I) | 2.9334 | 2.9943 |
| Electron affinity (A) | 2.6476 | 2.7088 |
| Electronegativity (χ) | 2.7905 | 2.8516 |
| Chemical potential (μ) | −2.7905 | −2.8516 |
| Global hardness (η) | 0.1429 | 0.1428 |
| Global softness (σ) | 3.4990 | 3.5014 |
| Electrophilicity index (ω) | 27.2459 | 28.4821 |
Disclaimer/Publisher’s Note: The statements, opinions and data contained in all publications are solely those of the individual author(s) and contributor(s) and not of MDPI and/or the editor(s). MDPI and/or the editor(s) disclaim responsibility for any injury to people or property resulting from any ideas, methods, instructions or products referred to in the content. |
© 2023 by the authors. Licensee MDPI, Basel, Switzerland. This article is an open access article distributed under the terms and conditions of the Creative Commons Attribution (CC BY) license (https://creativecommons.org/licenses/by/4.0/).
Share and Cite
Ke, Z.; Fan, X.; Di, Y.; Chen, F.; Han, X.; Yang, K.; Li, B. A Comprehensive Investigation into the Crystallology, Molecule, and Quantum Chemistry Properties of Two New Hydrous Long-Chain Dibasic Ammonium Salts CnH2n+8N2O6 (n = 35 and 37). Int. J. Mol. Sci. 2023, 24, 5467. https://doi.org/10.3390/ijms24065467
Ke Z, Fan X, Di Y, Chen F, Han X, Yang K, Li B. A Comprehensive Investigation into the Crystallology, Molecule, and Quantum Chemistry Properties of Two New Hydrous Long-Chain Dibasic Ammonium Salts CnH2n+8N2O6 (n = 35 and 37). International Journal of Molecular Sciences. 2023; 24(6):5467. https://doi.org/10.3390/ijms24065467
Chicago/Turabian StyleKe, Zengbo, Xinhui Fan, Youying Di, Fengying Chen, Xi Han, Ke Yang, and Bing Li. 2023. "A Comprehensive Investigation into the Crystallology, Molecule, and Quantum Chemistry Properties of Two New Hydrous Long-Chain Dibasic Ammonium Salts CnH2n+8N2O6 (n = 35 and 37)" International Journal of Molecular Sciences 24, no. 6: 5467. https://doi.org/10.3390/ijms24065467