
Neurodegenerative Changes in the Brains of the 5xFAD Alzheimer’s Disease Model Mice Investigated by High-Field and High-Resolution Magnetic Resonance Imaging and Multi-Nuclei Magnetic Resonance Spectroscopy


Abstract
:1. Introduction
2. Results
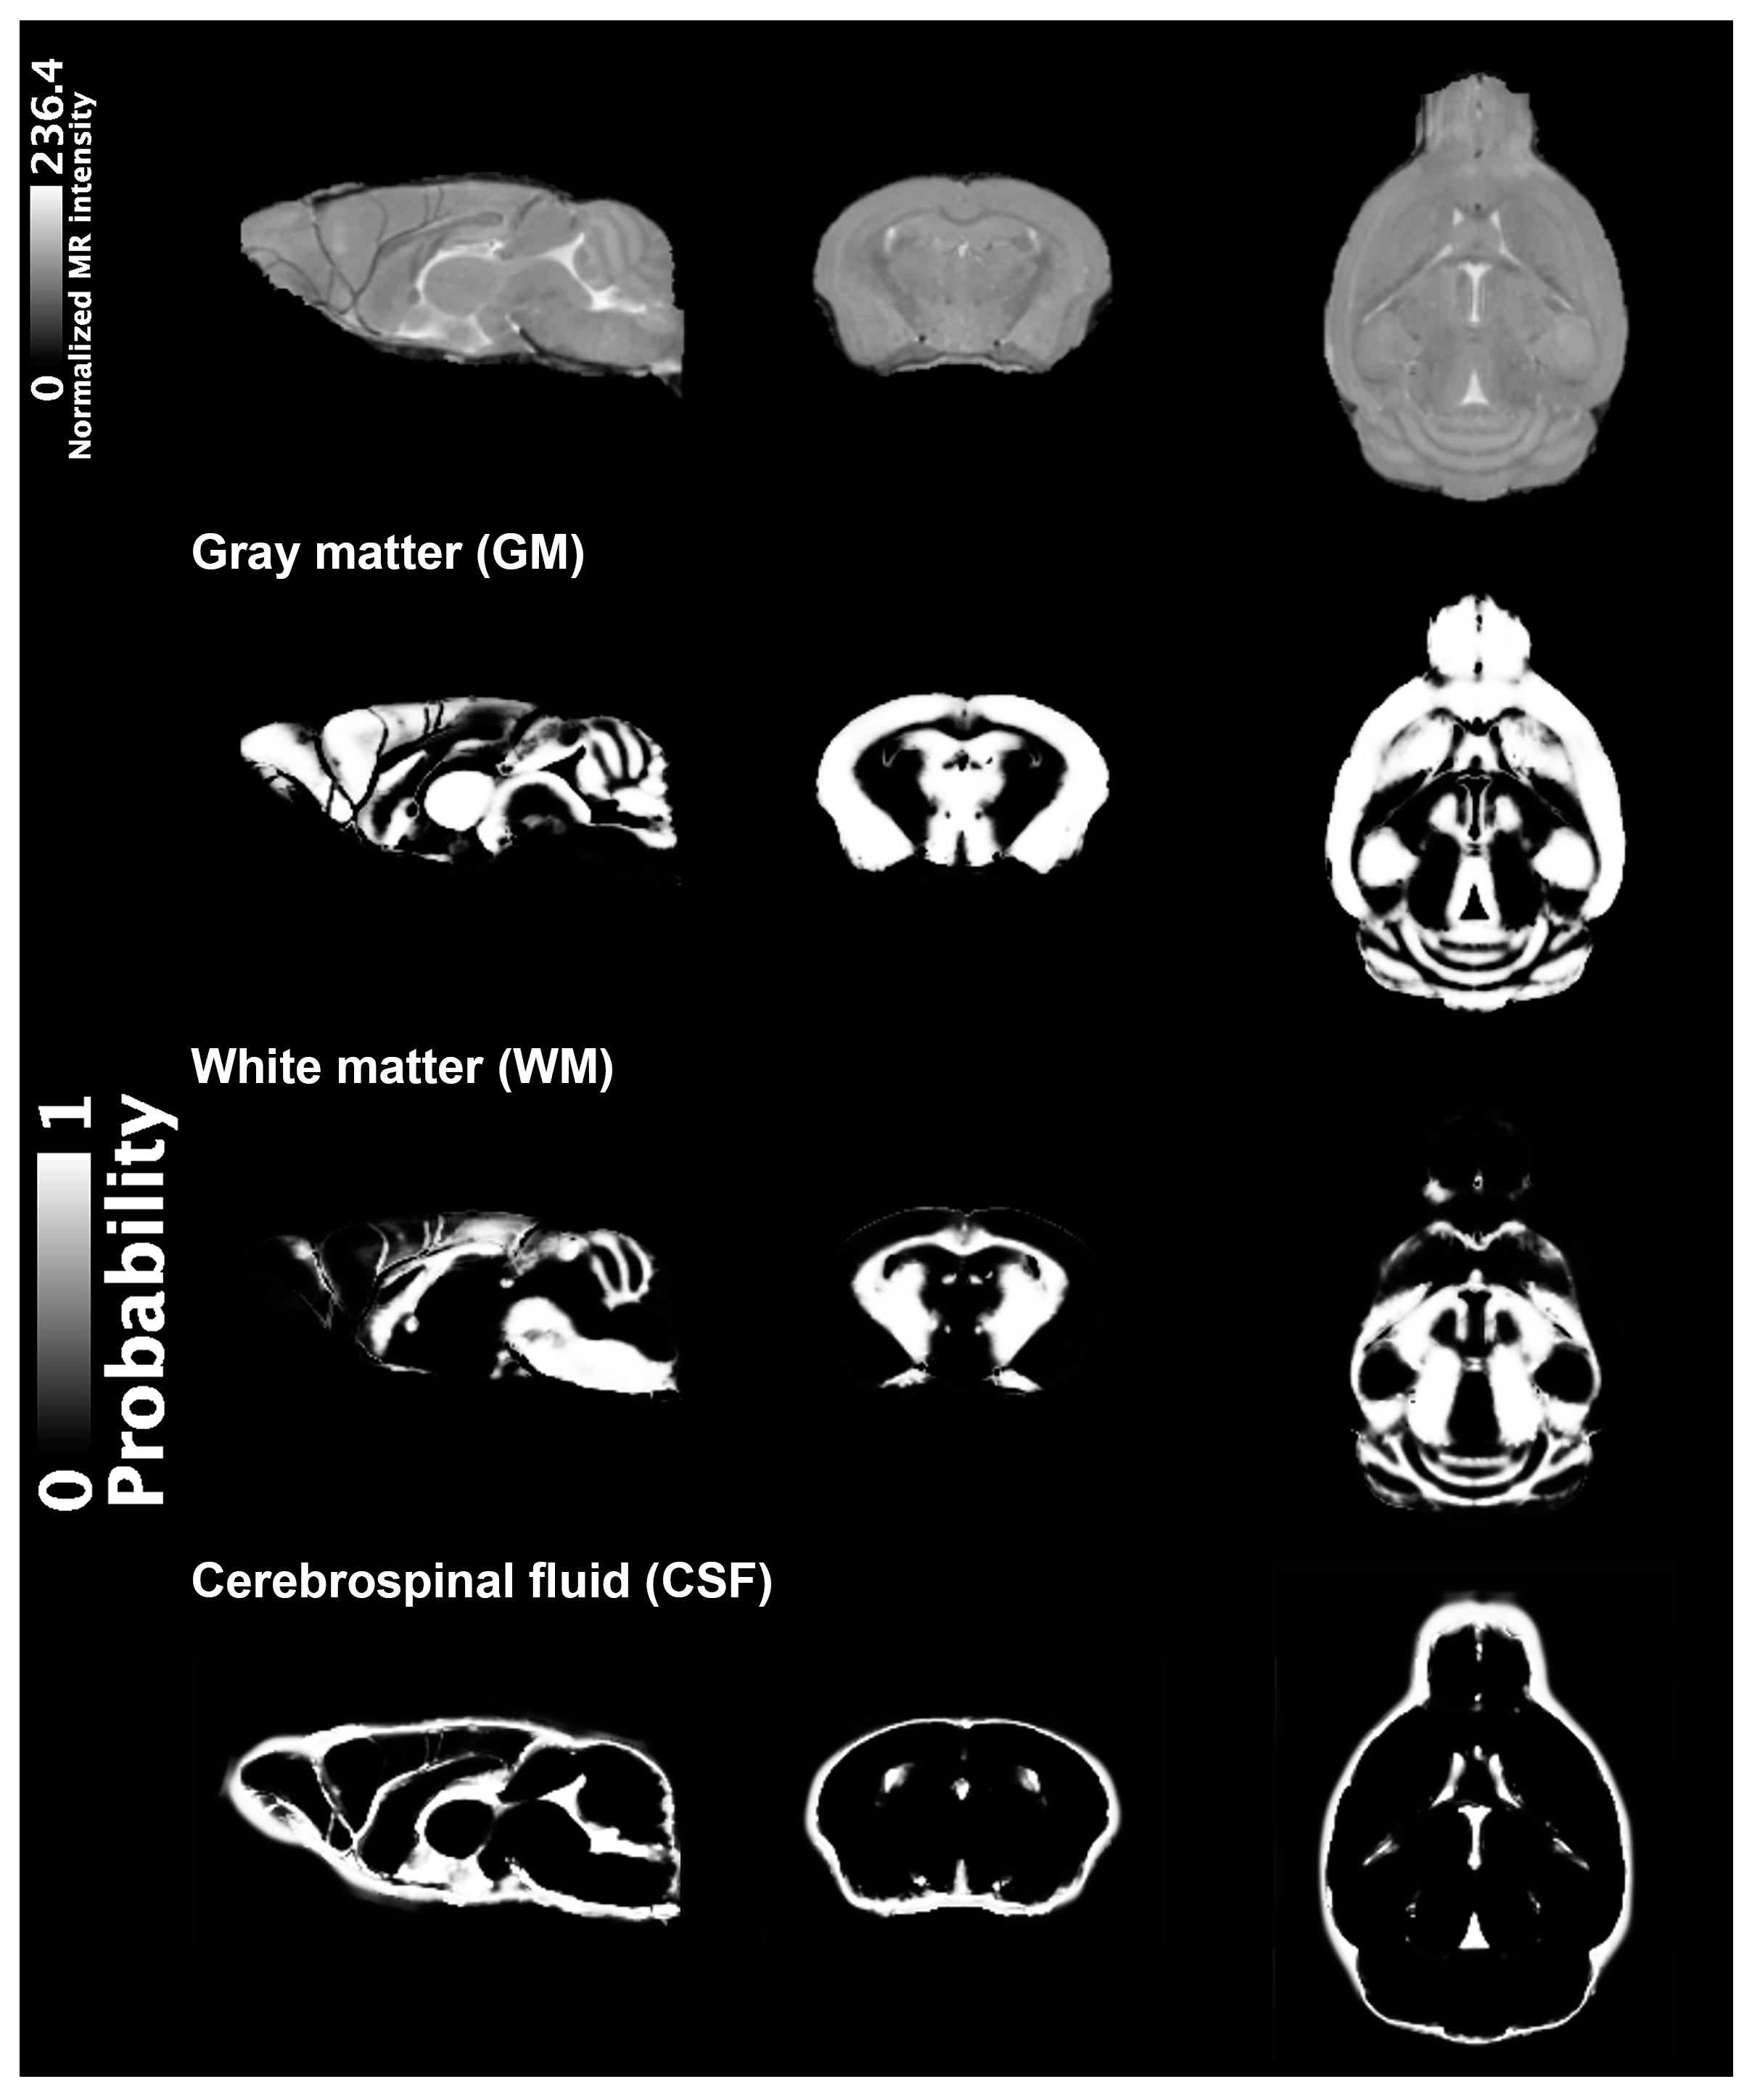
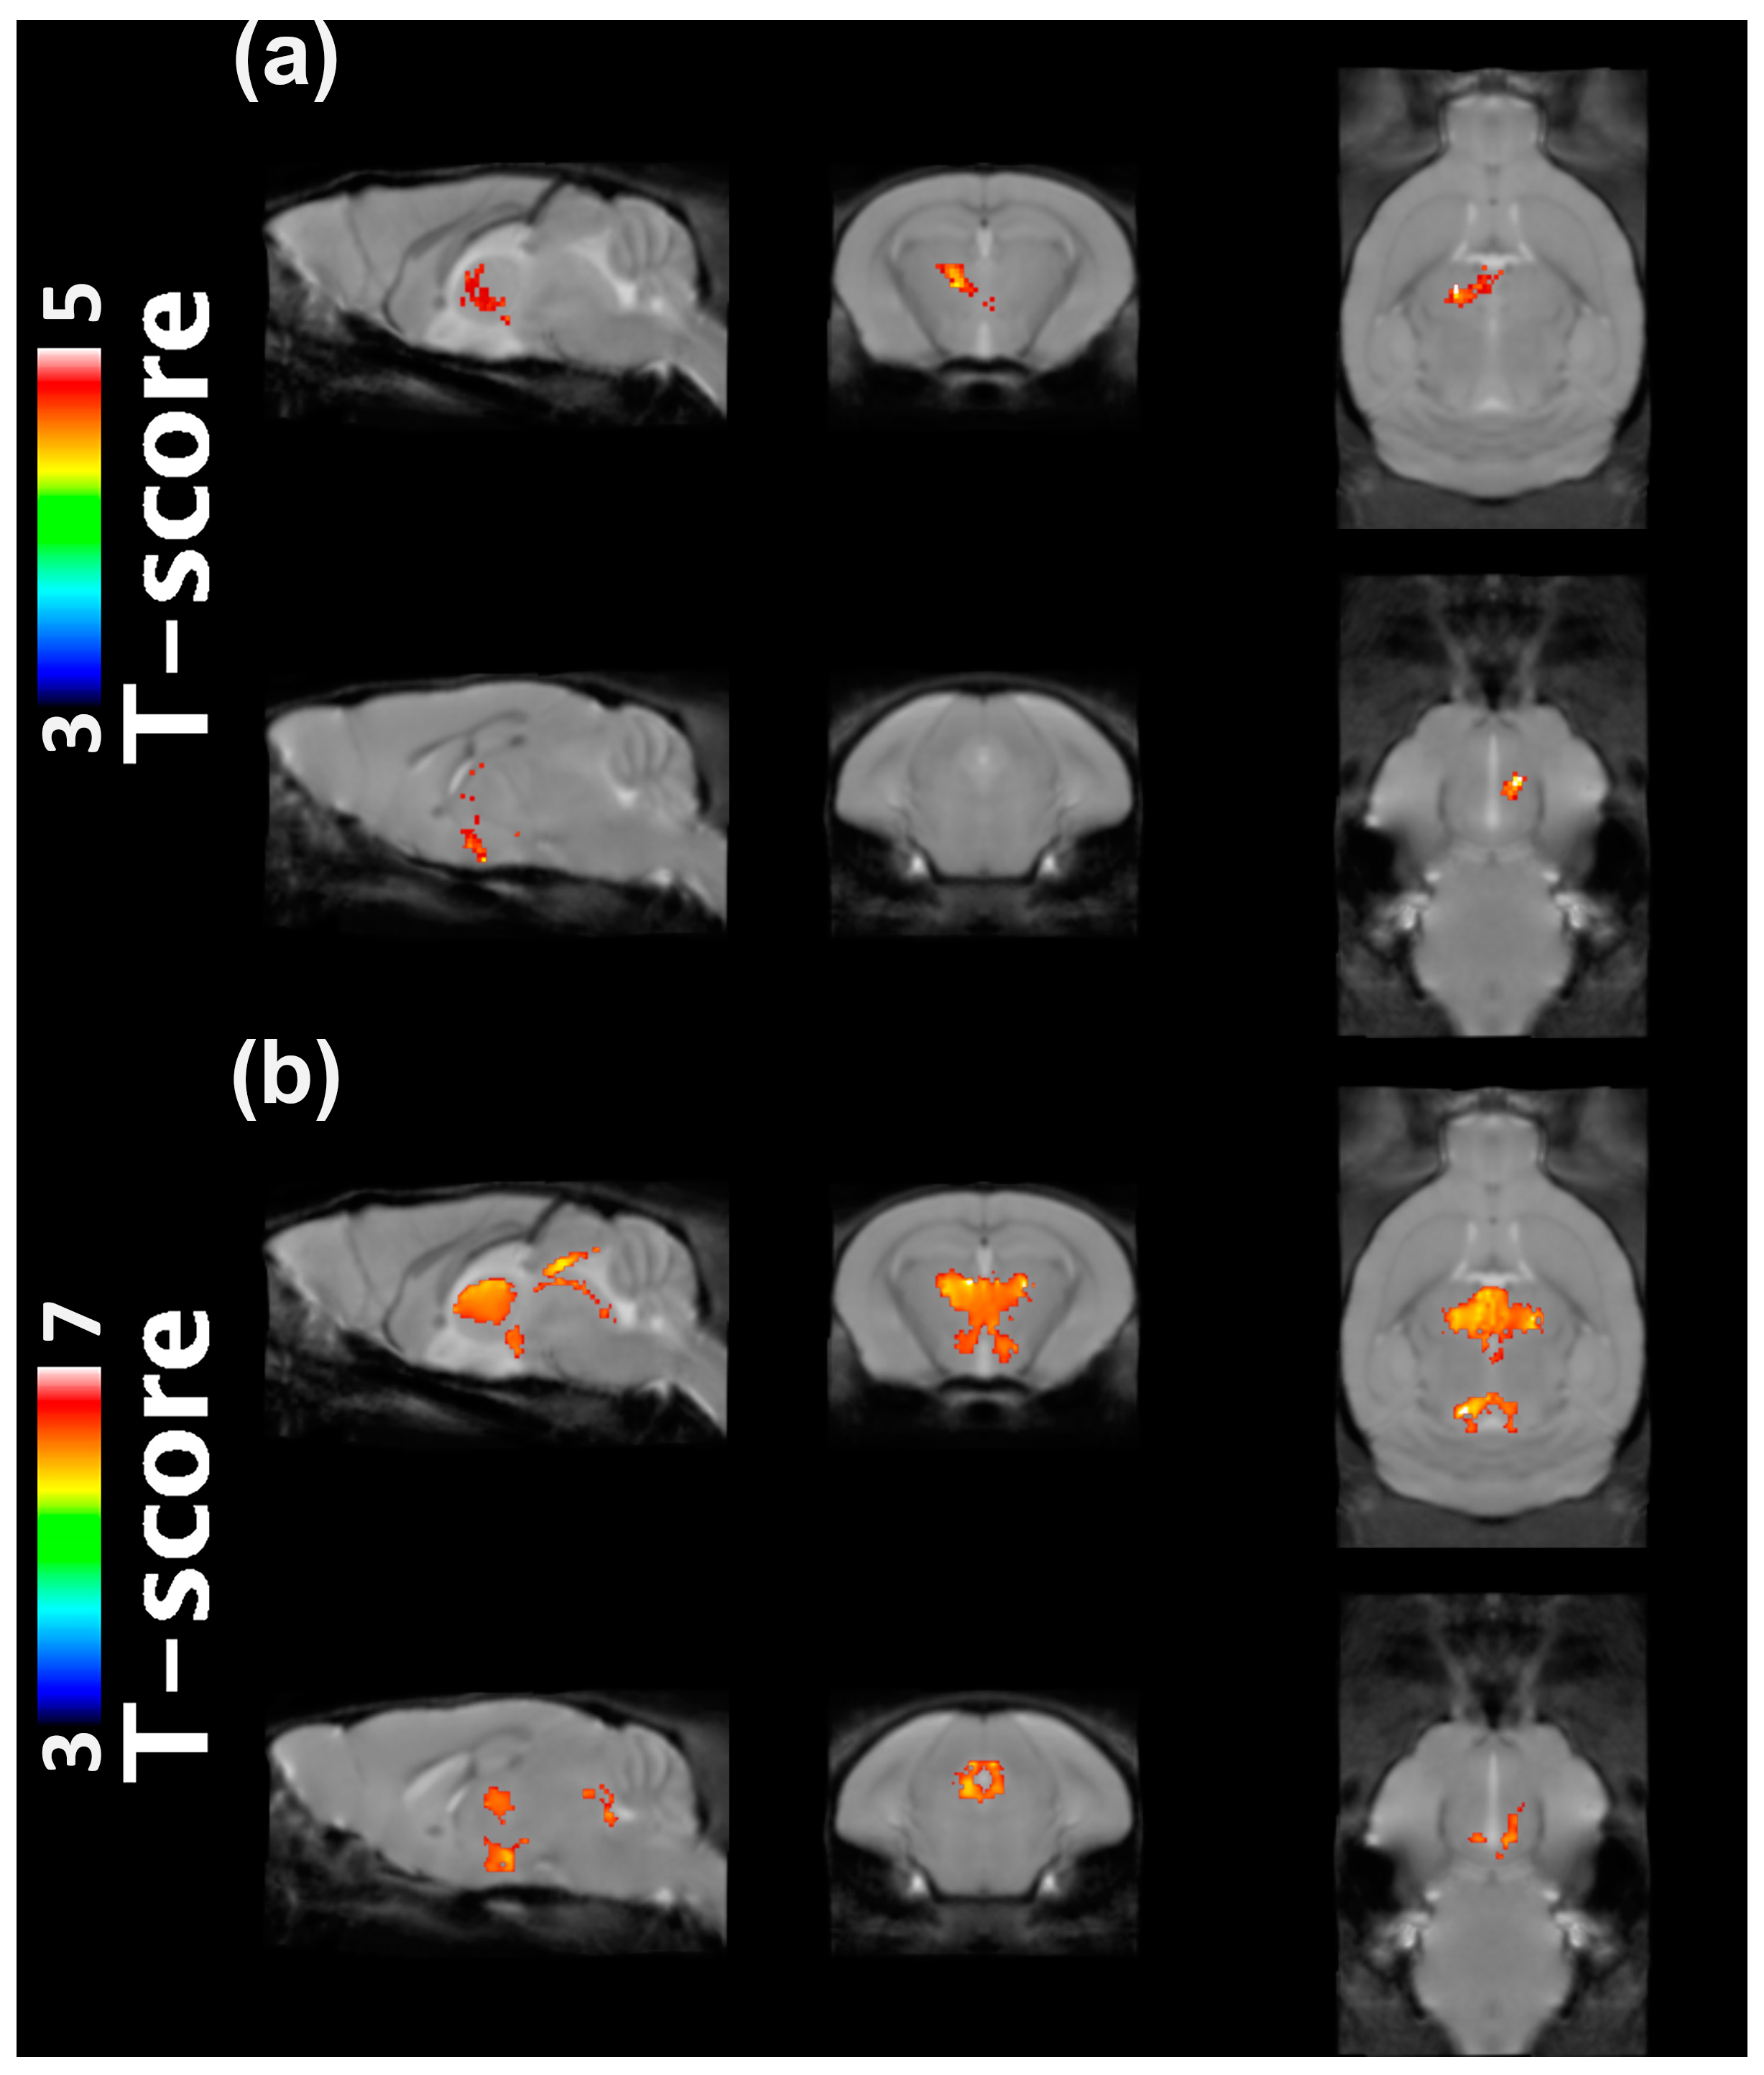
2.1. VBM Analysis
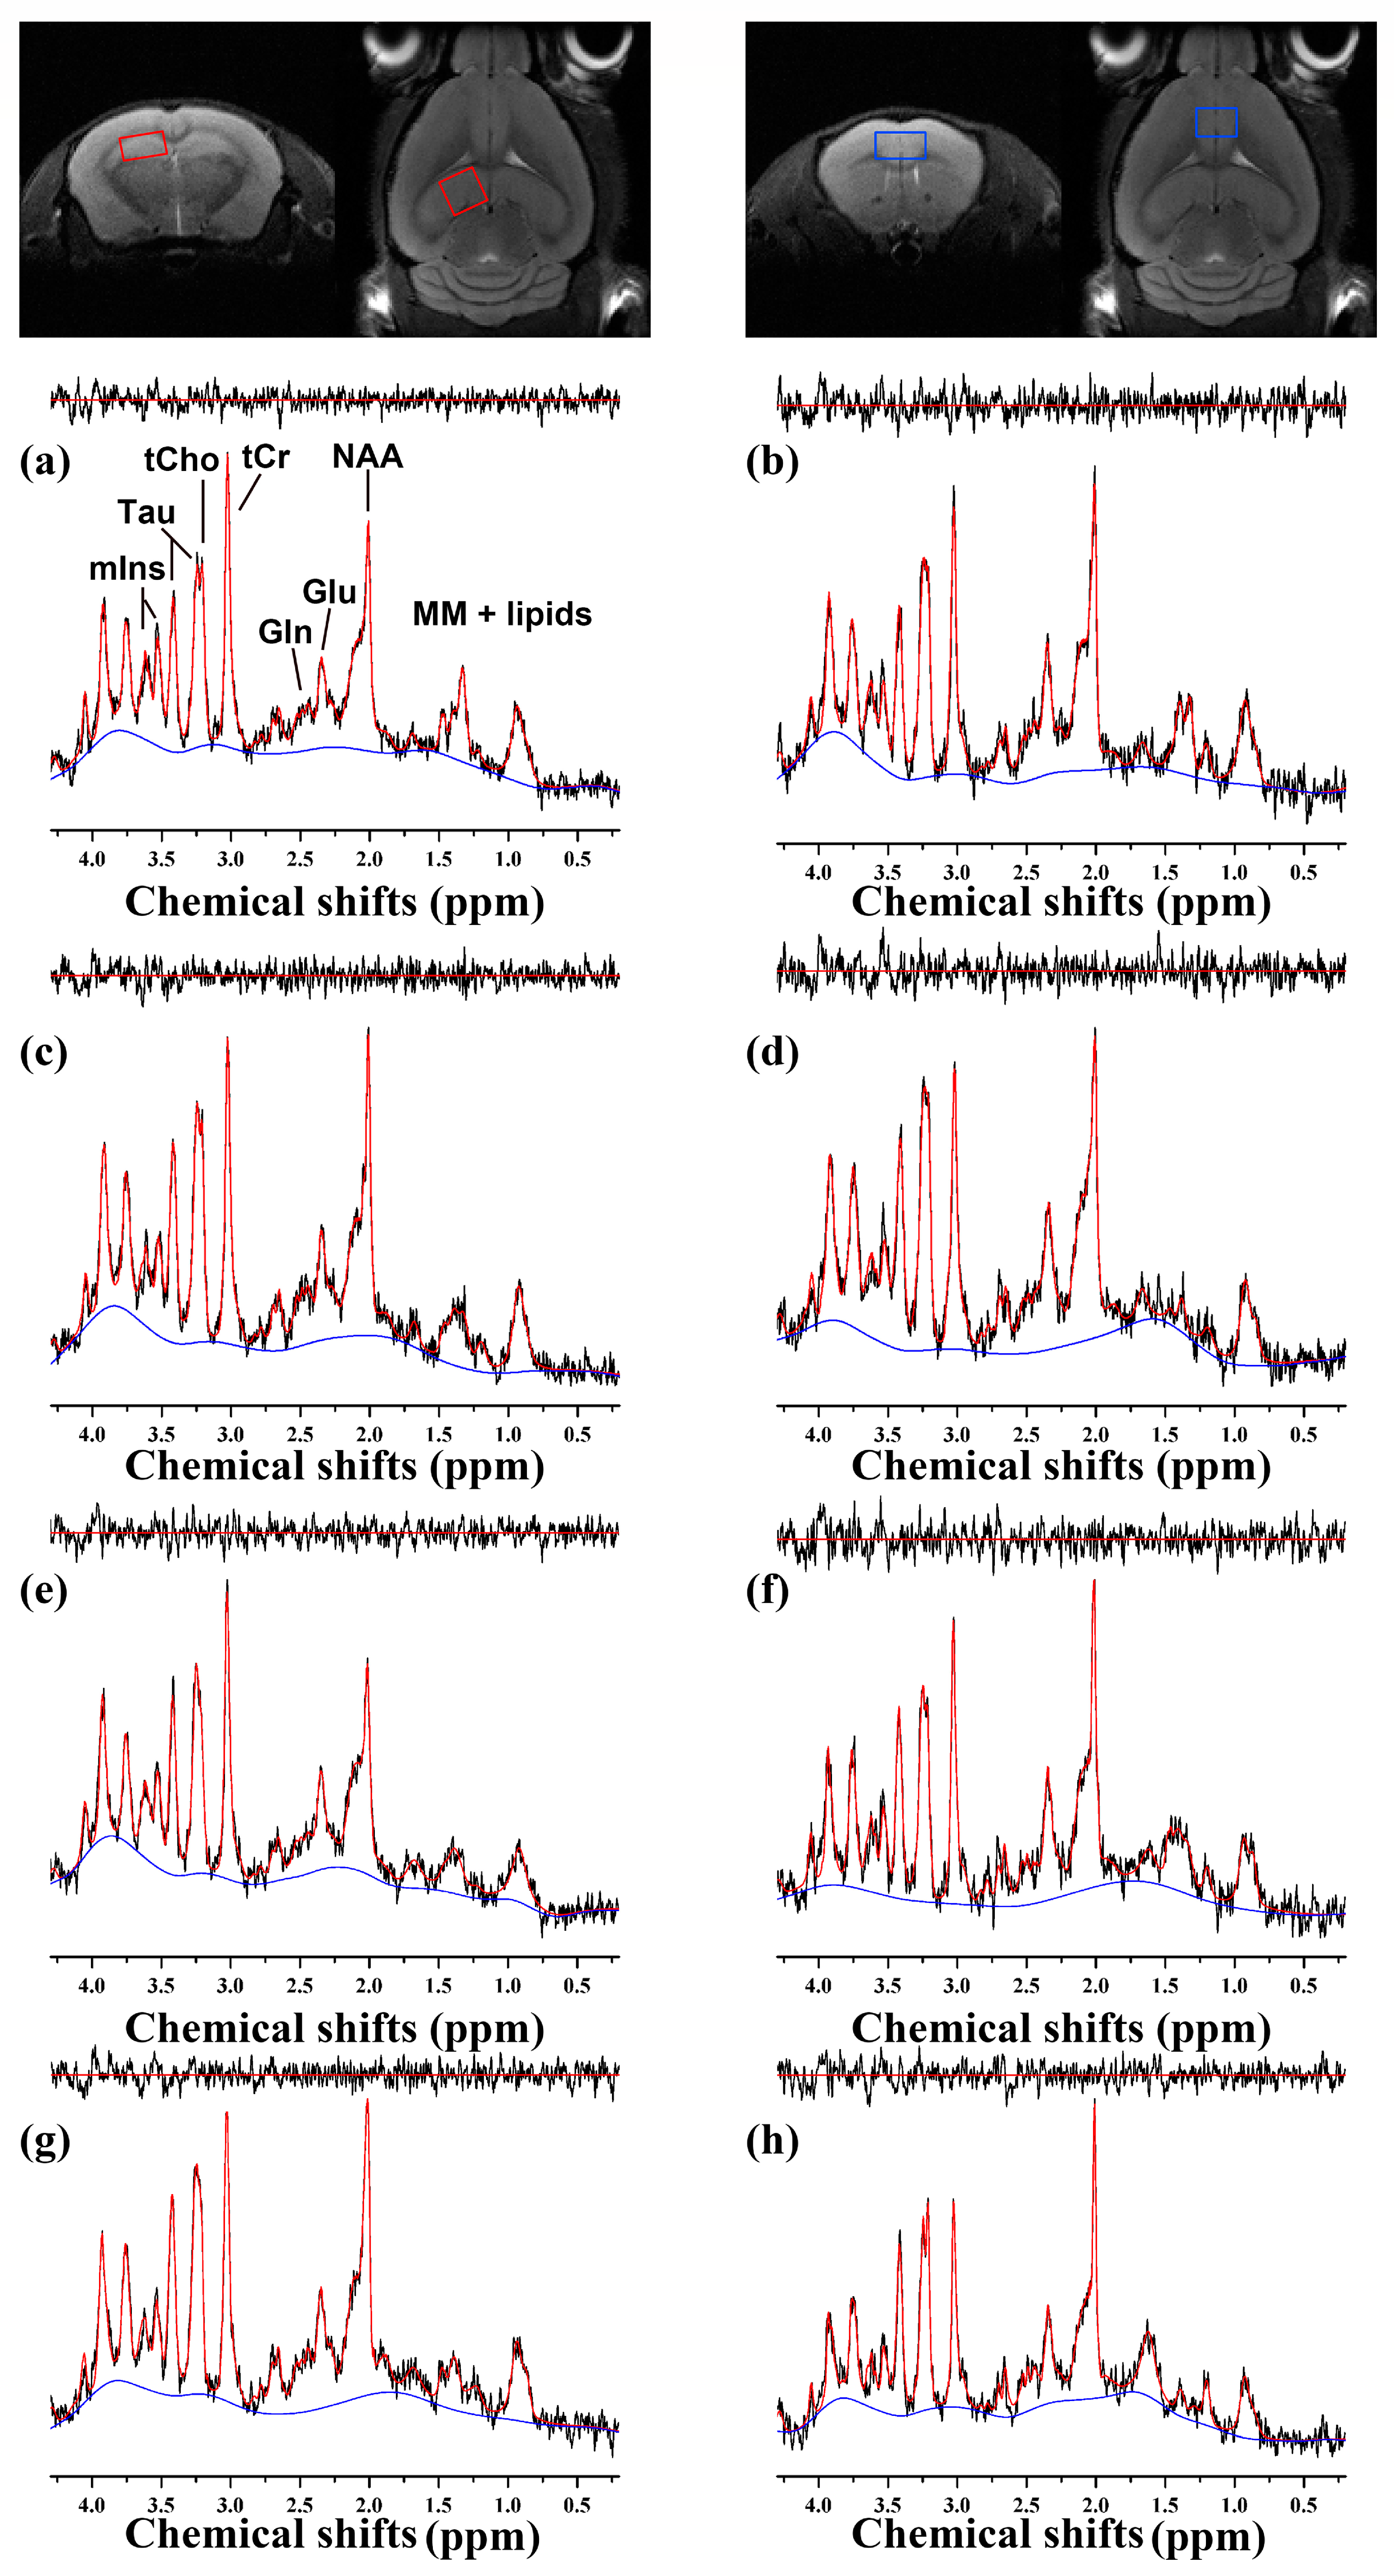
2.2. 1H MRS
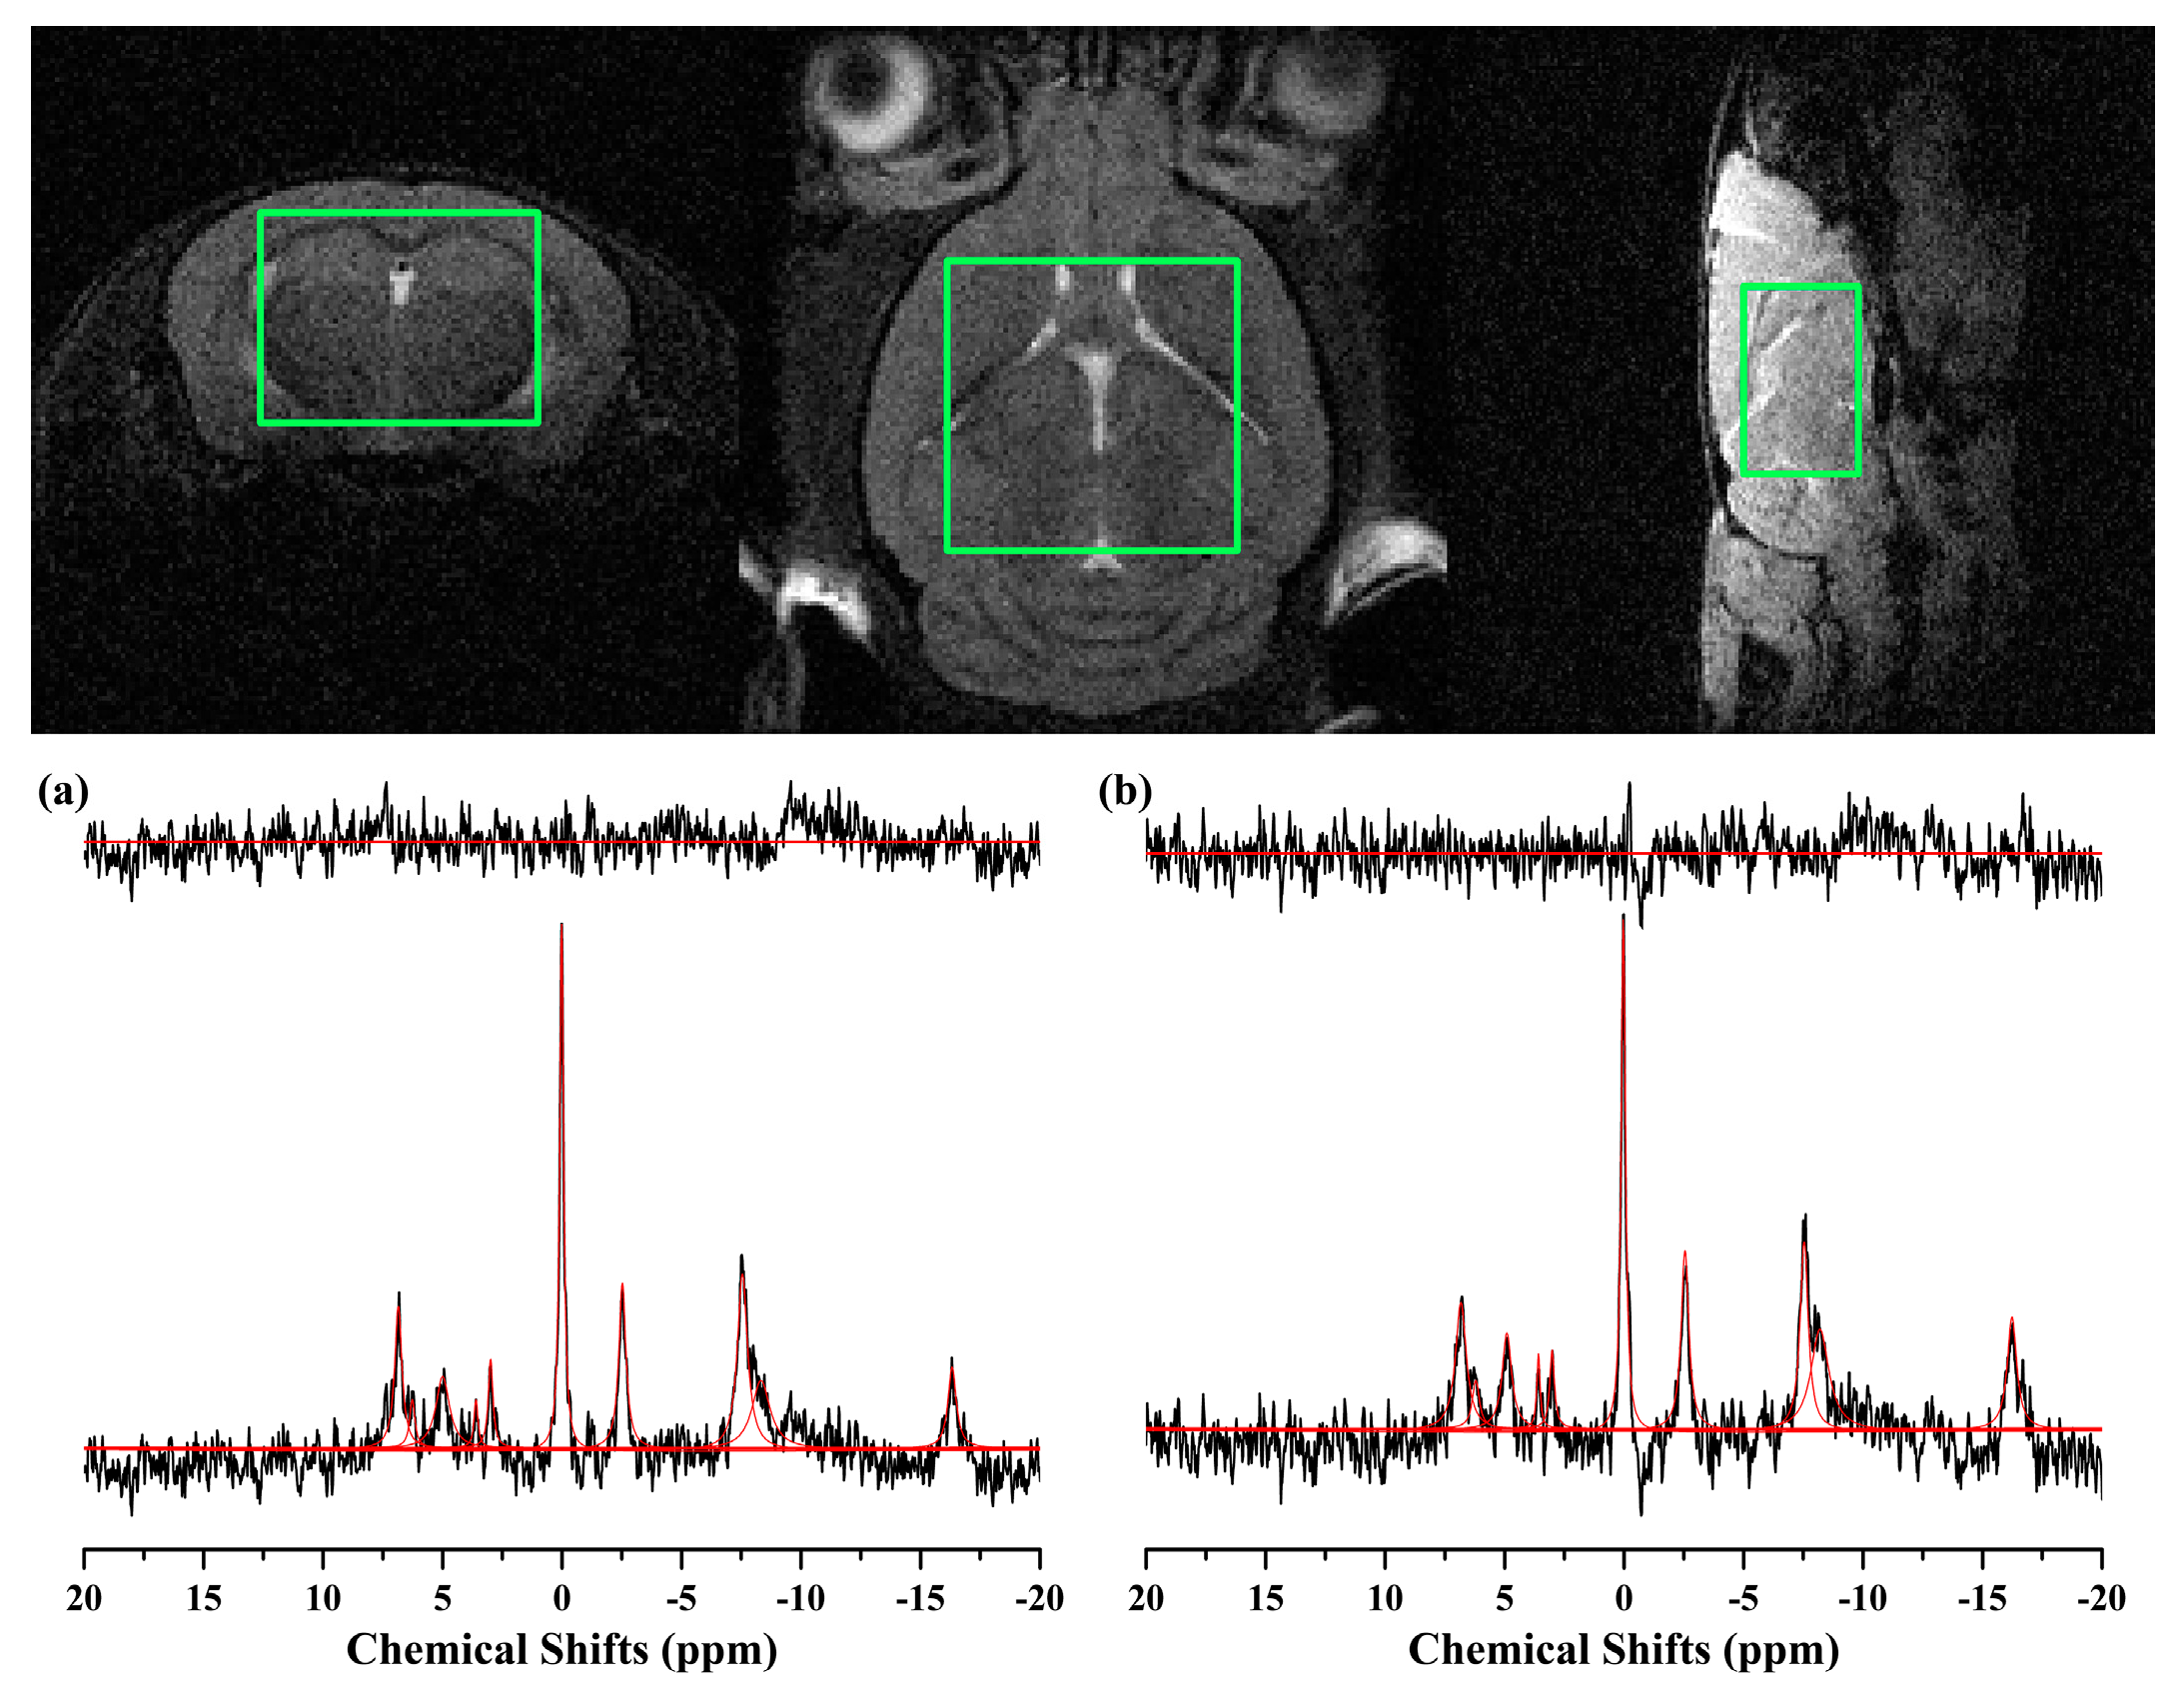
2.3. 31P MRS
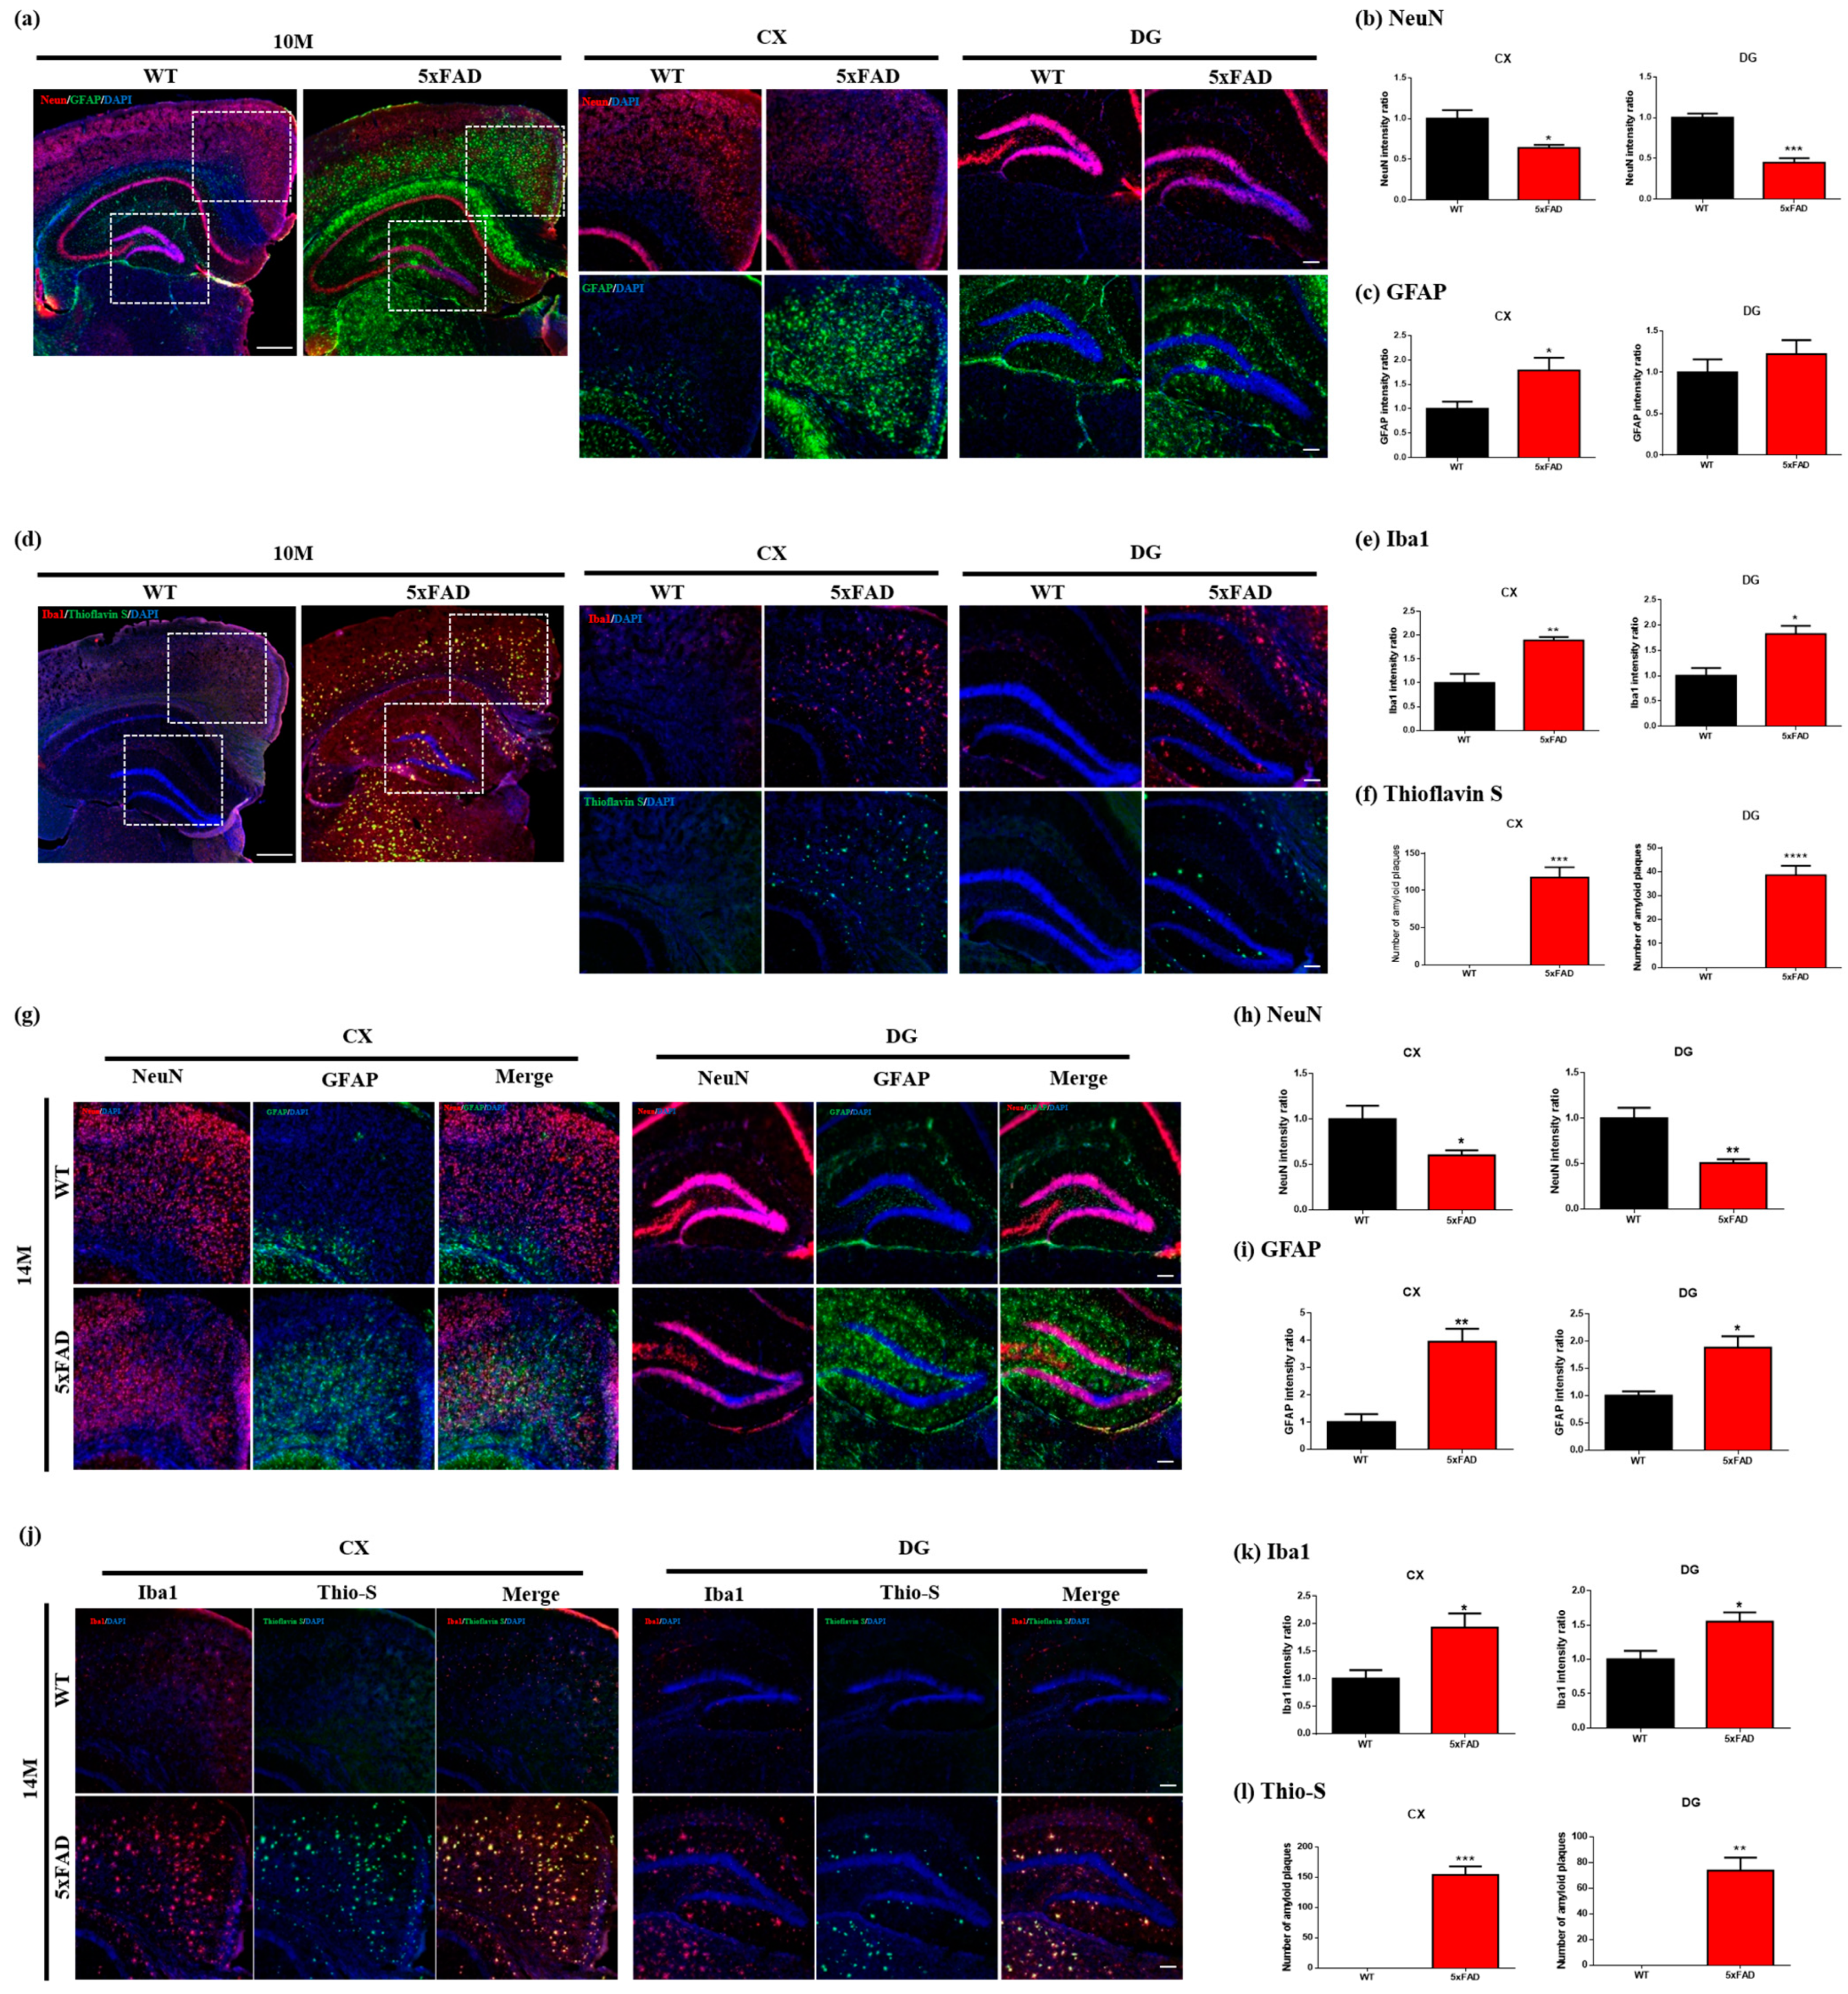
2.4. Immunofluorescence
3. Discussion
4. Materials and Methods
4.1. Animal Preparation
4.2. Acquisition of MRI/MRS
4.3. VBM Analysis
4.4. Preprocessing and Quantification for MRS
4.5. Immunofluorescence and Thioflavins S Staining
4.6. Statistical Analysis
5. Conclusions
Supplementary Materials
Author Contributions
Funding
Institutional Review Board Statement
Informed Consent Statement
Data Availability Statement
Conflicts of Interest
References
- Morley, J.E.; Farr, S.A.; Nguyen, A.D. Alzheimer Disease. Clin. Geriatr. Med. 2018, 34, 591–601. [Google Scholar] [CrossRef]
- Song, C.; Guo, S.; Jin, S.; Chen, L.; Jung, Y.M. Biomarkers Determination Based on Surface-Enhanced Raman Scattering. Chemosensors 2020, 8, 118. [Google Scholar] [CrossRef]
- Adlard, P.A.; Tran, B.A.; Finkelstein, D.I.; Desmond, P.M.; Johnston, L.A.; Bush, A.I.; Egan, G.F. A Review of β-Amyloid Neuroimaging in Alzheimer’s Disease. Front. Neurosci. 2014, 8, 327. [Google Scholar] [CrossRef] [PubMed] [Green Version]
- Waerzeggers, Y.; Monfared, P.; Viel, T.; Winkeler, A.; Jacobs, A.H. Mouse Models in Neurological Disorders: Applications of Non-Invasive Imaging. Biochim. Biophys. Acta Mol. Basis Dis. 2010, 1802, 819–839. [Google Scholar] [CrossRef] [Green Version]
- Oakley, H.; Cole, S.L.; Logan, S.; Maus, E.; Shao, P.; Craft, J.; Guillozet-Bongaarts, A.; Ohno, M.; Disterhoft, J.; Van Eldik, L.; et al. Intraneuronal β-Amyloid Aggregates, Neurodegeneration, and Neuron Loss in Transgenic Mice. J. Neurosci. 2006, 26, 10129–10140. [Google Scholar] [CrossRef] [PubMed] [Green Version]
- Esquerda-Canals, G.; Montoliu-Gaya, L.; Güell-Bosch, J.; Villegas, S. Mouse Models of Alzheimer’s Disease. J. Alzheimers Dis. 2017, 57, 1171–1183. [Google Scholar] [CrossRef] [PubMed]
- Götz, J.; Bodea, L.G.; Goedert, M. Rodent Models for Alzheimer Disease. Nat. Rev. Neurosci. 2018, 19, 583–598. [Google Scholar] [CrossRef] [PubMed]
- Gao, F.; Barker, P.B. Various MRS Application Tools for Alzheimer Disease and Mild Cognitive Impairment. Am. J. Neuroradiol. 2014, 35, S4–S11. [Google Scholar] [CrossRef]
- Wang, H.; Tan, L.; Wang, H.F.; Liu, Y.; Yin, R.H.; Wang, W.Y.; Chang, X.L.; Jiang, T.; Yu, J.T. Magnetic Resonance Spectroscopy in Alzheimer’s Disease: Systematic Review and Meta-Analysis. J. Alzheimers Dis. 2015, 46, 1049–1070. [Google Scholar] [CrossRef]
- Mandal, P.K. Magnetic Resonance Spectroscopy (MRS) and Its Application in Alzheimer’s Disease. Concepts Magn. Reson. Part A Bridg. Educ. Res. 2007, 30A, 40–64. [Google Scholar] [CrossRef]
- Watanabe, T.; Shiino, A.; Akiguchi, I. Absolute Quantification in Proton Magnetic Resonance Spectroscopy is Useful to Differentiate Amnesic Mild Cognitive Impairment from Alzheimer’s Disease and Healthy Aging. Dement. Geriatr. Cogn. Disord. 2010, 30, 71–77. [Google Scholar] [CrossRef] [PubMed]
- Dedeoglu, A.; Choi, J.K.; Cormier, K.; Kowall, N.W.; Jenkins, B.G. Magnetic Resonance Spectroscopic Analysis of Alzheimer’s Disease Mouse Brain that Express Mutant Human APP Shows Altered Neurochemical Profile. Brain Res. 2004, 1012, 60–65. [Google Scholar] [CrossRef] [PubMed]
- Rijpma, A.; van der Graaf, M.; Meulenbroek, O.; Olde Rikkert, M.G.M.; Heerschap, A. Altered Brain High-Energy Phosphate Metabolism in Mild Alzheimer’s Disease: A 3-Dimensional 31P MR Spectroscopic Imaging Study. NeuroImage Clin. 2018, 18, 254–261. [Google Scholar] [CrossRef]
- Pettegrew, J.W.; Panchalingam, K.; Klunk, W.E.; McClure, R.J.; Muenz, L.R. Alterations of Cerebral Metabolism in Probable Alzheimer’s Disease: A Preliminary Study. Neurobiol. Aging 1994, 15, 117–132. [Google Scholar] [CrossRef] [PubMed]
- Cuénod, C.A.; Kaplan, D.B.; Michot, J.L.; Forette, F.; Jehenson, P.; Leroy Willig, A.; Syrota, A.; Boller, F. Phospholipid Abnormalities in Early Alzheimer’s Disease: In Vivo Phosphorus 31 Magnetic Resonance Spectroscopy. Arch. Neurol. 1995, 52, 89–94. [Google Scholar] [CrossRef]
- Chapleau, M.; Aldebert, J.; Montembeault, M.; Brambati, S.M. Atrophy in Alzheimer’s Disease and Semantic Dementia: An ALE Meta-Analysis of Voxel-Based Morphometry Studies. J. Alzheimers Dis. 2016, 54, 941–955. [Google Scholar] [CrossRef] [PubMed]
- Ribeiro, L.G.; Filho, G.B. Voxel-Based Morphometry in Alzheimers Disease and Mild Cognitive Impairment: Systematic Review of Studies Addressing the Frontal Lobe. Dement. Neuropsychol. 2016, 10, 104–112. [Google Scholar] [CrossRef] [Green Version]
- Matsuda, H. Voxel-Based Morphometry of Brain MRI in Normal Aging and Alzheimer’s Disease. Aging Dis. 2013, 4, 29–37. [Google Scholar]
- Di Paola, M.; Macaluso, E.; Carlesimo, G.A.; Tomaiuolo, F.; Worsley, K.J.; Fadda, L.; Caltagirone, C. Episodic Memory Impairment in Patients with Alzheimer’s Disease is Correlated with Entorhinal Cortex Atrophy: A Voxel-Based Morphometry Study. J. Neurol. 2007, 254, 774–781. [Google Scholar] [CrossRef] [PubMed]
- Hirata, Y.; Matsuda, H.; Nemoto, K.; Ohnishi, T.; Hirao, K.; Yamashita, F.; Asada, T.; Iwabuchi, S.; Samejima, H. Voxel-Based Morphometry to Discriminate Early Alzheimer’s Disease from Controls. Neurosci. Lett. 2005, 382, 269–274. [Google Scholar] [CrossRef]
- Schmidt-Wilcke, T.; Poljansky, S.; Hierlmeier, S.; Hausner, J.; Ibach, B. Memory Performance Correlates with Gray Matter Density in the Ento-/Perirhinal Cortex and Posterior Hippocampus in Patients with Mild Cognitive Impairment and Healthy Controls—A Voxel Based Morphometry Study. Neuroimage 2009, 47, 1914–1920. [Google Scholar] [CrossRef]
- Sawiak, S.J.; Wood, N.I.; Williams, G.B.; Morton, A.J.; Carpenter, T.A. Voxel-Based Morphometry with Templates and Validation in a Mouse Model of Huntington’s Disease. Magn. Reson. Imaging 2013, 31, 1522–1531. [Google Scholar] [CrossRef]
- Hikishima, K.; Komaki, Y.; Seki, F.; Ohnishi, Y.; Okano, H.J.; Okano, H. In Vivo Microscopic Voxel-Based Morphometry with a Brain Template to Characterize Strainspecific Structures in the Mouse Brain. Sci. Rep. 2017, 7, 85. [Google Scholar] [CrossRef] [Green Version]
- Hikishima, K.; Ando, K.; Komaki, Y.; Kawai, K.; Yano, R.; Inoue, T.; Itoh, T.; Yamada, M.; Momoshima, S.; Okano, H.J.; et al. Voxel-Based Morphometry of the Marmoset Brain: In Vivo Detection of Volume Loss in the Substantia Nigra of the MPTP-treated Parkinson’s Disease Model. Neuroscience 2015, 300, 585–592. [Google Scholar] [CrossRef] [PubMed]
- Jullienne, A.; Trinh, M.V.; Obenaus, A. Neuroimaging of Mouse Models of Alzheimer’s Disease. Biomedicines 2022, 10, 305. [Google Scholar] [CrossRef]
- Girard, S.D.; Baranger, K.; Gauthier, C.; Jacquet, M.; Bernard, A.; Escoffier, G.; Marchetti, E.; Khrestchatisky, M.; Rivera, S.; Roman, F.S. Evidence for Early Cognitive Impairment Related to Frontal Cortex in the 5XFAD Mouse Model of Alzheimer’s Disease. J. Alzheimer’s Dis. 2013, 33, 781–796. [Google Scholar] [CrossRef]
- Girard, S.D.; Jacquet, M.; Baranger, K.; Migliorati, M.; Escoffier, G.; Bernard, A.; Khrestchatisky, M.; Féron, F.; Rivera, S.; Roman, F.S.; et al. Onset of Hippocampus-Dependent Memory Impairments in 5XFAD Transgenic Mouse Model of Alzheimer’s Disease. Hippocampus 2014, 24, 762–772. [Google Scholar] [CrossRef]
- Macdonald, I.R.; DeBay, D.R.; Reid, G.A.; O’Leary, T.P.; Jollymore, C.T.; Mawko, G.; Burrell, S.; Martin, E.; Bowen, C.V.; Brown, R.E.; et al. Early Detection of Cerebral Glucose Uptake Changes in the 5XFAD Mouse. Curr. Alzheimer Res. 2014, 11, 450–460. [Google Scholar] [CrossRef] [Green Version]
- Near, J.; Edden, R.; Evans, C.J.; Paquin, R.; Harris, A.; Jezzard, P. Frequency and Phase Drift Correction of Magnetic Resonance Spectroscopy data by Spectral Registration in the Time Domain. Magn. Reson. Med. 2015, 73, 44–50. [Google Scholar] [CrossRef] [PubMed] [Green Version]
- Lalande, J.; Halley, H.; Balayssac, S.; Gilard, V.; Déjean, S.; Martino, R.; Francés, B.; Lassalle, J.M.; Malet-Martino, M. 1H NMR Metabolomic Signatures in Five Brain Regions of the aβPPswe Tg2576 Mouse Model of Alzheimer’s Disease at Four Ages. J. Alzheimers Dis. 2014, 39, 121–143. [Google Scholar] [CrossRef] [PubMed]
- Mlynárik, V.; Cacquevel, M.; Sun-Reimer, L.; Janssens, S.; Cudalbu, C.; Lei, H.; Schneider, B.L.; Aebischer, P.; Gruetter, R. Proton and Phosphorus Magnetic Resonance Spectroscopy of a Mouse Model of Alzheimer’s Disease. J. Alzheimers Dis. 2012, 31, S87–S99. [Google Scholar] [CrossRef] [PubMed] [Green Version]
- Lee, M.; Lee, H.J.; Jeong, Y.J.; Oh, S.J.; Kang, K.J.; Han, S.J.; Nam, K.R.; Lee, Y.J.; Lee, K.C.; Ryu, Y.H.; et al. Age Dependency of mGluR5 Availability in 5xFAD Mice Measured by PET. Neurobiol. Aging 2019, 84, 208–216. [Google Scholar] [CrossRef] [PubMed]
- Bai, X.; Edden, R.A.E.; Gao, F.; Wang, G.; Wu, L.; Zhao, B.; Wang, M.; Chan, Q.; Chen, W.; Barker, P.B. Decreased γ-Aminobutyric Acid Levels in the Parietal Region of Patients with Alzheimer’s Disease. J. Magn. Reson. Imaging 2015, 41, 1326–1331. [Google Scholar] [CrossRef] [PubMed] [Green Version]
- Abramov, A.Y.; Canevari, L.; Duchen, M.R. Changes in Intracellular Calcium and Glutathione in Astrocytes as the Primary Mechanism of Amyloid Neurotoxicity. J. Neurosci. 2003, 23, 5088–5095. [Google Scholar] [CrossRef] [Green Version]
- Bains, J.S.; Shaw, C.A. Neurodegenerative Disorders in Humans: The Role of Glutathione in Oxidative Stress-Mediated Neuronal Death. Brain Res. Rev. 1997, 25, 335–358. [Google Scholar] [CrossRef]
- Cecchi, C.; Latorraca, S.; Sorbi, S.; Iantomasi, T.; Favilli, F.; Vincenzini, M.T.; Liguri, G. Gluthatione level is altered in lymphoblasts from patients with familial Alzheimer’s disease. Neurosci. Lett. 1999, 275, 152–154. [Google Scholar] [CrossRef]
- Cardoso, S.M.; Oliveira, C.R. Glutathione Cycle Impairment Mediates Aβ-Induced Cell Toxicity. Free Radic. Res. 2003, 37, 241–250. [Google Scholar] [CrossRef]
- Brand, A.; Richter-Landsberg, C.; Leibfritz, D. Multinuclear NMR Studies on the Energy Metabolism of Glial and Neuronal Cells. Dev. Neurosci. 1993, 15, 289–298. [Google Scholar] [CrossRef]
- Burg, M.B.; Kwon, E.D.; Kültz, D. Regulation of Gene Expression by Hypertonicity. Annu. Rev. Physiol. 1997, 59, 437–455. [Google Scholar] [CrossRef]
- Law, R.O. Regulation of Mammalian Brain Cell Volume. J. Exp. Zool. 1994, 268, 90–96. [Google Scholar] [CrossRef]
- Forlenza, O.V.; Wacker, P.; Nunes, P.V.; Yacubian, J.; Castro, C.C.; Otaduy, M.C.G.; Gattaz, W.F. Reduced Phospholipid Breakdown in Alzheimer’s Brains: A 31P Spectroscopy Study. Psychopharmacology 2005, 180, 359–365. [Google Scholar] [CrossRef] [PubMed]
- Mandal, P.K.; Akolkar, H.; Tripathi, M. Mapping of Hippocampal pH and Neurochemicals from In Vivo Multi-Voxel 31P Study in Healthy Normal Young Male/Female, Mild Cognitive Impairment, and Alzheimer’s Disease. J. Alzheimers Dis. 2012, 31, S75–S86. [Google Scholar] [CrossRef] [Green Version]
- Pollak, N.; Dölle, C.; Ziegler, M. The Power to Reduce: Pyridine Nucleotides—Small Molecules with a Multitude of Functions. Biochem. J. 2007, 402, 205–218. [Google Scholar] [CrossRef] [PubMed]
- Tustison, N.J.; Avants, B.B.; Cook, P.A.; Zheng, Y.; Egan, A.; Yushkevich, P.A.; Gee, J.C. N4ITK: Improved N3 Bias Correction. IEEE Trans. Med. Imaging 2010, 29, 1310–1320. [Google Scholar] [CrossRef] [PubMed] [Green Version]
- Dubois, A.; Hérard, A.S.; Flandin, G.; Duchesnay, E.; Besret, L.; Frouin, V.; Hantraye, P.; Bonvento, G.; Delzescaux, T. Quantitative Validation of Voxel-Wise Statistical Analyses of Autoradiographic Rat Brain Volumes: Application to Unilateral Visual Stimulation. Neuroimage 2008, 40, 482–494. [Google Scholar] [CrossRef]
- Dubois, A.; Hérard, A.S.; Delatour, B.; Hantraye, P.; Bonvento, G.; Dhenain, M.; Delzescaux, T. Detection by Voxel-Wise Statistical Analysis of Significant Changes in Regional Cerebral Glucose Uptake in an APP/PS1 Transgenic Mouse Model of Alzheimer’s Disease. Neuroimage 2010, 51, 586–598. [Google Scholar] [CrossRef]
- Yang, J.; Zaim Wadghiri, Y.; Minh Hoang, D.; Tsui, W.; Sun, Y.; Chung, E.; Li, Y.; Wang, A.; de Leon, M.; Wisniewski, T. Detection of Amyloid Plaques Targeted by USPIO-Aβ1-42 in Alzheimer’s Disease Transgenic Mice Using Magnetic Resonance Microimaging. Neuroimage 2011, 55, 1600–1609. [Google Scholar] [CrossRef] [Green Version]
- Paxinos, G.; Franklin, K.B.J. Paxinos and Franklin’s the Mouse Brain in Stereotaxic Coordinates; Academic Press: Cambridge, MA, USA, 2001; ISBN 0125476361. [Google Scholar]
- Govindaraju, V.; Young, K.; Maudsley, A.A. Proton NMR chemical shifts and coupling constants for brain metabolites. NMR Biomed. 2000, 13, 129–153. [Google Scholar] [CrossRef] [PubMed]
- Provencher, S.W. Automatic Quantitation of Localized in Vivo1H Spectra with LCModel. NMR Biomed. 2001, 14, 260–264. [Google Scholar] [CrossRef] [PubMed]
- Stefan, D.; Cesare, F.D.; Andrasescu, A.; Popa, E.; Lazariev, A.; Vescovo, E.; Strbak, O.; Williams, S.; Starcuk, Z.; Cabanas, M.; et al. Quantitation of Magnetic Resonance Spectroscopy Signals: The jMRUI Software Package. Meas. Sci. Technol. 2009, 20, 104035. [Google Scholar] [CrossRef]


| 10-Month-Old | 14-Month-Old | |||||||
| WT | 5xFAD | WT | 5xFAD | |||||
| Global Measures | Average | SD | Average | SD | Average | SD | Average | SD |
| GMV | 0.24 | 0.01 | 0.25 | 0.02 | 0.24 | 0.01 | 0.22 | 0.08 |
| ICV | 0.56 | 0.08 | 0.53 | 0.03 | 0.57 | 0.05 | 0.49 | 0.17 |
| TBV | 0.38 | 0.01 | 0.39 | 0.02 | 0.39 | 0.01 | 0.35 | 0.13 |
| Brain regions | Modulated GM volume | |||||||
| Caudate-putamen | 67.62 | 22.9 | 73.11 | 24.81 | 67.83 | 24.02 | 68.15 | 24.19 |
| Globus pallidus | 16.35 | 14.4 | 18.5 | 16.21 | 15.69 | 14.38 | 15.18 | 13.88 |
| Hippocampus | 62.78 | 20.9 | 69.68 | 22.87 | 65.97 | 21.47 | 64.12 | 20.92 |
| Amygdala | 68.76 | 21.18 | 75.55 | 22.93 | 71.74 | 21.83 | 69.79 | 21.39 |
| Thalamus | 31.95 | 29.6 | 33.45 | 30.81 | 32.18 | 29.71 | 32.2 | 29.77 |
| Hypothalamus | 48.48 | 26.12 | 49.34 | 26.71 | 48.73 | 25.84 | 48.59 | 25.8 |
| Neo cortex | 59.69 | 23.49 | 65.9 | 25.45 | 61.25 | 24.09 | 60.87 | 24.02 |
| Central gray | 55.98 | 17.54 | 56.86 | 18.54 | 56.28 | 16.89 | 54.23 | 16.73 |
| Cerebellum | 38.87 | 20.54 | 41.62 | 21.9 | 39.04 | 20.92 | 38.37 | 20.36 |
| Midbrain | 15.48 | 14.24 | 15.56 | 14.75 | 15.36 | 14.47 | 14.99 | 14.15 |
| Olfactory bulb | 60.45 | 26.4 | 59.17 | 26.61 | 60.09 | 25.48 | 60.36 | 25.4 |
| Internal capsule | 12.7 | 9.89 | 14.65 | 11.22 | 12.14 | 10.13 | 11.78 | 9.53 |
| External capsule | 47.49 | 21.7 | 52.88 | 23.75 | 49.47 | 22.25 | 48.9 | 22.06 |
| Anterior commissure | 67.22 | 12.48 | 70.58 | 12.51 | 66.7 | 12.37 | 68.24 | 12.07 |
| Superior colliculi | 19.17 | 13.87 | 20.46 | 15.1 | 20.1 | 14.43 | 19.1 | 13.88 |
| Inferior colliculi | 15.47 | 13.59 | 16.94 | 15.13 | 17.29 | 14.74 | 16.86 | 14.37 |
| Fimbria | 15.2 | 7.08 | 16.56 | 7.45 | 14.55 | 6.19 | 14.57 | 6.09 |
| Basal forebrain septa | 57.91 | 18.44 | 62.33 | 19.47 | 59.82 | 18.18 | 60.03 | 18.57 |
| In Vivo 1H Spectroscopy | ||||||||
|---|---|---|---|---|---|---|---|---|
| Cortex | Hippocampus | |||||||
| 10 Month | 14 Month | 10 Month | 14 Month | |||||
| Metabolites | 5xFAD | WT | 5xFAD | WT | 5xFAD | WT | 5xFAD | WT |
| GABA | 3.67 ± 0.67 | 3.49 ± 0.70 | 2.90 ± 0.71 | 3.18 ± 0.72 | 2.80 ± 0.88 | 3.74 ± 0.93 | 2.79 ± 1.24 | 3.86 ± 0.75 |
| Gln | 4.90 ± 1.15 | 5.39 ± 1.17 | 5.06 ± 1.06 | 5.13 ± 0.98 | 4.37 ± 0.99 | 4.06 ± 0.67 | 3.99 ± 1.01 | 4.29 ± 0.56 |
| Glu | 13.07 ± 1.27 | 13.61 ± 1.45 | 13.56 ± 1.15 | 12.68 ± 1.18 | 8.38 ± 0.81 | 8.74 ± 0.93 | 8.92 ± 1.12 | 9.08 ± 0.55 |
| GSH | 1.77 ± 0.31 | 2.52 ± 0.49 | 2.44 ± 0.69 | 1.81 ± 0.42 | 1.74 ± 0.55 | 1.93 ± 0.36 | 2.34 ± 0.48 | 1.99 ± 0.40 |
| mIns | 6.93 ± 0.45 | 7.01 ± 0.85 | 7.01 ± 1.43 | 6.20 ± 0.89 | 6.92 ± 0.86 | 6.16 ± 0.41 | 7.92 ± 0.83 | 6.18 ± 0.67 |
| Tau | 13.82 ± 1.41 | 15.80 ± 1.08 | 15.07 ± 2.50 | 15.00 ± 1.29 | 11.83 ± 1.71 | 11.75 ± 0.95 | 13.71 ± 1.02 | 12.32 ± 1.45 |
| tCho | 2.24 ± 0.56 | 2.46 ± 0.22 | 2.12 ± 0.57 | 2.26 ± 0.25 | 1.75 ± 0.34 | 1.71 ± 0.13 | 1.65 ± 0.37 | 1.88 ± 0.17 |
| tNAA | 10.37 ± 0.55 | 11.53 ± 1.05 | 10.39 ± 0.78 | 11.07 ± 1.07 | 8.27 ± 0.64 | 8.94 ± 0.68 | 8.57 ± 0.92 | 9.60 ± 0.71 |
| tCr | 9.49 ± 0.88 | 10.80 ± 1.05 | 10.44 ± 2.25 | 10.06 ± 1.07 | 10.03 ± 0.70 | 9.36 ± 0.71 | 10.46 ± 1.01 | 10.09 ± 0.96 |
| Glx | 17.96 ± 1.57 | 18.99 ± 2.02 | 18.62 ± 1.74 | 17.81 ± 1.79 | 12.75 ± 1.53 | 12.81 ± 1.25 | 12.90 ± 1.76 | 13.37 ± 0.93 |
| In vivo 31P spectroscopy in the whole brain | ||||||||
| 11 month | ||||||||
| Metabolites | 5xFAD | WT | ||||||
| tATP/PCr | 1.86 ± 0.22 | 1.78 ± 0.15 | ||||||
| Pi/PCr | 0.40 ± 0.13 | 0.45 ± 0.08 | ||||||
| PME/PCr | 0.66 ± 0.07 | 0.76 ± 0.03 | ||||||
| PDE/PCr | 0.36 ± 0.07 | 0.26 ± 0.06 | ||||||
| NADP/PCr | 0.54 ± 0.14 | 0.81 ± 0.11 | ||||||
Disclaimer/Publisher’s Note: The statements, opinions and data contained in all publications are solely those of the individual author(s) and contributor(s) and not of MDPI and/or the editor(s). MDPI and/or the editor(s) disclaim responsibility for any injury to people or property resulting from any ideas, methods, instructions or products referred to in the content. |
© 2023 by the authors. Licensee MDPI, Basel, Switzerland. This article is an open access article distributed under the terms and conditions of the Creative Commons Attribution (CC BY) license (https://creativecommons.org/licenses/by/4.0/).
Share and Cite
Yoo, C.-H.; Kim, J.; Baek, H.-M.; Chang, K.-A.; Choe, B.-Y. Neurodegenerative Changes in the Brains of the 5xFAD Alzheimer’s Disease Model Mice Investigated by High-Field and High-Resolution Magnetic Resonance Imaging and Multi-Nuclei Magnetic Resonance Spectroscopy. Int. J. Mol. Sci. 2023, 24, 5073. https://doi.org/10.3390/ijms24065073
Yoo C-H, Kim J, Baek H-M, Chang K-A, Choe B-Y. Neurodegenerative Changes in the Brains of the 5xFAD Alzheimer’s Disease Model Mice Investigated by High-Field and High-Resolution Magnetic Resonance Imaging and Multi-Nuclei Magnetic Resonance Spectroscopy. International Journal of Molecular Sciences. 2023; 24(6):5073. https://doi.org/10.3390/ijms24065073
Chicago/Turabian StyleYoo, Chi-Hyeon, Jinho Kim, Hyeon-Man Baek, Keun-A Chang, and Bo-Young Choe. 2023. "Neurodegenerative Changes in the Brains of the 5xFAD Alzheimer’s Disease Model Mice Investigated by High-Field and High-Resolution Magnetic Resonance Imaging and Multi-Nuclei Magnetic Resonance Spectroscopy" International Journal of Molecular Sciences 24, no. 6: 5073. https://doi.org/10.3390/ijms24065073