
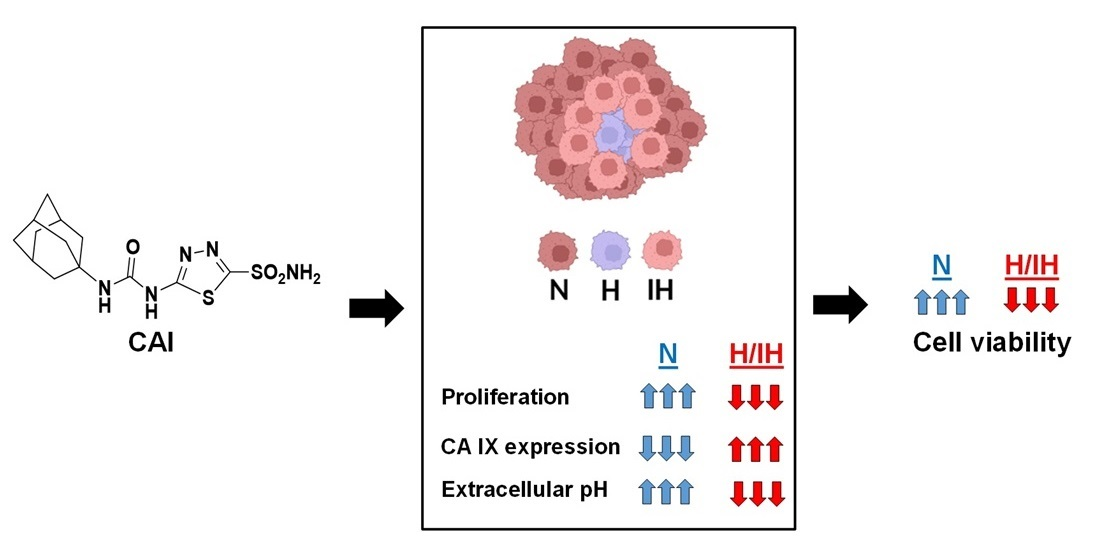
Expression Dynamics of CA IX Epitope in Cancer Cells under Intermittent Hypoxia Correlates with Extracellular pH Drop and Cell Killing by Ureido-Sulfonamide CA IX Inhibitors

 and
and
Abstract
:
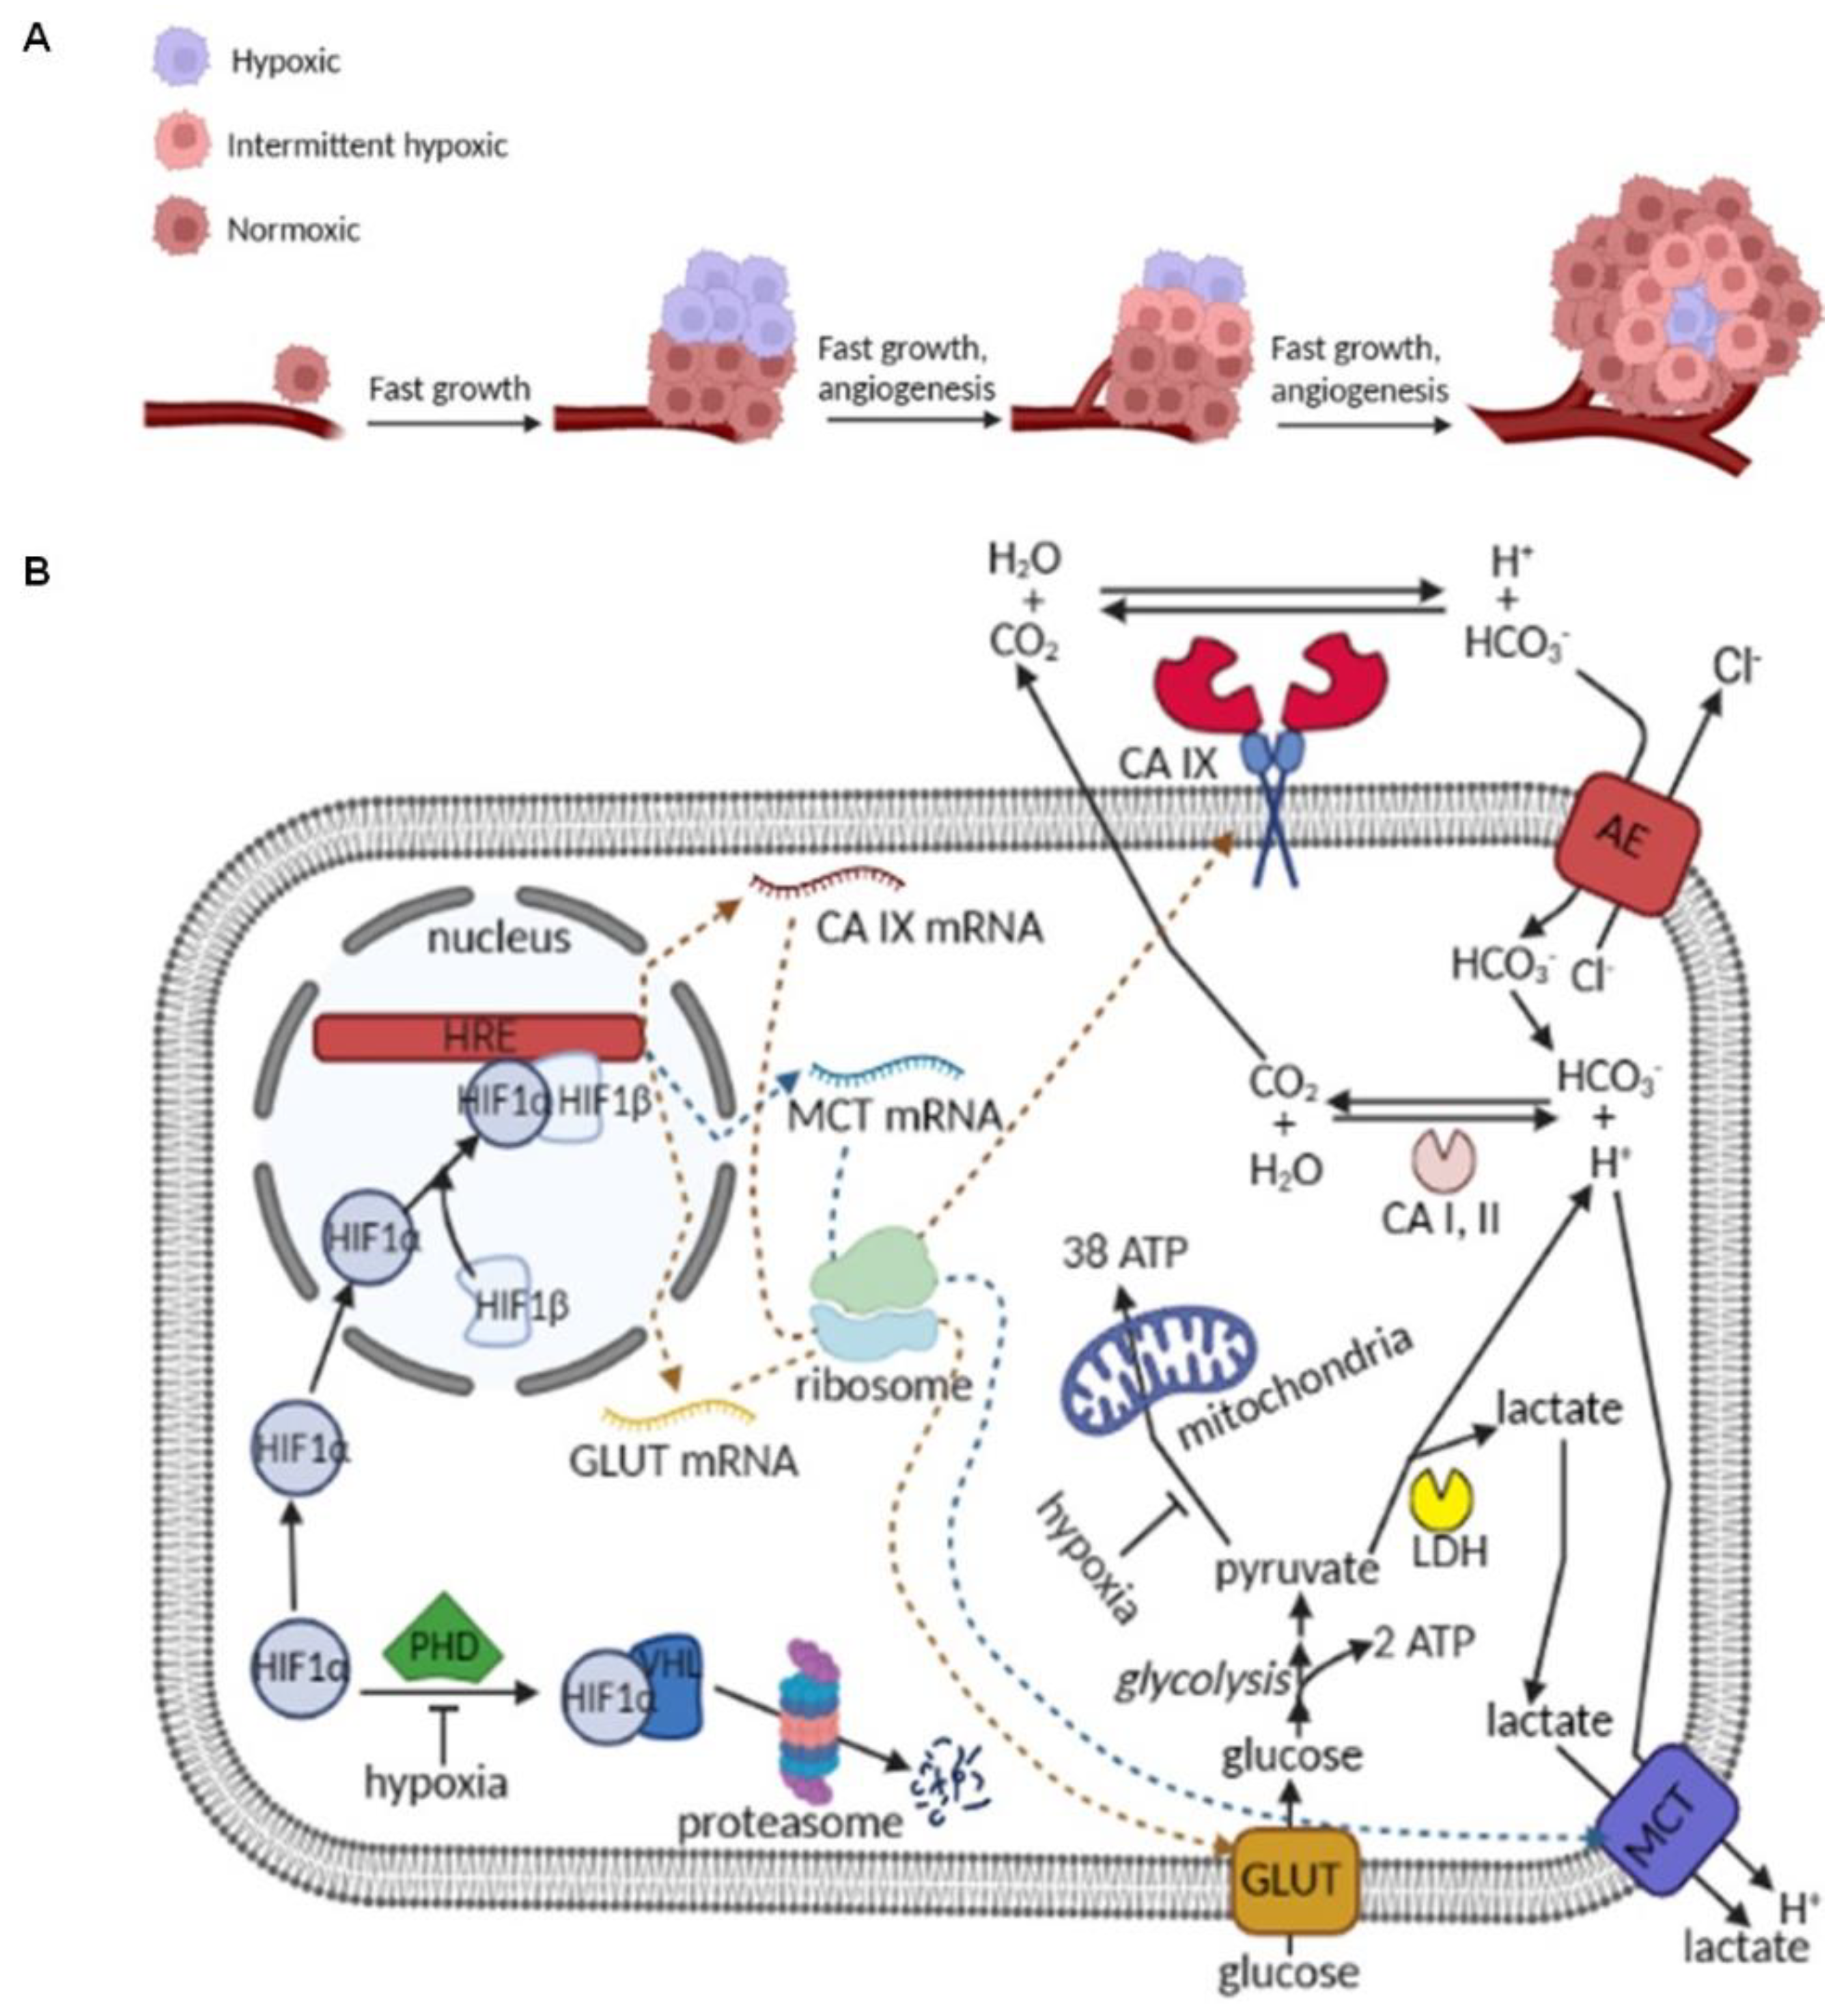
1. Introduction
2. Results and Discussion
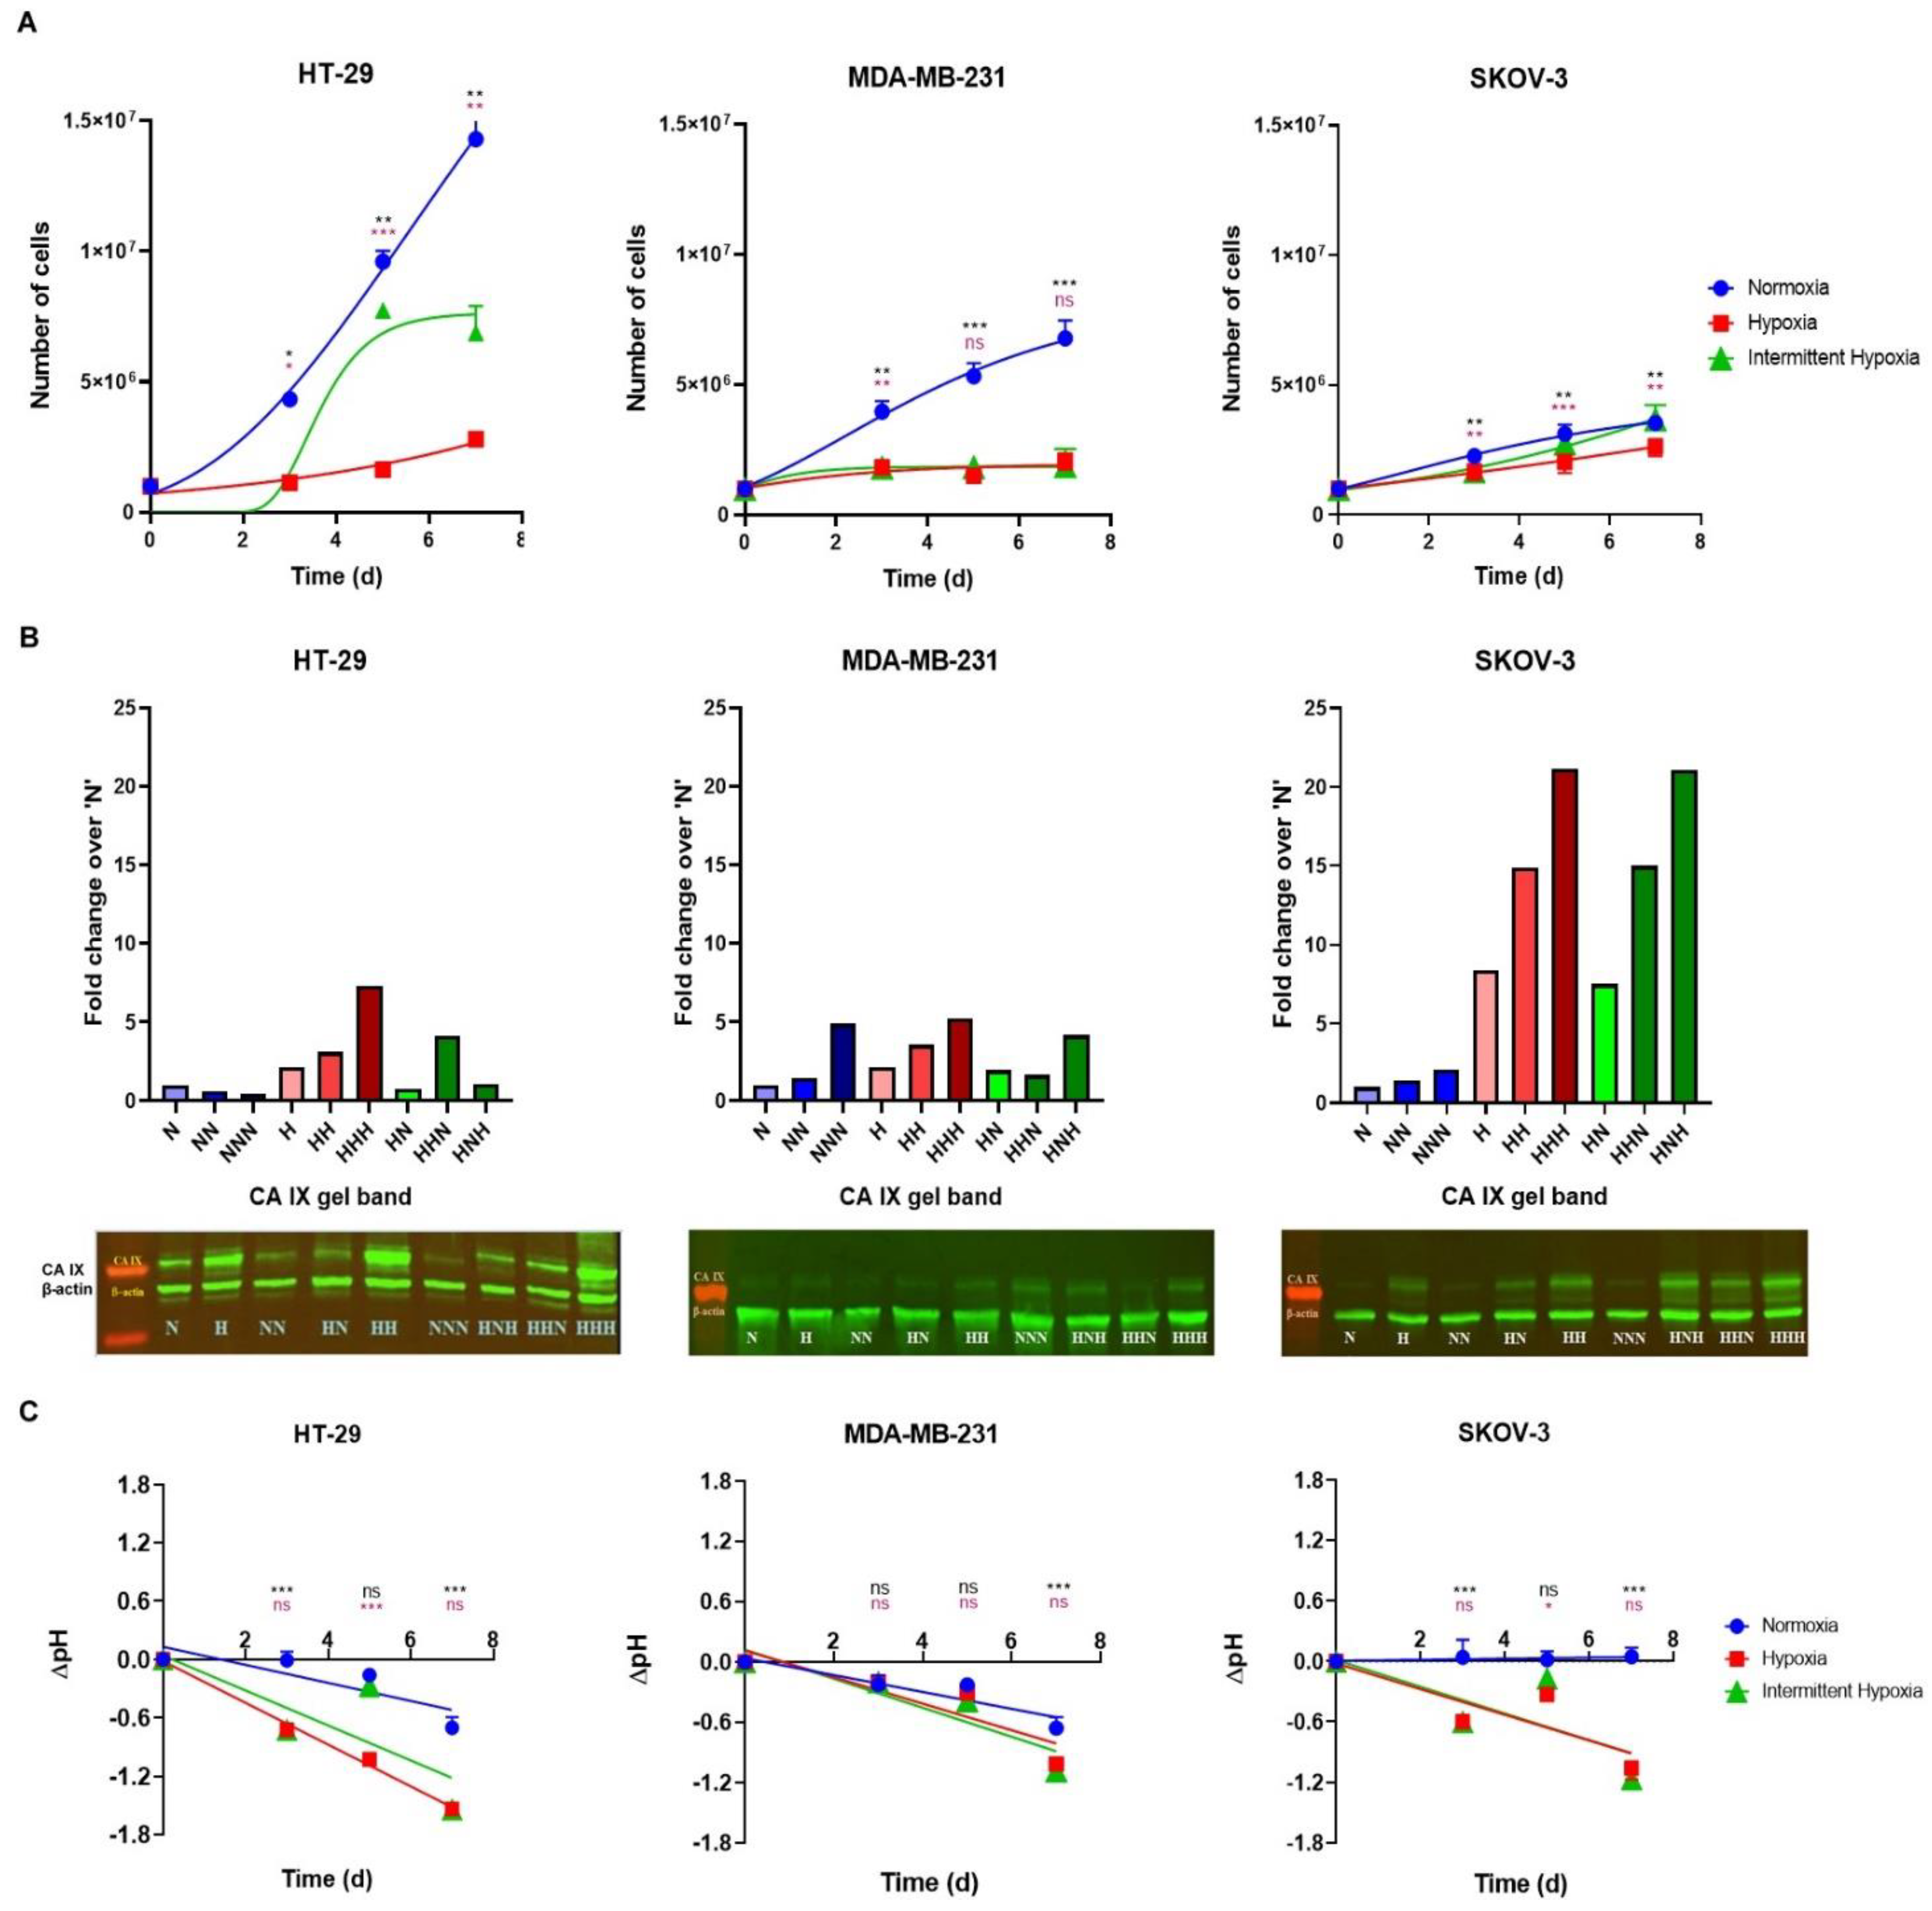
2.1. Cells Growth Dynamics
2.2. Level of CA IX Expression
2.3. Extracellular pH
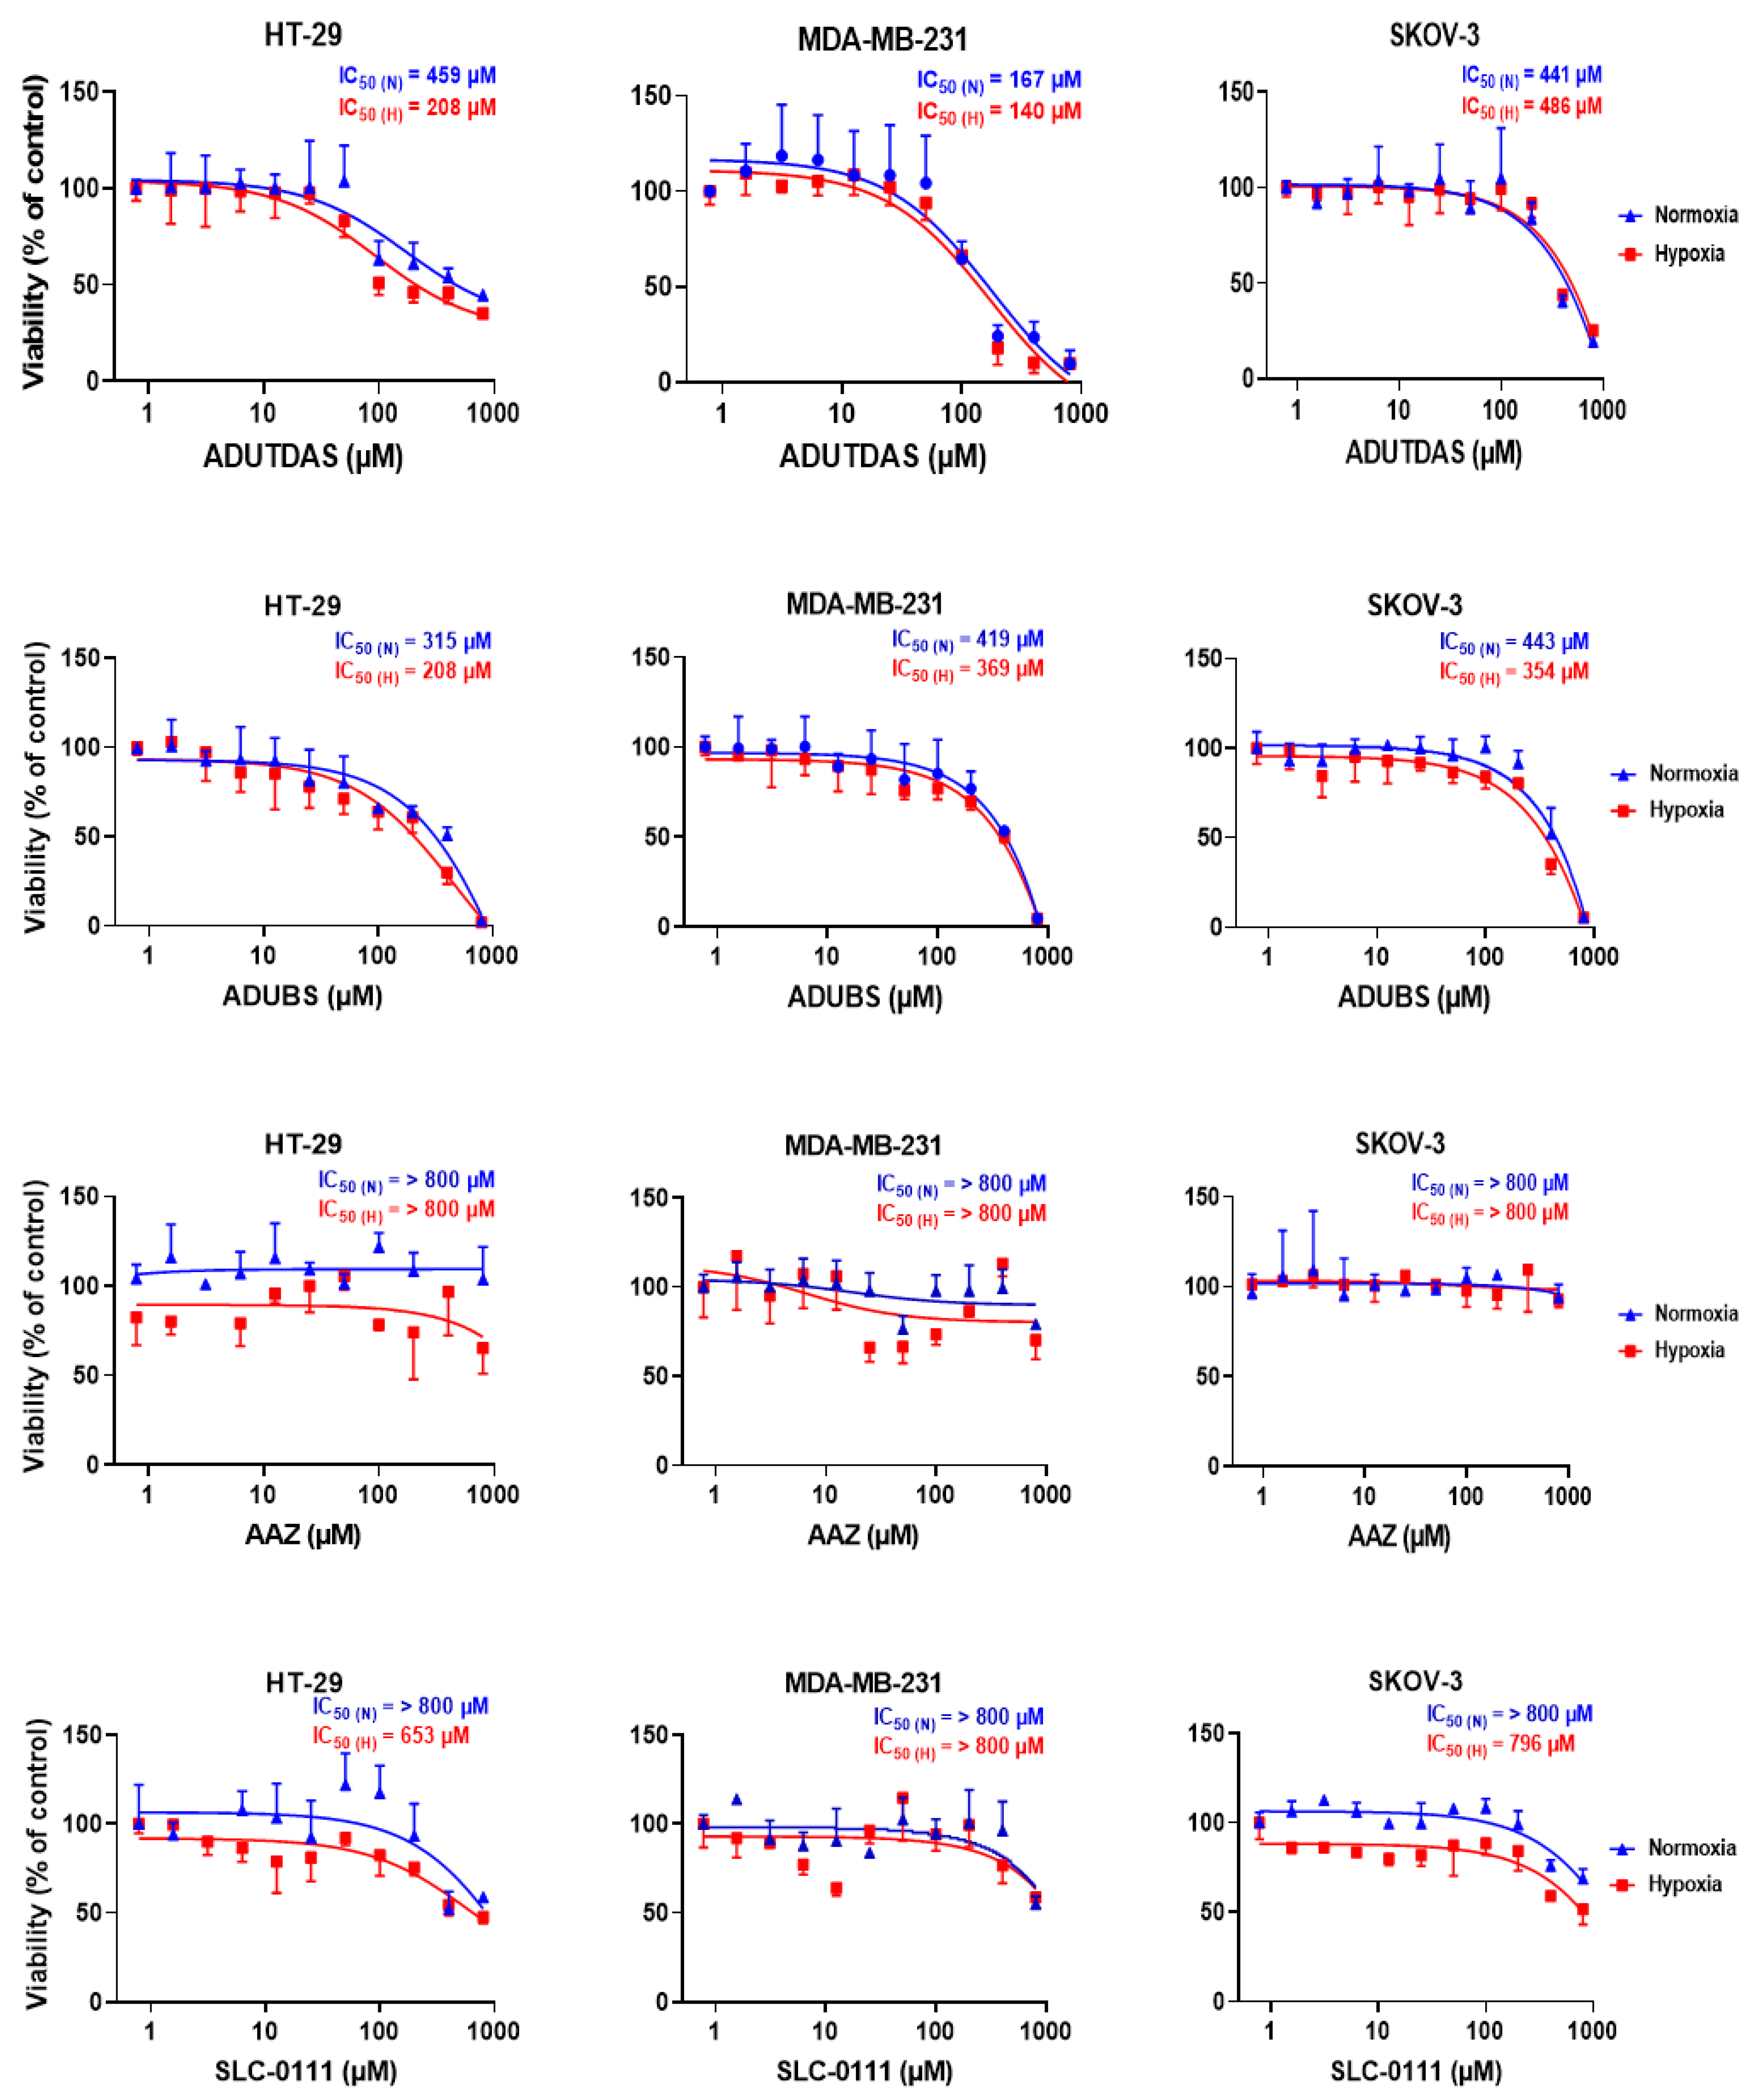
2.4. Cell Viability under Normoxia and Hypoxia
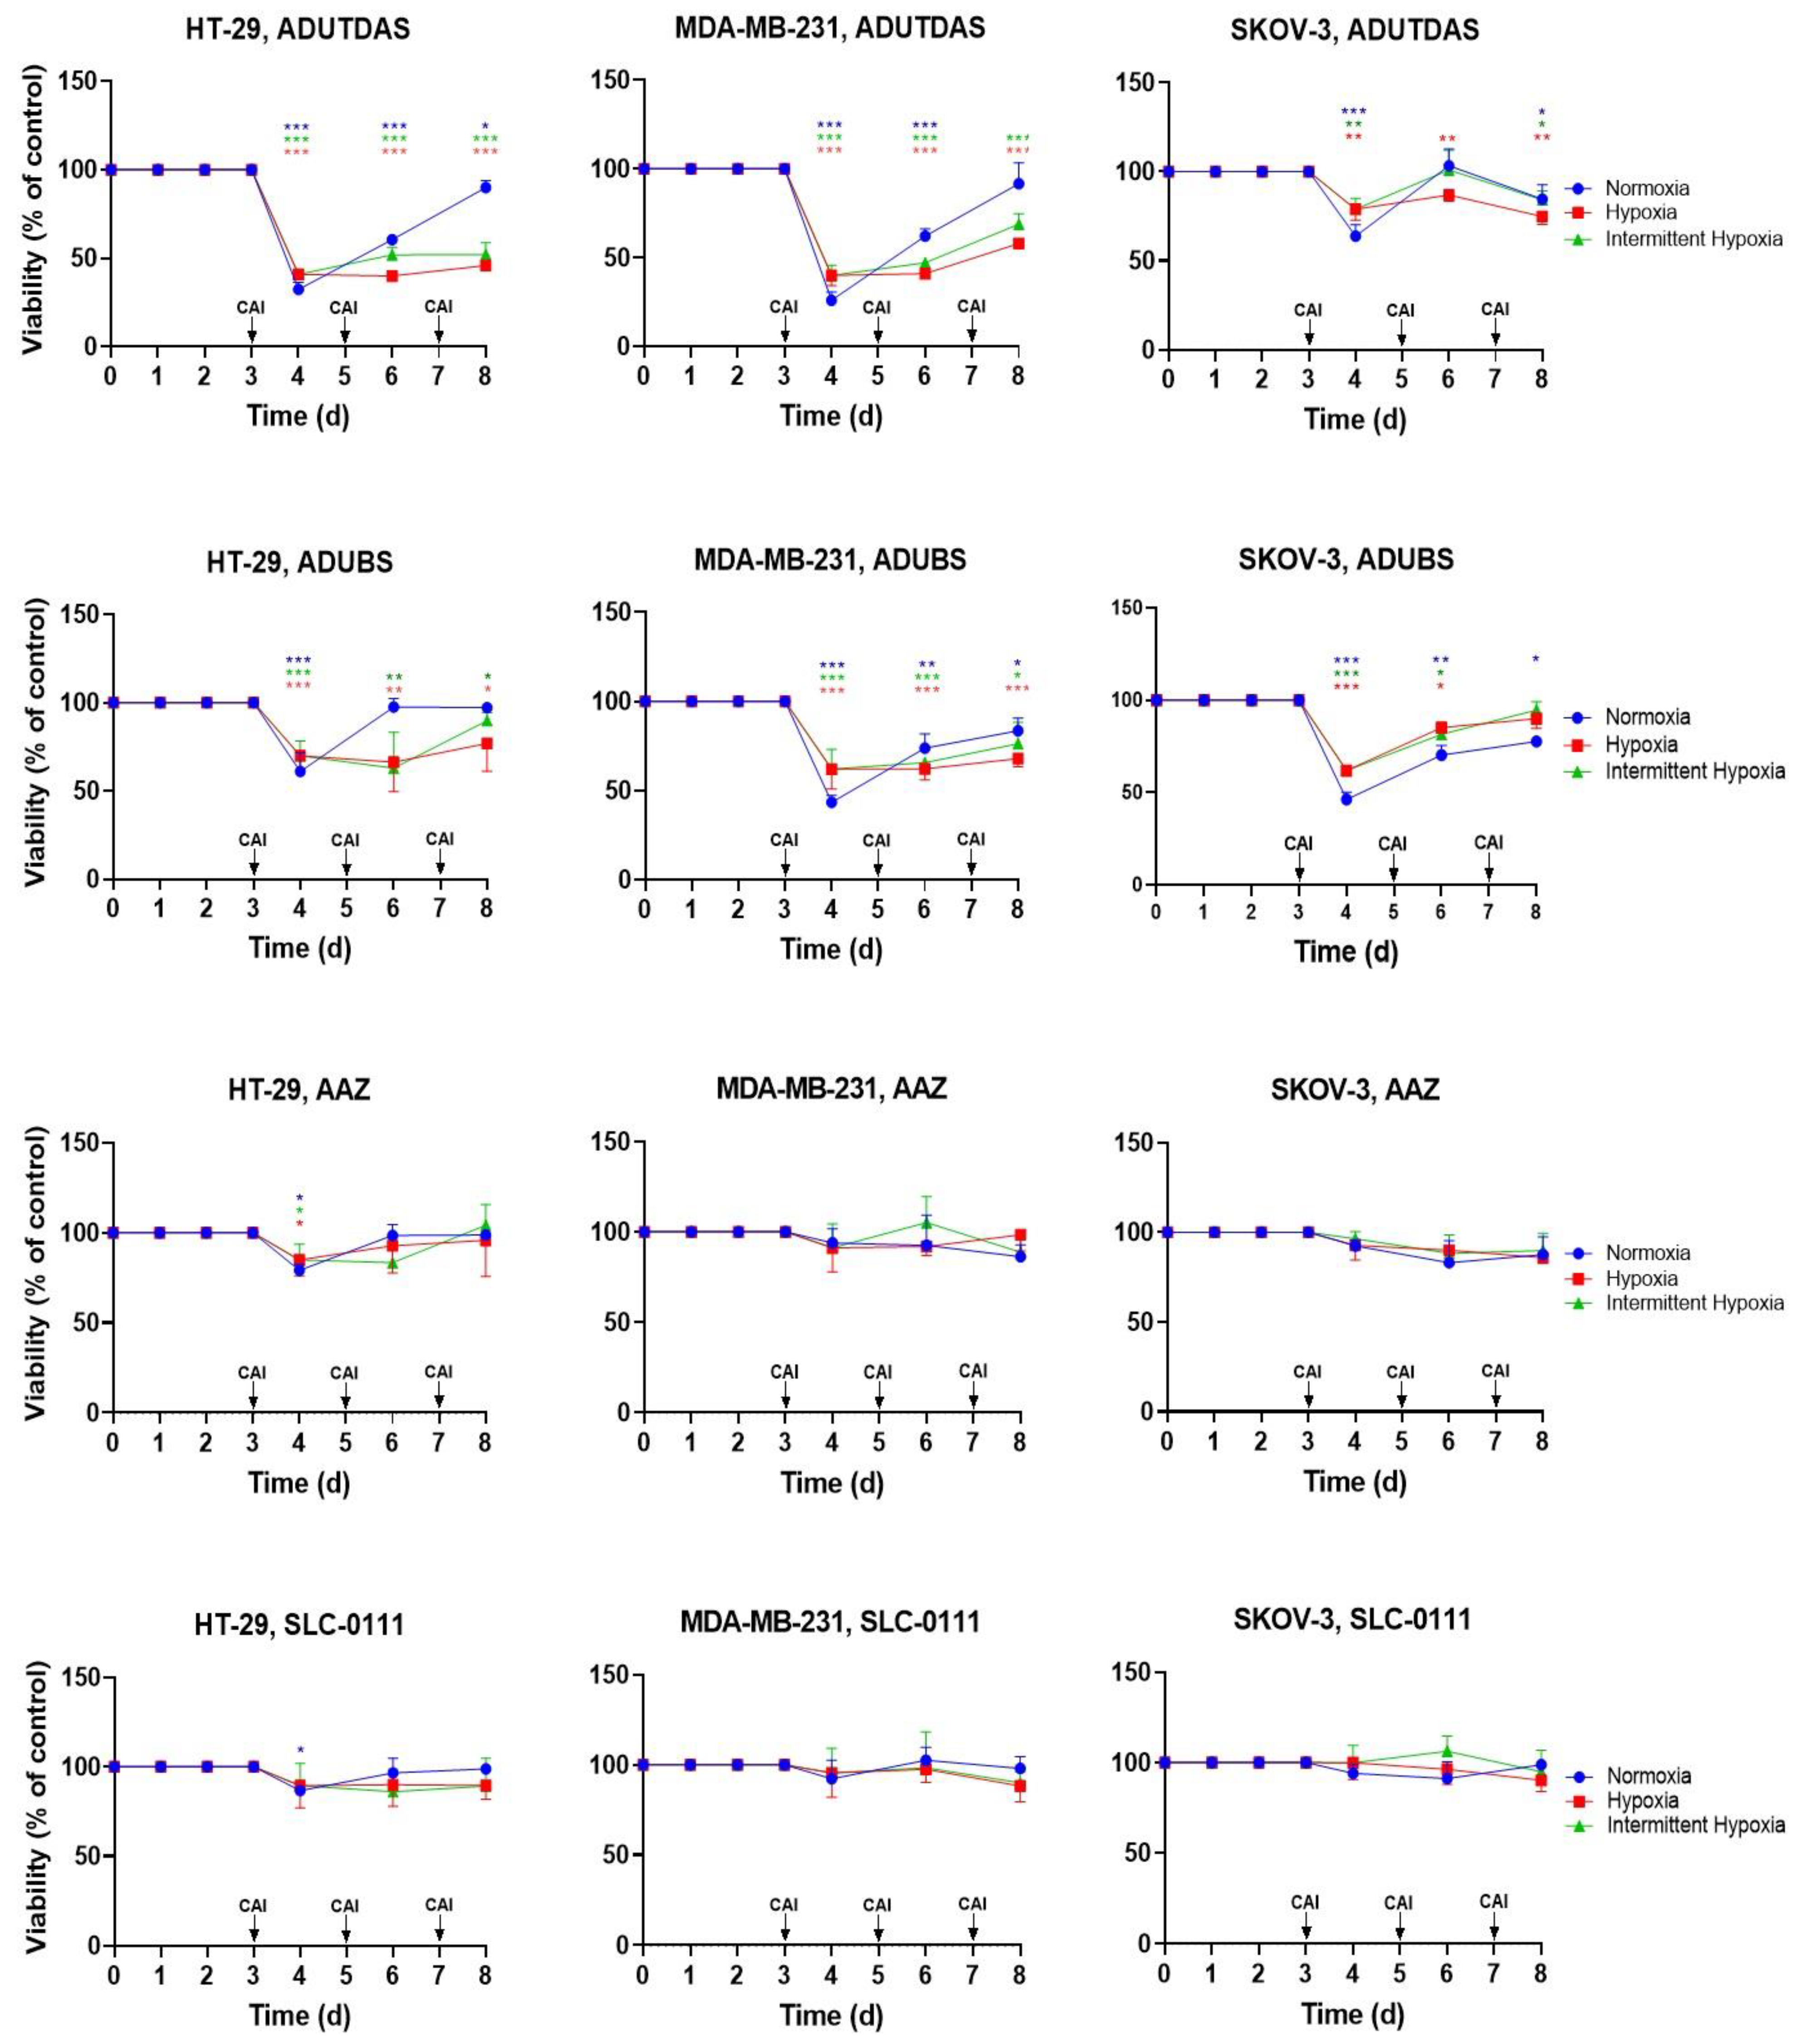
2.5. Cell Viability under Intermittent Hypoxia
3. Materials and Methods
3.1. Materials
3.2. Cell Culture
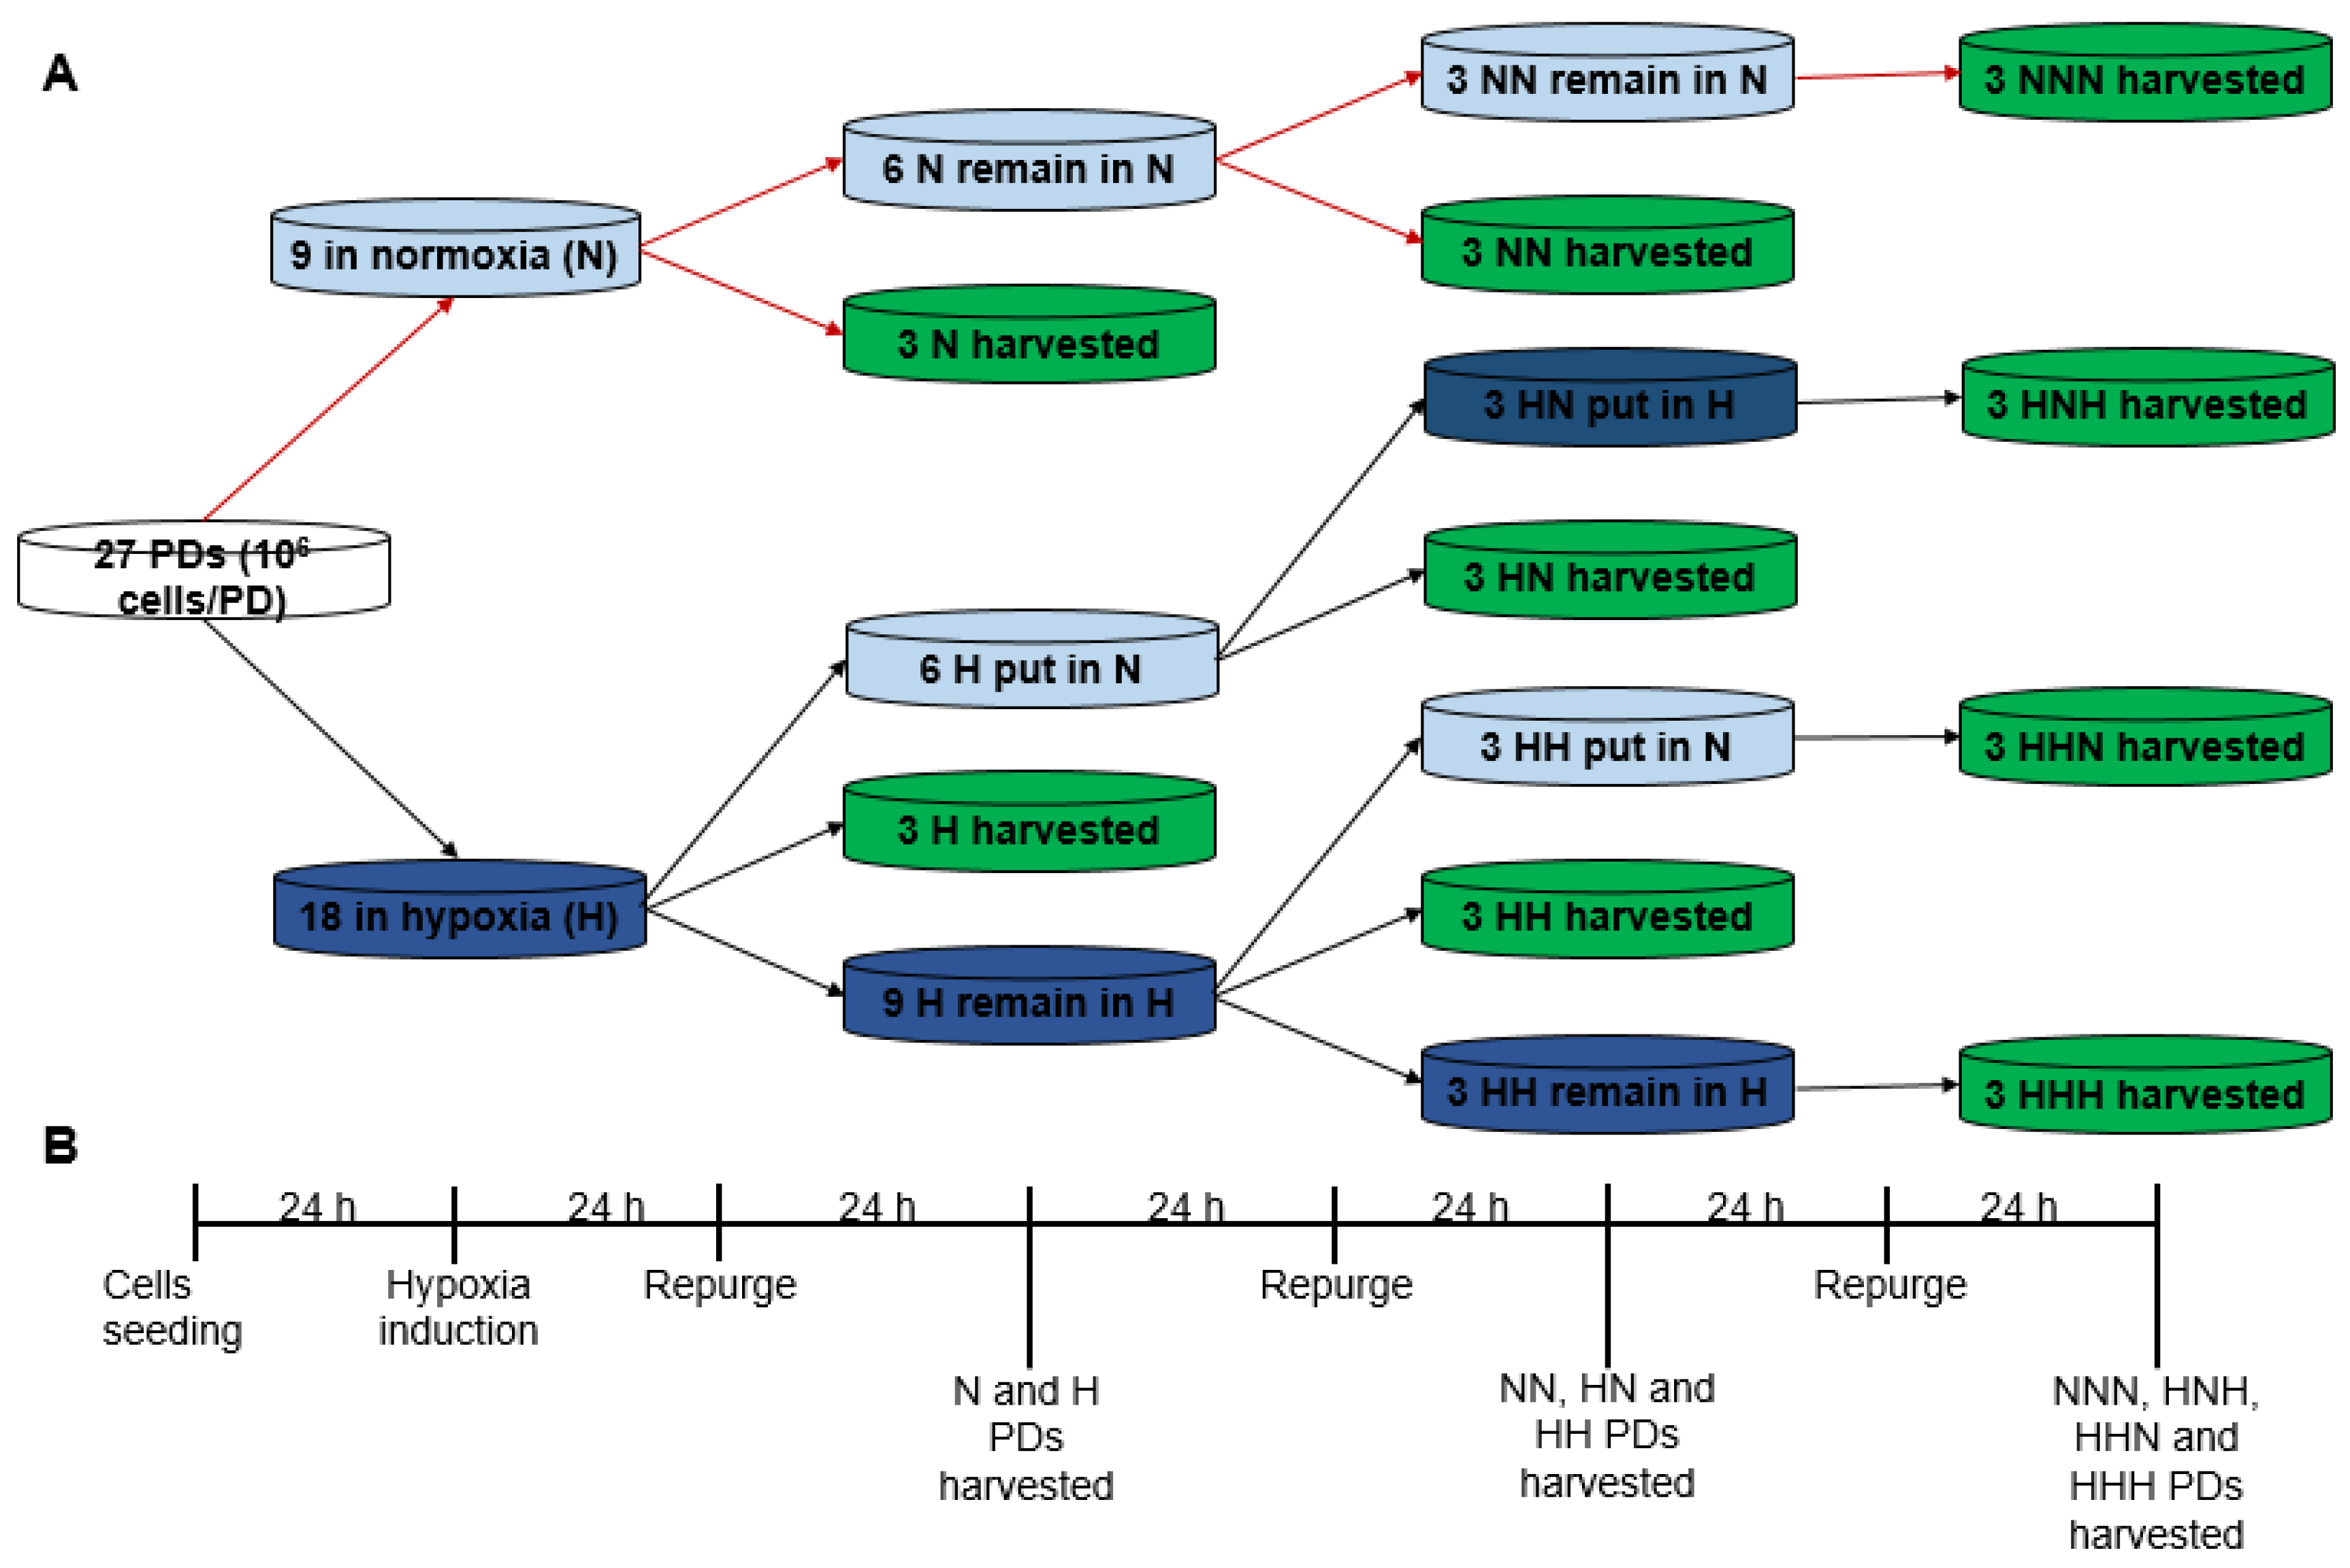
3.3. Study of Cells Growth Dynamics under Normoxia, Hypoxia and Intermittent Hypoxia
3.4. Western Blotting
3.5. Measurement of Extracellular pH
3.6. Cell Viability Assay
4. Conclusions
Author Contributions
Funding
Institutional Review Board Statement
Informed Consent Statement
Data Availability Statement
Acknowledgments
Conflicts of Interest
References
- Hanahan, D.; Weinberg, R.A. The hallmarks of cancer. Cell 2000, 100, 57–70. [Google Scholar] [CrossRef] [PubMed] [Green Version]
- Hanahan, D.; Weinberg, R.A. Hallmarks of cancer: The next generation. Cell 2011, 144, 646–674. [Google Scholar] [CrossRef] [PubMed] [Green Version]
- Kendal, W.S. Gompertzian growth as a consequence of tumor heterogeneity. Math. Biosci. 1985, 73, 103–107. [Google Scholar] [CrossRef]
- Grimes, D.R.; Kannan, P.; McIntyre, A.; Kavanagh, A.; Siddiky, A.; Wigfield, S.; Harris, A.; Partridge, M. The Role of Oxygen in Avascular Tumor Growth. PLoS ONE 2016, 11, e0153692. [Google Scholar] [CrossRef] [PubMed] [Green Version]
- Carnero, A.; Lleonart, M. The hypoxic microenvironment: A determinant of cancer stem cell evolution. Bioessays 2016, 38 (Suppl. S1), S65–S74. [Google Scholar] [CrossRef]
- Shabana, A.M.; Ilies, M.A. Drug Delivery to Hypoxic Tumors Targeting Carbonic Anhydrase IX. In Targeted Nanosystems for Therapeutic Applications: New Concepts, Dynamic Properties, Efficiency, and Toxicity; American Chemical Society: Washington, DC, USA, 2019; Volume 1309, pp. 223–252. [Google Scholar]
- Semenza, G.L. Hypoxia and cancer. Cancer Metastasis Rev. 2007, 26, 223–224. [Google Scholar] [CrossRef]
- Trédan, O.; Galmarini, C.M.; Patel, K.; Tannock, I.F. Drug resistance and the solid tumor microenvironment. J. Natl. Cancer Inst. 2007, 99, 1441–1454. [Google Scholar] [CrossRef] [Green Version]
- Muz, B.; de la Puente, P.; Azab, F.; Azab, A.K. The role of hypoxia in cancer progression, angiogenesis, metastasis, and resistance to therapy. Hypoxia 2015, 3, 83–92. [Google Scholar] [CrossRef] [Green Version]
- Eales, K.L.; Hollinshead, K.E.; Tennant, D.A. Hypoxia and metabolic adaptation of cancer cells. Oncogenesis 2016, 5, e190. [Google Scholar] [CrossRef] [Green Version]
- Semenza, G.L. Targeting HIF-1 for cancer therapy. Nat. Rev. Cancer 2003, 3, 721–732. [Google Scholar] [CrossRef]
- Semenza, G.L. Hypoxia-inducible factors: Mediators of cancer progression and targets for cancer therapy. Trends Pharmacol. Sci. 2012, 33, 207–214. [Google Scholar] [CrossRef] [Green Version]
- Appelhoff, R.J.; Tian, Y.M.; Raval, R.R.; Turley, H.; Harris, A.L.; Pugh, C.W.; Ratcliffe, P.J.; Gleadle, J.M. Differential function of the prolyl hydroxylases PHD1, PHD2, and PHD3 in the regulation of hypoxia-inducible factor. J. Biol. Chem. 2004, 279, 38458–38465. [Google Scholar] [CrossRef] [PubMed] [Green Version]
- Jaakkola, P.; Mole, D.R.; Tian, Y.M.; Wilson, M.I.; Gielbert, J.; Gaskell, S.J.; von Kriegsheim, A.; Hebestreit, H.F.; Mukherji, M.; Schofield, C.J.; et al. Targeting of HIF-alpha to the von Hippel-Lindau ubiquitylation complex by O2-regulated prolyl hydroxylation. Science 2001, 292, 468–472. [Google Scholar] [CrossRef] [PubMed]
- Cai, Q.; Verma, S.C.; Kumar, P.; Ma, M.; Robertson, E.S. Hypoxia inactivates the VHL tumor suppressor through PIASy-mediated SUMO modification. PLoS ONE 2010, 5, e9720. [Google Scholar] [CrossRef] [PubMed] [Green Version]
- Philip, B.; Ito, K.; Moreno-Sánchez, R.; Ralph, S.J. HIF expression and the role of hypoxic microenvironments within primary tumours as protective sites driving cancer stem cell renewal and metastatic progression. Carcinogenesis 2013, 34, 1699–1707. [Google Scholar] [CrossRef] [Green Version]
- Hon, W.C.; Wilson, M.I.; Harlos, K.; Claridge, T.D.; Schofield, C.J.; Pugh, C.W.; Maxwell, P.H.; Ratcliffe, P.J.; Stuart, D.I.; Jones, E.Y. Structural basis for the recognition of hydroxyproline in HIF-1 alpha by pVHL. Nature 2002, 417, 975–978. [Google Scholar] [CrossRef] [PubMed]
- Kaelin, W.G., Jr. The von Hippel-Lindau tumour suppressor protein: O2 sensing and cancer. Nat. Rev. Cancer 2008, 8, 865–873. [Google Scholar] [CrossRef]
- Maxwell, P.H.; Wiesener, M.S.; Chang, G.W.; Clifford, S.C.; Vaux, E.C.; Cockman, M.E.; Wykoff, C.C.; Pugh, C.W.; Maher, E.R.; Ratcliffe, P.J. The tumour suppressor protein VHL targets hypoxia-inducible factors for oxygen-dependent proteolysis. Nature 1999, 399, 271–275. [Google Scholar] [CrossRef]
- Pouysségur, J.; Dayan, F.; Mazure, N.M. Hypoxia signalling in cancer and approaches to enforce tumour regression. Nature 2006, 441, 437–443. [Google Scholar] [CrossRef]
- Ruan, K.; Song, G.; Ouyang, G. Role of hypoxia in the hallmarks of human cancer. J. Cell. Biochem. 2009, 107, 1053–1062. [Google Scholar] [CrossRef]
- Grover-McKay, M.; Walsh, S.A.; Seftor, E.A.; Thomas, P.A.; Hendrix, M.J. Role for glucose transporter 1 protein in human breast cancer. Pathol. Oncol. Res. 1998, 4, 115–120. [Google Scholar] [CrossRef] [PubMed]
- Pastorek, J.; Pastoreková, S.; Callebaut, I.; Mornon, J.P.; Zelník, V.; Opavský, R.; Zat’ovicová, M.; Liao, S.; Portetelle, D.; Stanbridge, E.J.; et al. Cloning and characterization of MN, a human tumor-associated protein with a domain homologous to carbonic anhydrase and a putative helix-loop-helix DNA binding segment. Oncogene 1994, 9, 2877–2888. [Google Scholar] [PubMed]
- Hilvo, M.; Baranauskiene, L.; Salzano, A.M.; Scaloni, A.; Matulis, D.; Innocenti, A.; Scozzafava, A.; Monti, S.M.; Di Fiore, A.; De Simone, G.; et al. Biochemical characterization of CA IX, one of the most active carbonic anhydrase isozymes. J. Biol. Chem. 2008, 283, 27799–27809. [Google Scholar] [CrossRef] [Green Version]
- Neri, D.; Supuran, C.T. Interfering with pH regulation in tumours as a therapeutic strategy. Nat. Rev. Drug Discov. 2011, 10, 767–777. [Google Scholar] [CrossRef] [Green Version]
- Supuran, C.T. Carbonic anhydrases: Novel therapeutic applications for inhibitors and activators. Nat. Rev. Drug Discov. 2008, 7, 168–181. [Google Scholar] [CrossRef] [PubMed]
- Pinheiro, C.; Longatto-Filho, A.; Scapulatempo, C.; Ferreira, L.; Martins, S.; Pellerin, L.; Rodrigues, M.; Alves, V.A.; Schmitt, F.; Baltazar, F. Increased expression of monocarboxylate transporters 1, 2, and 4 in colorectal carcinomas. Virchows Arch. 2008, 452, 139–146. [Google Scholar] [CrossRef]
- Sonveaux, P.; Copetti, T.; De Saedeleer, C.J.; Végran, F.; Verrax, J.; Kennedy, K.M.; Moon, E.J.; Dhup, S.; Danhier, P.; Frérart, F.; et al. Targeting the lactate transporter MCT1 in endothelial cells inhibits lactate-induced HIF-1 activation and tumor angiogenesis. PLoS ONE 2012, 7, e33418. [Google Scholar] [CrossRef] [Green Version]
- Sonveaux, P.; Végran, F.; Schroeder, T.; Wergin, M.C.; Verrax, J.; Rabbani, Z.N.; De Saedeleer, C.J.; Kennedy, K.M.; Diepart, C.; Jordan, B.F.; et al. Targeting lactate-fueled respiration selectively kills hypoxic tumor cells in mice. J. Clin. Invest. 2008, 118, 3930–3942. [Google Scholar] [CrossRef] [Green Version]
- Zamanova, S.; Shabana, A.M.; Mondal, U.K.; Ilies, M.A. Carbonic anhydrases as disease markers. Expert Opin. Ther. Pat. 2019, 29, 509–533. [Google Scholar] [CrossRef]
- Lemon, N.; Canepa, E.; Ilies, M.A.; Fossati, S. Carbonic Anhydrases as Potential Targets Against Neurovascular Unit Dysfunction in Alzheimer’s Disease and Stroke. Front. Aging Neurosci. 2021, 13, 772278. [Google Scholar] [CrossRef]
- Svastová, E.; Hulíková, A.; Rafajová, M.; Zat’ovicová, M.; Gibadulinová, A.; Casini, A.; Cecchi, A.; Scozzafava, A.; Supuran, C.T.; Pastorek, J.; et al. Hypoxia activates the capacity of tumor-associated carbonic anhydrase IX to acidify extracellular pH. FEBS Lett. 2004, 577, 439–445. [Google Scholar] [CrossRef] [PubMed] [Green Version]
- Swietach, P.; Wigfield, S.; Cobden, P.; Supuran, C.T.; Harris, A.L.; Vaughan-Jones, R.D. Tumor-associated carbonic anhydrase 9 spatially coordinates intracellular pH in three-dimensional multicellular growths. J. Biol. Chem. 2008, 283, 20473–20483. [Google Scholar] [CrossRef] [Green Version]
- Pastorekova, S.; Gillies, R.J. The role of carbonic anhydrase IX in cancer development: Links to hypoxia, acidosis, and beyond. Cancer Metastasis Rev. 2019, 38, 65–77. [Google Scholar] [CrossRef] [PubMed]
- Swietach, P.; Patiar, S.; Supuran, C.T.; Harris, A.L.; Vaughan-Jones, R.D. The role of carbonic anhydrase 9 in regulating extracellular and intracellular ph in three-dimensional tumor cell growths. J. Biol. Chem. 2009, 284, 20299–20310. [Google Scholar] [CrossRef] [PubMed] [Green Version]
- Gerweck, L.E.; Vijayappa, S.; Kozin, S. Tumor pH controls the in vivo efficacy of weak acid and base chemotherapeutics. Mol. Cancer Ther. 2006, 5, 1275–1279. [Google Scholar] [CrossRef] [PubMed] [Green Version]
- Gieling, R.G.; Parker, C.A.; De Costa, L.A.; Robertson, N.; Harris, A.L.; Stratford, I.J.; Williams, K.J. Inhibition of carbonic anhydrase activity modifies the toxicity of doxorubicin and melphalan in tumour cells in vitro. J. Enzym. Inhib. Med. Chem. 2013, 28, 360–369. [Google Scholar] [CrossRef]
- Wardman, P. Electron transfer and oxidative stress as key factors in the design of drugs selectively active in hypoxia. Curr. Med. Chem. 2001, 8, 739–761. [Google Scholar] [CrossRef]
- Ward, C.; Meehan, J.; Gray, M.; Kunkler, I.H.; Langdon, S.P.; Argyle, D.J. Carbonic Anhydrase IX (CAIX), Cancer, and Radiation Responsiveness. Metabolites 2018, 8, 13. [Google Scholar] [CrossRef] [Green Version]
- Loncaster, J.A.; Harris, A.L.; Davidson, S.E.; Logue, J.P.; Hunter, R.D.; Wycoff, C.C.; Pastorek, J.; Ratcliffe, P.J.; Stratford, I.J.; West, C.M. Carbonic anhydrase (CA IX) expression, a potential new intrinsic marker of hypoxia: Correlations with tumor oxygen measurements and prognosis in locally advanced carcinoma of the cervix. Cancer Res. 2001, 61, 6394–6399. [Google Scholar]
- Hussain, S.A.; Palmer, D.H.; Ganesan, R.; Hiller, L.; Gregory, J.; Murray, P.G.; Pastorek, J.; Young, L.; James, N.D. Carbonic anhydrase IX, a marker of hypoxia: Correlation with clinical outcome in transitional cell carcinoma of the bladder. Oncol. Rep. 2004, 11, 1005–1010. [Google Scholar] [CrossRef]
- Kivela, A.J.; Parkkila, S.; Saarnio, J.; Karttunen, T.J.; Kivela, J.; Parkkila, A.K.; Pastorekova, S.; Pastorek, J.; Waheed, A.; Sly, W.S.; et al. Expression of transmembrane carbonic anhydrase isoenzymes IX and XII in normal human pancreas and pancreatic tumours. Histochem. Cell Biol. 2000, 114, 197–204. [Google Scholar] [CrossRef] [PubMed]
- Hynninen, P.; Vaskivuo, L.; Saarnio, J.; Haapasalo, H.; Kivela, J.; Pastorekova, S.; Pastorek, J.; Waheed, A.; Sly, W.S.; Puistola, U.; et al. Expression of transmembrane carbonic anhydrases IX and XII in ovarian tumours. Histopathology 2006, 49, 594–602. [Google Scholar] [CrossRef]
- Choschzick, M.; Oosterwijk, E.; Muller, V.; Woelber, L.; Simon, R.; Moch, H.; Tennstedt, P. Overexpression of carbonic anhydrase IX (CAIX) is an independent unfavorable prognostic marker in endometrioid ovarian cancer. Virchows Arch. 2011, 459, 193–200. [Google Scholar] [CrossRef]
- Hussain, S.A.; Ganesan, R.; Reynolds, G.; Gross, L.; Stevens, A.; Pastorek, J.; Murray, P.G.; Perunovic, B.; Anwar, M.S.; Billingham, L.; et al. Hypoxia-regulated carbonic anhydrase IX expression is associated with poor survival in patients with invasive breast cancer. Br. J. Cancer 2007, 96, 104–109. [Google Scholar] [CrossRef] [PubMed]
- Chen, C.L.; Chu, J.S.; Su, W.C.; Huang, S.C.; Lee, W.Y. Hypoxia and metabolic phenotypes during breast carcinogenesis: Expression of HIF-1alpha, GLUT1, and CAIX. Virchows Arch. 2010, 457, 53–61. [Google Scholar] [CrossRef] [PubMed]
- Carlin, S.; Khan, N.; Ku, T.; Longo, V.A.; Larson, S.M.; Smith-Jones, P.M. Molecular targeting of carbonic anhydrase IX in mice with hypoxic HT29 colorectal tumor xenografts. PLoS ONE 2010, 5, e10857. [Google Scholar] [CrossRef] [Green Version]
- Akocak, S.; Alam, M.R.; Shabana, A.M.; Sanku, R.K.; Vullo, D.; Thompson, H.; Swenson, E.R.; Supuran, C.T.; Ilies, M.A. PEGylated Bis-Sulfonamide Carbonic Anhydrase Inhibitors Can Efficiently Control the Growth of Several Carbonic Anhydrase IX-Expressing Carcinomas. J. Med. Chem. 2016, 59, 5077–5088. [Google Scholar] [CrossRef]
- Mondal, U.K.; Doroba, K.; Shabana, A.M.; Adelberg, R.; Alam, M.R.; Supuran, C.T.; Ilies, M.A. PEG Linker Length Strongly Affects Tumor Cell Killing by PEGylated Carbonic Anhydrase Inhibitors in Hypoxic Carcinomas Expressing Carbonic Anhydrase IX. Intl. J. Mol. Sci. 2021, 22, 1120. [Google Scholar] [CrossRef]
- Ilies, M.A.; Vullo, D.; Pastorek, J.; Scozzafava, A.; Ilies, M.; Caproiu, M.T.; Pastorekova, S.; Supuran, C.T. Carbonic anhydrase inhibitors. Inhibition of tumor-associated isozyme IX by halogenosulfanilamide and halogenophenylaminobenzolamide derivatives. J. Med. Chem. 2003, 46, 2187–2196. [Google Scholar] [CrossRef]
- Akocak, S.; Ilies, M.A. Next-generation primary sulfonamide carbonic anhydrase inhibitors. In Targeting Carbonic Anhydrases; Supuran, C.T., Capasso, C., Eds.; Future Science: London, UK, 2014; pp. 35–51. [Google Scholar]
- McDonald, P.C.; Winum, J.Y.; Supuran, C.T.; Dedhar, S. Recent developments in targeting carbonic anhydrase IX for cancer therapeutics. Oncotarget 2012, 3, 84–97. [Google Scholar] [CrossRef] [Green Version]
- Supuran, C.T.; Winum, J.Y. Carbonic anhydrase IX inhibitors in cancer therapy: An update. Future Med. Chem. 2015, 7, 1407–1414. [Google Scholar] [CrossRef] [PubMed]
- Wilkinson, B.L.; Bornaghi, L.F.; Houston, T.A.; Innocenti, A.; Vullo, D.; Supuran, C.T.; Poulsen, S.A. Inhibition of membrane-associated carbonic anhydrase isozymes IX, XII and XIV with a library of glycoconjugate benzenesulfonamides. Bioorg. Med. Chem. Lett. 2007, 17, 987–992. [Google Scholar] [CrossRef] [PubMed] [Green Version]
- Mahon, B.P.; Lomelino, C.L.; Ladwig, J.; Rankin, G.M.; Driscoll, J.M.; Salguero, A.L.; Pinard, M.A.; Vullo, D.; Supuran, C.T.; Poulsen, S.A.; et al. Mapping Selective Inhibition of the Cancer-Related Carbonic Anhydrase IX Using Structure-Activity Relationships of Glucosyl-Based Sulfamates. J. Med. Chem. 2015, 58, 6630–6638. [Google Scholar] [CrossRef] [PubMed] [Green Version]
- Carta, F.; Dumy, P.; Supuran, C.T.; Winum, J.Y. Multivalent Carbonic Anhydrases Inhibitors. Intl. J. Mol. Sci. 2019, 20, 5352. [Google Scholar] [CrossRef] [Green Version]
- Pacchiano, F.; Carta, F.; McDonald, P.C.; Lou, Y.; Vullo, D.; Scozzafava, A.; Dedhar, S.; Supuran, C.T. Ureido-substituted benzenesulfonamides potently inhibit carbonic anhydrase IX and show antimetastatic activity in a model of breast cancer metastasis. J. Med. Chem. 2011, 54, 1896–1902. [Google Scholar] [CrossRef] [Green Version]
- Mboge, M.Y.; McKenna, R.; Frost, S.C. Advances in Anti-Cancer Drug Development Targeting Carbonic Anhydrase IX and XII. Top. Anticancer Res. 2015, 5, 3–42. [Google Scholar]
- Akocak, S.; Güzel-Akdemir, Ö.; Kishore Kumar Sanku, R.; Russom, S.S.; Iorga, B.I.; Supuran, C.T.; Ilies, M.A. Pyridinium derivatives of 3-aminobenzenesulfonamide are nanomolar-potent inhibitors of tumor-expressed carbonic anhydrase isozymes CA IX and CA XII. Bioorg. Chem. 2020, 103, 104204. [Google Scholar] [CrossRef]
- Andring, J.T.; Fouch, M.; Akocak, S.; Angeli, A.; Supuran, C.T.; Ilies, M.A.; McKenna, R. Structural Basis of Nanomolar Inhibition of Tumor-Associated Carbonic Anhydrase IX: X-Ray Crystallographic and Inhibition Study of Lipophilic Inhibitors with Acetazolamide Backbone. J. Med. Chem. 2020, 63, 13064–13075. [Google Scholar] [CrossRef]
- Alterio, V.; Di Fiore, A.; D’Ambrosio, K.; Supuran, C.T.; De Simone, G. Multiple binding modes of inhibitors to carbonic anhydrases: How to design specific drugs targeting 15 different isoforms? Chem. Rev. 2012, 112, 4421–4468. [Google Scholar] [CrossRef] [Green Version]
- Shabana, A.M.; Mondal, U.K.; Alam, M.R.; Spoon, T.; Ross, C.A.; Madesh, M.; Supuran, C.T.; Ilies, M.A. pH-Sensitive Multiligand Gold Nanoplatform Targeting Carbonic Anhydrase IX Enhances the Delivery of Doxorubicin to Hypoxic Tumor Spheroids and Overcomes the Hypoxia-Induced Chemoresistance. ACS Appl. Mat. Interfaces 2018, 10, 17792–17808. [Google Scholar] [CrossRef]
- Krall, N.; Pretto, F.; Decurtins, W.; Bernardes, G.J.; Supuran, C.T.; Neri, D. A small-molecule drug conjugate for the treatment of carbonic anhydrase IX expressing tumors. Angew. Chem. Int. Ed. Engl. 2014, 53, 4231–4235. [Google Scholar] [CrossRef] [PubMed]
- Ilies, M.A.; Winum, J.-Y. Chapter 16—Carbonic anhydrase inhibitors for the treatment of tumors: Therapeutic, immunologic, and diagnostic tools targeting isoforms IX and XII. In Carbonic Anhydrases; Supuran, C.T., Nocentini, A., Eds.; Academic Press: Cambridge, MA, USA, 2019; pp. 331–365. [Google Scholar]
- Burianova, V.; Kalinin, S.; Supuran, C.T.; Krasavin, M. Radiotracers for positron emission tomography (PET) targeting tumour-associated carbonic anhydrase isoforms. Eur. J. Med. Chem. 2021, 213, 113046. [Google Scholar] [CrossRef] [PubMed]
- Supuran, C.T.; Scozzafava, A.; Jurca, B.; Ilies, M.A. Carbonic anhydrase inhibitors—Part 49: Synthesis of substituted ureido and thioureido derivatives of aromatic/heterocyclic sulfonamides with increased affinities for isozyme I. Eur. J. Med. Chem. 1998, 33, 83–93. [Google Scholar] [CrossRef]
- Ilies, M.A.; Masereel, B.; Rolin, S.; Scozzafava, A.; Câmpeanu, G.; Cîmpeanu, V.; Supuran, C.T. Carbonic anhydrase inhibitors: Aromatic and heterocyclic sulfonamides incorporating adamantyl moieties with strong anticonvulsant activity. Bioorg. Med. Chem. 2004, 12, 2717–2726. [Google Scholar] [CrossRef]
- McDonald, P.C.; Chia, S.; Bedard, P.L.; Chu, Q.; Lyle, M.; Tang, L.; Singh, M.; Zhang, Z.; Supuran, C.T.; Renouf, D.J.; et al. A Phase 1 Study of SLC-0111, a Novel Inhibitor of Carbonic Anhydrase IX, in Patients With Advanced Solid Tumors. Am. J. Clin. Oncol. 2020, 43, 484–490. [Google Scholar] [CrossRef] [PubMed]
- Lou, Y.; McDonald, P.C.; Oloumi, A.; Chia, S.; Ostlund, C.; Ahmadi, A.; Kyle, A.; Auf dem Keller, U.; Leung, S.; Huntsman, D.; et al. Targeting tumor hypoxia: Suppression of breast tumor growth and metastasis by novel carbonic anhydrase IX inhibitors. Cancer Res. 2011, 71, 3364–3376. [Google Scholar] [CrossRef] [Green Version]
- De Simone, G.; Scozzafava, A.; Supuran, C.T. Which carbonic anhydrases are targeted by the antiepileptic sulfonamides and sulfamates? Chem. Biol. Drug Des. 2009, 74, 317–321. [Google Scholar] [CrossRef]
- Kumar, A.; Siwach, K.; Supuran, C.T.; Sharma, P.K. A decade of tail-approach based design of selective as well as potent tumor associated carbonic anhydrase inhibitors. Bioorg. Chem. 2022, 126, 105920. [Google Scholar] [CrossRef]


Disclaimer/Publisher’s Note: The statements, opinions and data contained in all publications are solely those of the individual author(s) and contributor(s) and not of MDPI and/or the editor(s). MDPI and/or the editor(s) disclaim responsibility for any injury to people or property resulting from any ideas, methods, instructions or products referred to in the content. |
© 2023 by the authors. Licensee MDPI, Basel, Switzerland. This article is an open access article distributed under the terms and conditions of the Creative Commons Attribution (CC BY) license (https://creativecommons.org/licenses/by/4.0/).
Share and Cite
Sufian, M.A.; Zamanova, S.; Shabana, A.M.; Kemp, B.; Mondal, U.K.; Supuran, C.T.; Ilies, M.A. Expression Dynamics of CA IX Epitope in Cancer Cells under Intermittent Hypoxia Correlates with Extracellular pH Drop and Cell Killing by Ureido-Sulfonamide CA IX Inhibitors. Int. J. Mol. Sci. 2023, 24, 4595. https://doi.org/10.3390/ijms24054595
Sufian MA, Zamanova S, Shabana AM, Kemp B, Mondal UK, Supuran CT, Ilies MA. Expression Dynamics of CA IX Epitope in Cancer Cells under Intermittent Hypoxia Correlates with Extracellular pH Drop and Cell Killing by Ureido-Sulfonamide CA IX Inhibitors. International Journal of Molecular Sciences. 2023; 24(5):4595. https://doi.org/10.3390/ijms24054595
Chicago/Turabian StyleSufian, Md. Abu, Sabina Zamanova, Ahmed M. Shabana, Brianna Kemp, Utpal K. Mondal, Claudiu T. Supuran, and Marc A. Ilies. 2023. "Expression Dynamics of CA IX Epitope in Cancer Cells under Intermittent Hypoxia Correlates with Extracellular pH Drop and Cell Killing by Ureido-Sulfonamide CA IX Inhibitors" International Journal of Molecular Sciences 24, no. 5: 4595. https://doi.org/10.3390/ijms24054595