Article

Peripheral and Central Iron Measures in Alcohol Use Disorder and Aging: A Quantitative Susceptibility Mapping Pilot Study

1
Center for Studies of Addiction, Department of Psychiatry, Perelman School of Medicine, University of Pennsylvania, 3535 Market St Ste 500, Philadelphia, PA 19104, USA
2
Department of Radiology, Weill Cornell Medicine, 525 E 68th St, New York, NY 10065, USA
3
Department of Radiology, Perelman School of Medicine, University of Pennsylvania, 3400 Civic Center Blvd, South Pavilion, Room 11-155, Philadelphia, PA 19104, USA
*
Author to whom correspondence should be addressed.
These authors contributed equally to this work.
Int. J. Mol. Sci. 2023, 24(5), 4461; https://doi.org/10.3390/ijms24054461
Submission received: 5 February 2023 / Revised: 18 February 2023 / Accepted: 21 February 2023 / Published: 24 February 2023
(This article belongs to the Special Issue Recent Advance on Iron Metabolism, Ferritin and Hepcidin Research)

Abstract

:
Chronic excessive alcohol use has neurotoxic effects, which may contribute to cognitive decline and the risk of early-onset dementia. Elevated peripheral iron levels have been reported in individuals with alcohol use disorder (AUD), but its association with brain iron loading has not been explored. We evaluated whether (1) serum and brain iron loading are higher in individuals with AUD than non-dependent healthy controls and (2) serum and brain iron loading increase with age. A fasting serum iron panel was obtained and a magnetic resonance imaging scan with quantitative susceptibility mapping (QSM) was used to quantify brain iron concentrations. Although serum ferritin levels were higher in the AUD group than in controls, whole-brain iron susceptibility did not differ between groups. Voxel-wise QSM analyses revealed higher susceptibility in a cluster in the left globus pallidus in individuals with AUD than controls. Whole-brain iron increased with age and voxel-wise QSM indicated higher susceptibility with age in various brain areas including the basal ganglia. This is the first study to analyze both serum and brain iron loading in individuals with AUD. Larger studies are needed to examine the effects of alcohol use on iron loading and its associations with alcohol use severity, structural and functional brain changes, and alcohol-induced cognitive impairments.

1. Introduction

Iron is an essential cofactor for many cellular enzymes involved in metabolic pathways including DNA synthesis, oxygen transport in the blood, and neurotransmitter synthesis [1,2]. However, iron can also promote oxidative damage by catalyzing free radical reactions that denature DNA and proteins [3]. Excess iron deposition in the brain plays a significant role in the pathology of neurodegenerative diseases, such as Alzheimer’s disease (AD), Parkinson’s disease (PD), and Huntington’s disease (HD) [4,5]. Serum and brain iron loading have also been reported in individuals with alcohol use disorder (AUD) [6], but its impact on the clinical course of the disease is not well understood.
Peripheral iron status is monitored clinically with serum iron level, percent saturation of the iron transporter protein transferrin, and iron storage protein ferritin. We recently reported that serum transferrin saturation was higher in individuals with AUD than non-dependent healthy controls and positively correlated with the severity of alcohol withdrawal [7]. Excessive alcohol consumption was also linked to increased levels of peripheral ferritin, which may contribute to the toxic effects of alcohol on tissues, including the liver and brain [8]. As such, ferritin levels increased with the severity of liver disease [8]. Brain iron concentrations can be quantified by magnetic resonance imaging (MRI) quantitative susceptibility mapping (QSM), which infers local tissue susceptibility secondary to the presence of iron and other minerals [9,10,11]. One previous study demonstrated higher brain iron levels in the basal ganglia in AUD participants than healthy controls through retrospective functional MRI (fMRI) QSM analysis [6]. The means by which iron accumulates in the brain in the context of AUD is not well understood, but one theory postulates that chronic neuroinflammation from AUD leads to a “leakier” blood brain barrier (BBB) [12]. This may allow iron to cross the BBB more easily and accumulate in brain tissues.
Iron deposition in individuals with AUD may contribute to neurodegeneration similar to that observed with aging and neurodegenerative diseases, such as AD and PD [13]. Peripheral iron levels are abnormally high early in the course of AD and PD [14]. QSM analysis of brain iron corroborated the serum findings showing brain iron accumulation in brain regions associated with motor and cognitive impairment in patients with AD and PD [15]. Higher iron accumulation was positively associated with positron emission tomography (PET) measures of amyloid and tau, biomarkers of AD, in the basal ganglia, suggesting that high magnetic susceptibility in certain deep gray nuclei may reflect iron’s role as a marker of cognitive decline [16]. Sequestration of iron through dietary modulation or iron chelation was effective in attenuating brain iron build-up and cognitive decline [17].
Brain iron loading has also been implicated in normal aging. Results from both early post-mortem studies and recent in vivo QSM studies indicated that elderly subjects had significantly higher brain iron concentrations than younger ones in various subcortical regions including the putamen and globus pallidus [18,19]. Other MRI studies have revealed significant age-related iron differences in cortical gray matter and motor/premotor cortices using both traditional R2* (transverse relaxation-dephasing rate) and the more novel QSM method [20]. A recent study also showed that abnormal function of the glymphatic system, which is responsible for waste clearance in the central nervous system, may be associated with age-related brain iron deposition [21].
Few studies have examined the role of iron in mediating AUD- and aging-associated neurodegeneration. In this study, we utilize QSM to (1) investigate serum and brain iron loading in individuals with AUD and (2) examine the effects of age on serum and brain iron levels. We hypothesized elevated blood ferritin and brain levels of iron in individuals with AUD compared with controls and significant effects of age on both measures. We also performed a re-analysis of iron panel data from AUD participants (n = 583) and controls (n = 470) from the National Institutes of Health (NIH) Clinical Center (Unit and Clinic Evaluation, Screening, Assessment, and Management) [7] to assess serum ferritin levels.

2. Results

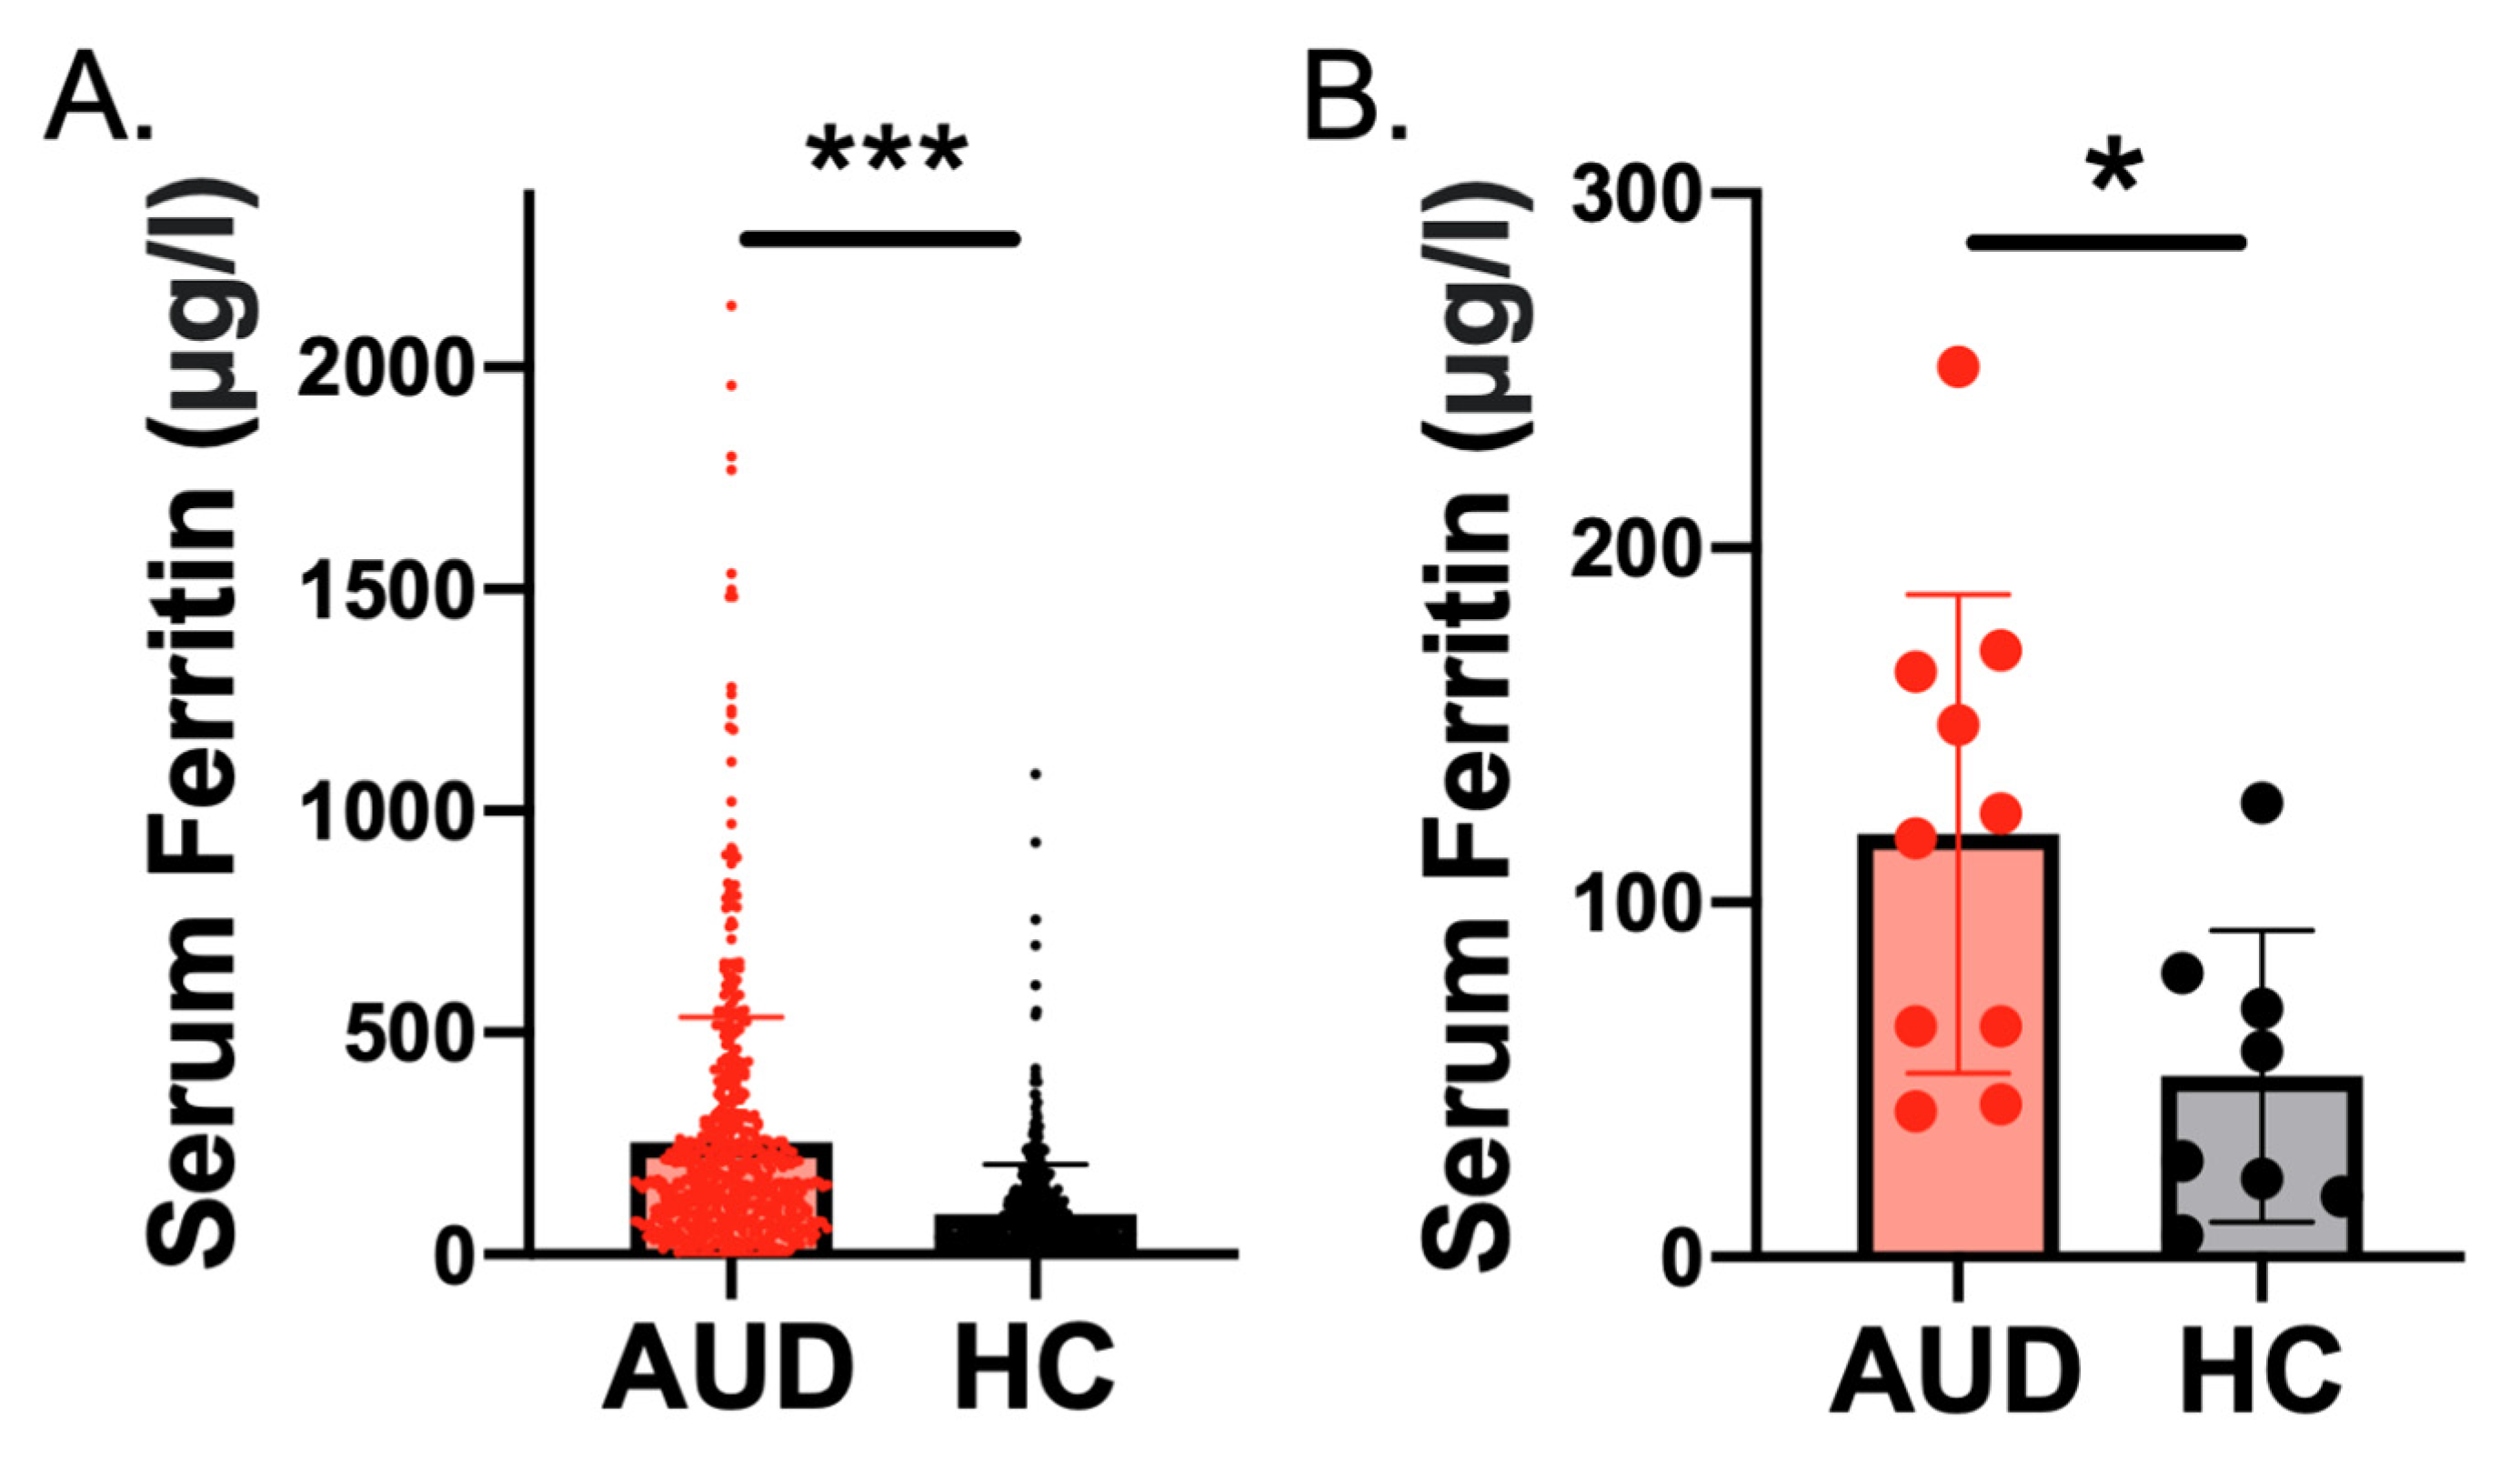
2.1. Higher Serum Ferritin Level and Concentration in Individuals with AUD Than Controls

Data from the NIH Clinical Center showed the AUD group to have higher serum ferritin levels (mean ± SD = 252.4 ± 282.0 n = 583) than the HC group (91.0 ± 112.1; t794.7 = 12.6, n = 470, p < 0.0001) (Figure 1A). A linear regression model demonstrated that AUD status was a significant predictor of serum ferritin level (β = 0.256, p < 0.001) after controlling for age, sex, BMI, and C-reactive protein (CRP) levels. Age (41.3 ± 12.9, range = 18–77 years old) was also a predictor of serum ferritin level (β = 0.080, p = 0.002) (Table S1).
Demographic and clinical characteristics of the AUD (n = 10) and healthy control (n = 8) cohorts from the University of Pennsylvania (Penn) sample, who underwent both laboratory testing and neuroimaging with QSM, are summarized in Table 1. Participants were a mean of 35.2 ± 12.9 years old (range = 22–62). The results from Penn also indicated that serum ferritin levels were higher in individuals with AUD than healthy controls (t16 = 2.5, p = 0.023) (Figure 1B). A linear regression model also indicated that AUD status was a significant predictor of ferritin (β = 0.523, p = 0.049) when controlling for age, sex, and BMI (Table S2). However, age did not significantly predict serum ferritin in the Penn sample (β = −0.325, p = 0.14). Group means and comparisons of other iron panel measures are listed in Table S3.

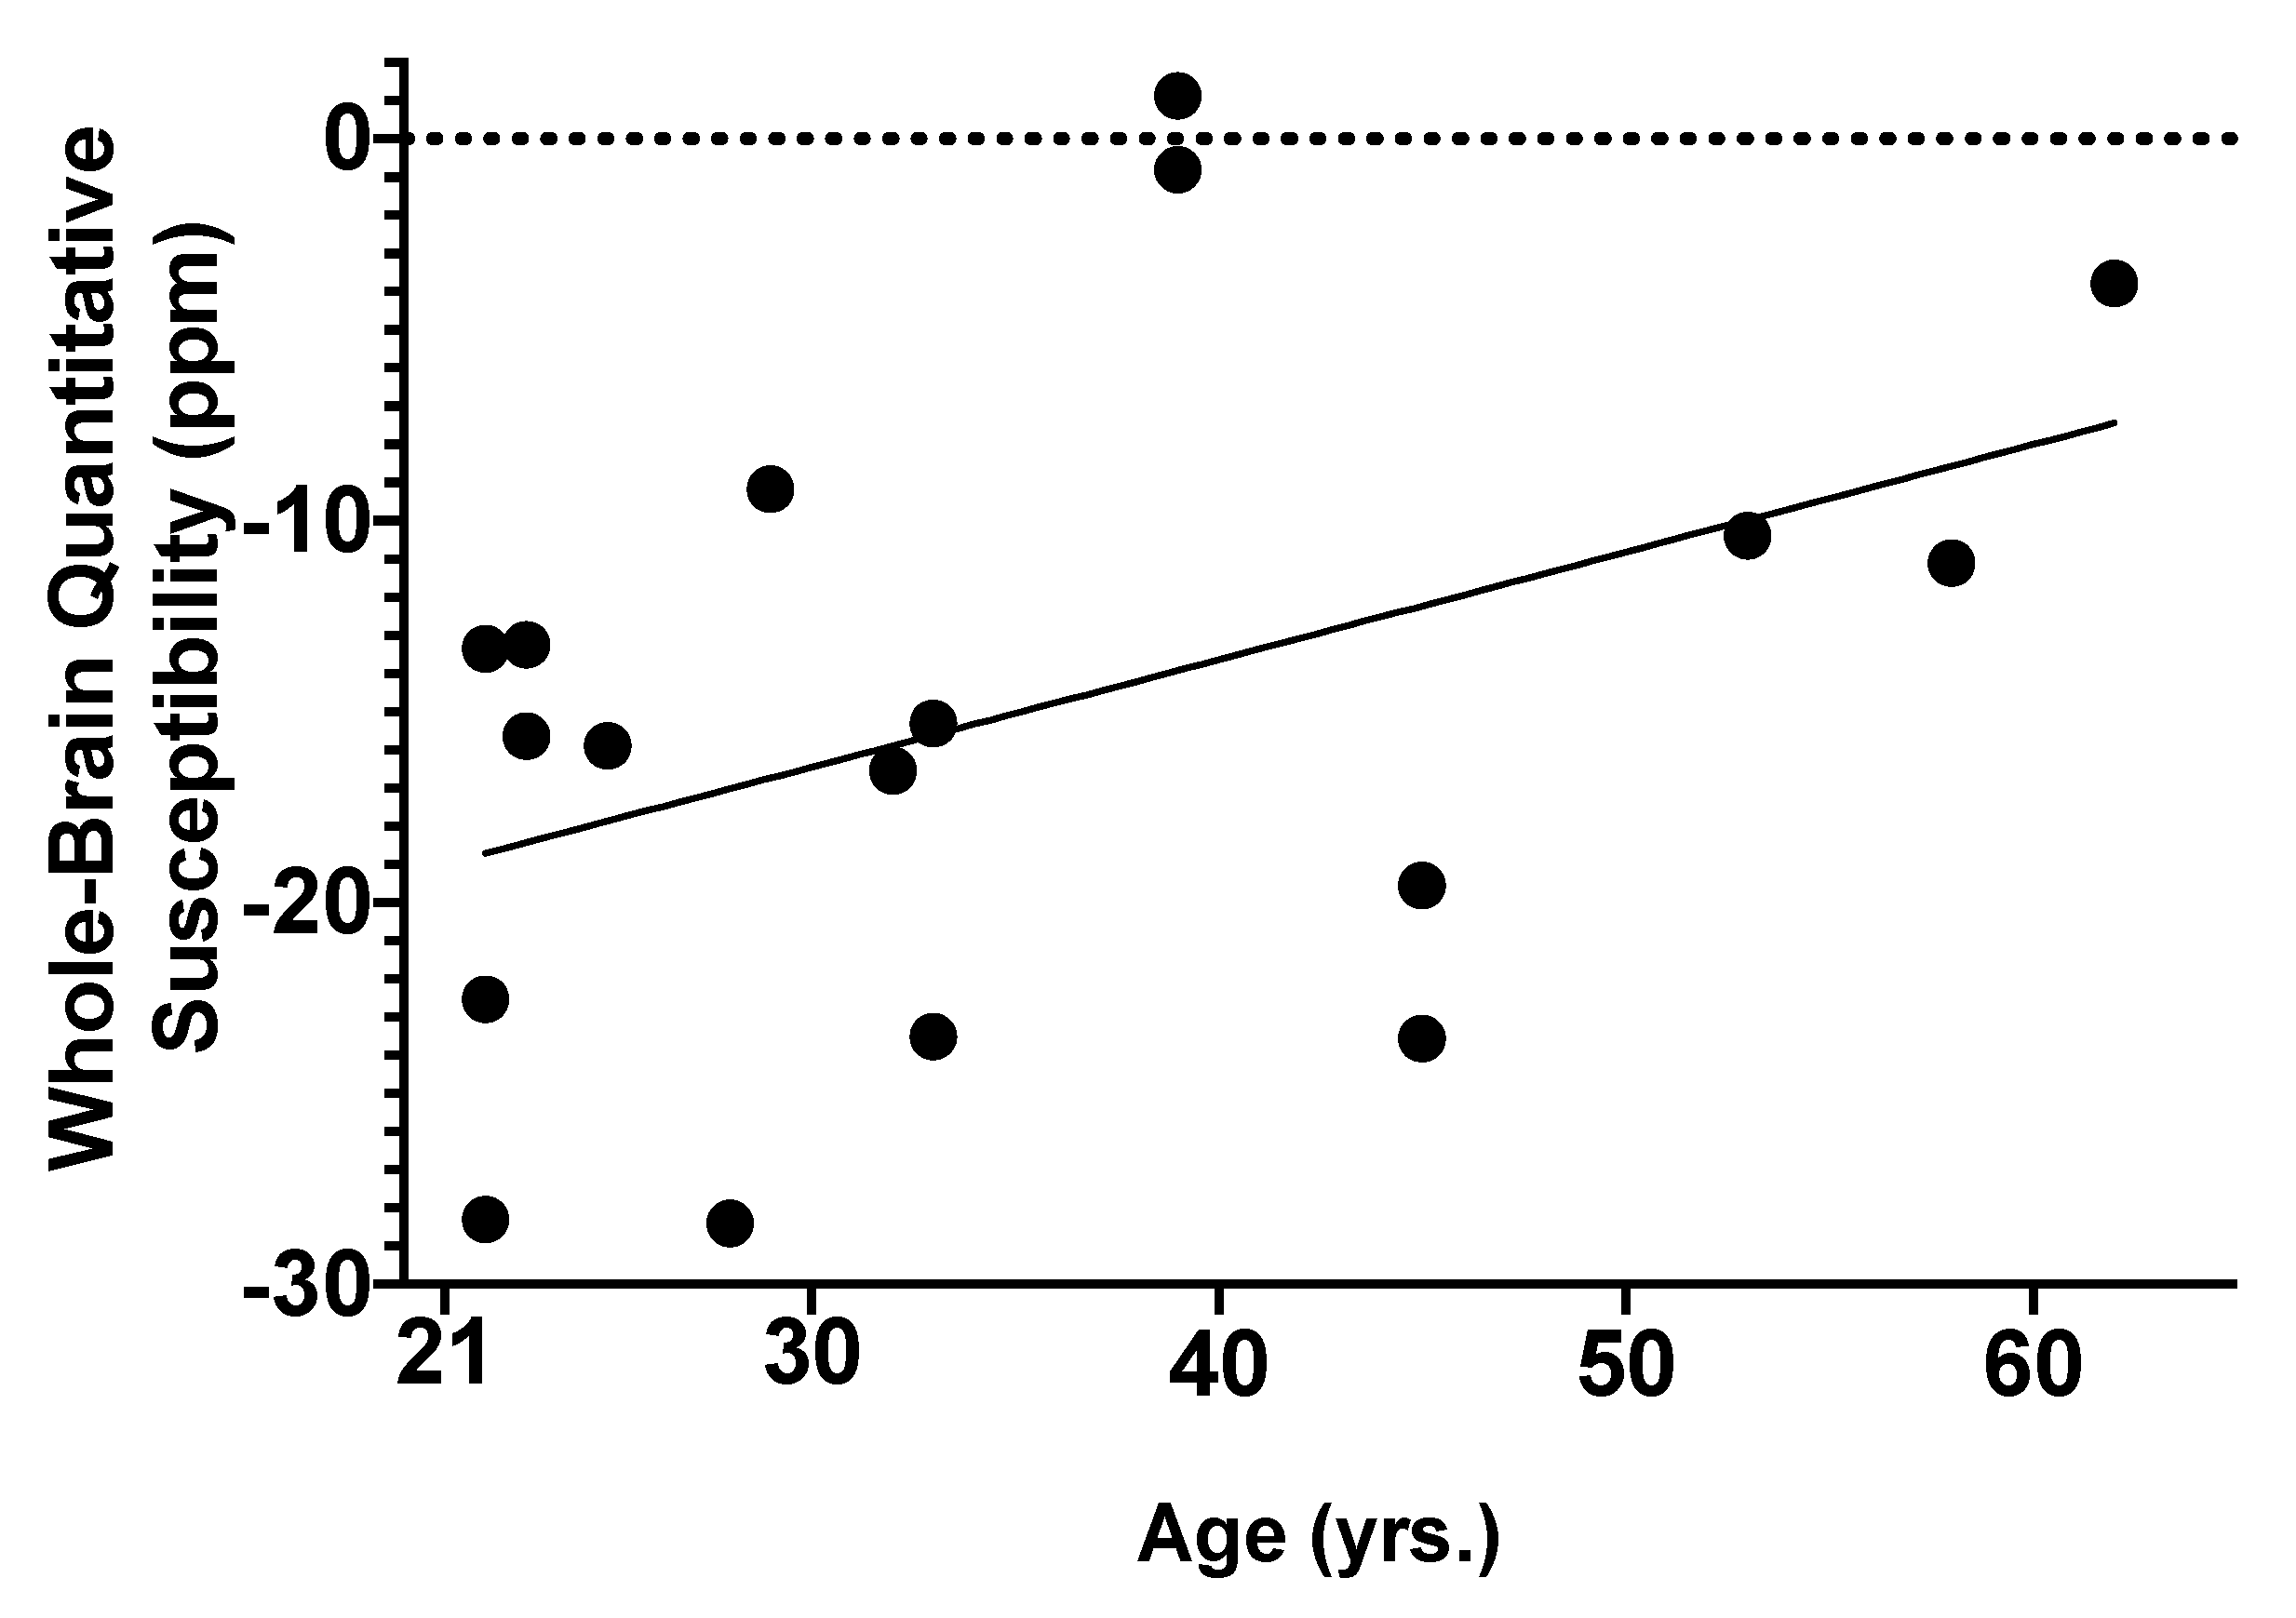
2.2. Associations of AUD and Age with Global Brain Iron Susceptibility

Penn participants underwent a 3 Tesla MRI scan with QSM to non-invasively quantify brain iron concentrations. QSM analysis was performed using the MEDI toolbox and global brain susceptibility was extracted (see Section 4). No outliers (>2SD from the mean) were detected. Linear regression analysis demonstrated that age (β = 0.618, p = 0.020) and sex (β = −0.491, p = 0.047) significantly predicted global brain susceptibility (Figure 2 and Table 2), with older age and male sex predicting higher global brain susceptibility. However, neither AUD (β = −0.775, p = 0.45) nor serum ferritin (β = 0.357, p = 0.21) significantly predicted global brain susceptibility (Table 2).

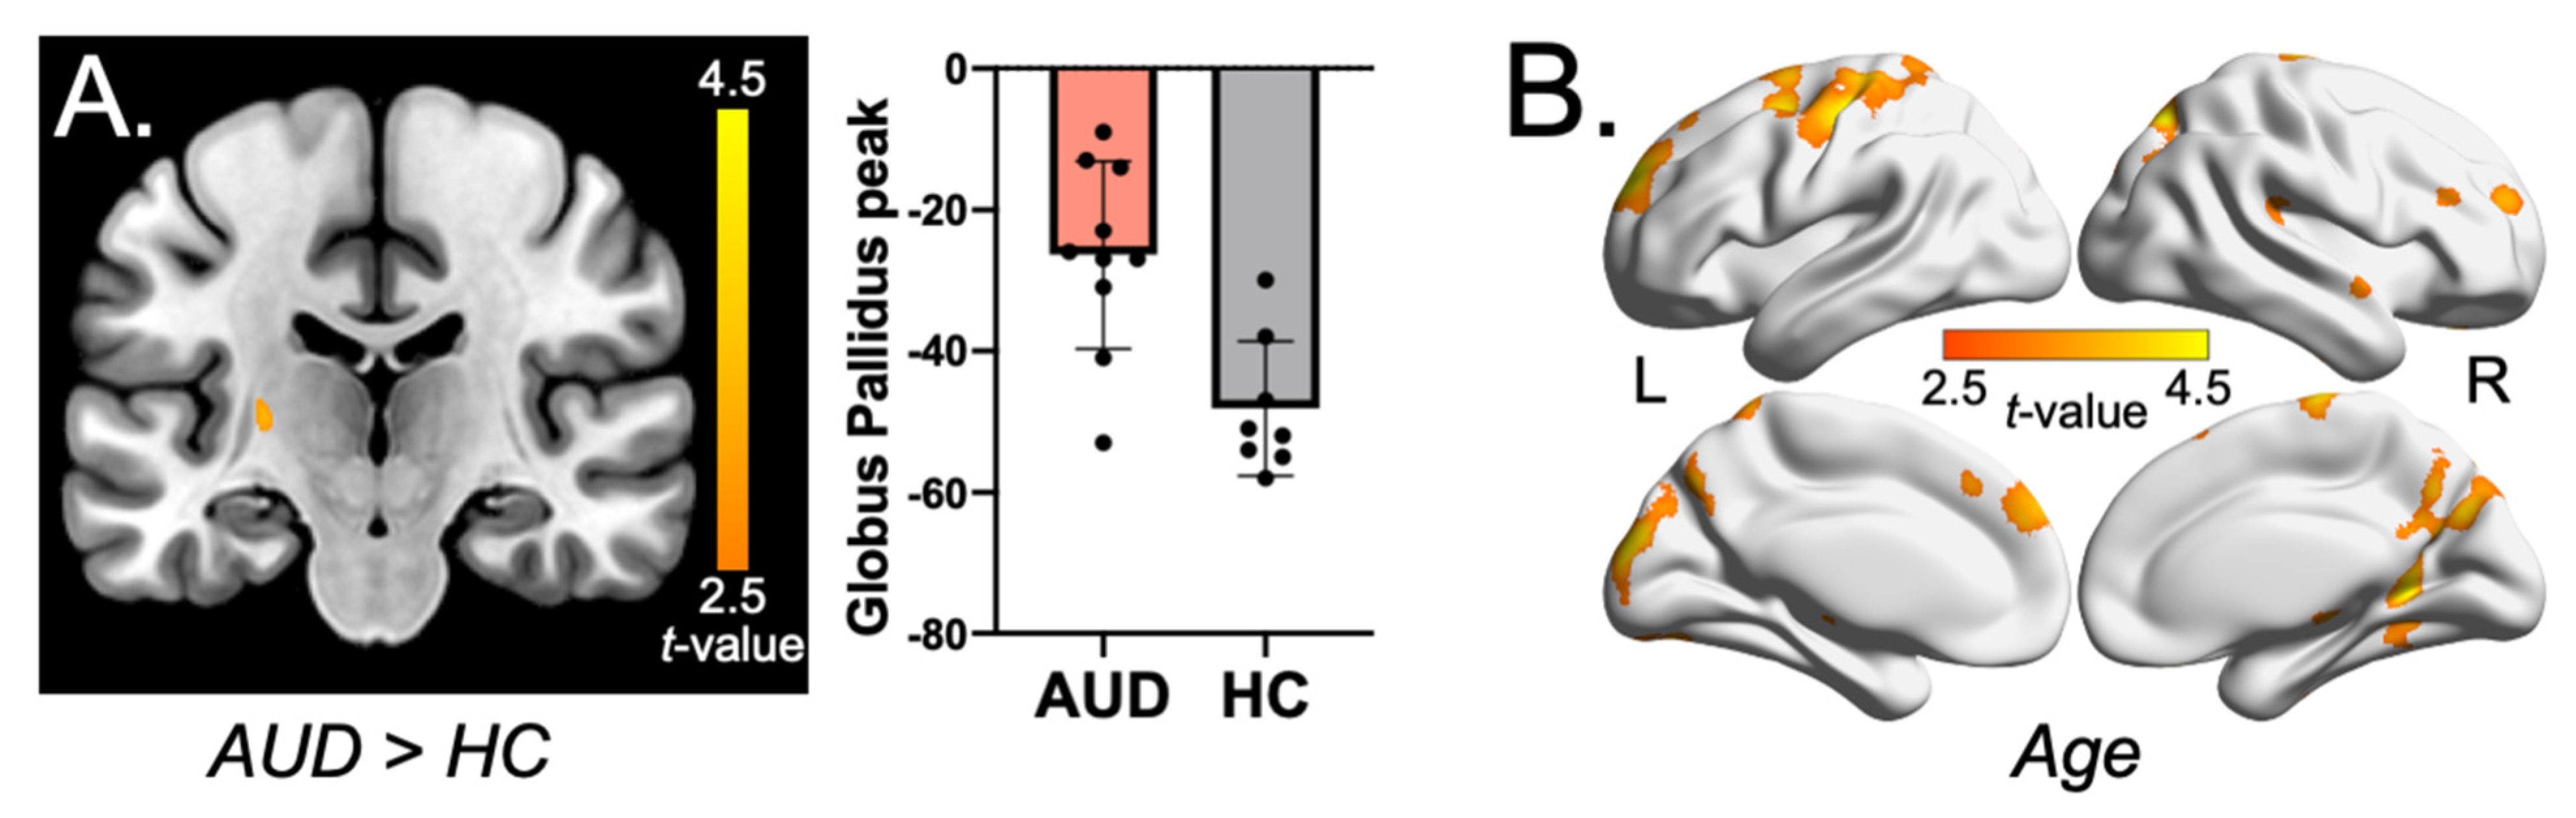
2.3. Whole-Brain Voxel-Wise QSM Analysis

There were no significant associations of age or AUD with brain quantitative susceptibility using a family-wise error (FWE)-corrected p-value (PFWE < 0.05). Exploratory analyses with a more liberal threshold of voxel-level uncorrected-p < 0.005 combined with cluster extent k > 50 demonstrated higher brain quantitative susceptibility in the left globus pallidus in AUD individuals than controls (peak voxel coordinates = [−26, −21, 6], k = 89, Z = 2.90, uncorrected-p = 0.002; Figure 3A). Moreover, age was positively correlated with brain quantitative susceptibility in the precuneus, bilateral dorsolateral prefrontal cortex (dlPFC), orbitofrontal cortex (OFC), bilateral midbrain, bilateral fusiform gyrus/parahippocampal gyrus, left thalamus, and right caudate (all at voxel-level uncorrected-p < 0.005, k > 50, Figure 3B and Table S3).

3. Discussion

We found significantly higher serum ferritin levels in the AUD group than in healthy controls in two independent cohorts (NIH and Penn). Although whole-brain quantitative susceptibility did not differ between the AUD and control group, a preliminary voxel-wise QSM analysis revealed higher brain susceptibility in the left globus pallidus in AUD individuals than in healthy controls. Age correlated positively with whole-brain iron accumulation and further voxel-wise analysis showed correlations in the precuneus, bilateral dlPFC, OFC, bilateral midbrain, precentral gyrus, fusiform gyrus, left thalamus, and right caudate.
Our findings of higher serum ferritin and greater globus pallidus brain iron in AUD are in line with that reported in previous studies [6,7,22]. Evidence suggests that the globus pallidus is involved in inhibitory control and a positive association was found between globus pallidus functional connectivity and clinical measures of impulsivity (i.e., Barratt Impulsiveness Scale and UPPS-P Impulsive Scale) [23]. Impulsivity has been associated with an increased risk of problematic drinking behavior and AUD [24]. Therefore, iron loading in the globus pallidus could contribute to altered neuronal functioning and the development of AUD. Serum ferritin is widely accepted as a sensitive marker of systemic iron stores and ferritin is commonly used in clinical practice as a diagnostic test for iron deficiency and overload [25,26]. Low serum or plasma ferritin levels indicate iron deficiency, while elevated ferritin levels reflect potential iron overload [25,26,27]. Elevated peripheral iron measures, including serum ferritin and transferrin saturation, have been associated with brain iron stores in published human neuroimaging studies [28,29]. Serum ferritin is limited as a clinical marker of total iron body stores insofar as it is an acute-phase protein that is elevated by inflammation and infection, including HIV, pregnancy, and late-stage kidney disease [26]. Despite having excluded participants with these conditions from our sample, alcohol-induced chronic inflammation may have elevated ferritin and brain iron levels in the AUD group. Kroll et al. found elevated levels of CRP, a marker of inflammation, in the AUD group compared with controls [7]. In the NIH sample, CRP levels were positively associated with serum ferritin levels (see Table S1). However, controlling for CRP in the regression model did not influence the significant effects of AUD on serum ferritin levels (Table S1). While chronic hepatitis has been associated with elevated brain iron deposition [30], hepatitis likely did not play a role in this neuroimaging study because individuals with abnormal liver enzyme panel results and/or liver disease were excluded.
We found no significant group differences in brain iron at the whole-brain level. Previous QSM studies showed increased brain iron in the globus pallidus, as well as the caudate nucleus, dentate nucleus, putamen, and substantia nigra in AUD individuals compared with controls [6,22]. Discrepancies in study findings may be attributable to our small sample size (i.e., n = 18 participants in our study versus n = 35 in [6] and n = 20,729 U.K. Biobank participants in [22]), and differences in the acquisition of QSM. Our study acquired detailed, four-echo three-dimensional images of tissue magnetic susceptibility, which allow for more accurate and precise measurement than other MRI techniques. Previous studies utilized T2*-weighted imaging of only one or two echoes [6,22]. Furthermore, the greater brain iron reported by Juhás et al. [6] was obtained in male inpatients with AUD, whereas our AUD population included non-treatment-seeking males and females. This is particularly relevant because male sex was associated with higher peripheral ferritin levels and global brain iron levels in our study. Topiwala et al. [22] found an association between alcohol consumption and striatal (putamen and caudate) iron levels, an association mediated by liver iron levels. However, we found no association between serum ferritin and total brain iron, suggesting that there is regulation of brain iron by the BBB and iron transporter proteins [31,32]. The link between blood and brain iron levels requires further elucidation as the physiological mechanism behind iron loading in humans is not well studied. Exploring the relationship among serum, liver, and brain iron measures could enhance our understanding of the disease progression of AUD [22].
The age-associated brain iron accumulation observed in our studies is consistent with that found in prior QSM studies [20,33]. Excessive iron deposition elicits oxidative stress, which facilitates neurodegeneration and impairs neuronal function [34]. Although the mechanisms underlying brain iron accumulation remain largely unknown, it appears to be region-specific and some brain regions are more efficient in maintaining iron homeostasis than others [34]. Here, we found significant associations between aging and iron in brain regions involved in motor and cognitive functioning [35,36], in line with previous studies that associated brain iron concentration with age-related cognitive and motor decline [37,38,39]. The variations in brain regions affected by age-related iron loading reported here have also been observed in other studies [20,33]. These differences may be attributable to study differences in QSM analysis, the age distribution of participants, or the severity of AUD, all of which require elucidation. Our study consisted of mostly non-treatment-seeking individuals who were diagnosed by the Mini-International Neuropsychiatric Interview (MINI) for DSM-5 [40]. The severity of the AUD group was equally divided between mild (n = 5) and moderate (n = 3) or severe (n = 2). Previous research has found a positive association between drinking levels and brain and blood iron loading [22]. Thus, we expect that evaluation of a more severe AUD group would show greater accumulation of iron.
Our study found evidence for sex differences in serum and brain iron levels: women demonstrated significantly lower levels of serum iron (NIH sample) and lower brain susceptibility (Penn sample) than men. These findings are in line with previous studies reporting lower serum and brain iron loading in women than men at all life stages [41,42]. Testosterone decreases hepcidin expression, which may result in elevated iron loading in men [43]. Moreover, menstrual blood reduces serum iron levels in women, which may additionally contribute to sex differences in brain iron accumulation in pre-menopausal women [44].
Our study has several limitations. Foremost among these is the small sample size of the Penn sample, which may explain the failure to detect whole-brain and region-specific differences in iron concentration between AUD individuals and healthy controls. Although our findings of age-related brain iron accumulation are consistent with previous QSM studies, a wider age range could provide greater clarity regarding the interaction between age and iron accumulation. Nevertheless, our pilot study is unique in that it measured four-echo three-dimensional images of tissue magnetic susceptibility, which allow for more accurate and precise measurement of brain iron loading than the MRI techniques used in previous QSM studies in AUD participants [6,22]. Further, our study did not include genetic variation of the HFE gene, which is the main cause of hereditary hemochromatosis [45]. The HFE gene mediated peripheral iron loading (% saturation) in individuals with AUD [7] and healthy volunteers [46], and menstrual status in women has been found to be protective against phenotypic expression of haemochromatosis [47]. While our QSM study was underpowered to perform a genetic analysis of HFE, we found that, in the NIH sample, the main effect of AUD on serum ferritin remained significant when controlling for HFE rs1799945 (see details of the genetic analysis in Supplemental Material). Moreover, our screening process excluded participants with iron-related disorders such as anemia and hemophilia. Therefore, our findings of AUD on serum ferritin and brain iron loading were unlikely to be confounded by HFE rs1799945. Additional studies are needed to explore the use of QSM in combination with other neuroimaging techniques, such as diffusion tensor imaging (DTI), fMRI [48], and PET measures of brain glucose metabolism, which would provide a more comprehensive picture of brain structure and function in relation to AUD and aging. Assessment of neurocognitive and motor functioning is needed to better understand the clinical implications of iron accumulation in the brain in AUD. Another limitation is the lack of an assessment of nutritional status of participants, as differences in dietary iron intake may affect serum and brain levels of ferritin and iron [17]. Moreover, individuals with AUD could have altered micronutrient intake and absorption [49], which could have confounded our results. However, a nutrient-poor diet in conjunction with impaired absorption would be expected to reduce iron levels, which was not observed in the present study. Future study on serum and brain iron should aim to correct for nutritional status and dietary iron levels. Another direction for future study is the investigation of cognitive performance in relation to region-specific brain iron deposition in individuals with AUD. A systematic review of regional associations between brain iron and cognition [50] showed that iron accumulation in the globus pallidus correlated significantly with general cognition/IQ, motor function, and reaction times. Moreover, pallida iron levels correlated with memory in one study [51], but not in a second study [37].
In sum, our pilot study provided evidence for elevated serum and brain iron loading in AUD and aging. However, studies of larger samples are required to determine the potential clinical applications of QSM in the diagnosis and treatment of AUD and age-related neurodegenerative disorders. A fuller understanding of the interaction of chronic heavy drinking and aging on iron accumulation in brain could provide a basis for the development of iron-mediated therapies (such as iron chelators) to mitigate potential neurodegeneration in AUD.

4. Materials and Methods

4.1. Participants

4.1.1. NIH Sample

A total of 1053 participants (583 individuals with AUD; 470 healthy non-dependent controls) who completed a natural history protocol at the NIH Clinical Center (Unit and Clinic Evaluation, Screening, Assessment, and Management, ClinicalTrials.gov Identifier: NCT02231840) between September 2011 and March 2020, and for whom serum ferritin levels were available, were included in the study. Clinical and demographic characteristics of the sample have been published previously [7]. AUD participants were admitted to the NIH Clinical Center inpatient unit for detoxification. Withdrawal symptoms were monitored using the Clinical Institute Withdrawal Assessment for Alcohol—Revised (CIWA-Ar) [52] and, if severe, patients were treated with a benzodiazepine by medical staff. All participants provided written informed consent and the study protocol was approved by the Institutional Review Board at the National Institutes of Health (protocol number 14-AA-0181).

4.1.2. Penn Sample

Study participants were recruited for study protocol NCT04616781 or NCT05015881 via online advertisements (BuildClinical, iConnect) and underwent the following screening assessment: Mini International Neuropsychiatric Interview (MINI) for DSM-5 diagnosis for AUD and other neuropsychiatric disorders [40]; 30-day Timeline Follow-back (TLFB) for daily drinking patterns [53]; Lifetime Drinking History (LDH) [54]; Alcohol Use Disorders Identification Test (AUDIT) for hazardous drinking behavior [55]; Fagerström Test for Nicotine Dependence [56]; and Shipley Institute of Living Scale-2 (Shipley-2) test for crystallized and fluid intelligence [57]. Inclusion criteria for the AUD group included the following: (1) meeting DSM-5 criteria for current AUD; (2) self-report of an average of at least 15 standard drinks per week in the last month; (3) self-report of having greater than a 1 y history of heavy drinking; and (4) having had a drink within 1 week of study visit. Healthy controls were included if they demonstrated an AUDIT score of <6 and consumed less than 15 standard drinks per month. Exclusion criteria for both groups included the following: (1) current DSM-5 diagnosis of a major psychiatric disorder other than alcohol dependence in the AUD group, and intake of psychoactive medication within 24 h of study participation; (2) history of seizures; (3) HIV seropositivity; (4) a history of head trauma with loss of consciousness for more than 30 min or associated skull fracture/abnormal MRI; (5) any contraindication for MRI (e.g., presence of ferromagnetic objects or claustrophobia); and (6) a current, clinically significant physical disease or abnormality detected by medical history, physical examination, or routine laboratory evaluation that can impact brain function. Medical history, physical examination, and routine laboratory results of the screen were evaluated by physicians prior to study inclusion. Ten individuals with AUD (3 female; 37.30 ± 15.72 years old) and eight matched non-dependent healthy volunteers (4 female; 32.50 ± 8.30 years old) were included in the study. Baseline demographics and alcohol-related clinical measures are presented in Table 1. The AUD cohort had a significantly higher BMI (p = 0.025). As anticipated, AUD participants reported greater alcohol consumption across various drinking behavior metrics than controls, including age at first drink (14.6 vs. 18.0), standard drinks per week (25.12 vs. 0.52), total lifetime alcohol intake (190,596.00 g vs. 8557.50 g), and AUDIT score (14.8 vs. 1.75) (Table 1).

4.2. Quantitative Susceptibility Mapping (QSM)

On the day of study screening, Penn participants completed a serum iron panel (Labcorp) after an overnight fast. On a separate study day, participants completed a 3T MRI scan with QSM to quantify brain iron concentrations non-invasively. Participants were instructed to eat a light meal 2–3 h before the MRI scanning procedures. MRI was performed on a Siemens Prisma 3T system (Siemens Healthcare, Erlangen, Germany). QSM images were acquired using a 3D multi-echo sequence with the following parameters: repetition time (TR) = 35 ms, echo time (TE) = 7.5/15/22.5/30 ms, flip angle (FA) = 15°, field of view (FOV)= 180 × 240 mm, number of slices = 96, voxel size = 1.5 × 1.5 × 1.5 mm, readout bandwidth = 200 Hz/pixel, and scan time = approximately 5 min. QSM images were reconstructed by the morphology-enabled dipole inversion algorithm zero-referenced to the ventricular cerebrospinal fluid using the MEDI toolbox [58,59]. To allow group-level analysis, QSM images were normalized to the Montreal Neurological Institute (MNI) space with 1 mm isotropic voxels and spatially smoothed with 8 mm full-width at half-maximum (FWHM) using SPM 12 (Wellcome Trust Center for Neuroimaging, London, UK).

4.3. Statistical Analyses

All statistical analyses were completed using SPSS (IBM, Armonk, NY, USA). Two-sample t-tests were used to compare groups on continuous variables; Chi-square tests were used to compare groups on categorical variables (sex, self-reported race, and smoking status).
We performed a linear regression analysis with ferritin as the dependent variable and AUD, age, BMI, and sex as predictors in both the NIH and Penn samples. In the NIH sample, we added C-reactive protein values, to correct for levels of inflammation.
Global brain quantitative susceptibility was calculated for each Penn participant as the average of all brain voxels in the preprocessed QSM images identified using the tissue probability maps in SPM. Linear regression was performed with global brain iron as the dependent variable with AUD, age, BMI, sex, and serum ferritin as predictors.
The preprocessed QSM images were subjected to whole-brain voxel-wise analysis to examine the following: (1) the difference in quantitative susceptibility between the AUD and HC cohorts using a two-sample t-test, while correcting for age as a covariate; and (2) the association between quantitative susceptibility and age using linear regression. Significant clusters were explored using a cluster-level FWE-corrected threshold of p < 0.05. Moreover, a preliminary threshold of voxel-level uncorrected p < 0.005 combined with cluster extent k > 50 was used for exploratory analyses on the effects of AUD and age on voxel-wise quantitative susceptibility. Anatomical labels of the identified regions were determined based on the Harvard-Oxford Atlas.

Supplementary Materials

The following supporting information can be downloaded at: https://www.mdpi.com/article/10.3390/ijms24054461/s1.

Author Contributions

Study conception and design: A.R.A., W.R.W., Z.S. and C.E.W.; Acquisition of data: A.R.A., J.I.B., S.A.V., T.P., H.R.K., Z.S. and C.E.W.; Analysis and interpretation of data: A.R.A., B.M., Z.S. and C.E.W.; Drafting of manuscript: A.R.A., X.L., Z.S. and C.E.W.; Critical revisions of the manuscript: T.D.N., Y.W., H.R.K. and W.R.W. All authors have read and agreed to the published version of the manuscript.

Funding

This work was supported by NARSAD Young Investigator Grant (28778, Wiers); NIH grants AA026892 (Wiers), DA051709 (Shi), DA046345 (Kranzler), HL137984, and EB029460 (Witschey); the National Center for Advancing Translational Sciences of the National Institutes of Health (TR001878); and the Institute for Translational Medicine and Therapeutics’ (ITMAT) Transdisciplinary Program in Translational Medicine and Therapeutics.

Institutional Review Board Statement

The study was conducted in accordance with the Declaration of Helsinki, and approved by the Institutional Review Board of the National Institutes of Health (protocol 14-AA-0181, approval September 2014), and the Institutional Review Board of the University of Pennsylvania (protocol 844235, approval November 2020, and protocol 848992, approval August 2021).

Informed Consent Statement

Informed consent was obtained from all subjects involved in the study.

Data Availability Statement

Data available on request due to restrictions.

Acknowledgments

We thank Daniel Langleben, Nancy Diazgranados, Laurie Downing, Rishika Reddy, and Elizabeth Sweeney for their contributions.

Conflicts of Interest

Henry R. Kranzler is a member of advisory boards for Dicerna Pharmaceuticals, Sophrosyne Pharmaceuticals, and Enthion Pharmaceuticals; a consultant to Sobrera Pharmaceuticals; the recipient of research funding and medication supplies for an investigator-initiated study from Alkermes; a member of the American Society of Clinical Psychopharmacology’s Alcohol Clinical Trials Initiative, which was supported in the last three years by Alkermes, Dicerna, Ethypharm, Lundbeck, Mitsubishi, and Otsuka; and a holder of U.S. patent 10,900,082 titled: &quot;Genotype-guided dosing of opioid agonists,&quot; issued 26 January 2021.

References

  1. Mills, E.; Dong, X.P.; Wang, F.; Xu, H. Mechanisms of brain iron transport: Insight into neurodegeneration and CNS disorders. Future Med. Chem. 2010, 2, 51–64. [Google Scholar] [CrossRef] [PubMed] [Green Version]
  2. Moos, T.; Rosengren Nielsen, T.; Skjørringe, T.; Morgan, E.H. Iron trafficking inside the brain. J. Neurochem. 2007, 103, 1730–1740. [Google Scholar] [CrossRef] [PubMed]
  3. Halliwell, B.; Gutteridge, J.M. Oxygen free radicals and iron in relation to biology and medicine: Some problems and concepts. Arch. Biochem. Biophys. 1986, 246, 501–514. [Google Scholar] [CrossRef] [PubMed]
  4. Masaldan, S.; Belaidi, A.A.; Ayton, S.; Bush, A.I. Cellular Senescence and Iron Dyshomeostasis in Alzheimer’s Disease. Pharmaceuticals 2019, 12, 93. [Google Scholar] [CrossRef] [Green Version]
  5. Morris, G.; Berk, M.; Carvalho, A.F.; Maes, M.; Walker, A.J.; Puri, B.K. Why should neuroscientists worry about iron? The emerging role of ferroptosis in the pathophysiology of neuroprogressive diseases. Behav. Brain Res. 2018, 341, 154–175. [Google Scholar] [CrossRef]
  6. Juhás, M.; Sun, H.; Brown, M.R.G.; MacKay, M.B.; Mann, K.F.; Sommer, W.H.; Wilman, A.H.; Dursun, S.M.; Greenshaw, A.J. Deep grey matter iron accumulation in alcohol use disorder. NeuroImage 2017, 148, 115–122. [Google Scholar] [CrossRef]
  7. Kroll, D.S.; McPherson, K.L.; Manza, P.; Schwandt, M.L.; Shen, P.H.; Goldman, D.; Diazgranados, N.; Wang, G.J.; Wiers, C.E.; Volkow, N.D. Elevated transferrin saturation in individuals with alcohol use disorder: Association with HFE polymorphism and alcohol withdrawal severity. Addict. Biol. 2022, 27, e13144. [Google Scholar] [CrossRef]
  8. Moirand, R.; Lescoat, G.; Delamaire, D.; Lauvin, L.; Campion, J.P.; Deugnier, Y.; Brissot, P. Increase in glycosylated and nonglycosylated serum ferritin in chronic alcoholism and their evolution during alcohol withdrawal. Alcohol Clin. Exp. Res. 1991, 15, 963–969. [Google Scholar] [CrossRef]
  9. Liu, C.; Li, W.; Tong, K.A.; Yeom, K.W.; Kuzminski, S. Susceptibility-weighted imaging and quantitative susceptibility mapping in the brain. J. Magn. Reson. Imaging 2015, 42, 23–41. [Google Scholar] [CrossRef] [Green Version]
  10. Langkammer, C.; Schweser, F.; Krebs, N.; Deistung, A.; Goessler, W.; Scheurer, E.; Sommer, K.; Reishofer, G.; Yen, K.; Fazekas, F.; et al. Quantitative susceptibility mapping (QSM) as a means to measure brain iron? A post mortem validation study. NeuroImage 2012, 62, 1593–1599. [Google Scholar] [CrossRef] [Green Version]
  11. de Rochefort, L.; Liu, T.; Kressler, B.; Liu, J.; Spincemaille, P.; Lebon, V.; Wu, J.; Wang, Y. Quantitative susceptibility map reconstruction from MR phase data using bayesian regularization: Validation and application to brain imaging. Magn. Reson. Med. 2010, 63, 194–206. [Google Scholar] [CrossRef]
  12. Rubio-Araiz, A.; Porcu, F.; Pérez-Hernández, M.; García-Gutiérrez, M.S.; Aracil-Fernández, M.A.; Gutierrez-López, M.D.; Guerri, C.; Manzanares, J.; O’Shea, E.; Colado, M.I. Disruption of blood-brain barrier integrity in postmortem alcoholic brain: Preclinical evidence of TLR4 involvement from a binge-like drinking model. Addict. Biol. 2017, 22, 1103–1116. [Google Scholar] [CrossRef]
  13. Kamal, H.; Tan, G.C.; Ibrahim, S.F.; Shaikh, M.F.; Mohamed, I.N.; Mohamed, R.M.P.; Hamid, A.A.; Ugusman, A.; Kumar, J. Alcohol Use Disorder, Neurodegeneration, Alzheimer’s and Parkinson’s Disease: Interplay Between Oxidative Stress, Neuroimmune Response and Excitotoxicity. Front. Cell. Neurosci. 2020, 14, 282. [Google Scholar] [CrossRef] [PubMed]
  14. Bartzokis, G.; Tishler, T.A.; Shin, I.S.; Lu, P.H.; Cummings, J.L. Brain ferritin iron as a risk factor for age at onset in neurodegenerative diseases. Ann. N. Y. Acad. Sci. 2004, 1012, 224–236. [Google Scholar] [CrossRef] [PubMed]
  15. Ward, R.J.; Zucca, F.A.; Duyn, J.H.; Crichton, R.R.; Zecca, L. The role of iron in brain ageing and neurodegenerative disorders. Lancet Neurol. 2014, 13, 1045–1060. [Google Scholar] [CrossRef] [PubMed] [Green Version]
  16. Cogswell, P.M.; Wiste, H.J.; Senjem, M.L.; Gunter, J.L.; Weigand, S.D.; Schwarz, C.G.; Arani, A.; Therneau, T.M.; Lowe, V.J.; Knopman, D.S.; et al. Associations of quantitative susceptibility mapping with Alzheimer’s disease clinical and imaging markers. NeuroImage 2021, 224, 117433. [Google Scholar] [CrossRef]
  17. Zachariou, V.; Bauer, C.E.; Seago, E.R.; Panayiotou, G.; Hall, E.D.; Butterfield, D.A.; Gold, B.T. Healthy dietary intake moderates the effects of age on brain iron concentration and working memory performance. Neurobiol. Aging 2021, 106, 183–196. [Google Scholar] [CrossRef]
  18. Hallgren, B.; Sourander, P. The effect of age on the non-haemin iron in the human brain. J. Neurochem. 1958, 3, 41–51. [Google Scholar] [CrossRef]
  19. Bilgic, B.; Pfefferbaum, A.; Rohlfing, T.; Sullivan, E.V.; Adalsteinsson, E. MRI estimates of brain iron concentration in normal aging using quantitative susceptibility mapping. NeuroImage 2012, 59, 2625–2635. [Google Scholar] [CrossRef] [Green Version]
  20. Betts, M.J.; Acosta-Cabronero, J.; Cardenas-Blanco, A.; Nestor, P.J.; Düzel, E. High-resolution characterisation of the aging brain using simultaneous quantitative susceptibility mapping (QSM) and R2* measurements at 7T. NeuroImage 2016, 138, 43–63. [Google Scholar] [CrossRef]
  21. Zhou, W.; Shen, B.; Shen, W.Q.; Chen, H.; Zheng, Y.F.; Fei, J.J. Dysfunction of the Glymphatic System Might Be Related to Iron Deposition in the Normal Aging Brain. Front. Aging Neurosci. 2020, 12, 559603. [Google Scholar] [CrossRef] [PubMed]
  22. Topiwala, A.; Wang, C.; Ebmeier, K.P.; Burgess, S.; Bell, S.; Levey, D.F.; Zhou, H.; McCracken, C.; Roca-Fernández, A.; Petersen, S.E.; et al. Associations between moderate alcohol consumption, brain iron, and cognition in UK Biobank participants: Observational and mendelian randomization analyses. PLoS Med. 2022, 19, e1004039. [Google Scholar] [CrossRef] [PubMed]
  23. Fede, S.J.; Abrahao, K.P.; Cortes, C.R.; Grodin, E.N.; Schwandt, M.L.; George, D.T.; Diazgranados, N.; Ramchandani, V.A.; Lovinger, D.M.; Momenan, R. Alcohol effects on globus pallidus connectivity: Role of impulsivity and binge drinking. PLoS ONE 2020, 15, e0224906. [Google Scholar] [CrossRef] [PubMed] [Green Version]
  24. Shin, S.H.; Hong, H.G.; Jeon, S.-M. Personality and alcohol use: The role of impulsivity. Addict. Behav. 2012, 37, 102–107. [Google Scholar] [CrossRef] [Green Version]
  25. Garcia-Casal, M.N.; Pasricha, S.R.; Martinez, R.X.; Lopez-Perez, L.; Peña-Rosas, J.P. Serum or plasma ferritin concentration as an index of iron deficiency and overload. Cochrane Database Syst. Rev. 2021, 5, Cd011817. [Google Scholar] [CrossRef]
  26. Dignass, A.; Farrag, K.; Stein, J. Limitations of Serum Ferritin in Diagnosing Iron Deficiency in Inflammatory Conditions. Int. J. Chronic Dis. 2018, 2018, 9394060. [Google Scholar] [CrossRef] [Green Version]
  27. Garcia-Casal, M.N.; Pasricha, S.R.; Martinez, R.X.; Lopez-Perez, L.; Peña-Rosas, J.P. Are Current Serum and Plasma Ferritin Cut-offs for Iron Deficiency and Overload Accurate and Reflecting Iron Status? A Systematic Review. Arch. Med. Res. 2018, 49, 405–417. [Google Scholar] [CrossRef]
  28. Nielsen, J.; Jensen, L.N.; Krabbe, K. Hereditary haemochromatosis: A case of iron accumulation in the basal ganglia associated with a parkinsonian syndrome. J. Neurol. Neurosurg. Psychiatry 1995, 59, 318–321. [Google Scholar] [CrossRef] [Green Version]
  29. Ersche, K.D.; Acosta-Cabronero, J.; Jones, P.S.; Ziauddeen, H.; van Swelm, R.P.; Laarakkers, C.M.; Raha-Chowdhury, R.; Williams, G.B. Disrupted iron regulation in the brain and periphery in cocaine addiction. Transl. Psychiatry 2017, 7, e1040. [Google Scholar] [CrossRef] [Green Version]
  30. Lin, D.; Ding, J.; Liu, J.Y.; He, Y.F.; Dai, Z.; Chen, C.Z.; Cheng, W.Z.; Zhou, J.; Wang, X. Decreased serum hepcidin concentration correlates with brain iron deposition in patients with HBV-related cirrhosis. PLoS ONE 2013, 8, e65551. [Google Scholar] [CrossRef] [Green Version]
  31. Zheng, W.; Monnot, A.D. Regulation of brain iron and copper homeostasis by brain barrier systems: Implication in neurodegenerative diseases. Pharmacol. Ther. 2012, 133, 177–188. [Google Scholar] [CrossRef] [Green Version]
  32. Qian, Z.M.; Shen, X. Brain iron transport and neurodegeneration. Trends Mol. Med. 2001, 7, 103–108. [Google Scholar] [CrossRef]
  33. Li, Y.; Sethi, S.K.; Zhang, C.; Miao, Y.; Yerramsetty, K.K.; Palutla, V.K.; Gharabaghi, S.; Wang, C.; He, N.; Cheng, J.; et al. Iron Content in Deep Gray Matter as a Function of Age Using Quantitative Susceptibility Mapping: A Multicenter Study. Front. Neurosci. 2020, 14, 607705. [Google Scholar] [CrossRef]
  34. Zecca, L.; Youdim, M.B.H.; Riederer, P.; Connor, J.R.; Crichton, R.R. Iron, brain ageing and neurodegenerative disorders. Nat. Rev. Neurosci. 2004, 5, 863–873. [Google Scholar] [CrossRef]
  35. Banker, L.; Tadi, P. Neuroanatomy, Precentral Gyrus. In StatPearls; StatPearls Publishing LLC.: Treasure Island, FL, USA, 2022. [Google Scholar]
  36. Tennant, V.R.; Harrison, T.M.; Adams, J.N.; La Joie, R.; Winer, J.R.; Jagust, W.J. Fusiform Gyrus Phospho-Tau is Associated with Failure of Proper Name Retrieval in Aging. Ann. Neurol. 2021, 90, 988–993. [Google Scholar] [CrossRef]
  37. Ghadery, C.; Pirpamer, L.; Hofer, E.; Langkammer, C.; Petrovic, K.; Loitfelder, M.; Schwingenschuh, P.; Seiler, S.; Duering, M.; Jouvent, E.; et al. R2* mapping for brain iron: Associations with cognition in normal aging. Neurobiol. Aging 2015, 36, 925–932. [Google Scholar] [CrossRef]
  38. Penke, L.; Valdés Hernandéz, M.C.; Maniega, S.M.; Gow, A.J.; Murray, C.; Starr, J.M.; Bastin, M.E.; Deary, I.J.; Wardlaw, J.M. Brain iron deposits are associated with general cognitive ability and cognitive aging. Neurobiol. Aging 2012, 33, 510–517.e2. [Google Scholar] [CrossRef] [PubMed]
  39. Acosta-Cabronero, J.; Betts, M.J.; Cardenas-Blanco, A.; Yang, S.; Nestor, P.J. In Vivo MRI Mapping of Brain Iron Deposition across the Adult Lifespan. J. Neurosci. 2016, 36, 364–374. [Google Scholar] [CrossRef] [PubMed] [Green Version]
  40. American Psychiatric Association. Diagnostic and Statistical Manual of Mental Disorders: DSM-5™, 5th ed.; American Psychiatric Publishing, Inc.: Arlington, VA, USA, 2013; p. xliv, 947. [Google Scholar]
  41. Ramos, P.; Santos, A.; Pinto, N.R.; Mendes, R.; Magalhães, T.; Almeida, A. Iron levels in the human brain: A post-mortem study of anatomical region differences and age-related changes. J. Trace Elem. Med. Biol. 2014, 28, 13–17. [Google Scholar] [CrossRef]
  42. Grubić Kezele, T.; Ćurko-Cofek, B. Age-Related Changes and Sex-Related Differences in Brain Iron Metabolism. Nutrients 2020, 12, 2601. [Google Scholar] [CrossRef] [PubMed]
  43. Latour, C.; Kautz, L.; Besson-Fournier, C.; Island, M.L.; Canonne-Hergaux, F.; Loréal, O.; Ganz, T.; Coppin, H.; Roth, M.P. Testosterone perturbs systemic iron balance through activation of epidermal growth factor receptor signaling in the liver and repression of hepcidin. Hepatology 2014, 59, 683–694. [Google Scholar] [CrossRef] [PubMed]
  44. Tishler, T.A.; Raven, E.P.; Lu, P.H.; Altshuler, L.L.; Bartzokis, G. Premenopausal hysterectomy is associated with increased brain ferritin iron. Neurobiol. Aging 2012, 33, 1950–1958. [Google Scholar] [CrossRef] [PubMed] [Green Version]
  45. Barton, J.C.; Edwards, C.Q.; Acton, R.T. HFE gene: Structure, function, mutations, and associated iron abnormalities. Gene 2015, 574, 179–192. [Google Scholar] [CrossRef] [PubMed]
  46. Kalpouzos, G.; Mangialasche, F.; Falahati, F.; Laukka, E.J.; Papenberg, G. Contributions of HFE polymorphisms to brain and blood iron load, and their links to cognitive and motor function in healthy adults. Neuropsychopharmacol. Rep. 2021, 41, 393–404. [Google Scholar] [CrossRef]
  47. Brissot, P.; Pietrangelo, A.; Adams, P.C.; de Graaff, B.; McLaren, C.E.; Loréal, O. Haemochromatosis. Nat. Rev. Dis. Prim. 2018, 4, 18016. [Google Scholar] [CrossRef]
  48. Zhang, L.; Ellor, S.; Sun, J.M.; Liu, C.; Kurtzburg, J.; Song, A.W. DTI Tract-Based Quantitative Susceptibility Mapping: An Initial Feasibility Study to Investigate the Potential Role of Myelination in Brain Connectivity Change in Cerebral Palsy Patients During Autologous Cord Blood Cell Therapy Using a Rotationally-Invariant Quantitative Measure. J. Magn. Reson. Imaging 2021, 53, 251–258. [Google Scholar] [CrossRef]
  49. Jeynes, K.D.; Gibson, E.L. The importance of nutrition in aiding recovery from substance use disorders: A review. Drug Alcohol Depend. 2017, 179, 229–239. [Google Scholar] [CrossRef] [Green Version]
  50. Spence, H.; McNeil, C.J.; Waiter, G.D. The impact of brain iron accumulation on cognition: A systematic review. PLoS ONE 2020, 15, e0240697. [Google Scholar] [CrossRef]
  51. Blasco, G.; Moreno-Navarrete, J.M.; Rivero, M.; Pérez-Brocal, V.; Garre-Olmo, J.; Puig, J.; Daunis, I.E.P.; Biarnés, C.; Gich, J.; Fernández-Aranda, F.; et al. The Gut Metagenome Changes in Parallel to Waist Circumference, Brain Iron Deposition, and Cognitive Function. J. Clin. Endocrinol. Metab. 2017, 102, 2962–2973. [Google Scholar] [CrossRef]
  52. Sullivan, J.T.; Sykora, K.; Schneiderman, J.; Naranjo, C.A.; Sellers, E.M. Assessment of alcohol withdrawal: The revised clinical institute withdrawal assessment for alcohol scale (CIWA-Ar). Br. J. Addict. 1989, 84, 1353–1357. [Google Scholar] [CrossRef]
  53. Sobell, L.C.; Sobell, M.B. Timeline follow-back: A technique for assessing self-reported alcohol consumption. In Measuring Alcohol Consumption: Psychosocial and Biochemical Methods; Humana Press: Totowa, NJ, USA, 1992; pp. 41–72. [Google Scholar] [CrossRef]
  54. Skinner, H.A.; Sheu, W.J. Reliability of alcohol use indices. The Lifetime Drinking History and the MAST. J. Stud. Alcohol 1982, 43, 1157–1170. [Google Scholar] [CrossRef] [PubMed]
  55. Saunders, J.B.; Aasland, O.G.; Babor, T.F.; de la Fuente, J.R.; Grant, M. Development of the Alcohol Use Disorders Identification Test (AUDIT): WHO Collaborative Project on Early Detection of Persons with Harmful Alcohol Consumption-II. Addiction 1993, 88, 791–804. [Google Scholar] [CrossRef] [PubMed]
  56. Heatherton, T.F.; Kozlowski, L.T.; Frecker, R.C.; Fagerström, K.O. The Fagerström Test for Nicotine Dependence: A revision of the Fagerström Tolerance Questionnaire. Br. J. Addict. 1991, 86, 1119–1127. [Google Scholar] [CrossRef] [PubMed]
  57. Zachary, R.A.; Paulson, M.J.; Gorsuch, R.L. Estimating WAIS IQ from the Shipley Institute of Living Scale using continuously adjusted age norms. J. Clin. Psychol. 1985, 41, 820–831. [Google Scholar] [CrossRef]
  58. Wang, Y.; Liu, T. Quantitative susceptibility mapping (QSM): Decoding MRI data for a tissue magnetic biomarker. Magn. Reson. Med. 2015, 73, 82–101. [Google Scholar] [CrossRef] [Green Version]
  59. Liu, Z.; Spincemaille, P.; Yao, Y.; Zhang, Y.; Wang, Y. MEDI+0: Morphology enabled dipole inversion with automatic uniform cerebrospinal fluid zero reference for quantitative susceptibility mapping. Magn. Reson. Med. 2018, 79, 2795–2803. [Google Scholar] [CrossRef]
Figure 1. (A). Serum ferritin levels were higher in inpatients with alcohol use disorder (AUD; n = 583) than healthy controls (HCs; n = 470) in the sample from the National Institutes of Health (NIH) (p < 0.001). (B) Serum ferritin levels were also higher in individuals with AUD (n = 10) than HCs (n = 8) in the Penn sample (p < 0.05). *** p  <  0.001, * p < 0.05.
Ijms 24 04461 g001
Figure 2. Age significantly predicted whole-brain quantitative susceptibility (β = 0.618, p = 0.020).
Ijms 24 04461 g002
Figure 3. (A) Positive association between AUD and brain quantitative susceptibility in the left globus pallidus (peak = [−26, −21, 6], voxel-level uncorrected-p < 0.005, cluster extent k = 89). The bar graph depicts the peak susceptibility of the globus pallidus cluster for AUD > HC. (B) Positive association between age and brain quantitative susceptibility across participants, covering clusters in the precuneus, bilateral dorsolateral prefrontal cortex (dlPFC), orbitofrontal cortex (OFC), bilateral midbrain, bilateral fusiform gyrus/parahippocampal gyrus, left thalamus, and right caudate (voxel-level uncorrected-p < 0.005, k > 50). Abbreviations: AUD, alcohol use disorder; HC, healthy control.
Ijms 24 04461 g003
Table 1. Demographic and clinical characteristics of the Penn alcohol use disorder and healthy control cohorts. Data are presented as mean (SD).
CharacteristicsAUD (n = 10)HC (n = 8)p-Value
Age, years37.30 (15.72)32.50 (8.30)p = 0.42
BMI (kg/m2)27.51 (4.99)22.69 (2.59)p = 0.025
Education, years15.00 (2.11)16.75 (1.49)p = 0.065
Shipley Standard IQ score109.10 (13.71)117.63 (12.09)p = 0.19
Sex p = 0.39
   Female34
   Male74
Self-reported race p = 0.91
   Black/African American43
   White65
Smoking status p = 0.090
   Smoker30
   Non-smoker78
Albumin (g/dL)4.79 (0.21)4.70 (0.27)p = 0.44
Drinks per week25.12 (8.65)0.52 (0.70)p < 0.001
Age of first drink, years14.60 (2.63)18.00 (2.58)p = 0.019
Total lifetime drinks (g) (14 g per drink)190,596.00 (332,232.50)8,557.50 (10,546.07)p < 0.001
AUDIT score 14.80 (6.11)1.75 (1.04)p < 0.001
Abbreviations: AUD, alcohol use disorder; AUDIT, Alcohol Use Disorders Identification Test; BMI, body mass index, HC, healthy control.
Table 2. Summary of regression analysis findings for global brain iron from the Penn sample in 10 individuals with AUD and 8 healthy controls.
Global Brain Susceptibility (Penn)
VariableBSE Bβ
AUD−3.554.58−0.212
Age (years)0.4110.1460.618 **
BMI−0.6270.442−0.344
Sex−8.3753.789−0.491 *
Ferritin (μg/L)0.0470.0350.357
R20.354
F2.861 ^
Abbreviations: AUD, alcohol use disorder; BMI, body mass index. Dummy coding: AUD (1 = AUD, 0 = healthy control); sex (1 = female, 0 = male). ^ p < 0.09, * p < 0.05, ** p < 0.01.
Disclaimer/Publisher’s Note: The statements, opinions and data contained in all publications are solely those of the individual author(s) and contributor(s) and not of MDPI and/or the editor(s). MDPI and/or the editor(s) disclaim responsibility for any injury to people or property resulting from any ideas, methods, instructions or products referred to in the content.

