Article

Starch and Sucrose Metabolism and Plant Hormone Signaling Pathways Play Crucial Roles in Aquilegia Salt Stress Adaption

College of Horticulture, Jilin Agricultural University, 2888 Xincheng Street, Changchun 130118, China
*
Author to whom correspondence should be addressed.
These authors contributed equally to this work.
Int. J. Mol. Sci. 2023, 24(4), 3948; https://doi.org/10.3390/ijms24043948
Submission received: 8 January 2023 / Revised: 27 January 2023 / Accepted: 31 January 2023 / Published: 16 February 2023
(This article belongs to the Special Issue Molecular Regulatory Mechanisms of Salinity Tolerance in Plants)

Abstract

:
Salt stress is one of the main abiotic stresses that strongly affects plant growth. Clarifying the molecular regulatory mechanism in ornamental plants under salt stress is of great significance for the ecological development of saline soil areas. Aquilegia vulgaris is a perennial with a high ornamental and commercial value. To narrow down the key responsive pathways and regulatory genes, we analyzed the transcriptome of A. vulgaris under a 200 mM NaCl treatment. A total of 5600 differentially expressed genes were identified. The Kyoto Encyclopedia of Genes and Genomes (KEGG) analysis pointed out that starch and sucrose metabolism and plant hormone signal transduction were significantly improved. The above pathways played crucial roles when A. vulgaris was coping with salt stress, and their protein–protein interactions (PPIs) were predicted. This research provides new insights into the molecular regulatory mechanism, which could be the theoretical basis for screening candidate genes in Aquilegia.

1. Introduction

It is inevitable for plants to encounter environmental stresses during their life cycles. Of the many conditions of stress, salt stress is one of the main abiotic stresses that affect plant growth negatively [1]. Saline soil makes up 6% of the worldwide soil area, and severe plant damage has been found to be the result of consistent soil-salt accumulation [2]. Elaborating on the molecular regulatory mechanism of salt resistance has great significance for crop loss remission, landscape ecology maintenance and soil-erosion prevention. Aquilegia vulgaris (Ranunculaceae) is a widespread and adaptable perennial with a high ornamental and commercial value [3]. Meanwhile, Aquilegia is an emerging model plant at the phylogenetic midpoint between Arabidopsis and Oryza [4], and the tolerance mechanism of Aquilegia could provide a theoretical basis for genetic evolution research. In 2018, the whole genome of A. coerulea “Goldsmith” was sequenced, which provided powerful data support for transcriptome analyses [5]. In previous research, intensive studies were carried out on pollination biology [6], anthocyanin regulation [7], floral organ morphogenesis [7,8], genetic evolution [9], medicinal components [10] and physiological stress responses [11]. However, the molecular regulatory mechanism in Aquilegia under salt stress is poorly understood. Since the ecological quality of the landscape has been damaged due to global climate and soil volatility, revealing the adaptive molecular mechanism for salt stress can further promote the application of Aquilegia.
Under salt stress conditions, a high concentration of Na+ leads to the disruption of a plant’s osmotic equilibrium and physiological drought, and it is the reason for photosynthesis inhibition, tissue damage and plant death [12]. Starch is not only the main energy source for plants but is also involved in the abiotic stress response mechanism [13,14,15]. With catalysis by β-amylase (BAM), starch can be degraded into small carbohydrate molecules. This process releases energy and maintains stability in the osmotic system in plant cells. In addition, the storage forms of sugar can be catalyzed by β-glucosidases (BGLUs) into different complexes that sustain plant physiology stability [16]. Trehalose is an intermediate product of starch and sucrose metabolism, which plays a vital role in damage reduction [17]. Previous studies have illustrated that carbohydrate metabolism has become a decisive factor for salt stress tolerance [18]. However, the clues are still scattered at present; for instance, is there any other enzyme that is correlated with salt resistance, with the exception of BAM? What is the mechanism by which carbohydrates regulate plant growth and development? These questions have been poorly investigated; in addition, different species have various regulatory mechanisms, and more sufficient evidence and supporting theories are needed [18].
Plant hormones, including indole-3-acetic acid (IAA), abscisic acid (ABA), cytokinin (CK), ethylene (ETH), gibberellin (GA) and brassinolide (BR), play crucial roles in plant growth regulation and stress resistance [1]. Fluctuations in endogenous hormone levels are stimulated by stress conditions; signaling pathways can be activated by a combination of hormones and receptors. Subsequently, physiological and biochemical processes are regulated downstream [19]. The accumulation of ABA leads to the closure of stomata cells and alleviates damage during photosynthesis, which directly adjusts plant growth and compound transportation [20]. However, when induced by stress, the concentration and distribution of IAA can be readjusted. This is highly correlated with root morphogenesis and growth situations [21]. DELLAs, plant growth inhibitors, are recruited by downstream genes in the GA signaling pathway and play essential roles in plant stress adaption [1].
The intermediate products of starch and sucrose metabolism include glucose, sucrose and trehalose 6-phosphate. They can interact with other signaling pathways to adjust downstream responses, such as osmotic regulating substances and signaling molecules [22,23,24,25,26]. Glucose is associated with the expressions of IAA signaling pathway genes, such as YUCCA, TIR1, AXR2 and AXR3, which regulate plant cell proliferation, expansion and differentiation [27]. Additionally, both synergistic and antagonistic effects have been found between glucose and the CK signaling pathway [28]. The synthesis and transduction of GA are correlated with glucose [29]. Moreover, it has been clarified that SnRK1 is the key gene in the interaction between glucose and ABA signaling pathways [30]. Arabidopsis thaliana with mutation genes in the sugar signaling pathway have incomplete ABA signaling pathways, and individuals with mutation genes that affect ABA synthesis are not sensitive to glucose [31]. These results demonstrate that sugar signaling and plant hormones regulate and control plant growth together. Nevertheless, more research is needed regarding the intermediate processes of the sugar signaling pathway, such as the determining targets of enzymes and the association between microscopic and macroscopic regulatory processes in plants [25].
To explore the responsive mechanism under salt stress, a transcriptome library was constructed after a 200 mM NaCl treatment in A. vulgaris. Salt-stress-responsive genes in key regulatory pathways were screened and analyzed based on the RNA-seq database. Our study provides new insights into the molecular regulatory mechanism of A. vulgaris under salt stress. Furthermore, the molecular mechanism shows more possibilities for salt-tolerant molecular breeding in Aquilegia.

2. Results

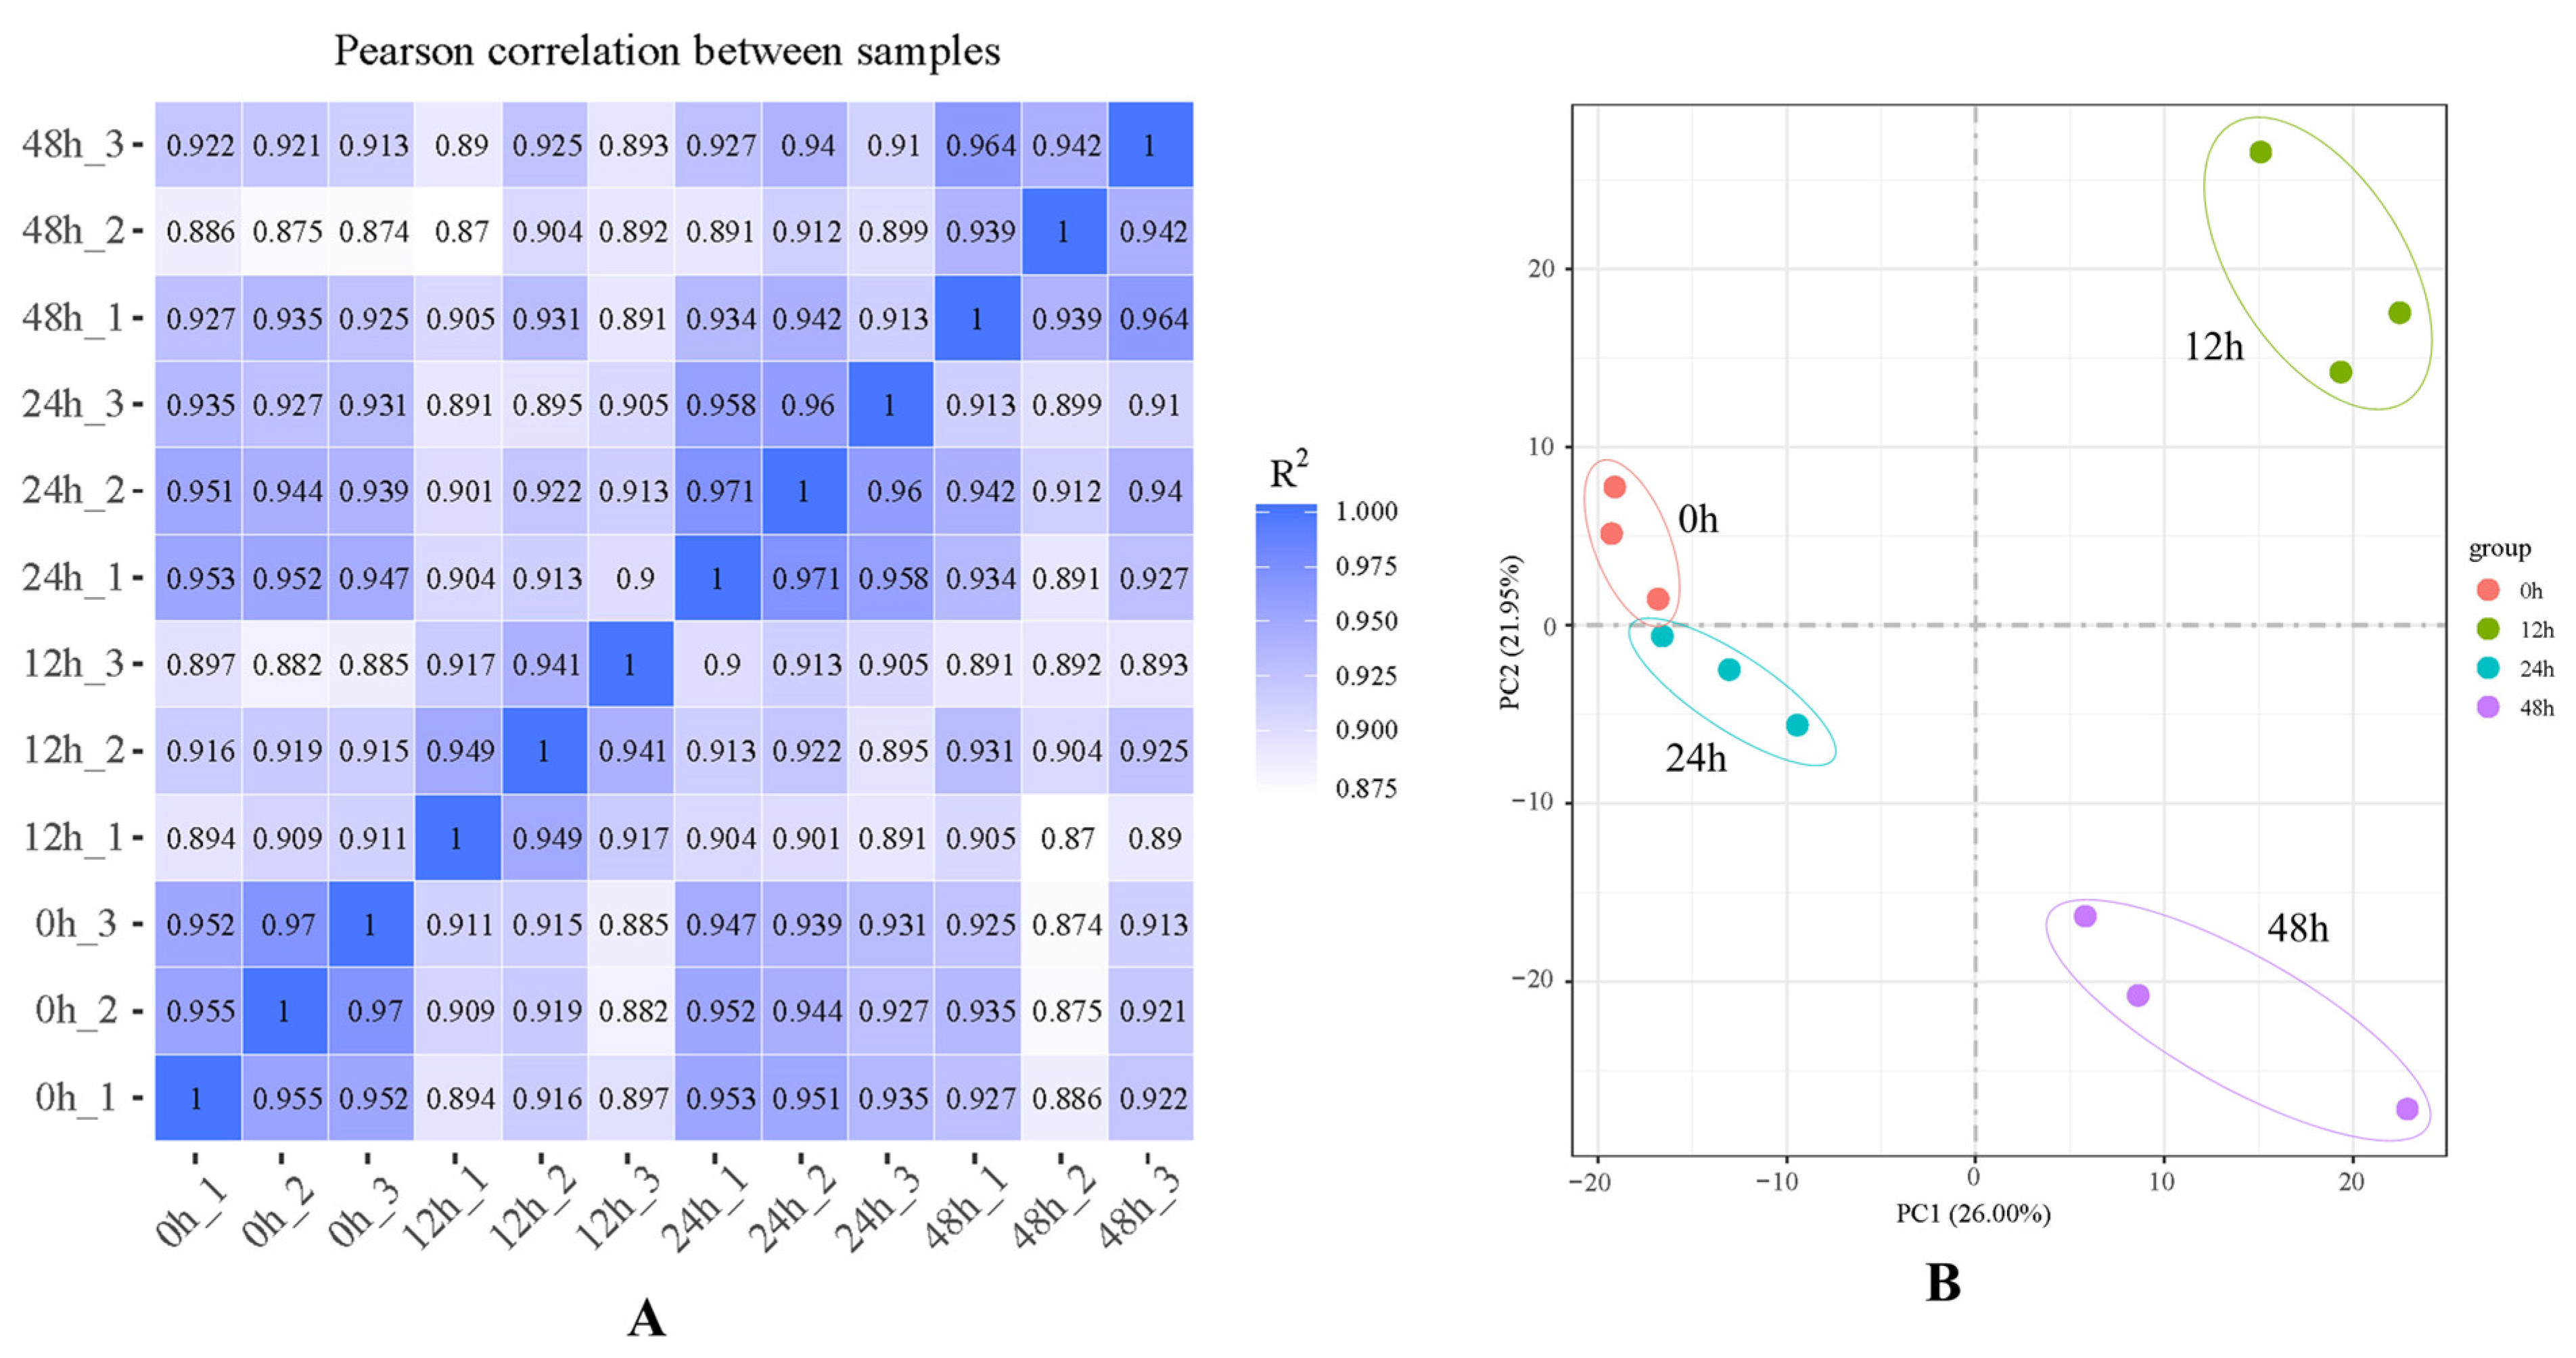
2.1. RNA-Sequencing Quality

A total of 12 transcriptome libraries, at least 41,521,502 clean reads and 6.23 G clean bases, were obtained (Table 1). The Q30 values exceeded 94.81%, and the GC values were between 41.51% and 42.72%. A total of 28,088 de novo genes were assembled (Figure 1), and the contrast ratio between the transcriptome and reference genome exceeded 90.59% (Table 2). The R2 among the three samples in the same treatment exceeded 0.85 (Figure 1). According to the principal component analysis (PCA) (Figure 2B), the samples in different treatments were obviously separated, and the samples in the same treatment were aggregated, which indicates that there was a considerable correlation among the repetitions.

2.2. Differentially Expressed Genes (DEGs)

A total of 5600 differentially expressed genes (DEGs) were found in this research, including 2550 upregulated genes and 3050 downregulated genes. In total, 1979, 918 and 2703 genes were differently expressed after salt treatment for 12 h, 24 h and 48 h, respectively (Figure 3A). Moreover, there were more downregulated genes than upregulated genes in each time node (Figure 3F–H). The numbers of differently expressed genes were acquired in the comparisons of 12 h and 24 h, 12 h and 48 h, and 24 h and 48 h (Figure 3B–D, respectively). A total of 188 DEGs were shared in the three comparisons (Figure 3E). These results show that the genes responded differently in each time node, and 188 genes were found to play roles throughout the salt treatments.

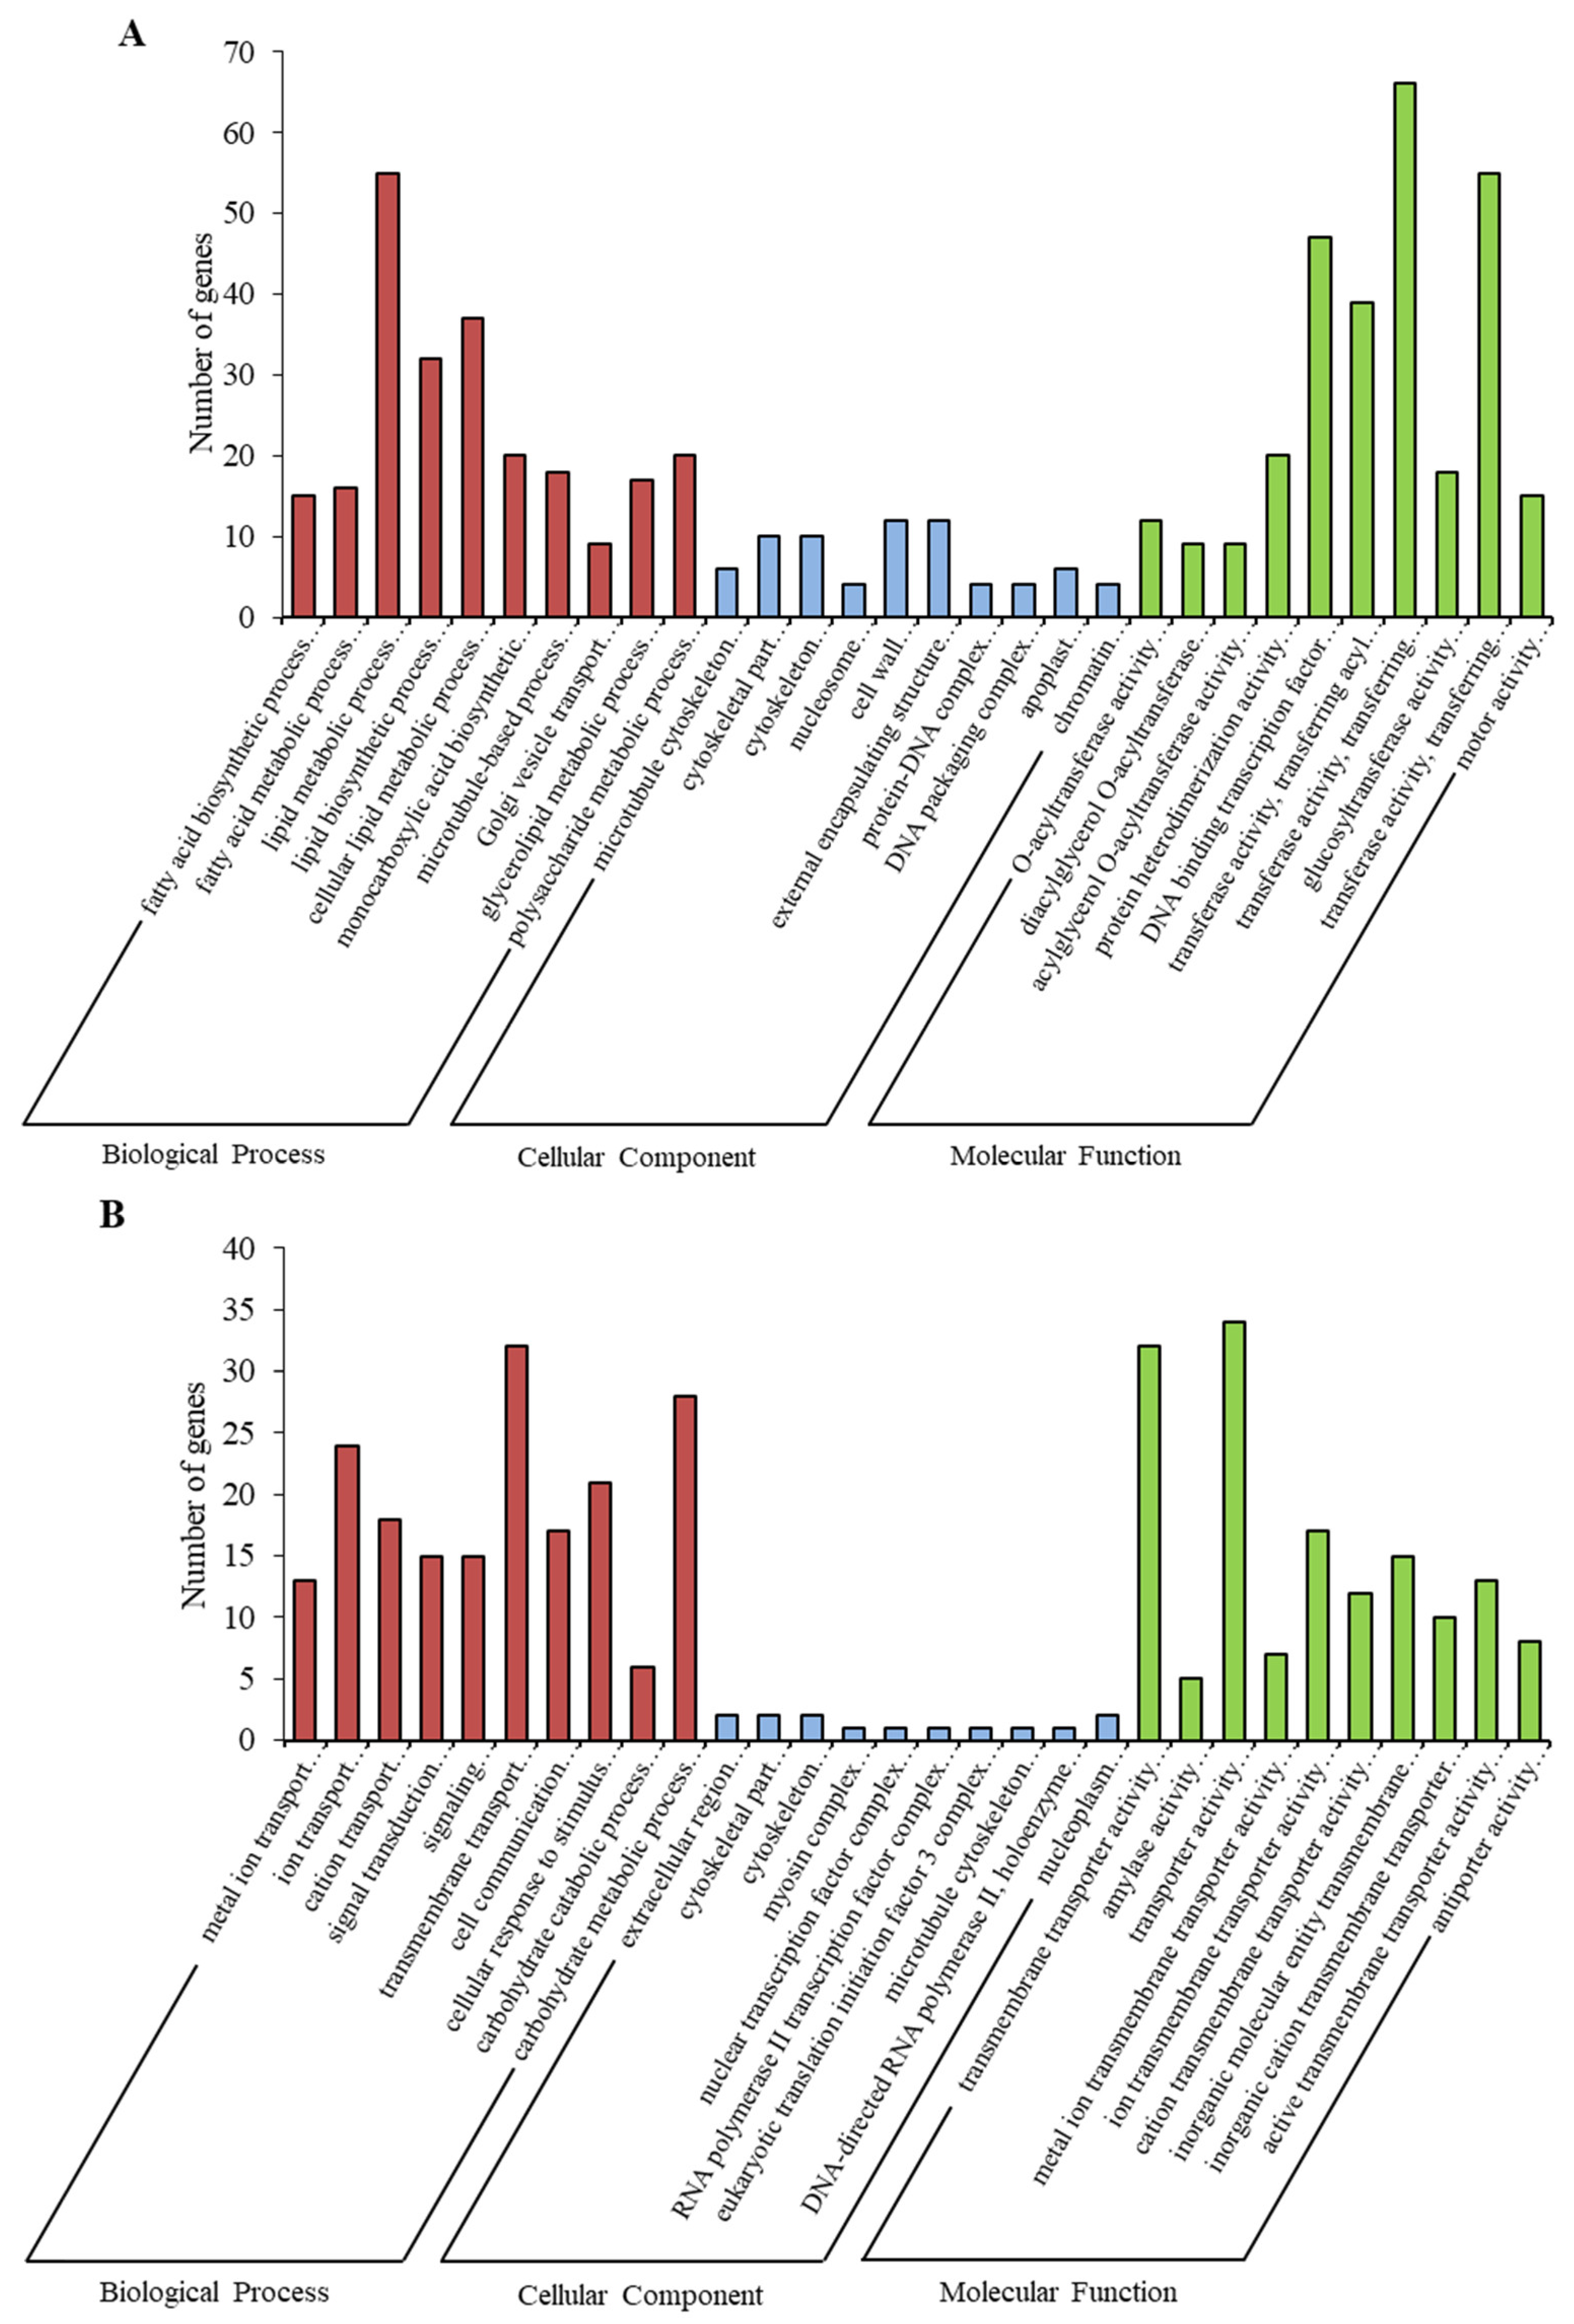
2.3. Gene Ontology (GO) Enrichment Analysis

Based on the screening condition of p value ≤ 0.05, a total of 8355 genes were annotated as significantly enriched. Fatty acid biosynthetic process, microtubule cytoskeleton and O-acyltransferase activity were the main items that were enriched after 12 h (Figure 4A and Figure S1). Metal ion transport, extracellular region and transmembrane transporter activities were the main items that were enriched after 24 h (Figure 4B and Figure S2). Peptide metabolic process, ribosome and structural constituent of ribosome were the main items that were enriched after 48 h (Figure 4C and Figure S3).
For further investigation, the genes whose Gene Ontology (GO) annotations were involved in starch and sucrose metabolism and plant hormone signal transduction were collected. After 12 h, 187 genes were enriched, such as polysaccharide metabolic process, cell wall and external encapsulating structure compound. Moreover, 109 genes were enriched after 24 h, such as signal transduction, signaling, cell communication and carbohydrate catabolic process. However, only six genes were enriched after 48 h, including amylase activity. In this case, the expressions of the genes involved in starch and sucrose metabolism and plant hormone signal transduction were more active at 12–24 h than at 48 h.

2.4. Kyoto Encyclopedia of Genes and Genomes (KEGG) Enrichment Analysis

A total of 13 Kyoto Encyclopedia of Genes and Genomes (KEGG) pathways were significantly enriched based on the screening condition of Padj ≤ 0.05 for the investigation of the gene expressions in the key pathways, in which 2197 differentially expressed genes were found. Four, eight and one pathways and 678, 363 and 1156 genes were enriched significantly after salt treatment for 12 h, 24 h and 48 h, respectively (Figure 5). The mainly enriched KEGG pathways were starch and sucrose metabolism, plant hormone signal transduction and ribosome after 12 h, 24 h and 48 h, respectively.

2.5. Gene Expression Analysis in Starch and Sucrose Metabolism Pathway

A total of 74 genes were found in the starch and sucrose metabolism pathway (Figure 6). Six genes were up- or downregulated in the trehalose synthesis process after salt treatment for 12 h (Figure 6A), which shows that trehalose was involved in the salt tolerance mechanisms of A. vulgaris. The starch synthase genes (SS3, SS4 and GBSS1) in the starch synthesis process (Figure 6B) were downregulated after salt treatment for 12 h, upregulated at 24 h and then tended to stabilize. The 1,4-alpha-glucan branching enzyme gene (EMB2729) reached the peak at 12 h and then decreased, which indicates that starch synthesis was enhanced instead of amylose. In the process of starch hydrolysis (Figure 6D), ISA1, ISA3, CT-BMY, DPE2 and PHS2 reached the peak at 12 h and then decreased at 24 h; BAM7, DBE1, AT5G11720 and PHS1 decreased at 12 h and then reached the peak at 24 h. Thus, the salt treatment induced amylolysis during the 12–24 h period and then abated.
In the process of sucrose synthesis and hydrolysis (Figure 6C), SPS1F, ATPS4F and SPS3F reached the peak at 24 h and then decreased, which indicates that the 24 h salt treatment induced sucrose synthesis in A. vulgaris. Regarding the sucrose synthase genes (SUS3 and SUS6) and β-fructofuranosidase genes (ATBETAERUCT4, AT1G62660 and AT1G12240), which were annotated in the process of sucrose hydrolysis, their expressions increased and then decreased, with peaks at 12 h. The gene that was annotated as α-glucosidase (AT5G1172) reached the lowest value at 12 h and then increased substantially. That is to say, the dominant genes that regulated sucrose hydrolysis varied with the salt treatment process.
A total of 26 genes were annotated as the beta-glucosidase (BGLU) family in cellulose hydrolysis (Figure 6E), of which 12 genes (BGLU1, BGLU46, BGLU10, BGLU11 and BGLU1) reached the peak at 12 h. A total of 10 BGLU genes (BGLU40, BGLU10, BGLU44, BGLU11 and BGLU45) and 1 endoglucanase gene (GH9A1) increased substantially at 24 h, and 8 genes (BGLU10, BGLU11 and BGLU45) reached the peak. A total of four genes (BGLU10, BGLU40, BGLU17 and AT5G20950) were upregulated stably with a peak at 48 h. In general, the expressions of the genes that regulated the starch and sucrose metabolism pathway varied with the salt treatment process, and these results reveal that the energy source distribution was affected by the salt treatment in A. vulgaris.

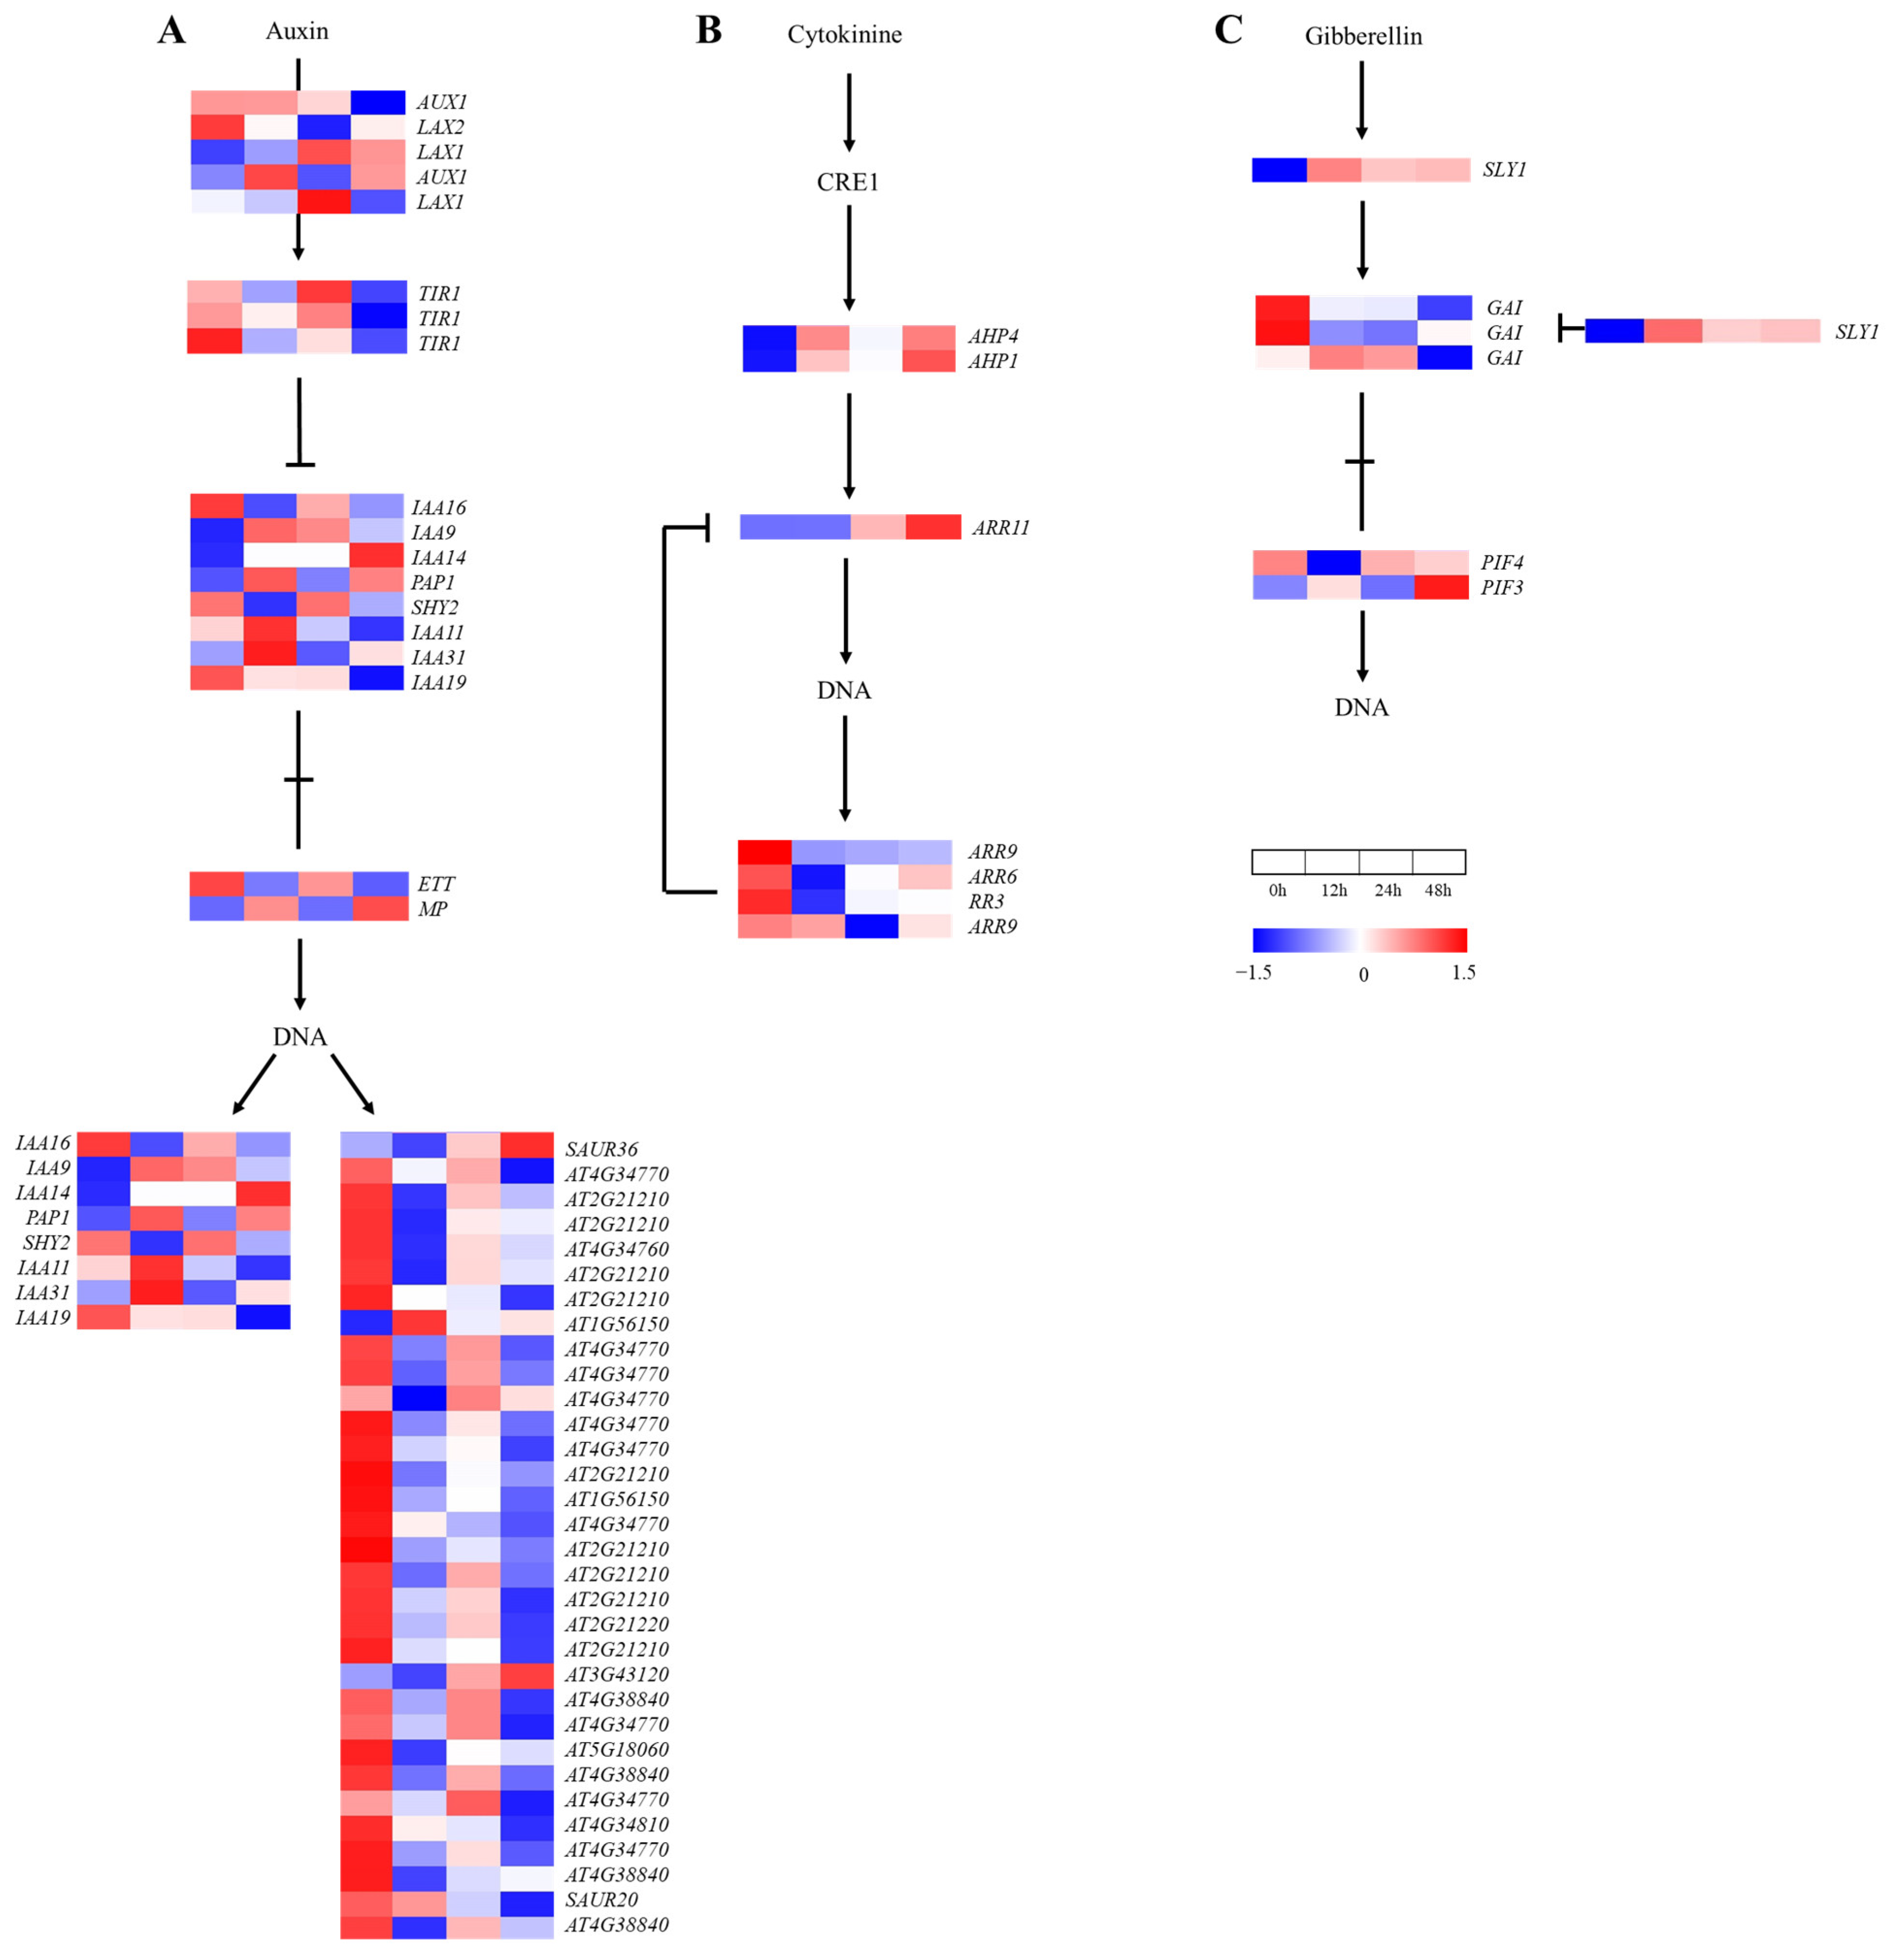
2.6. Gene Expression in Plant Hormone Signal Transduction

A total of 87 genes were annotated in the plant hormone signal transduction pathways (Figure 7). In the IAA, CK and GA signaling pathways, 50, 7 and 6 genes were found, respectively. The expressions of 37 genes decreased at 12 h and then increased at 24 h in the IAA signaling pathway (Figure 7A), of which 19 genes (TIR1, IAA16, SHY2, ETT, At2G21210, AT4G34760, AT4G34770, AT1G56150, AT3G43120, AT5G18060 and AT4G38840) and 15 genes (LAX2, LAX1, TIR1, IAA19, AT4G34770, AT2G21210, AT2G21220 and AT4G38840) reached the lowest values at 12 h and 48 h, respectively. The expressions of four genes (ARR6, ARR9 and RR3) in the CK signaling pathway (Figure 7B) decreased at 12–24 h, with a small increase at 48 h. Induced by the salt treatment, the genes’ expressions in the GA signal transduction pathway (Figure 7C) changed in a complicated manner; the expressions of two DELLAs (GAI) maintained a level lower than that at 0 h after 12 h of downregulation. Thus, IAA, CK and GA signaling were inhibited by the salt treatment.
Under salt stress, the ABA, BR and JA signaling pathways were involved in 11, 7 and 6 genes, respectively (Figure 7). Firstly, the expression of five genes increased and then decreased in the ABA signal transduction pathway (Figure 7D), of which four SnRK2 family genes reached the peak at 12 h. Two ABFs, which belonged to the downstream genes of PP2C, reached the lowest values at 12 h and then recovered to varying degrees. In addition, the expression of the CYCD3 gene increased and then decreased, except for upstream of BSK in the BR signaling pathway (Figure 7E). The responsive genes in the JA signaling pathway changed differently under the salt treatment (Figure 7F). These results show that the ABA signaling pathway was negatively affected by the initial salt treatment but was enhanced in anaphase, which is opposite to the case of the BR signaling pathway, and the complex defense system of A. vulgaris was constituted together with the JA signaling pathway.

2.7. Interaction Network Analysis

A total of 155 protein–protein interaction (PPI) IDs were uploaded to the Sting online database, and they were involved in the starch and sucrose metabolism pathway and the plant hormone signal transduction pathway. The result shows that 67 proteins in the starch and sucrose metabolism pathway formed an interaction network with 49 proteins in the plant hormone signal transduction pathway (Figure 8). Furthermore, we found that CT-BMY interacted with IAA19 and that BGLU40 interacted with the DELLA family.

2.8. Data Reliability Analysis with Quantitative Real-Time PCR

In order to verify the reliability of the RNA-seq, the relative expressions and log 2-fold changes of 16 genes were calculated based on Ct. The upregulation or downregulation trends in the quantitative real-time PCR (qRT-PCR) were the same as those in the RNA-seq (Figure 9), which indicates the considerable reliability of the RNA-seq.

3. Discussion

Soil salination has become a global issue that strongly restricts crop production and landscape ecological quality. A. vulgaris has a great potential ornamental and commercial value in northern hemisphere countries [3]. The transcriptome of A. vulgaris under salt treatment was analyzed in this research. A total of 5600 DEGs were found, and starch and sucrose metabolism and plant hormone signal transduction were significantly enriched in the KEGG analysis, of which the genes were the focus of subsequent investigations.
To cope with abiotic stress, secondary metabolites in the glycogroup form are synthesized in plants. After glycosylation, these secondary metabolites are more soluble and stable than they were before. The synthesis process is catalyzed by the β-glucosidase (BGLU) family, which plays an essential role in cell membrane stability and osmotic potential balancing [16]. In addition, the functions of BGLUs also include cell wall degradation, lignification and signal transduction [32]. A total of 29 BGLUs were obtained in the KEGG enrichment analysis, and they were the most numerous in the starch and sucrose metabolism pathway. Previous studies have illustrated a diverse mode of action of the BGLU family in different species; for example, the upregulation of BGLUs in Solanum lycopersicum was induced by salt stress [33], and the BGLUs in Medicago truncatula underwent various changes under salt stress [16]. The functions of some BGLUs have been verified; for instance, in a previous study, CsBGLU12 was induced by salt treatment, during which the antioxidant flavonol content of over-expressed Nicotiana benthamiana accumulated and alleviated the stress damage level [34]. However, mutant A. thaliana plants, in which the salt-response genes AtBGLU1 and AtBGLU19 were knocked out, have been found to be less sensitive to salt stress [35]. In addition, BGLU belongs to the GH1 family, which has been an ideal material for plant engineering [35]. In this study, the BGLU family was induced to catalyze glycosylated osmotic regulation in order to protect the cell membrane system’s integrity, which was the salt stress adaptive strategy in A. vulgaris.
Plant growth, development and energy distribution are regulated by plant hormone signaling in stress adaption [36]. A total of 28 genes were found in the plant hormone signaling pathways. Among them, five SAURs were inhibited by the salt treatment at all time points, and this result is different from that of previous studies [37,38,39]. It has been elucidated that IAA regulates plant morphogenesis under stress conditions, including vegetative and reproductive growth [2,40,41,42]. IAA, Transport Inhibitor Response 1 (TIR1) and the auxin signal transduction-related protein (AFB) combine to form a complex, which leads to the ubiquitination and degradation of AUX/IAA, restrains the function of auxin response factors (ARFs) and negatively affects the expressions of the downstream transcription factors small auxin-upregulated RNAs (SAURs) [43]. Plant cell division and expansion are regulated by SAURs and correlated with plant morphogenesis [44]. The over-expression of SAUR in A. thaliana leads to cell elongation [45], and SAUR has also been found to be associated with the stem growth of sunflowers (Helianthus annuus) [46]. Depending on the IAA signaling pathway, a restrained expansion of the leaf area and reduced nutrient consumption were formed as a survival strategy under salt stress in A. vulgaris.
According to the protein–protein interaction (PPI) analysis, a protein interaction network was found among the starch and sucrose metabolism and plant hormone signal transduction pathways. The result shows that CT-BMY and the AUX/IAA protein IAA19 interacted with each other. AUX/IAA plays a crucial role in the IAA signaling pathway, and it is correlated with plant embryonic development, lateral root growth and floral development [47]. In 2001, Purgatto first discovered that IAA affected the activation of BAM during banana fruit ripening, which delayed starch degradation [48]. Glucose is one of the starch degradation products, and it provides a substrate for the biosynthesis of resistant active substances [49]. Thus, starch hydrolysis, which is regulated by the IAA signaling pathway, was one of the survival tactics in A. vulgaris; further studies are needed to determine their interaction relationship. Moreover, according to the PPI network, BGLU40 interacted with DELLA, which belongs to the GA signaling pathway. It has been illustrated that a glycoside bond can be hydrolyzed by BGLU, release IAA and ABA combined with glucose and endow the hormone with biological activities [32]. The promoters of the PtBGLU family contain the ABA-responsive element ABRE, and the gene members can respond to stress conditions mediated by the ABA signaling pathway [50]. Moreover, the OsBGLU family is also correlated with the IAA and ABA signaling pathways [32]. GA plays an important role in plant growth and development. DELLA belongs to the GA signaling pathway; it is a growth inhibitor that can regulate downstream transcription factors, and it is related to the key proteins that affect plant growth [51]. DELLA degradation is the central adjustment switcher in the GA signaling pathway [52]. In 2013, Paparelli [29] demonstrated that there were diurnal changes in starch synthesis and degradation; starch was accumulated by photosynthesis during the daytime, and GA synthesis and plant growth were powered by starch degradation during the nighttime. In addition, the regulation factor O-Linked N-acetylglucosaminyltransferase (OGT), which is independent of the GA signaling pathway in A. thaliana, could catalyze the synthesis of O-linked N-acetylglucosamine (O-GlcNac). DELLA glycosylate was catalyzed by O-GlcNac; therefore, non-GA mediated post-modification was determined to be a considerable way to affect DELLA activity [53]. In 2019, it was found that DELLA and BGLU were both significantly enriched during floral organ development in Dimocarpus longan [54]; however, there was no experimental evidence to prove the interaction between them. Although the circadian rhythm in this research was inevitable, the expression of DELLA was inhibited throughout the entire treatment time, which suggests that it was predominantly negatively affected by the salt treatment. We further speculated that BGLU40 is correlated with the post-modification of DELLA and with the regulation of DELLA and downstream transcription factors’ activities; thus, it could represent a salt stress adaption strategy in A. vulgaris.

4. Materials and Methods

4.1. Plant Materials and Salt Treatment

The seeds of A. vulgaris were harvested from the ornamental resource greenhouse of Jilin Agricultural University (125°43′ E, 43°82′ N), Changchun City, Jilin Province, China. Then, all seeds were sown into 6.5 × 6.5 × 9 cm3 plastic pots filled with turf. When the seedlings had six leaves, each pot was irrigated with 50 mL of a 200 mM NaCl solution, according to the pre-experiment. A control test method was adopted in this study. After treatment for 0 h (control), 12 h, 24 h and 48 h, the six fully expanded leaves were taken as the material for RNA extraction, and they were collected and rapidly frozen in liquid nitrogen and stored under −80 °C conditions. At least 500 mg of tissue was collected in each treatment, and each treatment was repeated three times.

4.2. RNA Extraction and cDNA Library Construction

A standard process was taken as the method for RNA extraction [55]. The mRNAs with poly-A tails were enriched using Oligo (dT) magnetic beads and then broken randomly in a fragmentation buffer. The mRNA fragments were taken as the templates for cDNA transcription after the terminals were repaired and the A tails were added, and the libraries were obtained using PCR amplification with the specific primers. Moreover, the libraries were sequenced using the Illumina Novaseq platform (Illumina, San Diego, CA, USA).

4.3. Reference Genome Alignment

The genome sequence of A. coerulea “Goldsmith” was obtained from NCBI (https://ftp.ncbi.nlm.nih.gov/genomes/all/GCA/002/738/505/GCA_002738505.1_Aquilegia_coerulea_v1/, accessed on 10 October 2020). Then, index preparation and a genome comparison were conducted using HISAT2 [56] accurately.

4.4. Sample Correlation and Gene Expression Analysis

The correlation between the samples was determined using Pearson correlation (R2), and the principal component analysis (PCA) was calculated using the method of linear algebra. The read number, which was mapped to each gene, was analyzed using featureCounts (1.5.0) [57]. FPKM (the expected number of fragments per kilobase of transcript sequence per millions of base pairs sequenced) was calculated based on the length of the gene and the read count mapping to the gene. The expression difference was analyzed using DESeq (1.20.0) [58], and Padj was adjusted using the Benjamini and Hochberg method [59] to control the error discovery rate. After correction, Padj ≤ 0.05 and |Log 2 fold change| ≥ 1 were considered as the thresholds for significantly differentially expressed genes. A heat map was visualized using TBtools (1.108) (South China Agricultural University, Guangzhou, China) after the FPKM values were normalized by taking the log base 2.

4.5. Enrichment and Interaction Analyses

Gene Ontology (GO) and Kyoto Encyclopedia of Genes and Genomes (KEGG) enrichment analyses were conducted using the clusterProfiler R package (3.4.4) [60]. The corrected p value ≤ 0.5 was selected as a threshold condition for the significant enrichment of differential genes in the GO terms. The KEGG enrichment was conducted as the reference data of A. thaliana. Protein–protein interactions (PPIs) were analyzed using String (https://cn.string-db.org/) accessed on 8 February 2021, and the network was visualized using Cytoscape (3.9.0) (National Institute of General Medical Sciences, Bethesda, MD, USA).

4.6. Quantitative Real-Time PCR (qRT-PCR)

RNA extraction was conducted as described above, and RNA reverse transcription was conducted using a cDNA Synthesis Kit (All-in-one 1st Strand cDNA Synthesis SuperMix, Novoprotein, Suzhou, China). Sixteen genes were randomly selected, and their Ct values were measured using the qTOWER3 detecting system (Analytik, Jena, Germany) with SYBR qPCR SuperMix Plus (E096, Novoprotein, Suzhou, China). As shown in Table S1, the primers were designed using Primer Premier 5 (Primier Biosoft International, Palo Alto, CA, USA). Moreover, the internal control gene was IPP2 as reported in [8]. The relative expressions were calculated using the 2−ΔΔCt method [61]. The Log 2-fold change was calculated by comparing the salt treatment group with the control group (0 h) using the method reported in [62].

5. Conclusions

The A. vulgaris transcriptome was sequenced under a 200 mM NaCl treatment for 0 h, 12 h, 24 h and 48 h. A KEGG enrichment analysis revealed that the starch and sucrose metabolism pathway and the plant hormone signal transduction pathway played vital roles during the salt treatment. In addition, glycoconjugate biosynthesis regulated by the BGLU family could balance the osmotic potential and maintain cell membrane stability. The IAA signaling pathway to slow down growth and reduce energy consumption was formed as one of the survival strategies in A. vulgaris. Moreover, the starch and sucrose metabolism pathway and the plant hormone signal transduction pathway were combined to constitute the defense system in A. vulgaris. The application of the BGLU family in plant engineering and the starch degradation mechanism mediated by the IAA signaling pathway need to be further studied. This research provides new insights into the stress resistance in Aquilegia and puts forward more possibilities for the excavation of salt-tolerant genes.

Supplementary Materials

Supplementary Materials can be found at https://www.mdpi.com/article/10.3390/ijms24043948/s1.

Author Contributions

L.C. and Y.M. performed the experiment, analyzed the data and drafted and edited the manuscript together. Y.B., H.Y. and Y.Q. performed the experiments, analyzed the data and edited the manuscript. D.Z. edited the manuscript and visualized the data. Y.Z. designed the experiment; provided the laboratories, instruments and equipment; edited and reviewed the manuscript; and connected with all authors and involved them in major decisions about the publication. All authors have read and agreed to the published version of the manuscript.

Funding

This work was supported by the National Natural Science Foundation of China Youth Foundation Project (32101586), the Scientific research start-up funds of Jilin Agricultural University (202023298) and the Changchun Science and Technology Bureau research project (21ZGN08).

Institutional Review Board Statement

Not applicable.

Informed Consent Statement

Not applicable.

Data Availability Statement

The data presented in this study are openly available in the Sequence Read Archive (SRA) database in NCBI under accession number PRJNA931641.

Acknowledgments

We appreciate Fengrui Yang for his help in cultivating plant materials and performing the experiment for this research.

Conflicts of Interest

The authors declare no conflict of interest.

References

  1. Yu, Z.; Duan, X. How plant hormones mediate salt stress responses. Trends Plant Sci. 2020, 25, 1117–1130. [Google Scholar] [CrossRef] [PubMed]
  2. Yang, Y.; Yan, G. Elucidating the molecular mechanisms mediating plant salt-stress responses. New Phytol. 2017, 217, 523–539. [Google Scholar] [CrossRef] [PubMed] [Green Version]
  3. Nold, R. Columbines: Aquilegia, Paraaquilegia, and Semiaquilegia; Timber Press: Portland, OR, USA, 2003; Volume 3, pp. 124–130. [Google Scholar]
  4. Kramer, E.M. Aquilegia: A new model for plant development, ecology, and evolution. Annu. Rev. Plant Biol. 2009, 60, 261–277. [Google Scholar] [CrossRef] [PubMed]
  5. Filiault, D.L.; Ballerini, E.S. The Aquilegia genome provides insight into adaptive radiation and reveals an extraordinarily polymorphic chromosome with a unique history. eLIFE 2018, 7, e36426. [Google Scholar] [CrossRef]
  6. Han, M.; Zhu, Q. Petal ontogeny, structure, and pollination system of four Aquilegia species in Midwest China. Flora 2022, 286, 151987. [Google Scholar] [CrossRef]
  7. Min, Y.; Kramer, E.M. Transcriptome profiling and weighted gene co-expression network analysis of early floral development in Aquilegia coerulea. Sci. Rep. 2020, 10, 19637. [Google Scholar] [CrossRef]
  8. Ballerini, E.S.; Min, Y. POPOVICH, encoding a C2H2 zinc-finger transcription factor, plays a central role in the development of a key innovation, floral nectar spurs, in Aquilegia. Proc. Natl. Acad. Sci. USA 2020, 117, 202006912. [Google Scholar] [CrossRef]
  9. Shi, T.; Chen, J. A reappraisal of the phylogenetic placement of the Aquilegia whole-genome duplication. Genom. Biol. 2020, 21, 295. [Google Scholar] [CrossRef]
  10. Mushtaq, S.; Aga, M.A. Isolation, characterization and HPLC quantification of compounds from Aquilegia fragrans Benth: Their in vitro antibacterial activities against bovine mastitis pathogens. J. Ethnopharmacol. 2016, 178, 9–12. [Google Scholar] [CrossRef]
  11. Chen, L.; Yuan, M. Physio-biochemical responses of three Aquilegia species seedlings to salt stress. Agronomy 2022, 12, 2841. [Google Scholar] [CrossRef]
  12. El Moukhtari, A.; Cabassa-Hourton, C. How does proline treatment promote salt stress tolerance during crop plant development? Front. Plant Sci. 2020, 11, 1127. [Google Scholar] [CrossRef]
  13. Chen, Y.; Jiang, Y. Uncovering candidate genes responsive to salt stress in Salix matsudana (Koidz) by transcriptomic analysis. PLoS ONE 2020, 15, e0236129. [Google Scholar] [CrossRef]
  14. Liu, Z.; Hua, Y. Analysis of the Prunellae spica transcriptome under salt stress. Plant Physiol. Biochem. 2020, 156, 314–322. [Google Scholar] [CrossRef]
  15. Deng, C.; Zhang, Z. Salt-responsive transcriptome analysis of triticale reveals candidate genes involved in the key metabolic pathway in response to salt stress. Sci. Rep. 2020, 10, 20669. [Google Scholar] [CrossRef]
  16. Yang, J.; Ma, L. Comprehensive identification and characterization of abiotic stress and hormone responsive glycosyl hydrolase family 1 genes in Medicago truncatula. Plant Physiol. Biochem. 2021, 158, 21–33. [Google Scholar] [CrossRef]
  17. Samadi, S.; Habibi, G. Exogenous trehalose alleviates the inhibitory effects of salt stress in strawberry plants. Acta Physiol. Plant 2019, 41, 112. [Google Scholar] [CrossRef]
  18. Thalmann, M.; Pazmino, D. Regulation of leaf starch degradation by abscisic acid is important for osmotic stress tolerance in plants. Plant Cell 2016, 28, 1860–1878. [Google Scholar] [CrossRef] [Green Version]
  19. Dar, N.A.; Amin, I. Abscisic acid: A key regulator of abiotic stress tolerance in plants. Plant Gene 2017, 11, 106–111. [Google Scholar] [CrossRef]
  20. Muchate, N.S.; Nikalje, G.C. Plant salt stress: Adaptive responses, tolerance mechanism and bioengineering for salt tolerance. Bot. Rev. 2016, 82, 1–36. [Google Scholar] [CrossRef]
  21. Pavlović, I.; Pěnčík, A. Short-term salt stress in Brassica rapa seedlings causes alterations in auxin metabolism. Plant Physiol. Biochem. 2018, 125, 74–87. [Google Scholar] [CrossRef]
  22. Van den Ende, W.; El-Esawe, S.K. Sucrose signaling pathways leading to fructan and anthocyanin accumulation: A dual function in abiotic and biotic stress responses? Environ. Exp. Bot. 2014, 108, 4–13. [Google Scholar] [CrossRef]
  23. Li, L.; Sheen, J. Dynamic and diverse sugar signaling. Curr. Opin. Plant Biol. 2016, 33, 116–125. [Google Scholar] [CrossRef] [PubMed] [Green Version]
  24. Ceusters, N.; Van den Ende, W. Exploration of Sweet Immunity to Enhance Abiotic Stress Tolerance in Plants: Lessons from CAM; Springer: Cham, Switzerland, 2016; Volume 78, pp. 145–166. [Google Scholar] [CrossRef]
  25. Martínez-Noël, G.M.A.; Tognetti, J.A. Chapter 22—Sugar Signaling Under Abiotic Stress in Plants. In Plant Metabolites and Regulation under Environmental Stress; Academic Press: San Diego, CA, USA, 2018; pp. 397–406. [Google Scholar] [CrossRef]
  26. Saddhe, A.; Manuka, R. Plant sugars: Homeostasis and transport under abiotic stress in plants. Physiol. Plant. 2020, 171, 739–755. [Google Scholar] [CrossRef] [PubMed]
  27. Sakr, S.; Wang, M. The sugar-signaling hub: Overview of regulators and interaction with the hormonal and metabolic network. Int. J. Mol. Sci. 2018, 19, 2506. [Google Scholar] [CrossRef] [Green Version]
  28. Kushwah, S.; Laxmi, A. The interaction between glucose and cytokinin signal transduction pathway in Arabidopsis thaliana. Plant Cell Environ. 2014, 37, 235–253. [Google Scholar] [CrossRef]
  29. Paparelli, E.; Parlanti, S. Nighttime sugar starvation orchestrates gibberellin biosynthesis and plant growth in Arabidopsis. Plant Cell 2013, 25, 3760–3769. [Google Scholar] [CrossRef] [Green Version]
  30. Wang, W.; Liang, J. Overexpression of PpSnRK1α in tomato enhanced salt tolerance by regulating ABA signaling pathway and reactive oxygen metabolism. BMC Plant Biol. 2020, 20, 128. [Google Scholar] [CrossRef]
  31. Han, C.; Kim, S. Cross-talk between ABA and sugar signaling is mediated by the ACGT core and CE1 element reciprocally in OsTIP3;1 promoter. J. Plant Physiol. 2018, 224–225, 103–111. [Google Scholar] [CrossRef]
  32. Ren, R.; Li, D. Specific roles of Os4BGlu10, Os6BGlu24, and Os9BGlu33 in seed germination, root elongation, and drought tolerance in rice. Planta 2019, 249, 1851–1861. [Google Scholar] [CrossRef]
  33. Wei, J.; Chen, Q. Genome-wide identification and expression analysis of tomato glycoside hydrolase family 1 β-glucosidase genes in response to abiotic stresses. Biotechnol. Biotechnol. Equip. 2022, 36, 268–280. [Google Scholar] [CrossRef]
  34. Baba, S.A.; Vishwakarma, R.A. Functional characterization of CsBGlu12, a β-Glucosidase from Crocus sativus, provides insights into its role in abiotic stress through accumulation of antioxidant flavonols. J. Biol. Chem. 2017, 292, 4700–4713. [Google Scholar] [CrossRef] [Green Version]
  35. Cao, Y.; Yang, J. A Phylogenetically informed comparison of GH1 hydrolases between Arabidopsis and rice response to stressors. Front. Plant Sci. 2017, 8, 350. [Google Scholar] [CrossRef] [Green Version]
  36. Wani, S.H.; Kumar, V. Phytohormones and their metabolic engineering for abiotic stress tolerance in crop plants. Crop J. 2016, 4, 162–176. [Google Scholar] [CrossRef] [Green Version]
  37. Zhang, X.; Liu, P. Comparative transcriptome analyses of maize seedling root responses to salt stress. PeerJ 2020, 9, e10765. [Google Scholar] [CrossRef]
  38. Zhang, M.; Hong, L. Transcriptome analyses revealed molecular responses of Cynanchum auriculatum leaves to saline stress. Sci. Rep. 2020, 10, 449. [Google Scholar] [CrossRef] [Green Version]
  39. Bao, Y.; Chen, C. Comparative transcriptome analysis of Rosa chinensis ‘Old Blush’ provides insights into the crucial and signaling pathways in salt stress response. Agron. J. 2021, 113, 3031–3050. [Google Scholar] [CrossRef]
  40. Ribba, T.; Garrido, F. Auxin-mediated responses under salt stress from developmental regulation to biotechnological applications. J. Exp. Bot. 2020, 71, 3843–3853. [Google Scholar] [CrossRef]
  41. Lei, P.; Liu, Z. Transcriptome analysis of salt stress responsiveness in the seedlings of wild and cultivated Ricinus communis L. J. Biotechnol. 2021, 327, 106–116. [Google Scholar] [CrossRef]
  42. Cadavid, I.C.; Guzman, F. Transcriptional analyses of two soybean cultivars under salt stress. Mol. Biol. Rep. 2020, 47, 2871–2888. [Google Scholar] [CrossRef]
  43. Strader, L.C.; Zhao, Y. Auxin perception and downstream events. Curr. Opin. Plant Biol. 2016, 33, 8–14. [Google Scholar] [CrossRef] [Green Version]
  44. Ren, H.; Gray, W.M. SAUR proteins as effectors of hormonal and environmental signals in plant growth. Mol. Plant 2015, 8, 1153–1164. [Google Scholar] [CrossRef] [PubMed] [Green Version]
  45. Stortenbeker, N.; Bemer, M. The SAUR gene family: The plant’s toolbox for adaptation of growth and development. J. Exp. Bot. 2018, 70, 17–27. [Google Scholar] [CrossRef] [PubMed] [Green Version]
  46. Atamian, H.S.; Creux, N.M. Circadian regulation of sunflower heliotropism, floral orientation, and pollinator visits. Science 2016, 353, 587–590. [Google Scholar] [CrossRef] [PubMed] [Green Version]
  47. Luo, J.; Zhou, J. Aux/IAA gene family in plants: Molecular structure, regulation, and function. Int. J. Mol. Sci. 2018, 19, 259. [Google Scholar] [CrossRef] [Green Version]
  48. Purgatto, E.; Lajolo, F.M. Inhibition of β-amylase activity, starch degradation and sucrose formation by indole-3-acetic acid during banana ripening. Planta 2001, 212, 823–828. [Google Scholar] [CrossRef]
  49. Sami, F.; Yusuf, M. Role of sugars under abiotic stress. Plant Physiol. Biochem. 2016, 109, 54–61. [Google Scholar] [CrossRef]
  50. Bian, Z.; Wang, D. Analysis of Populus glycosyl hydrolase family I members and their potential role in the ABA treatment and drought stress response. Plant Physiol. Biochem. 2021, 163, 178–788. [Google Scholar] [CrossRef]
  51. Davière, J.M.; Achard, P. Gibberellin signaling in plants. Development 2013, 140, 1147–1151. [Google Scholar] [CrossRef] [Green Version]
  52. Ito, T.; Okada, K. DELLA-dependent and –independent gibberellin signaling. Plant Signal. Behav. 2018, 13, e1445933. [Google Scholar] [CrossRef] [Green Version]
  53. Silverstone, A.L.; Tseng, T. Functional analysis of SPINDLY in gibberellin signaling in Arabidopsis. Plant Physiol. 2007, 143, 987–1000. [Google Scholar] [CrossRef] [Green Version]
  54. Jue, D.; Sang, X. Comprehensive analysis of the longan transcriptome reveals distinct regulatory programs during the floral transition. BMC Genom. 2019, 20, 126. [Google Scholar] [CrossRef]
  55. Dugasa, M.T.; Feng, X. Comparative transcriptome and tolerance mechanism analysis in the two contrasting wheat (Triticum aestivum L.) cultivars in response to drought and salinity stresses. Plant Growth Regul. 2021, 94, 101–114. [Google Scholar] [CrossRef]
  56. Kim, D.; Paggi, J.M. Graph-based genome alignment and genotyping with HISAT2 and HISAT-genotype. Nat. Biotechnol. 2019, 37, 907–915. [Google Scholar] [CrossRef]
  57. Liao, Y.; Smyth, G.K. featureCounts: An efficient general purpose program for assigning sequence reads to genomic features. Bioinformatics 2014, 30, 923–930. [Google Scholar] [CrossRef] [Green Version]
  58. Love, M.I.; Huber, W. Moderated estimation of fold change and dispersion for RNA-seq data with DESeq2. Genome Biol. 2014, 15, 550. [Google Scholar] [CrossRef] [Green Version]
  59. Benjamini, Y.; Hochberg, Y. On the adaptive control of the false discovery rate in multiple testing with independent statistics. J. Educ. Behav. Stat. 2000, 25, 60–83. [Google Scholar] [CrossRef] [Green Version]
  60. Yu, G.; Wang, L.-G.; Han, Y.; He, Q.-Y. clusterProfiler: An R package for comparing biological themes among gene clusters. OMICS J. Integr. Biol. 2012, 16, 284–287. [Google Scholar] [CrossRef]
  61. Livak, K.J.; Schmittgen, T.D. Analysis of relative gene expression data using real-time quantitative PCR and the 2−ΔΔCT method. Methods 2001, 25, 402–408. [Google Scholar] [CrossRef]
  62. Schmittgen, T.D.; Livak, K.J. Analyzing real time PCR data by the comparative CT methods. Nat. Protoc. 2008, 3, 1101–1108. [Google Scholar] [CrossRef]
Figure 1. The lengths of the genes.
Ijms 24 03948 g001
Figure 2. Correlation analysis and principal component analysis (PCA): (A) sample correlation analysis; (B) sample distributions in PCA 1 and PCA 2.
Ijms 24 03948 g002
Figure 3. Differentially expressed genes (DEGs): (A) numbers of DEGs in each time node; (B) Venn diagrams for 12 h vs. 0 h and 24 h vs. 0 h; (C) Venn diagrams for 12 h vs. 0 h and 48 h vs. 0 h; (D) Venn diagrams for 24 h vs. 0 h and 48 h vs. 0 h; (E) Venn diagrams for 12 h vs. 0 h and 24 h vs. 0 h and 48 h vs. 0 h; (F) volcano plots for 12 h vs. 0 h; (G) volcano plots for 24 h vs. 0 h; (H) volcano plots for 48 h vs. 0 h.
Ijms 24 03948 g003aIjms 24 03948 g003b
Figure 4. Gene Ontology (GO) enrichment analysis in the following groups: (A) 12 h vs. 0 h; (B) 24 h vs. 0 h; (C) 48 h vs. 0 h.
Ijms 24 03948 g004aIjms 24 03948 g004b
Figure 5. Kyoto Encyclopedia of Genes and Genomes (KEGG) enrichment analysis in the following groups: (A) 12 h vs. 0 h; (B) 24 h vs. 0 h; (C) 48 h vs. 0 h.
Ijms 24 03948 g005
Figure 6. Heat map of annotated genes in starch and sucrose metabolism pathway. Solid lines and arrows represent biological processes and directions, while areas separated by dotted lines represent different types of biological processes. (A) Trehalose synthesis process; (B) starch synthesis process; (C) sucrose synthesis and hydrolysis process; (D) starch hydrolysis process; (E) cellulose hydrolysis process.
Ijms 24 03948 g006
Figure 7. Heat map of annotated genes in plant hormone signal transduction pathway. Solid lines and arrows indicate the signal transduction process and direction. (A) Indole-3-acetic acid (IAA) signaling pathway; (B) cytokinin (CK) signaling pathway; (C) gibberellin (GA) signaling pathway; (D) abscisic acid (ABA) signaling pathway; (E) brassinolide (BR) signaling pathway; (F) jasmonic acid (JA) signaling pathway.
Ijms 24 03948 g007aIjms 24 03948 g007b
Figure 8. Protein–protein interaction (PPI) network among the starch and sucrose metabolism pathway and the plant hormone signal transduction pathway. The blue and red nodes represent the sucrose metabolism pathway and the plant hormone signal transduction pathway, respectively. The diameters of the nodes represent the interaction frequency.
Ijms 24 03948 g008
Figure 9. Log 2-fold changes of 16 genes in quantitative real-time PCR (qRT-PCR) and RNA-seq.
Ijms 24 03948 g009
Table 1. RNA-sequencing quality.
SampleRaw ReadsClean ReadsClean BasesError RateQ20Q30GC PCT
0 h_147,647,81446,506,4666.98 G0.0298.3794.8842.31
0 h_247,064,99045,853,9126.88 G0.0298.4194.9642.58
0 h_346,642,71645,494,0966.82 G0.0298.4895.1442.72
12 h_142,376,17441,521,5026.23 G0.0298.3494.8742.23
12 h_247,123,34445,962,4366.89 G0.0298.3494.9142.05
12 h_349,174,17047,628,3887.14 G0.0298.4895.1941.85
24 h_145,614,35044,336,1826.65 G0.0298.5495.3142.25
24 h_246,115,95644,862,2666.73 G0.0298.595.1342.31
24 h_351,810,05250,770,4327.62 G0.0298.5595.2642.29
48 h_145,223,92244,376,1746.66 G0.0298.4395.1442.09
48 h_247,939,29246,686,3007.0 G0.0298.394.8141.51
48 h_348,060,24046,931,4407.04 G0.0298.4195.142.2
Table 2. A comparison of each sample with the reference genome.
SampleTotal ReadsTotal MapMulti Map
0 h_146,506,46691.08%2.20%
0 h_245,853,91291.21%2.24%
0 h_345,494,09692.07%2.26%
12 h_141,521,50291.56%2.42%
12 h_245,962,43691.05%2.36%
12 h_347,628,38890.82%2.54%
24 h_144,336,18291.62%2.37%
24 h_244,862,26691.86%2.32%
24 h_350,770,43291.77%2.42%
48 h_144,376,17491.15%2.50%
48 h_246,686,30090.59%2.52%
48 h_346,931,44091.46%2.53%
Disclaimer/Publisher’s Note: The statements, opinions and data contained in all publications are solely those of the individual author(s) and contributor(s) and not of MDPI and/or the editor(s). MDPI and/or the editor(s) disclaim responsibility for any injury to people or property resulting from any ideas, methods, instructions or products referred to in the content.

