Article

Physiological and Biochemical Responses of Solanum lycopersicum L. to Benzo[a]pyrene Contaminated Soils

1
Academy of Biology and Biotechnology, Southern Federal University, Rostov-on-Don 344090, Russia
2
Moscow Clinical Scientific Center Named after Loginov MHD, Moscow 111123, Russia
*
Author to whom correspondence should be addressed.
Int. J. Mol. Sci. 2023, 24(4), 3741; https://doi.org/10.3390/ijms24043741
Submission received: 25 December 2022 / Revised: 1 February 2023 / Accepted: 10 February 2023 / Published: 13 February 2023

Abstract

:
Benzo[a]pyrene (BaP) is noted as one of the main cancer-causing pollutants in human beings and may damage the development of crop plants. The present work was designed to explore more insights into the toxic effects of BaP on Solanum lycopersicum L. at various doses (20, 40, and 60 MPC) spiked in Haplic Chernozem. A dose-dependent response in phytotoxicity were noted, especially in the biomass of the roots and shoots, at doses of 40 and 60 MPC BaP and the accumulation of BaP in S. lycopersicum tissues. Physiological and biochemical response indices were severely damaged based on applied doses of BaP. During the histochemical analysis of the localization of superoxide in the leaves of S. lycopersicum, formazan spots were detected in the area near the leaf’s veins. The results of a significant increase in malondialdehyde (MDA) from 2.7 to 5.1 times, proline 1.12- to 2.62-folds, however, a decrease in catalase (CAT) activity was recorded by 1.8 to 1.1 times. The activity of superoxide dismutase (SOD) increased from 1.4 to 2, peroxidase (PRX) from 2.3 to 5.25, ascorbate peroxidase (APOX) by 5.8 to 11.5, glutathione peroxidase (GP) from 3.8 to 7 times, respectively. The structure of the tissues of the roots and leaves of S. lycopersicum in the variants with BaP changed depending on the dose: it increased the intercellular space, cortical layer, and the epidermis, and the structure of the leaf tissues became looser.

1. Introduction

The soil due to its physicochemical properties can accumulate pollutants and be a source of contamination of agricultural products [1]. One of the most common classes of pollutants are polycyclic aromatic hydrocarbons (PAHs), which are formed as a result of the pyrolysis of minerals in an oxygen-limited environment or the incomplete combustion of organic matter containing carbon and hydrogen [2]. The most carcinogenic is benzo[a]pyrene (BaP), which is assigned to the first hazard class, and its content in food is unacceptable and is subjected to control in the ecosphere [3].
The accumulation of BaP in all environmental objects including soils and plants is due to anthropogenic load. The mobility of BaP in the soil and the accumulation in plant tissues depend mainly on its solubility as well as on the physiological state of plants. The background content of BaP in most mineral soils ranges from 0.1 to 5 µg/kg, while some peat and Chernozem soils are categorized by a higher level of BaP of 15–20 µg/kg [4].
BaP is lipophilic, degraded by organic solvents, and easily penetrates cell membranes [5]. It is highly resistant to biodegradation, due to which it biomagnifies quickly in the food chain by accumulating in the intercellular fluid of plants. It has been shown that BaP and 1,2-benzacenaphthene can be included in the metabolic chains of plants by binding to glucose and glutathione (GSH), penetrating into the space of the cell wall or cell organelles, causing ultrastructural damage and provoking an increase in the intensity of oxidative stress [6,7].
To study the mechanism of action of PAHs, in particular BaP, on the physiological and biochemical parameters of plants [8], it is necessary to study the work of antioxidant enzymes, photosynthetic pigments, and changes at the cellular level. At the moment, only a few aspects of the impact of PAHs on the physio-biochemical indices of plants have been explored [4]. Most of them are devoted to the toxic effects of petroleum products and other PAHs [4,9,10]. The toxic effect of BaP on the physiological and biochemical parameters is to disrupt the cellular structure, reduce total chlorophyll, and activate peroxidases and the glutathione cascade.
In recent years, research on vegetables has increased worldwide due to their nutritional value. Tomato (Solanum lycopersicum L.) production and consumption are constantly increasing [11]. S. lycopersicum is an economically important vegetable plant and ranks seventh in the worldwide production of agricultural crops [12]. Furthermore, this plant is a model species for introducing agronomically important genes into dicotyledonous crop plants [13]. The Rostov region ranks second in Russia in terms of cultivated areas of agricultural crops, one of which is S. lycopersicum. Additionally, tomato is one of the most cultivated crops in close proximity to the Novocherkassk Hydroelectric Power Station, the main source of PAH emissions in the Rostov region, Russia. S. lycopersicum is highly sensitive to the toxic effects of PAHs, in particular BaP, and is able to accumulate them.
The comprehensive assessment of plant AS performance plays a key role in monitoring, the risk assessment for crops, and the development of remediation strategies in the future. However, comprehensive studies of the physiological and biochemical state of extensive horticultural crops are not enough to provide exhaustive conclusions about the nature of the effect of BaP on S. lycopersicum. This work is devoted to the study of the effect of different doses of BaP on the intensity of free radical processes and the state of the enzymatic AS of S. lycopersicum.

2. Results

2.1. Uptake of BaP in Plant Tissues and Impact on Morphometric Parameters

As a result of measuring the morphobiometric parameters of S. lycopersicum, a direct pattern of inhibition of plant growth and development depending on the applied doses of the pollutant was revealed. The average length of the root and shoot was 39.1 cm and 61.4 cm, respectively, compared with the control variant. The inhibition of root growth in the variant of 20 MPC BaP was 1.2 times, and that of the shoots was 1.1 times; at 40 MPC BaP, the length of the root decreased by 1.45, and that of the shoots by 1.4 (Figure 1a). There was a decrease in tomato weight by 1.3 times in the variant of the experiment 20 MPC BaP, and in the variants of the experiment 40 and 60 MPC BaP, there was no fruiting phase (Figure 1b).
The accumulation of BaP in the control samples was 17.0 ng/g. In the variants with pollution, the increase in the accumulation of BaP in plants occurred with an increase in the dose of applying the pollutant to the soil: in the variant of the experiment 20 MPC BaP—18 times, 40 MPC BaP—30 times, and 60 MPC BaP—35 times (Figure 1c).

2.2. Assessment of Photosynthetic Pigments

The content of carotene, chlorophyll a, chlorophyll b, and total chlorophyll content in the control plants were 4.9 ± 0.2, 74.2 ± 3.5, 4.8 ± 0.2, and 78.4 ± 3.4 mg/kg (Figure 1e), respectively. Thus, there was a decrease in the amount of chlorophyll a by 10.7%, 15%, and 21.8% and total chlorophyll by 13.4% 15%, and 19% in the experimental variants 20, 40, and 60 MPC BaP, respectively. However, chlorophyll b increased by 27%, 37%, and 42%; carotenoids by 16%, 50% and 88% in the variants 20 MPC BaP, 40 MPC BaP, and 60 MPC BaP, respectively (Figure 2e-h).

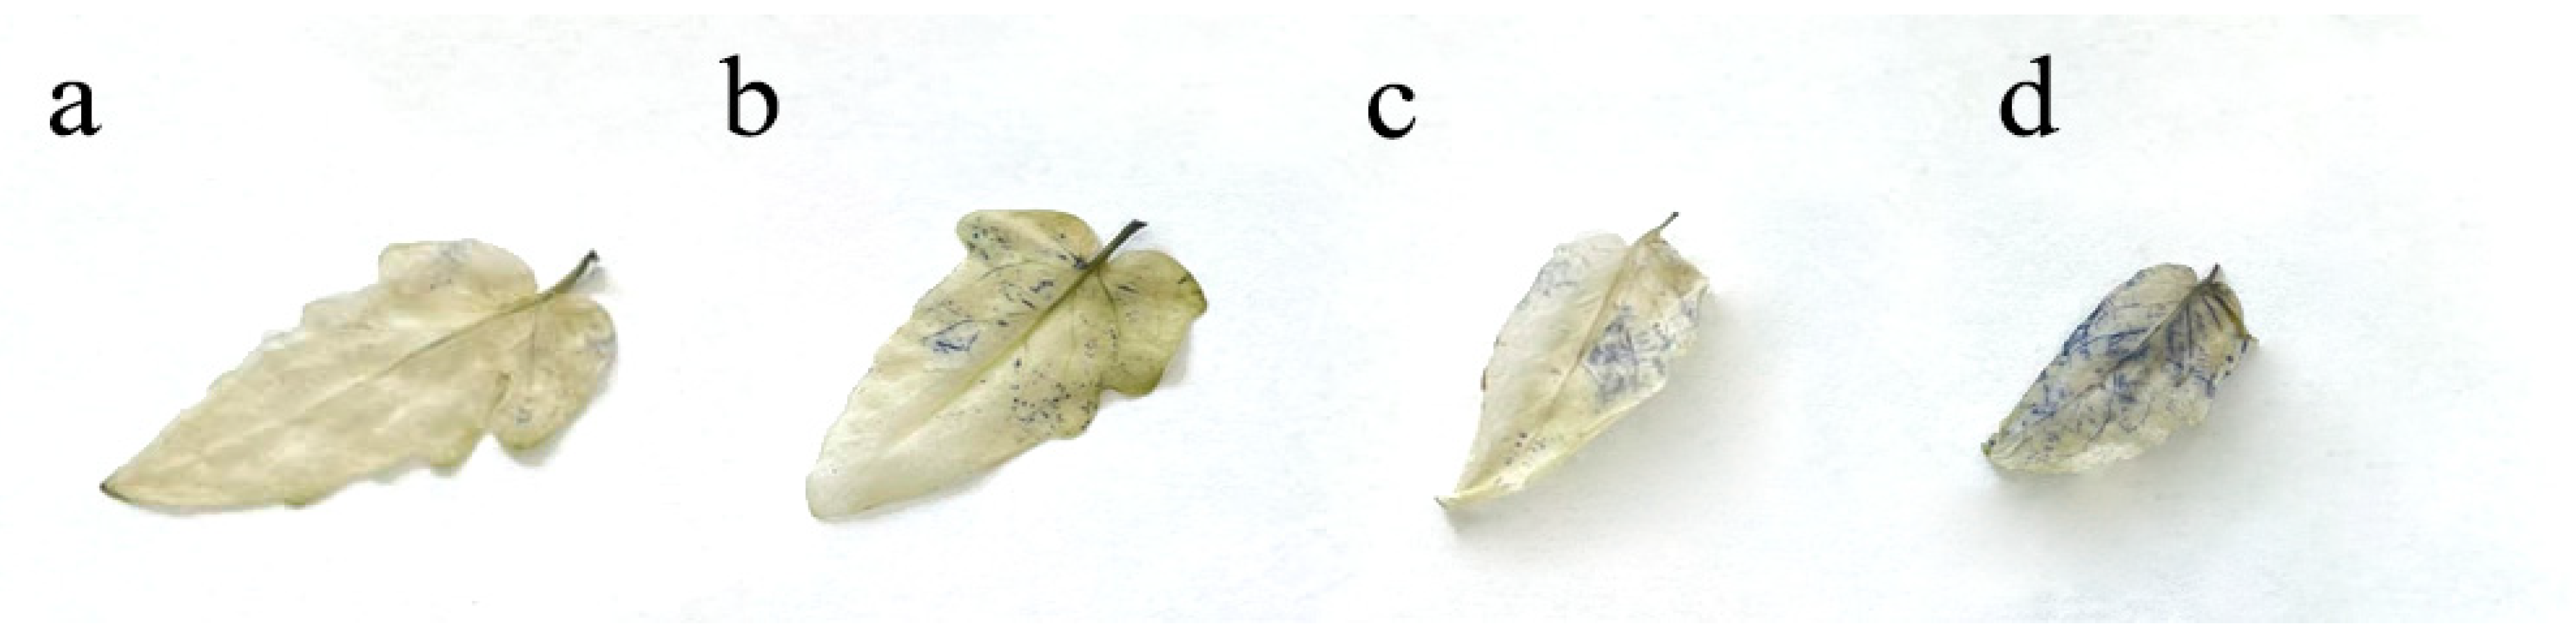
2.3. Assessment of Localization of Superoxide in Situ

The production of O2•– in the leaf blade of S. lycopersicum was determined on the basis of the formation of blue spots (Figure 3) resulting from the reaction of NBT with O2•–. This regularity in the accumulation of superoxide was also confirmed by an increase in the amount of SOD in plants (Figure 4a).

2.4. Enzymatic Activity in Plants of Model Experience

The dependence of the MDA content in the leaves and roots on the concentration of the introduced pollutant was established (Figure 1d). The mean content of MDA in the shoots of plants with the control treatment was 0.11 ± 0.003 and 0.19 ± 0.002 mM/g dry weight, respectively. The largest amount of MDA was recorded in the variant of the experiment 60 MPC BaP as 4.3 times. The concentration of MDA in the shoots was increased by 2.7 times in the variants of BaP 20 MAC, 3.5 times in BaP 40 MAC, and 5.1 times in BaP 60 MAC with respect to the control (Figure 1d). In the roots, a dose-dependent increase in MDA by 3.5, 4.2, and 6.2 times was also observed at 20, 40, and 60 MPC BaP, respectively (Figure 1d).
SOD activity was 10.7 ± 0.9 and 9.9 ± 0.8 U/min·mg protein was determined in the control samples. It was shown that the activity of SOD in the shoots of the studied samples increased by 1.4 times in the variant of 20 MPC BaP, 1.8—MPC BaP times, and 60 MPC BaP—2 times. In the roots, a similar trend was observed of 1.9, 2.3, and 2.4 in the variants of 20, 40, and 60 MPC BaP, respectively (Figure 4a).
In the control, the content of CAT averaged 4 ± 0.4 nM/mg protein in the shoots and 10.8 ± 0.7 nM/mg protein in the roots (Figure 4b). The activity of CAT in the aerial part decreased by 1.1, 1.3, and 1.8 times in the groups of 20, 40, and 60 MPC BaP, respectively. A similar picture was observed in the activity of CAT in the roots with a decrease of 1.3, 1.95, and 2.7 times in all groups.
The activity of ascorbate peroxidase in the control plant sample was 552.2 ± 9.6 and 663.6 ± 20.2 mM/mg protein in the shoots and roots was noted, respectively (Figure 4c). A significant increase in the activity of the enzyme in the roots by 5.8, 6.9, and 11.5 times was obtained in the experimental variants of 20, 40, and 60 MPC BaP, respectively. In the shoots, the difference was not so significant by 1.7, 2.1, and 3.9 times in the variants of 20, 40, and 60 MPC BaP, respectively.
The content of proline in the control S. lycopersicum was 3.3 ± 0.09 mM/g DW in the shoots and 2.1 ± 0.07 mM/g DW in the roots (Figure 4d). Proline in the shoots increased by 1.2, 2.1, and 2.6 times in all groups, and in the roots in variants of 20, 40, and 60 MPC BaP, by 4, 4.7, and 5.6 times, than in the control group, respectively (Figure 4d).
The average content of PRX in the shoots and roots was 2.6 ± 0.1 and 1.4 ± 0.06 (Figure 4e) f.o.p/mg, respectively, in the control variant of the experiment. In the experimental variants 20 MPC BaP, 40 MPC BaP, and 60 MPC pub, the activity of PRX increased 2.3, 3.9, and 5.25 times in the shoots, and 2.5, 2.7, and 3 times in the roots, respectively.
The activity of glutathione reductase was higher in the roots and shoots due to the presence of 20 MPC BaP, 40 MPC BaP, and 60 MPC BaP. In the control, the enzyme activity was 505.4 ± 54.4 and 423.2 ± 7.9 U/g (Figure 2f). The increase in GR activity was accompanied by a slight increase in the content of reduced glutathione in all pollution groups in the groups of 20 MPC BaP, 40 MPC BaP, and 60 MPC BaP, respectively. In the group of 20 MPC BaP, the increase in GR was 1.15 and 1.17 in the shoots and roots, respectively, while, as in the variants of the experiments of 40 and 60 MPC BaP, the increase in GR in the shoots was significant at 2.4 and 3.3 times, respectively. In the roots, in the experimental variants 40 and 60, the maximum concentration limit for BaP was 1.2 and 1.6 times, respectively.
The control values of GP were 45.7 ± 2.2 and 19.5 ± 0.5 (Figure 2g) U/g in shoots and roots, respectively. GP activity increased in the experimental variants 20 MPC BaP, 40 MPC BaP, and 60 MPC BaP by 3.8, 5.4, and 7 times in the shoots and in the roots by 3.2, 7.4, and 9.4 times, respectively.
The activity of glutathione-s-transferase (GST) in the control treatment was 170.2 ± 19 and 154 ± 27.5 U/g in the shoots and roots, respectively (Figure 2h). In the groups of 20 MPC BaP and 60 MPC BaP in the roots, a dose-dependent increase in GST by 3, 3.9, and 4.82 times was shown, respectively. When treated with 20, 40, and 60 MPCs of BaP, a similar increase in GST occurred in the aerial part by 2.4, 4.0, and 5.1 times, respectively.

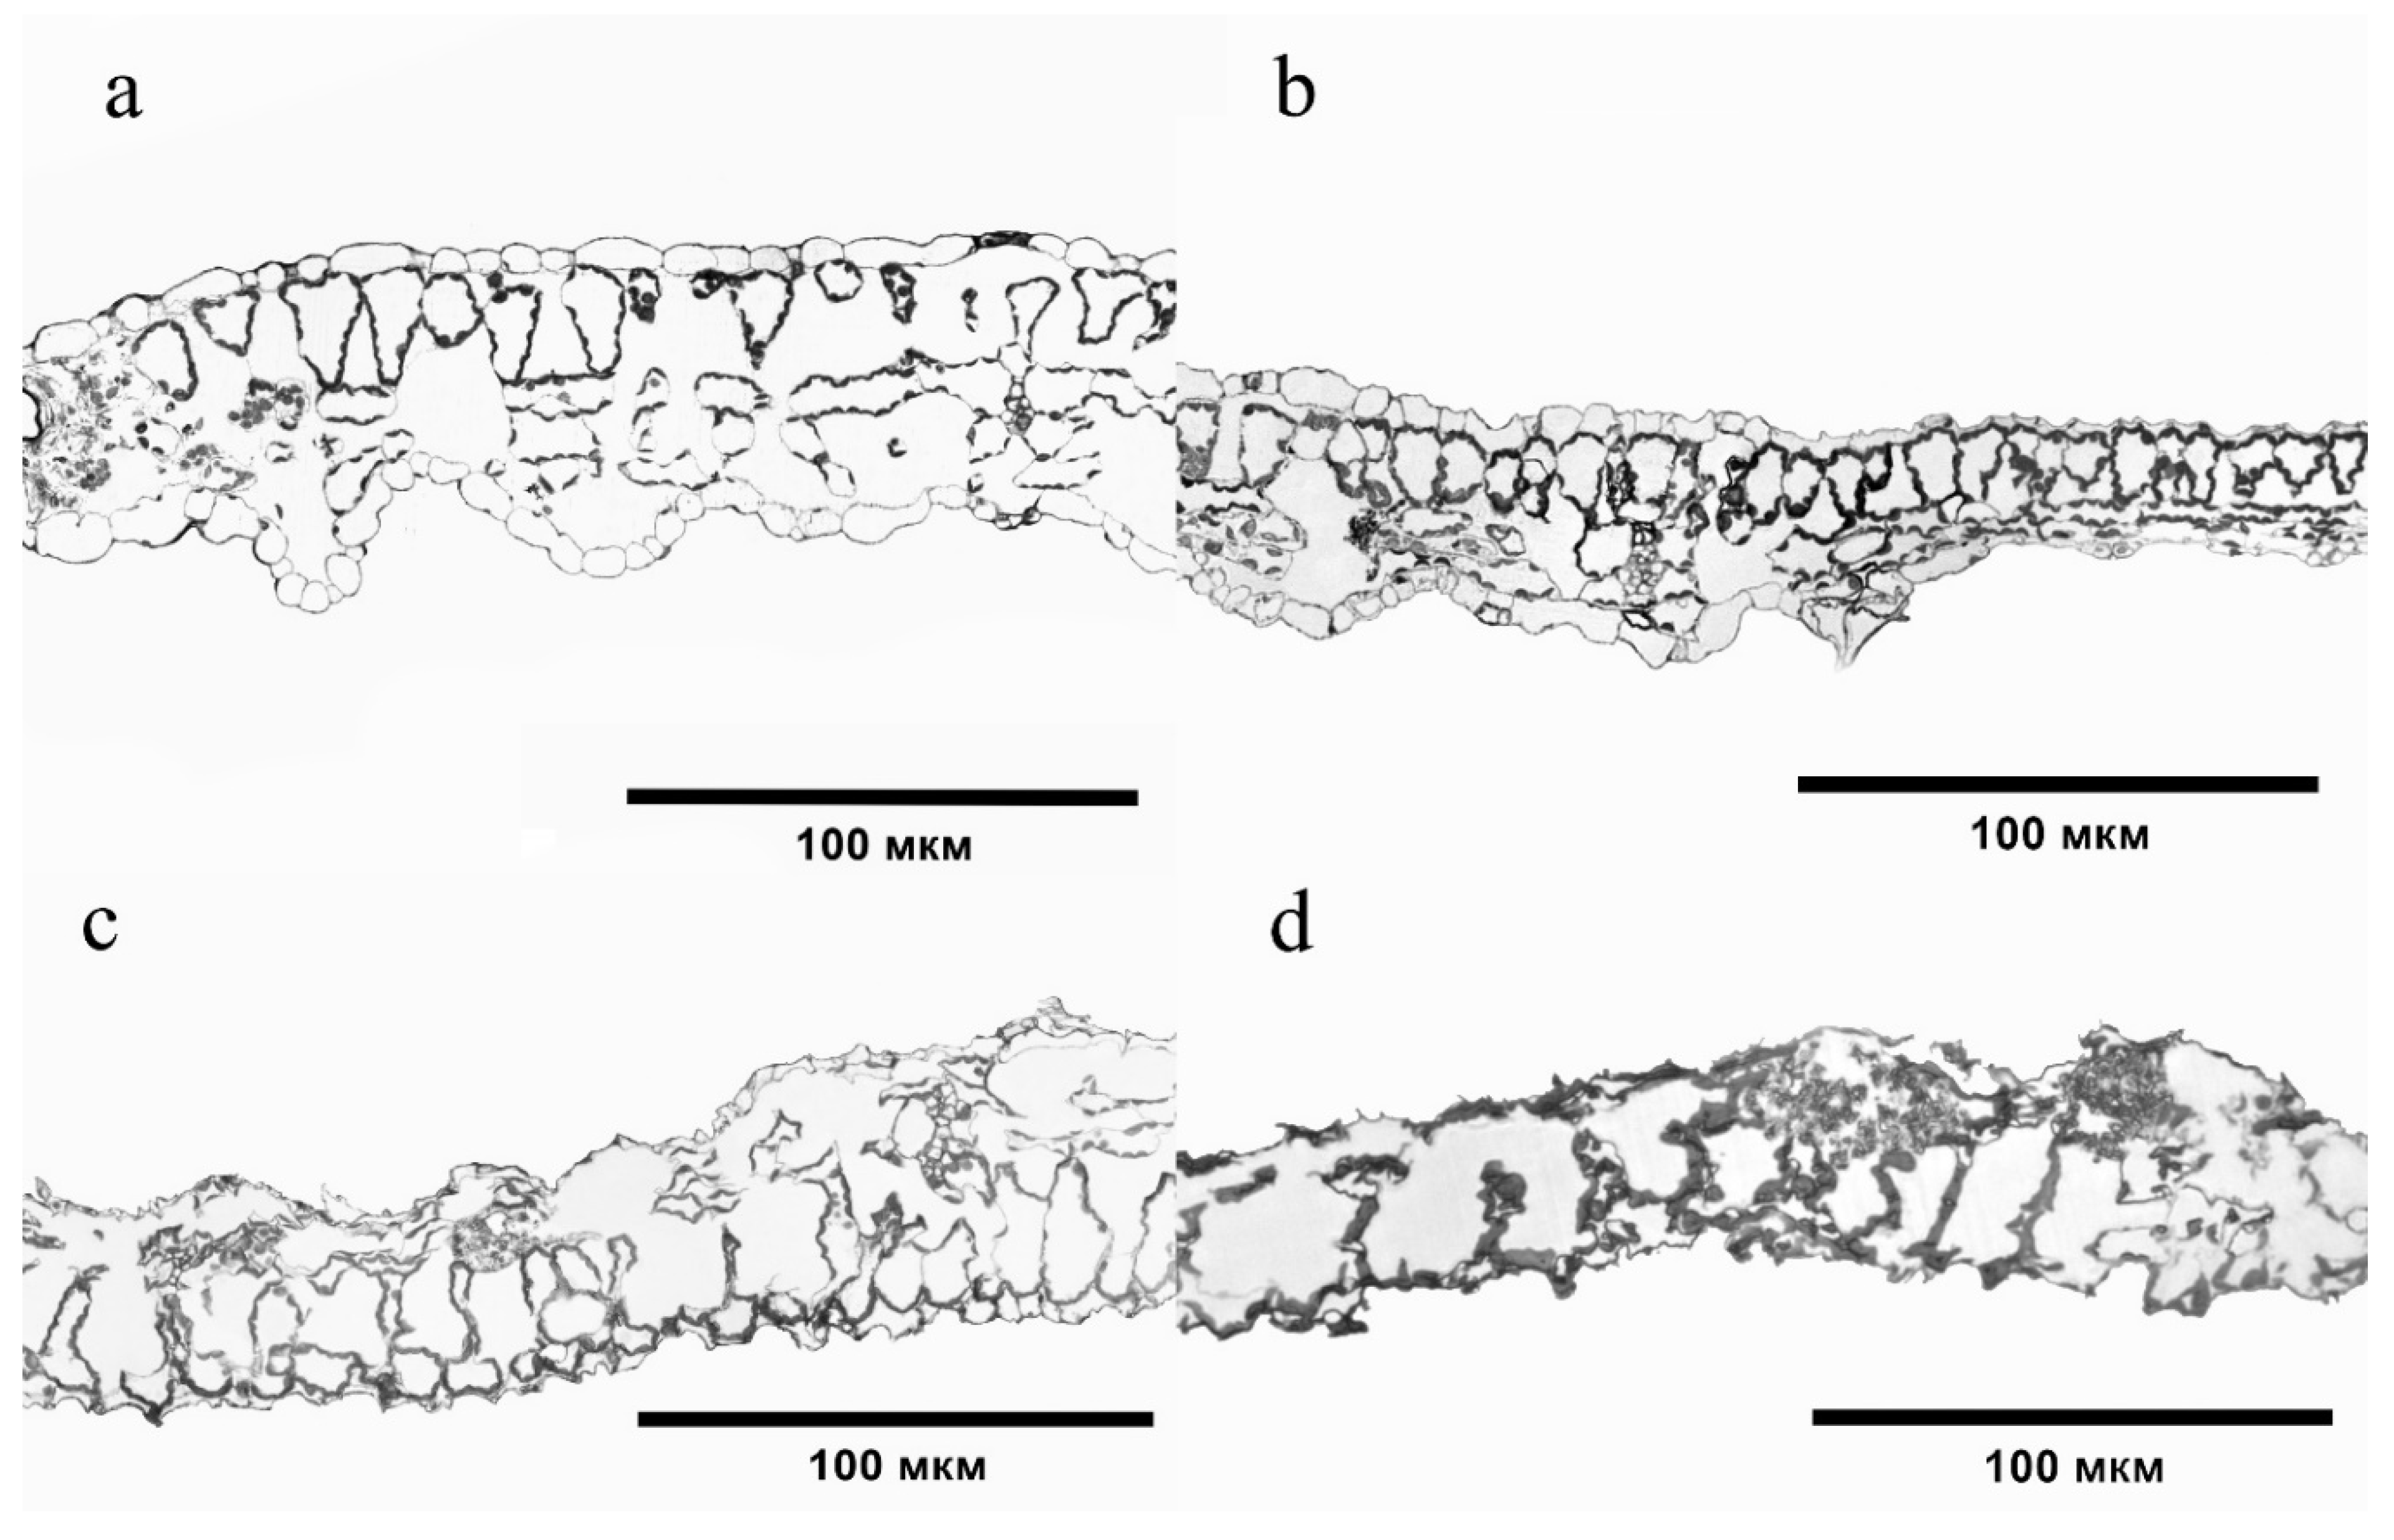
2.5. Microscopic Examination

The structure of the S. lycopersicum root tissues in the variants with BaP differed relative to the control (Figure 5). In variant 20 MPC, the crustal layer of the S. lycopersicum root had a smaller area and size of its cells (Figure 5b). The greatest degree of change was observed at the highest doses of soil contamination (Figure 5c,d). A loose epiblema was observed, the walls of most cells were not corky, the area of the cortical layer was reduced, and the intercellular space and cell size of cortical parenchyma, endodermis, and xylem vessels were increased (Figure 5b,c).
Changes were also observed in the structure of tissues of the S. lycopersicum leaf plate, which were especially pronounced when exposed to 40–60 MPC of BaP. The epidermis became thinner, its turgor and cell size decreased, the intercellular space increased, and the structural and spatial organization of the chlorenchyma cells changed (Figure 6).

3. Discussion

The introduction of BaP into the soils led to its accumulation in S. lycopersicum at concentrations from 17.0 ng/g in the control variant of the experiment to 599 ng/g at a contamination of 60 MAC of BaP and had a dose-dependent effect. The ability to bioaccumulate BaP in plants occurred even at doses from 1 MPC of BaP [14] and its intensity was closely related to the pollutant concentration in the soil and the biophilicity of the BaP molecules. It was also shown that an increase in the concentration of BaP in the soil indirectly provoked a change in the morphobiometric parameters of S. lycopersicum. Therefore, in addition to the inhibition of root growth and plant height, a change in the shape of the leaf blade, shortening of the central vein, and twisting toward the adaxial side of the leaf, starting at 20 MPC BaP and progressing in each subsequent variant of the experiment, was noted. Changes in the generative organs of plants were observed in all variants of the experiment, however, in the variants of the experiment with 40 MPC of BaP, the vegetation stopped at the flowering stage, and at 60 MPC, the vegetation stopped in the active growth phase.
High levels of BaP accumulation provoke a toxic load in the cell wall and plant cell components, activating the processes of reactive oxygen species (ROS) overproduction. The high reactivity of ROS with proteins, lipids, carbohydrates, and nucleic acids causes not only a change in the morphobiological parameters, but also violated the redox homeostasis of plants. It has been found that the amount of chlorophyll pigments is also related to the physiology of stress. In response to an increase in ROS caused by the influence of BaP, a dose-dependent increase in the concentration of carotenoids occurred [15]. In the present study, the decrease in total chlorophyll did not have a clear pattern, but general trends were observed toward a decrease in the level of photosynthetic activity due to the accumulation of ROS products in the chloroplasts [16]. A distinctive feature of S. lycopersicum in the framework of the model study was a sharp decrease in the concentration of chlorophyll a in the experiment variant of 60 MPC of BaP, and 40 and 20 MPC of BaP each, which may indicate an excess of singlet oxygen or hydrogen peroxide. The removal of ROS in plants occurs not only through enzymatic, but non-enzymatic detoxification pathways, which include carotenoids [17]. The main function of carotenoids under BaP stress is to level the toxic effect of 1O2 on the photosynthetic apparatus of S. lycopersicum.
The accumulation of BaP caused an increase in the concentration of ROS by-products such as low molecular weight aldehyde—MDA. An increase in the amount of MDA can be used to judge the intensity of lipid peroxidation. The most pronounced biochemical is observed in the roots. BaP leads to damage to the cell membrane through the oxidation of the lipid structures of the membrane and the functional inactivation of various proteins. Due to an increase in the number of oxidized forms of various cell compounds, apoptosis occurs [18,19,20,21].
It was shown that due to the violation of the redox homeostasis of the cell, there was an increase in the concentration of O2•–, which was confirmed by histochemical staining of the leaves of S. lycopersicum. A significant increase in formazan blue spots was observed depending on the concentration of BaP in the plant tissues. An increase in the amount of ROS stimulated the overproduction of antioxidant enzymes, which was strongly associated with the presence of BaP. The balance of AS during the accumulation of BaP in the organs of S. lycopersicum shifted toward an increase in SOD activity in plants treated with different doses of BaP. The increase in PRX and APOX activity also correlated with the dose of the applied pollutant in all variants of the experiment [19]. A sharp increase in PRX and APOX may be associated with a sharp decrease in the activity level of CAT, which decomposes H2O2 to oxygen and water [22]. This may be due to the primary intense response of CAT to the pollutant in the germination and tillering phase, however, at later growth phases, the dominant enzymes that decompose hydrogen peroxide change [23]. Thus, the most pronounced response associated with H2O2 was recorded in the roots, which was confirmed by the accumulation of APOX in these parts of the plant, which is responsible for the buffer component of AS.
The results showed that the antioxidant response of APOX during the accumulation of BaP in plants is closely related to the activity of other enzymes of the AsA–GSH cycle, which plays an important role in the elimination of H2O2 under conditions of the excess growth of BaP. The total accumulation of APOX and PRX in S. lycopersicum explains the effective buffering of H2O2, reducing the toxic effect of ROS in all experimental variants [24].
The increases in GR, GST, and GP activity were the most significant compared to other enzymes, suggesting their dominant role in mitigating the BaP stress in S. lycopersicum [3,25]. This pattern of the accumulation of glutathione cycle enzymes in the aerial part of the plant indicates the activation of antioxidants in the aerial part of the plant [22,26], even though ROS products are mainly accumulated in the roots [27]. The amount of GSH increased in all variants of the experiment with soil contamination with BaP. It has been established that with an increase in the concentration of GSH, there is an increase in the activity of the enzymes of the glutathione cycle due to the acceptor function of GSH [28]. An increase in GST activity has a positive correlation with the accumulation of ROS and H2O2 in S. lycopersicum [28]. It has been established that with an increase in the GSH concentration, the GST activity also increases and has a positive correlation with the accumulation of ROS and H2O2 in S. lycopersicum. The data obtained correlated with the regularities revealed in Z. mays grown on oil-contaminated soil. The culture showed an increase in the number of transcripts encoding GST activity [29].
The greatest degree of change was observed at the highest dose of soil contamination. The epidermis became thinner, its turgor and cell size decreased, the intercellular space increased, and the structural and spatial organization of chlorenchyma cells changed (Figure 6). The reaction of plants to any environmental stress factor is species-specific. However, there are also similar changes in the structures of tissues of different species growing in PAH-contaminated soil. Thus, under the action of BaP in Hordeum sativum, degradation of the integumentary tissue of the roots and disturbance of the ordered arrangement of reduced cells of the primary cortex were observed [6]. Destruction of the epidermis and an increase in the size of the cortical cells with subsequent disruption of the originally concentric arrangement was found in Pisum sativum and Z. mays with the accumulation of polyarenes [30]. The same anatomical changes in the S. lycopersicum leaf structure were observed[31]. These structural changes may be the result of the disruption of transport processes or changes in the osmotic properties of cells induced by PAH toxicity [17].
It has been established that PAHs accumulate in the cell walls of root hairs at the first stages of contact with a pollutant and are then distributed inside the cells and organelles [31]. This is evidenced by changes at the cellular level. The reaction of plants to any environmental stress factor is species-specific. However, there are also similar changes in the tissue structures of different plant species growing in PAH-contaminated soil. Thus, under the action of BaP in H. sativum, degradation of the integumentary tissue of the roots and disturbance of the ordered arrangement of reduced cells of the primary cortex were observed [32]. Destruction of the epidermis and an increase in the size of the cortical cells with subsequent disruption of originally concentric arrangement was found in Pisum sativum and Z. mays with the accumulation of polyarenes [33]. The same anatomical changes in the tomato leaf structure were observed by Gratão [34]. These structural changes may be the result of the disruption of transport processes or changes in the osmotic properties of cells caused by PAH toxicity [33]. BaP significantly inhibited CAT activity, induced the ASC–GSH cycle, and some other markers of oxidative stress. Oxidative stress markers can reflect not only the toxic effect of BaP on the physiological and biochemical parameters of plants, but can also be used to prevent the toxic effect and possible remediation pathways at early stages.

4. Materials and Methods

4.1. Experimental Setup and Plant Growth Conditions

A model experiment was designed to reveal the toxic effect of BaP. The experiment was carried out in a climatic chamber while maintaining optimal lighting and humidity conditions. The soil for the model experiment was selected from a virgin area of the Persianovskaya Zapovednaya Steppe State Soil Sanctuary in the Rostov Region, Russia, located far from sources of anthropogenic load. In the model experiment, the top layer of 0–20 cm Haplic [35] was used on loess-like loams with the content of clay of 47.1%, dust of 26.8%, Corg of 3.7%, pH of 7.5, CaCO3 was 0.3%, and the cation exchange capacity was 37.1 mM (+)/100 g.
To implement a model experiment, the cleaned soil from the plant residues was sieved through a 2 mm diameter sieve, then placed in 5-L pots. BaP (99%, analytical grade, Sigma-Aldrich, Burlington, MA, United States) was introduced into the soil used in the model experiment. For the purity of the experiment, the pollutant was applied to the soil surface, simulating the natural intake. BaP was added in an acetonitrile solution. The soil was regularly moistened to a level of 60% of the total water capacity for better interaction of the soil with the BaP introduced into it and to create optimal growth conditions. The experimental scheme included a control variant with uncontaminated soil as well as the experimental variants artificially contaminated with BaP, in the amount of 400 ng/g—20 MPC, 800 ng/g—40 MPC, and 1200 ng/g—60 MPC [36]. The test culture was sown four months after the start of incubation.
A tomato (Solanum lycopersicum L.), an early-ripening variety “Bely naliv” 241 zoned in the south of Russia, was chosen as a test-culture. The number of plants in one pot was three plants. Sowing of seeds was carried out in vegetation pots. In the tillering phase, the plants were thinned out. Experiments were laid in 3-fold repetition. For the entire duration of the experiment, the temperature was maintained at +20–22 °C, natural light, and humidity in the soil, corresponding to the lowest field capacity. Sampling was carried out in the phase of full ripeness.

4.2. Measurement of Morphometric Parameters

Plants were taken from the soil and the nonradiometric parameters were measured in the phase of full ripeness: the length of the roots and leaves, plant and stem height, and productivity. For further studies, the plants were dried in air, the roots were removed from the aerial part, and ground with a mortar and pestle to a powdery consistency.

4.3. BaP Content in Plants Tissues

Determination of BaP in the plants was carried out by high performance liquid chromatography (HPLC). Sample preparation included the dissolution of the lipid fraction with a 2% solution of NaOH in alcohol, then the samples were extracted with hexane [37]. A round-bottom flask with the extract was placed in a rotary evaporator for further evaporation. After cooling, the precipitate formed during evaporation was dissolved in 1 mL of acetonitrile. Measurements were made on an Agilent 1260 liquid chromatograph with fluorometric detection (FL-3000, Santa Clara, USA), no later than three days after transferring the BaP concentrate into a vial (ISO 13877-2005 2005). The liquid phase was a mixture of acetonitrile (75%) and water (25%) with a flow rate of 0.5 mL/m. The BaP peak was recorded at λ = 409 nm.

4.4. Determination of Chlorophyll a,b, Total Chlorophyll, and Carotenoids

Freshly collected plant samples were taken to determine the chlorophyll a, b, total chlorophyll, and carotenoids. The sample was homogenized in 10 mL of 80% acetone. Samples were incubated at 4 °C in a dark place for 12 h. The filtrate was analyzed in a spectrophotometer at λ = 663 nm, λ = 645 nm, and λ = 470 nm (mg/g−1 dry weight (DW)). The calculation was carried out according to Equations (1) and (2) [37].
Chlorophyll a = (12.21 × A663) − (2.81 × A645)
Chlorophyll b = (20.13 × A645) − (5.03 × A663)
Total chlorophyll = 17.32 × A645 + 7.18 × A663
Carotenoids   ( x   +   c ) = 1000 A 470 3.27 ChlA 104 ChlB 229

4.5. Localization of Superoxide in Situ

The determination of the intensity of superoxide production was carried out according to the Tewari method [38]. Leaves was placed with a solution of 25 mM 4-(2-hydroxyethyl)-1-piperazineethanesulfonic acid (HEPES, Merck, Darmstadt, Germany) buffer (pH 7.6) and 0.1 mg/mL-1 nitro blue tetrazolium (NBT, Thermo Fisher Scientific Inc., Waltham, MA, USA), incubated at 25 °C in a dark place for 2 h. Then, the sample was washed with 80% (v/v) ethanol heated to 70 °C for 10 min and placed in a solution containing lactic acid, phenol, and water (1:1:1).

4.6. Determination of Lipid Peroxidation

By measuring the content of malonic dialdehyde (MDA) in plant samples, the level of lipid peroxidation was determined. The definition is based on the reaction of MDA with thiobarbituric acid (TBA, Merck, Darmstadt, Germany) [39]. Measurements were made in a spectrophotometer at λ = 532 nm and λ = 600 nm, corrected for non-specific absorption [40]. The MDA content was expressed in μM/g DW and was calculated from its molar extinction coefficient of 155 mM−1cm−1.

4.7. Plant Sample Preparation to Determine the Activity of Antioxidant Enzymes and Total Protein

Samples of the roots and shoots in the amount of 100–500 mg were homogenized in liquid nitrogen. Homogenized plants were centrifuged at 12,000× g for 15 min at 4 °C. Using the obtained extract, the widespread activity of antioxidant enzymes was detected. The measurements were carried out on a spectrophotometer DU 800 (Beckman Coulter, Brea, CA, USA). All used reagents were purchased from Sigma-Aldrich, Burlington, MA, USA.

4.7.1. Protein Definition

A sample of 0.1 mL of the extract obtained from the enzyme activity assays was placed in a test tube and 5 mL of Bradford’s [41] reagent was added, mixed, and left at room temperature for 20 min. Optical density was measured in a spectrophotometer λ = 595 nm. As a reference solution, instead of the sample, we used the same amount of buffer or extracting solution. The amount of protein was expressed in µg/mL.

4.7.2. Determination of Proline (L: 210-189-3)

A total of 0.1 g of root tissue was homogenized with 4 mL dH2O, extracted at 100 °C for 10 min, and then the leaf volume was adjusted to 5 mL. The reaction mixture consisted of 750 µL of extract, 750 µL of acetic acid, and 750 µL of ninhydrin reagent. Next, incubation was carried out at 100 °C for 20 min [8,42]. The color intensity of the solution was measured with a spectrophotometer λ = 520 nm. The results of the analysis are expressed as U/mg of protein.

4.7.3. Determination of Superoxide Dismutase Activity (EC 1.15.1.1)

Superoxide dismutase (SOD) was observed by the inhibition of the reduction reaction of nitro blue tetrazolium (NBT) during the oxidation of adrenaline to adenochrome at pH >7.0 under O2•– production conditions [43]. The reaction mixture contained 1 mg polyvinylpyrrolidone (PVP), 6.11 mM HBT, 0.5 mM phenylmethylsulfonyl fluoride (PMSF), mM sodium phosphate buffer (pH 7.4), and 1 mM 1,4-dithiothreitol. The measurements were performed at a λ = 540 nm. Enzyme activity was expressed in U/mg protein × min.

4.7.4. Determination of Catalase Activity (EC 1.11.1.6)

Catalase activity was determined [41] as the amount of H2O2 that did not decompose after incubation with catalase by registering the colored reaction product of the interaction of H2O2 with ammonium molybdate. The color intensity of the solution was measured with a spectrophotometer λ = 410 nm. The reaction mixture contained ammonium molybdate, 0.03% H2O2. Enzyme activity was expressed in nM/mg protein.

4.7.5. Determination of Glutathione Reductase Activity (EC 1.8.1.7)

Glutathione reductase was determined by the reduction of oxidized glutathione with the participation of nicotinamide adenine dinucleotide phosphate (NADPH) [44]. The reaction mixture (pH = 8) contained tris(hydroxymethyl) aminomethane (Tris), Na-EDTA, supernatant, and 0.4% NADPH solution. The color intensity of the solution was measured with a spectrophotometer at λ = 340 nm. The outcome was expressed in U/g protein.

4.7.6. Determination of Glutathione Peroxidase Activity (EC 1.11.1.9)

The activity of glutathione peroxidase was assessed by the content of GSH in the samples before and after incubation with the substrate during the color reaction with 5,5’-dithiobis-2-nitrobenzoic acid (DTNBA) [45]. The reaction mixture consisted of 0.73 mL 0.1 M Tris (pH 8.5), Na-EDTA, 100 mM PMSF, 0.2 mL extract, 0.07 mL HTB, and 0.2 mL 20% TCA. Enzyme activity was measured in U/g protein.

4.7.7. Determination of Ascorbate Peroxidase Activity (EC 1.11.1.11)

Ascorbate peroxidase (APOX) was noted by the decomposition reaction of H2O2 APOX with the reaction products in the form of H2O and dehydroascorbate [46] in the studied samples. The reaction mixture contained K, Na-phosphate buffer (pH 7.0), 17 mM ascorbic acid, 100 mM PMSF, PVP, extract, and 0.06% H2O2. The measurements were carried out at λ = 290 nm for 3 min. The results were expressed mM/mg protein.

4.7.8. Determination of Total Peroxidase Activity (EC 1.11.1)

The peroxidase activity (PRX) of extracellular peroxidases was determined calorimetrically [46]. The reaction mixture contained 0.2 M Na-acetate buffer, 0.01% benzidine hydrochloride, supernatant, and 0.3% H2O2. The color intensity of the solution was measured at λ = 600 nm. PRX was expressed in U/mg protein.

4.7.9. Glutathione-S-Transferase (EC2.5.1.18)

The activity of glutathione-s-transferase was analyzed by the reaction of reduced glutathione (GSH) and 1-chloro-2,4-dinitrobenzene (CDNB) with the formation of glutathione-S-conjugates [30]. The reaction mixture contained 0.1 K-phosphate buffer (pH = 6.5), 0.015 M GSH and the supernatant. The reaction was initiated with 0.015 M 1-chloro-2,4-dinitrobezol. Detection was performed at λ = 340 nm. Enzyme activity was measured in U/g protein.

4.7.10. Definition of Glutathione

The content of total glutathione in the samples was estimated during the color reaction during the formation of a complex of 5,5′-dithiobis-2-nitrobenzoic acid (DTNBA) and GSH. To evaluate the content of GSSG, 2-vinylpyridine was used, which binds to GSH [46]. The reaction mixture consisted of 0.18% Na-EDTA in 0.5 M sodium phosphate buffer, 0.16% NADPH, and 0.12% 5,5-dithiobis (2-nitrobenzoic acid), extract, and glutathione reductase. The results of changing the optical density of the solution were measured spectrophotometrically at λ = 412 nm. Enzyme activity was measured in μ/mg protein.

4.8. Light Microscopy

Histopathological evaluation was performed on tissue from the central part of the leaf (2 × 2 mm) and in the zone of root hairs (2 mm). The preparation of the histological specimens consisted of the following stages: plant tissue sampling, fixing, dehydration, embedding with polymerization of the prepared blocks, sectioning, and staining with toluidine blue [6]. Evaluation of the histological slides was performed using a Mikmed-6 microscope.

4.9. Statistical Analysis

Microsoft Excel 2016 and SPSS-13 (IBM SPSS Statistics 23) programs were used for data processing and statistical analysis. The coefficient of variation was <10%. Reliability of differences between the values of the frequency of occurrence was p < 0.05. The whiskers on the columns in the figures indicate the standard deviation level.

5. Conclusions

The toxic effect of BaP manifested itself from 20 MPC, and increased with the dose of the applied pollutant. The results demonstrate the effect of BaP on all morphophysiological, structural, and biochemical parameters of the test culture. A decrease in photosynthetic activity and a violation of the redox homeostasis of S. lycopersicum associated with oxidative stress were diagnosed: accumulation of ROS and their by-products, and the overproduction of antioxidant enzymes in all variants of the experiment. Despite a number of general trends in the response to stress caused by BaP, a significant difference was found in the nature of oxidative stress and a change in the dominant pathways of H2O2 detoxification from CAT to ASC-GSH and PRX. Thus, BaP toxicity is based on enzymatic toxicity, membranotropic action, and oxidative stress. Further studies will provide the most complete information regarding the most relevant markers of oxidative stress for PAHs, monitoring the impact of BaP in the long-term.

Author Contributions

Methodology, M.V. (Marina Voloshina), V.D.R., N.C., T.M., E.V., M.V. (Mark Voloshin), M.K., T.D. and A.P.; Software, M.V. (Marina Voloshina), N.C. and S.S.; Validation, M.V. (Marina Voloshina), E.V., S.M., M.K. and S.S.; Formal analysis, E.V., S.M., M.V. (Mark Voloshin) and M.K.; Investigation, M.V. (Mark Voloshin) and T.D.; Resources, V.D.R., N.C., S.M. and M.V. (Mark Voloshin); Data curation, M.V. (Marina Voloshina), S.M., T.D. and S.S.; Writing—original draft, V.D.R., N.C., S.M., S.S. and A.P.; Writing—review & editing, V.D.R., T.M., T.D. and S.S.; Visualization, E.V.; Supervision, T.M.; Project administration, M.V. (Marina Voloshina), N.C. and T.M.; Funding acquisition, T.M. All authors have read and agreed to the published version of the manuscript.

Funding

The study was carried out in the Soil Health laboratory of the Southern Federal University with the financial support of the Ministry of Science and Higher Education of the Russian Federation (Agreement No. 075-15-2022-1122) and the Strategic Academic Leadership Program of the Southern Federal University (“Priority 2030”).

Institutional Review Board Statement

Not applicable.

Informed Consent Statement

Not applicable.

Data Availability Statement

Not applicable.

Conflicts of Interest

The authors declare no conflict of interest.

Abbreviations

BaPBenzo[a]pyrene
MPCMaximum permissible concentration
CATCatalase
SODSuperoxide dismutase
MDAMalonic dialdehyde
PRXPeroxidase
APOXAscorbate peroxidase
GPGlutathione peroxidase
PAHsPolycyclic aromatic hydrocarbons
GSHGluthatione
ASAntioxidant system
HPLCHigh performance liquid chromatography
HEPES4-(2-Hydroxyethyl)-1-piperazineethanesulfonic acid
NBTNitro blue tetrazolium
TBAThiobarbituric acid
DWDry weight
PVPPolyvinylpyrrolidone
PMSFPhenylmethylsulfonyl fluoride
NADPHNicotinamide adenine dinucleotide phosphate
TrisTris (hydroxymethyl) aminomethane
CDNB1-Chloro-2,4-dinitrobenzene
GSTGlutathione-S-transferase

References

  1. Selvi, S.; Polat, R.; Çakilcioğlu, U.; Celep, F.; Dirmenci, T.; Ertuğ, Z.F. An ethnobotanical review on medicinal plants of the Lamiaceae family in Turkey. Turk. J. Bot. 2022, 46, 283–332. [Google Scholar] [CrossRef]
  2. Sushkova, S.N.; Vasilyeva, G.K.; Minkina, T.M.; Mandzhieva, S.S.; Tjurina, I.G.; Kolesnikov, S.I.; Askin, T. New method for benzo [a] pyrene analysis in plant material using subcritical water extraction. J. Geochem. Explor. 2014, 144, 267–272. [Google Scholar] [CrossRef]
  3. GN 2.1.5.689-98; Maximum Allowable Concentrations (MPC) of Chemicals in the Water of Drinking, Cultural and Social Waters. State Committee for Sanitary and Epidemiological Supervision and Ministry of Health of Russian Federation: Moscow, Russia, 1998; 35p.
  4. Sushkova, S.; Minkina, T.; Mandzhieva, S.; Zamulina, I.; Bauer, T.; Vasilyeva, G.; Antonenko, E.; Rajput, V.; Kızılkaya, R. Features of accumulation, migration, and transformation of benzo [a] pyrene in soil-plant system in a model condition of soil contamination. J. Soils Sediments 2018, 18, 2361–2367. [Google Scholar] [CrossRef]
  5. Abdel-Shafy, H.I.; Mansour, M.S. A review on polycyclic aromatic hydrocarbons: Source, environmental impact, effect on human health and remediation. Egypt. J. Pet. 2016, 25, 107–123. [Google Scholar] [CrossRef]
  6. Fedorenko, G.M.; Fedorenko, A.G.; Minkina, T.M.; Mandzhieva, S.S.; Rajput, V.D.; Usatov, A.V.; Sushkova, S.N. Method for hydrophytic plant sample preparation for light and electron microscopy (studies on Phragmites australis Cav.). MethodsX 2018, 5, 1213–1220. [Google Scholar] [CrossRef]
  7. González, A.; Espinoza, D.; Vidal, C.; Moenne, A. Benzopyrene induces oxidative stress and increases expression and activities of antioxidant enzymes, and CYP450 and GST metabolizing enzymes in Ulva lactuca (Chlorophyta). Planta 2020, 6, 1–13. [Google Scholar] [CrossRef]
  8. Belz, R.G.; Sinkkonen, A. Low toxin doses change plant size distribution in dense populations–Glyphosate exposed Hordeum vulgare as a greenhouse case study. Environ. Int. 2019, 132, 105072. [Google Scholar] [CrossRef]
  9. Lai, R.W.; Yeung, K.W.Y.; Yung, M.M.N.; Djurišić, A.B.; Giesy, J.P.; Leung, K.M.Y. Regulation of engineered nanomaterials: Current challenges insights and future directions. Environ. Sci. Pollut. Res. 2018, 25, 3060–3077. [Google Scholar] [CrossRef]
  10. Sam, S.M. Biochemical and physiological response of Abelmoschus esculentus (L.) moench to food industry processing effluent. J. Appl. Sci. Environ. Manag. 2022, 26, 517–527. [Google Scholar] [CrossRef]
  11. Amin, M.A.; Ahmad, U.B.; Aliyu, A.M.; Adam, I.A.; Aliyu, R.W. Growth and yield response of tomato to different soil amendment techniques under different water Stress. South Asian Res. J. Agri. Fish 2023, 5, 1–9. [Google Scholar] [CrossRef]
  12. Gerszberg, A.; Hnatuszko-Konka, K.; Kowalczyk, T.; Kononowicz, A.K. Tomato (Solanum lycopersicum L.) in the service of biotechnology. Plant Cell Tissue Organ Cult. 2015, 120, 881–902. [Google Scholar] [CrossRef]
  13. Paduchuri, P.; Gohokar, S.; Thamke, B.; Subhas, M. Transgenic tomatoes-a review. Int. J. Adv. Biotechnol. Res. 2010, 1, 69–72. [Google Scholar]
  14. Tarigholizadeh, S.; Motafakkerazad, R.; Salehi-Lisar, S.Y.; Kazemi, E.M. High resistance of Panicum miliaceum L. to phenanthrene toxicity based on growth response and antioxidant system assessment. Acta Agric. Slov. 2021, 117, 1–13. [Google Scholar] [CrossRef]
  15. Fedorenko, A.G.; Chernikova, N.P.; Minkina, T.M.; Sushkova, S.N.; Dudnikova, T.S.; Antonenko, E.M.; Fedorenko, G.M.; Bauer, T.V.; Mandzhieva, S.S. Effects of benzo[a]pyrene toxicity on morphology and ultrastructure of Hordeum sativum. Environ. Geochem. Health 2021, 43, 1551–1562. [Google Scholar] [CrossRef]
  16. Daresta, B.E.; Italiano, F.; de Gennaro, G.; Trotta, M.; Tutino, M.; Veronico, P. Atmospheric particulate matter (PM) effect on the growth of Solanum lycopersicum cv. Roma plants. Chemosphere 2015, 119, 37–42. [Google Scholar] [CrossRef]
  17. Kummerová, M.; Barták, M.; Dubová, J.; Tříska, J.; Zubrová, E.; Zezulka, Š. Inhibitory effect of fluoranthene on photosynthetic processes in lichens detected by chlorophyll fluorescence. Ecotoxicology 2006, 15, 121–131. [Google Scholar] [CrossRef]
  18. Sharma, P.; Jha, A.B.; Dubey, R.S.; Pessarakli, M. Reactive oxygen species, oxidative damage, and antioxidative defense mechanism in plants under stressful conditions. J. Bot. 2012, 2012, 217037. [Google Scholar] [CrossRef]
  19. Abbas, S.K.; Hassan, H.A.; Asif, J.; Ahmed, B.; Haider, S.S. Integration of TTF, UTAUT, and ITM for mobile Banking Adoption. Int. J. Adv. Eng. Manag. Sci. 2018, 4, 5. [Google Scholar] [CrossRef]
  20. Lushchak, V.I. Contaminant-induced oxidative stress in fish: A mechanistic approach. Fish Physiol. Biochem. 2016, 42, 711–747. [Google Scholar] [CrossRef]
  21. Naveed, M.; Bukhari, S.S.; Mustafa, A.; Ditta, A.; Alamri, S.; El-Esawi, M.A.; Rafique, M.; Ashraf, S.; Siddiqui, M.H. Mitigation of nickel toxicity and growth promotion in sesame through the application of a bacterial endophyte and zeolite in nickel contaminated soil. Int. J. Environ. Res. Public Health 2020, 17, 8859. [Google Scholar] [CrossRef]
  22. Naveed, M.; Mustafa, A.; Azhar, S.Q.; Kamran, M.; Zahir, Z.A.; Unez-Delgado, A.N. Burkholderia phytofirmans PsJN and tree twigs derived biochar together retrieved Pb-induced growth, physiological and biochemical disturbances by minimizing its uptake and translocation in mung bean (Vigna radiata L.). J. Environ. Manag. 2020, 257, 109974. [Google Scholar] [CrossRef] [PubMed]
  23. Ahammed, G.J.; Yuan, H.L.; Ogweno, J.O.; Zhou, Y.H.; Xia, X.J.; Mao, W.H.; Shi, K.; Yu, J.Q. Brassinosteroid alleviates phenanthrene and pyrene phytotoxicity by increasing detoxification activity and photosynthesis in tomato. Chemosphere 2012, 86, 546–555. [Google Scholar] [CrossRef] [PubMed]
  24. Zhang, Q.; Zhu, L.; Wang, J.; Xie, H.; Wang, J.; Han, Y.; Yang, J. Oxidative stress and lipid peroxidation in the earthworm Eisenia fetida induced by low doses of fomesafen. Environ. Sci. Pollut. Res. 2013, 20, 201–208. [Google Scholar] [CrossRef] [PubMed]
  25. Wang, R.; Paul, V.J.; Luesch, H. Seaweed extracts and unsaturated fatty acid constituents from the green alga Ulva lactuca as activators of the cytoprotective Nrf2–ARE pathway. Free Radic. Biol. Med. 2013, 57, 141–153. [Google Scholar] [CrossRef] [PubMed]
  26. Wang, W. The effect of storage condition and duration on the deterioration of primed rice seeds. Front. Plant Sci. 2018, 9, 172. [Google Scholar] [CrossRef]
  27. Shen, Q.; Yu, J.; Fu, L.; Wu, L.; Dai, F.; Jiang, L.; Wu, D.; Zhang, G. Ionomic, metabolomic and proteomic analyses reveal molecular mechanisms of root adaption to salt stress in Tibetan wild barley. Plant Physiol. Biochem. 2018, 123, 319–330. [Google Scholar] [CrossRef]
  28. Liu, H.; Weisman, D.; Ye, Y.B.; Cui, B.; Huang, Y.H.; Colón-Carmona, A.; Wang, Z.H. An oxidative stress response to polycyclic aromatic hydrocarbon exposure is rapid and complex in Arabidopsis thaliana. Plant Sci. 2009, 176, 375–382. [Google Scholar] [CrossRef]
  29. Cevher-Keskin, B.; Selçukcan-Erol, Ç.; Yüksel, B.; Ertekin, O.; Yıldızhan, Y.; Onarıcı, S.; Kulen, O.; Memon, A.R. Comparative transcriptome analysis of Zea mays in response to petroleum hydrocarbon stress. Environ. Sci. Pollut. Res. 2018, 25, 32660–32674. [Google Scholar] [CrossRef]
  30. Kummerová, M.; Zezulka, S.; Babula, P.; Váňová, L. Root response in Pisum sativum and Zea mays under fluoranthene stress: Morphological and anatomical traits. Chemosphere 2013, 90, 665–673. [Google Scholar] [CrossRef]
  31. Habig, W.H.; Pabst, M.J.; Jakoby, W.B. Glutathione S-transferases: The first enzymatic step in mercapturic acid formation. J. Biol. Chem. 1974, 249, 7130–7139. [Google Scholar] [CrossRef]
  32. Hernández-Vega, J.C.; Cady, B.; Kayanja, G.; Mauriello, A.; Cervantes, N.; Gillespie, A.; Lavia, L.; Trujillo, J.; Alkio, M.; Colón-Carmona, A. Detoxification of polycyclic aromatic hydrocarbons (PAHs) in Arabidopsis thaliana involves a putative flavonol synthase. J. Hazard. Mater. 2017, 321, 268–280. [Google Scholar] [CrossRef] [PubMed] [Green Version]
  33. Apel, K.; Hirt, H. Reactive oxygen species: Metabolism, oxidative stress, and signal transduction. Ann. Rev. Plant Biol. 2004, 55, 373–399. [Google Scholar] [CrossRef] [PubMed]
  34. Lichtenthaler, H.K.; Wellburn, A.R. Determinations of total carotenoids and chlorophylls a and b of leaf extracts in different solvents. Biochem. Soc. Trans. 1983, 11, 591–592. [Google Scholar] [CrossRef]
  35. IUSS Working Group WRB. World Reference Base for Soil Resources 2014, Update 2015. International Soil Classification System for Naming Soils and Creating Legends for Soil Maps; World soil resources reports no. 106; FAO: Rome, Italy, 2015. [Google Scholar]
  36. Sushkova, S.N.; Minkina, T.M.; Tarigholizadeh, S.; Rajput, V.; Fedorenko, A.G.; Antonenko, E.M.; Dudnikova, T.S.; Chernikova, N.P.; Yadav, B.K. Soil PAHs contamination effect on the cellular and subcellular organelle changes of Phragmites australis Cav. Environ. Geochem. Health 2021, 43, 2407–2421. [Google Scholar] [CrossRef] [PubMed]
  37. Tewari, H.B.; Bourne, G.H. Histochemical evidence of metabolic cycles in spinal ganglion cells of rat. J. Histochem. Cytochem. 1962, 10, 42–64. [Google Scholar] [CrossRef]
  38. Heath, R.L.; Packer, L. Photoperoxidation in isolated chloroplasts. I. Kinetics and stoichiometry of fatty acid peroxidation. Arch. Biochem. Biophys. 1968, 125, 180–198. [Google Scholar] [CrossRef]
  39. Hodges, D.M.; DeLong, J.M.; Forney, C.F.; Prange, R.K. Improving the thiobarbituric acid-reactive-substances assay for estimating lipid peroxidation in plant tissues containing anthocyanin and other interfering compounds. Planta 1999, 4, 604–611. [Google Scholar] [CrossRef]
  40. Bradford, M.M. Rapid and sensitive method for quantitation of microgram quantities of protein utilizing principle of protein-dye binding. Anal. Biochem. 1976, 72, 248–254. [Google Scholar] [CrossRef]
  41. Demiral, T.; Türkan, I. Comparative lipid peroxidation, antioxidant defense systems and proline content in roots of two rice cultivars differing in salt tolerance. Environmen. Exp. Bot. 2005, 53, 247–257. [Google Scholar] [CrossRef]
  42. Sirota, T.V. Novel approach to the study od adrenaline auto-oxidation and its use for the measurements of superoxide dismutase activity. Vopr. Med. Khim. 1999, 45, 263–272. [Google Scholar]
  43. Nair, A.R.; Agbor, L.N.; Mukohda, M.; Liu, X.; Hu, C.; Wu, J.; Sigmund, C.D. Interference with endothelial PPAR (Peroxisome Proliferator–Activated Receptor)-γ causes accelerated cerebral vascular dysfunction in response to Endogenous Renin-Angiotensin System Activation. Hypertension 2018, 72, 1227–1235. [Google Scholar] [CrossRef] [PubMed]
  44. Arora, A.; Sairam, R.K.; Srivastava, G.C. Oxidative stress and antioxidative system in plants. Curr. Sci. 2002, 82, 1227–1238. [Google Scholar]
  45. Qayyum, S.; Nasir, A.; Mian, A.H.; Rehman, S.; Qayum, S.; Siddiqui, M.F.; Kalsoom, U. Extraction of peroxidase enzyme from different vegetables for biodetoxification of vat dyes. Appl. Nanosci. 2020, 10, 5191–5199. [Google Scholar] [CrossRef]
  46. Ellman, G.L. Tissue sulfhydryl groups. Arch. Biochem. Biophys. 1959, 82, 70–77. [Google Scholar] [CrossRef]
Figure 1. Effect of BaP on (a) accumulation, (b,c) morphobiometric parameters of plants, (d) MDA, (e) pigments in Solanum lycopersicum plants. Statistically significant differences (p ≤ 0.05) comparing the treated plants to the control plants are marked with an asterix (*).
Ijms 24 03741 g001
Figure 2. Effect of BaP on the growth, development, and deformation of the Solanum lycopersicum leaf blades in the active growth phase: (a,e), control; (b,f) 20 MPC BaP; (c,g) 40 MPC BaP; (d,h) 60 MPC BaP.
Ijms 24 03741 g002
Figure 3. Histochemical determination of superoxide in leaves: (a) control; (b) 20 MPC BaP; (c) 40 MPC BaP; (d) 60 MPC BaP.
Ijms 24 03741 g003
Figure 4. Effect of BaP on (a) SOD, (b) catalase, (c) proline, (d) PRX; (e) APOX, (f) GR, (g) GST, (h) GP in Solanum lycopersicum plants. Statistically significant differences (p ≤ 0.05) comparing the treated plants to the control plants are marked with an asterix (*).
Ijms 24 03741 g004
Figure 5. Cross sections of tomato roots: (a) Control; (b) 20 MPC BaP; (c) 40 MPC BaP; (d) 60 MPC BaP.
Ijms 24 03741 g005
Figure 6. Cross sections of a Solanum lycopersicum leaf plate: (a) Control; (b) 20 MPC BaP; (c) 40 MPC BaP; (d) 60 MPC BaP.
Ijms 24 03741 g006
Disclaimer/Publisher’s Note: The statements, opinions and data contained in all publications are solely those of the individual author(s) and contributor(s) and not of MDPI and/or the editor(s). MDPI and/or the editor(s) disclaim responsibility for any injury to people or property resulting from any ideas, methods, instructions or products referred to in the content.

