
Splicing Modulation Results in Aberrant Isoforms and Protein Products of p53 Pathway Genes and the Sensitization of B Cells to Non-Genotoxic MDM2 Inhibition
 , and
, and 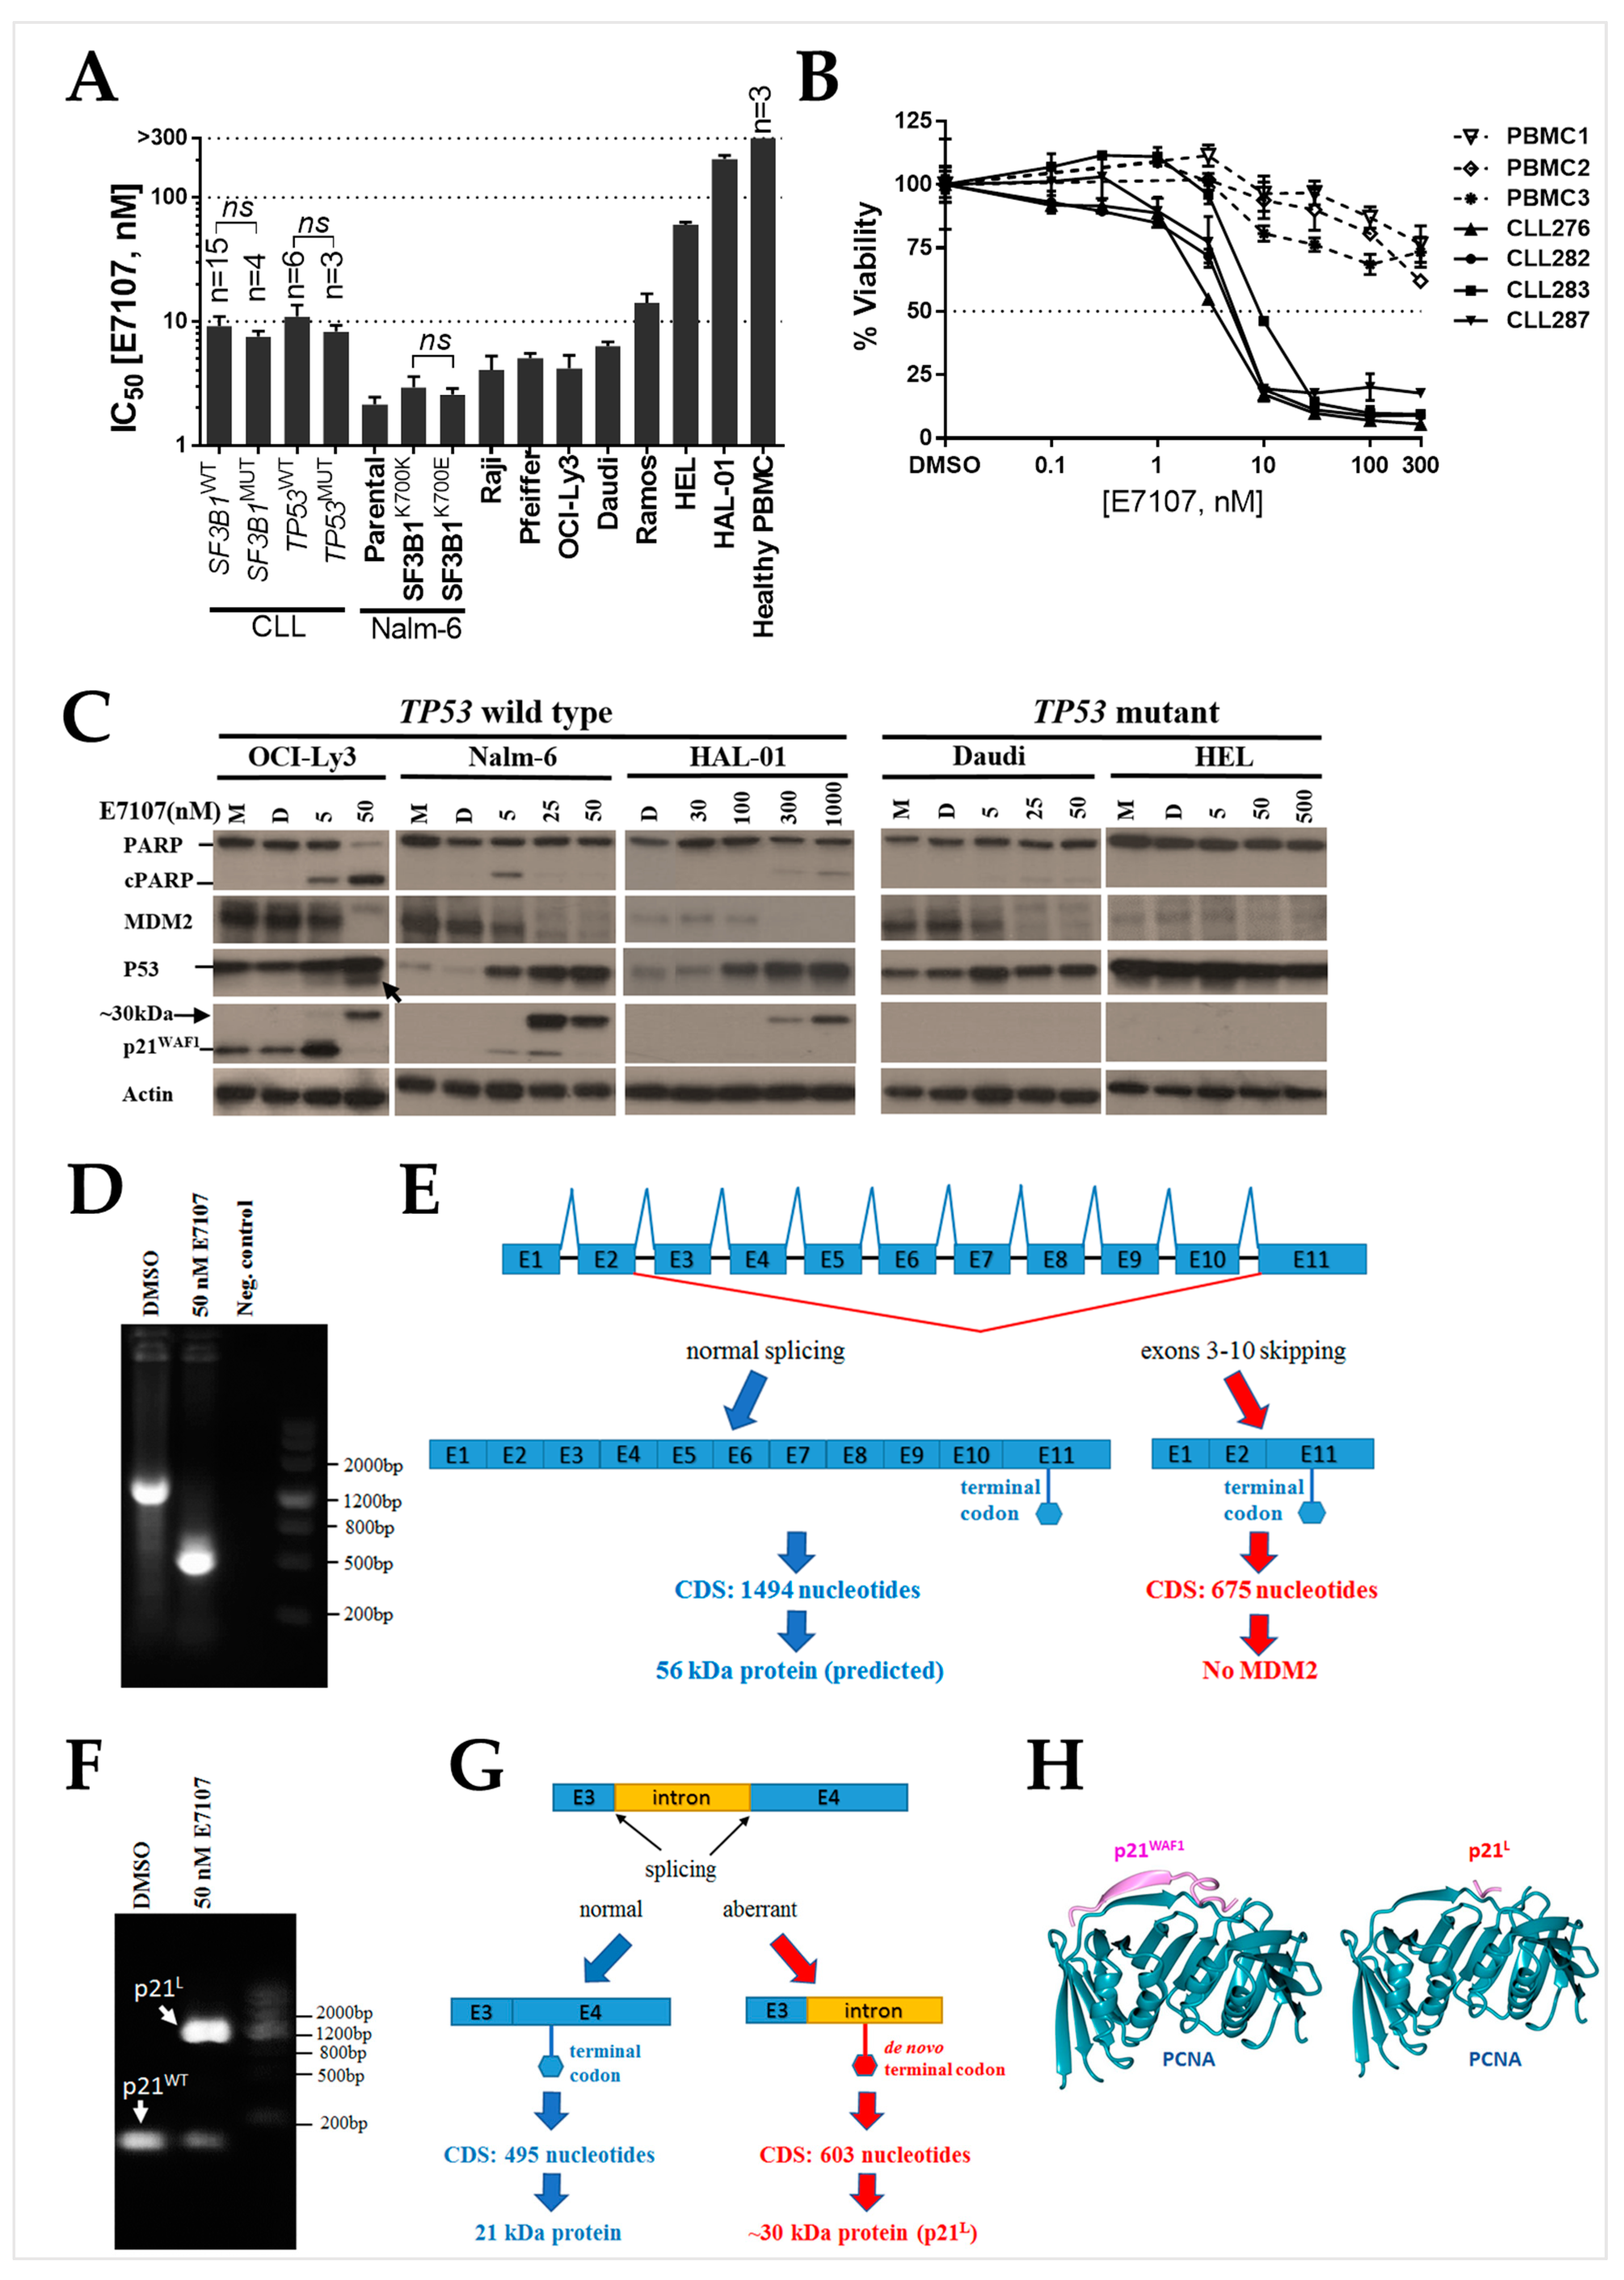
Abstract
:1. Introduction
2. Results
2.1. B-Cell Lines and Primary CLL Samples Are Sensitive to Spliceosome Inhibition Using E7107
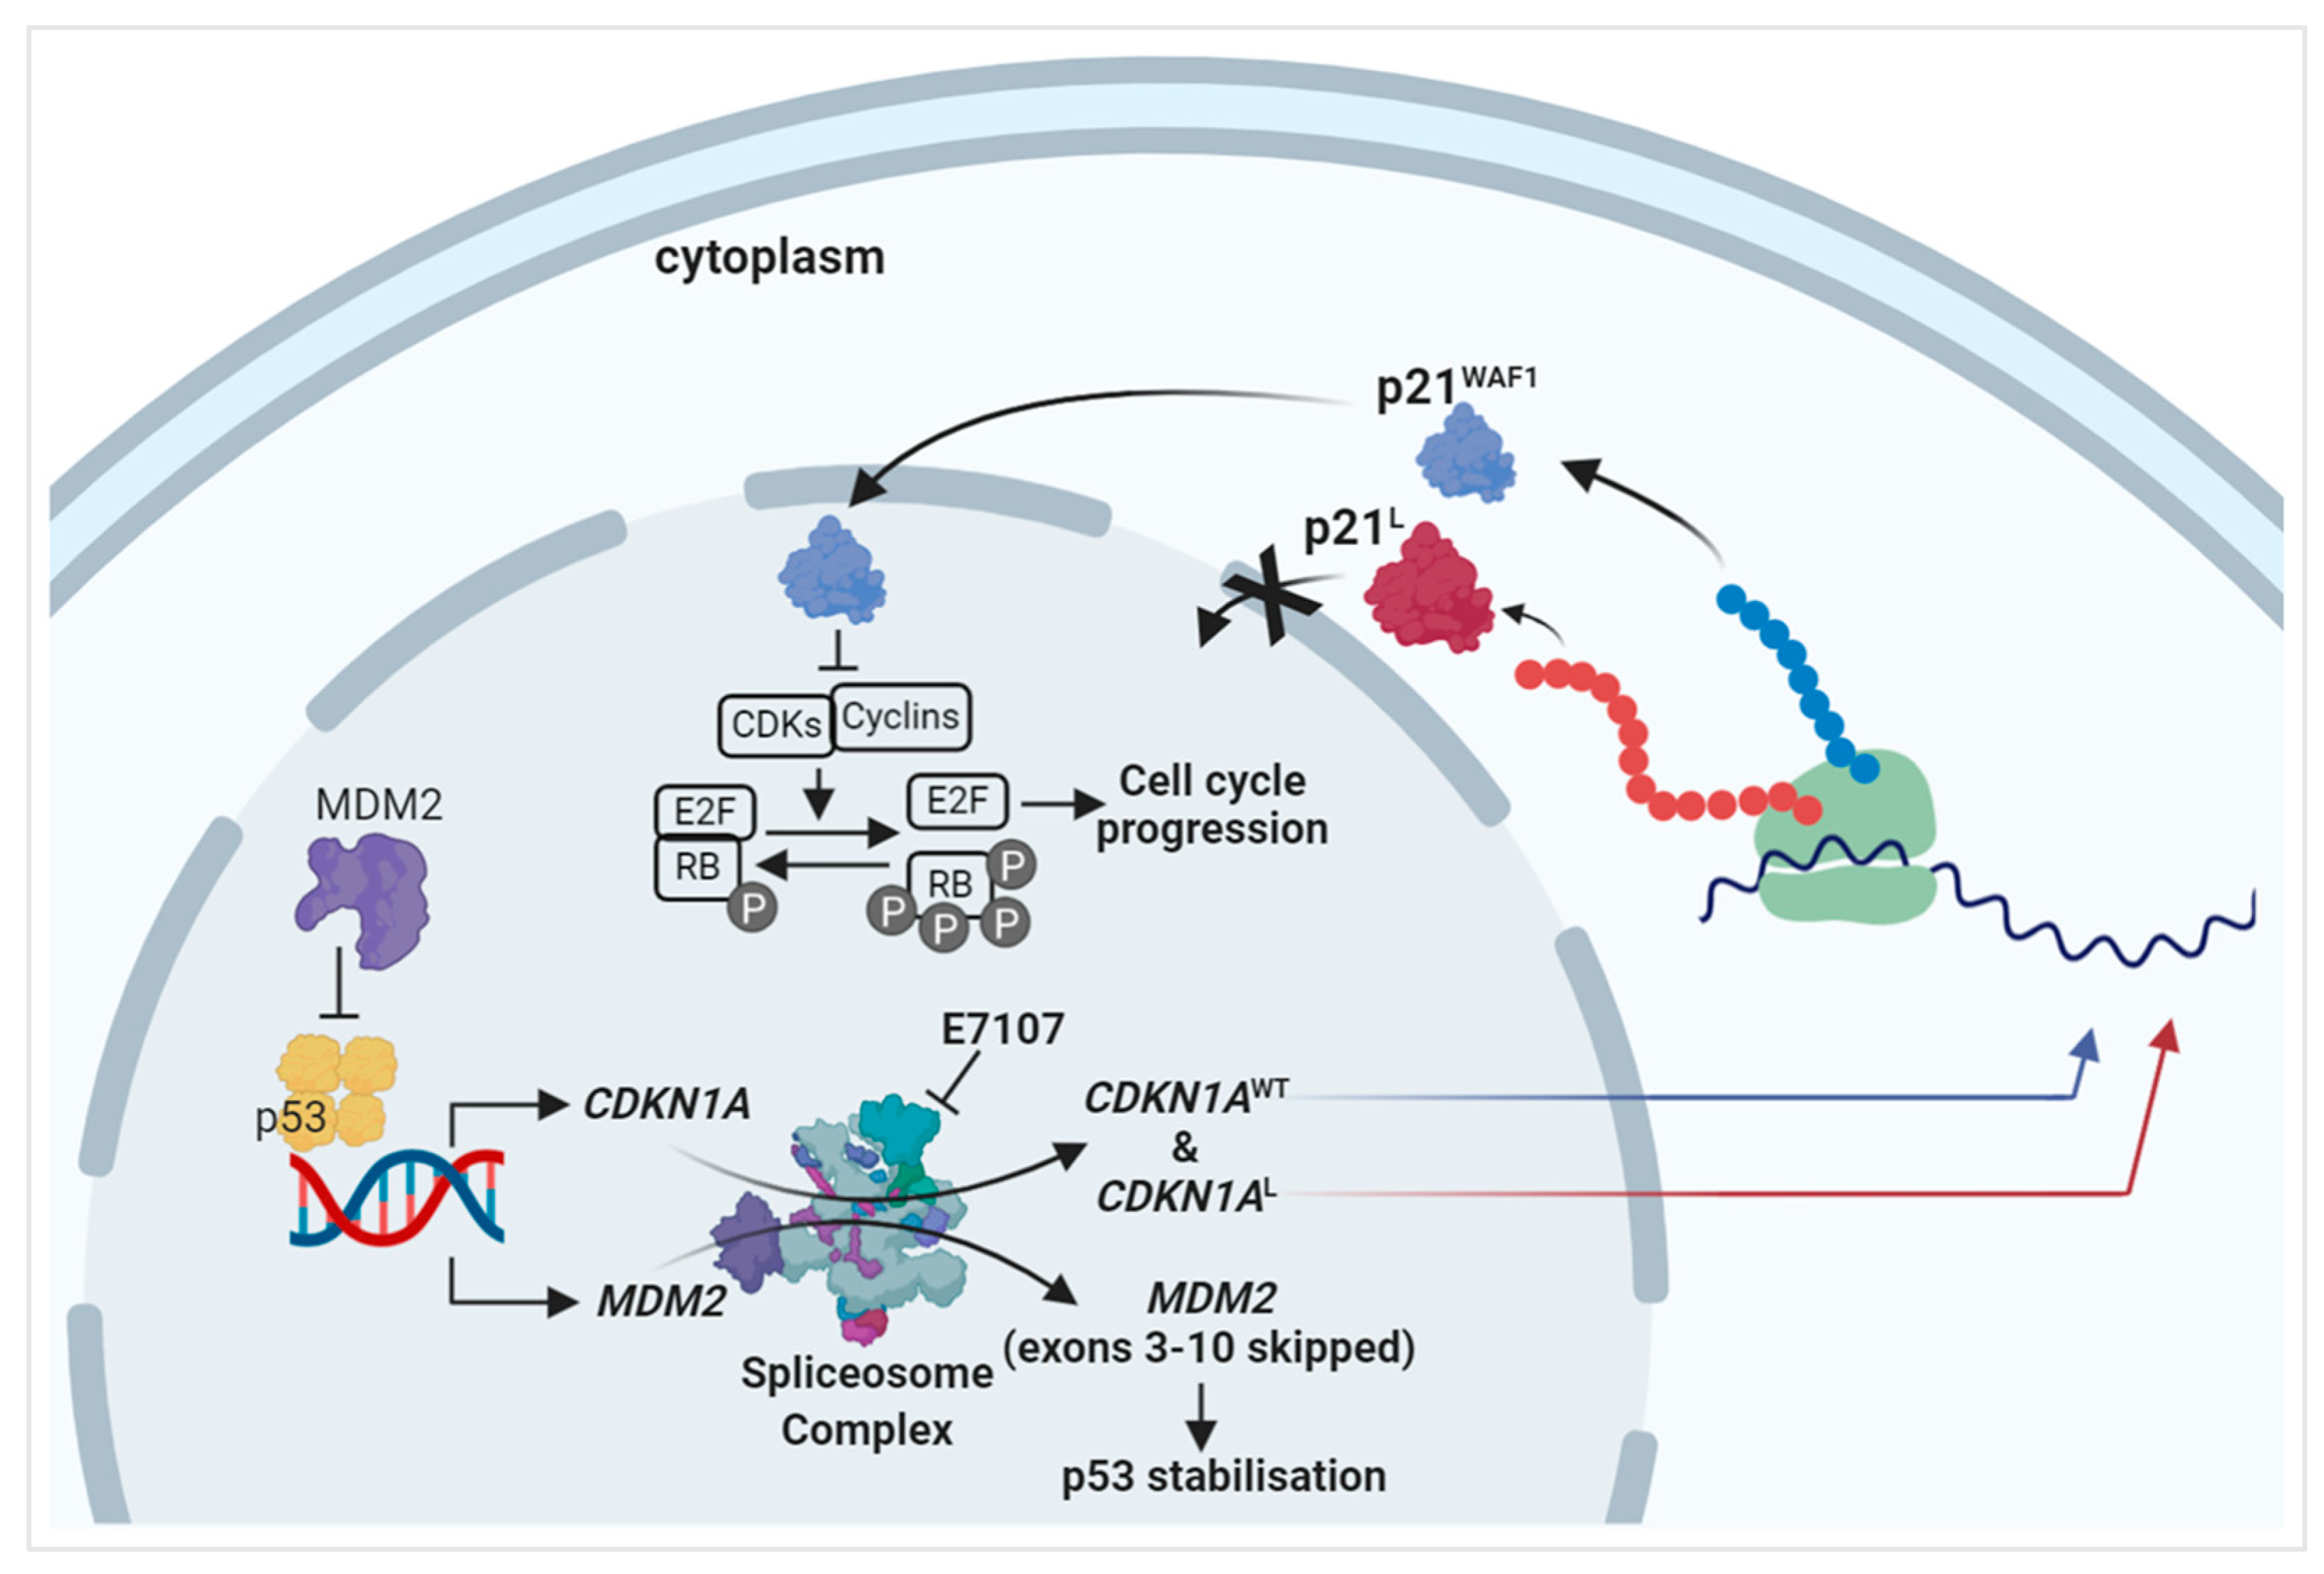
2.2. Splicing Modulation Results in Aberrant Splicing Isoforms and Protein Products of P53 Pathway Genes
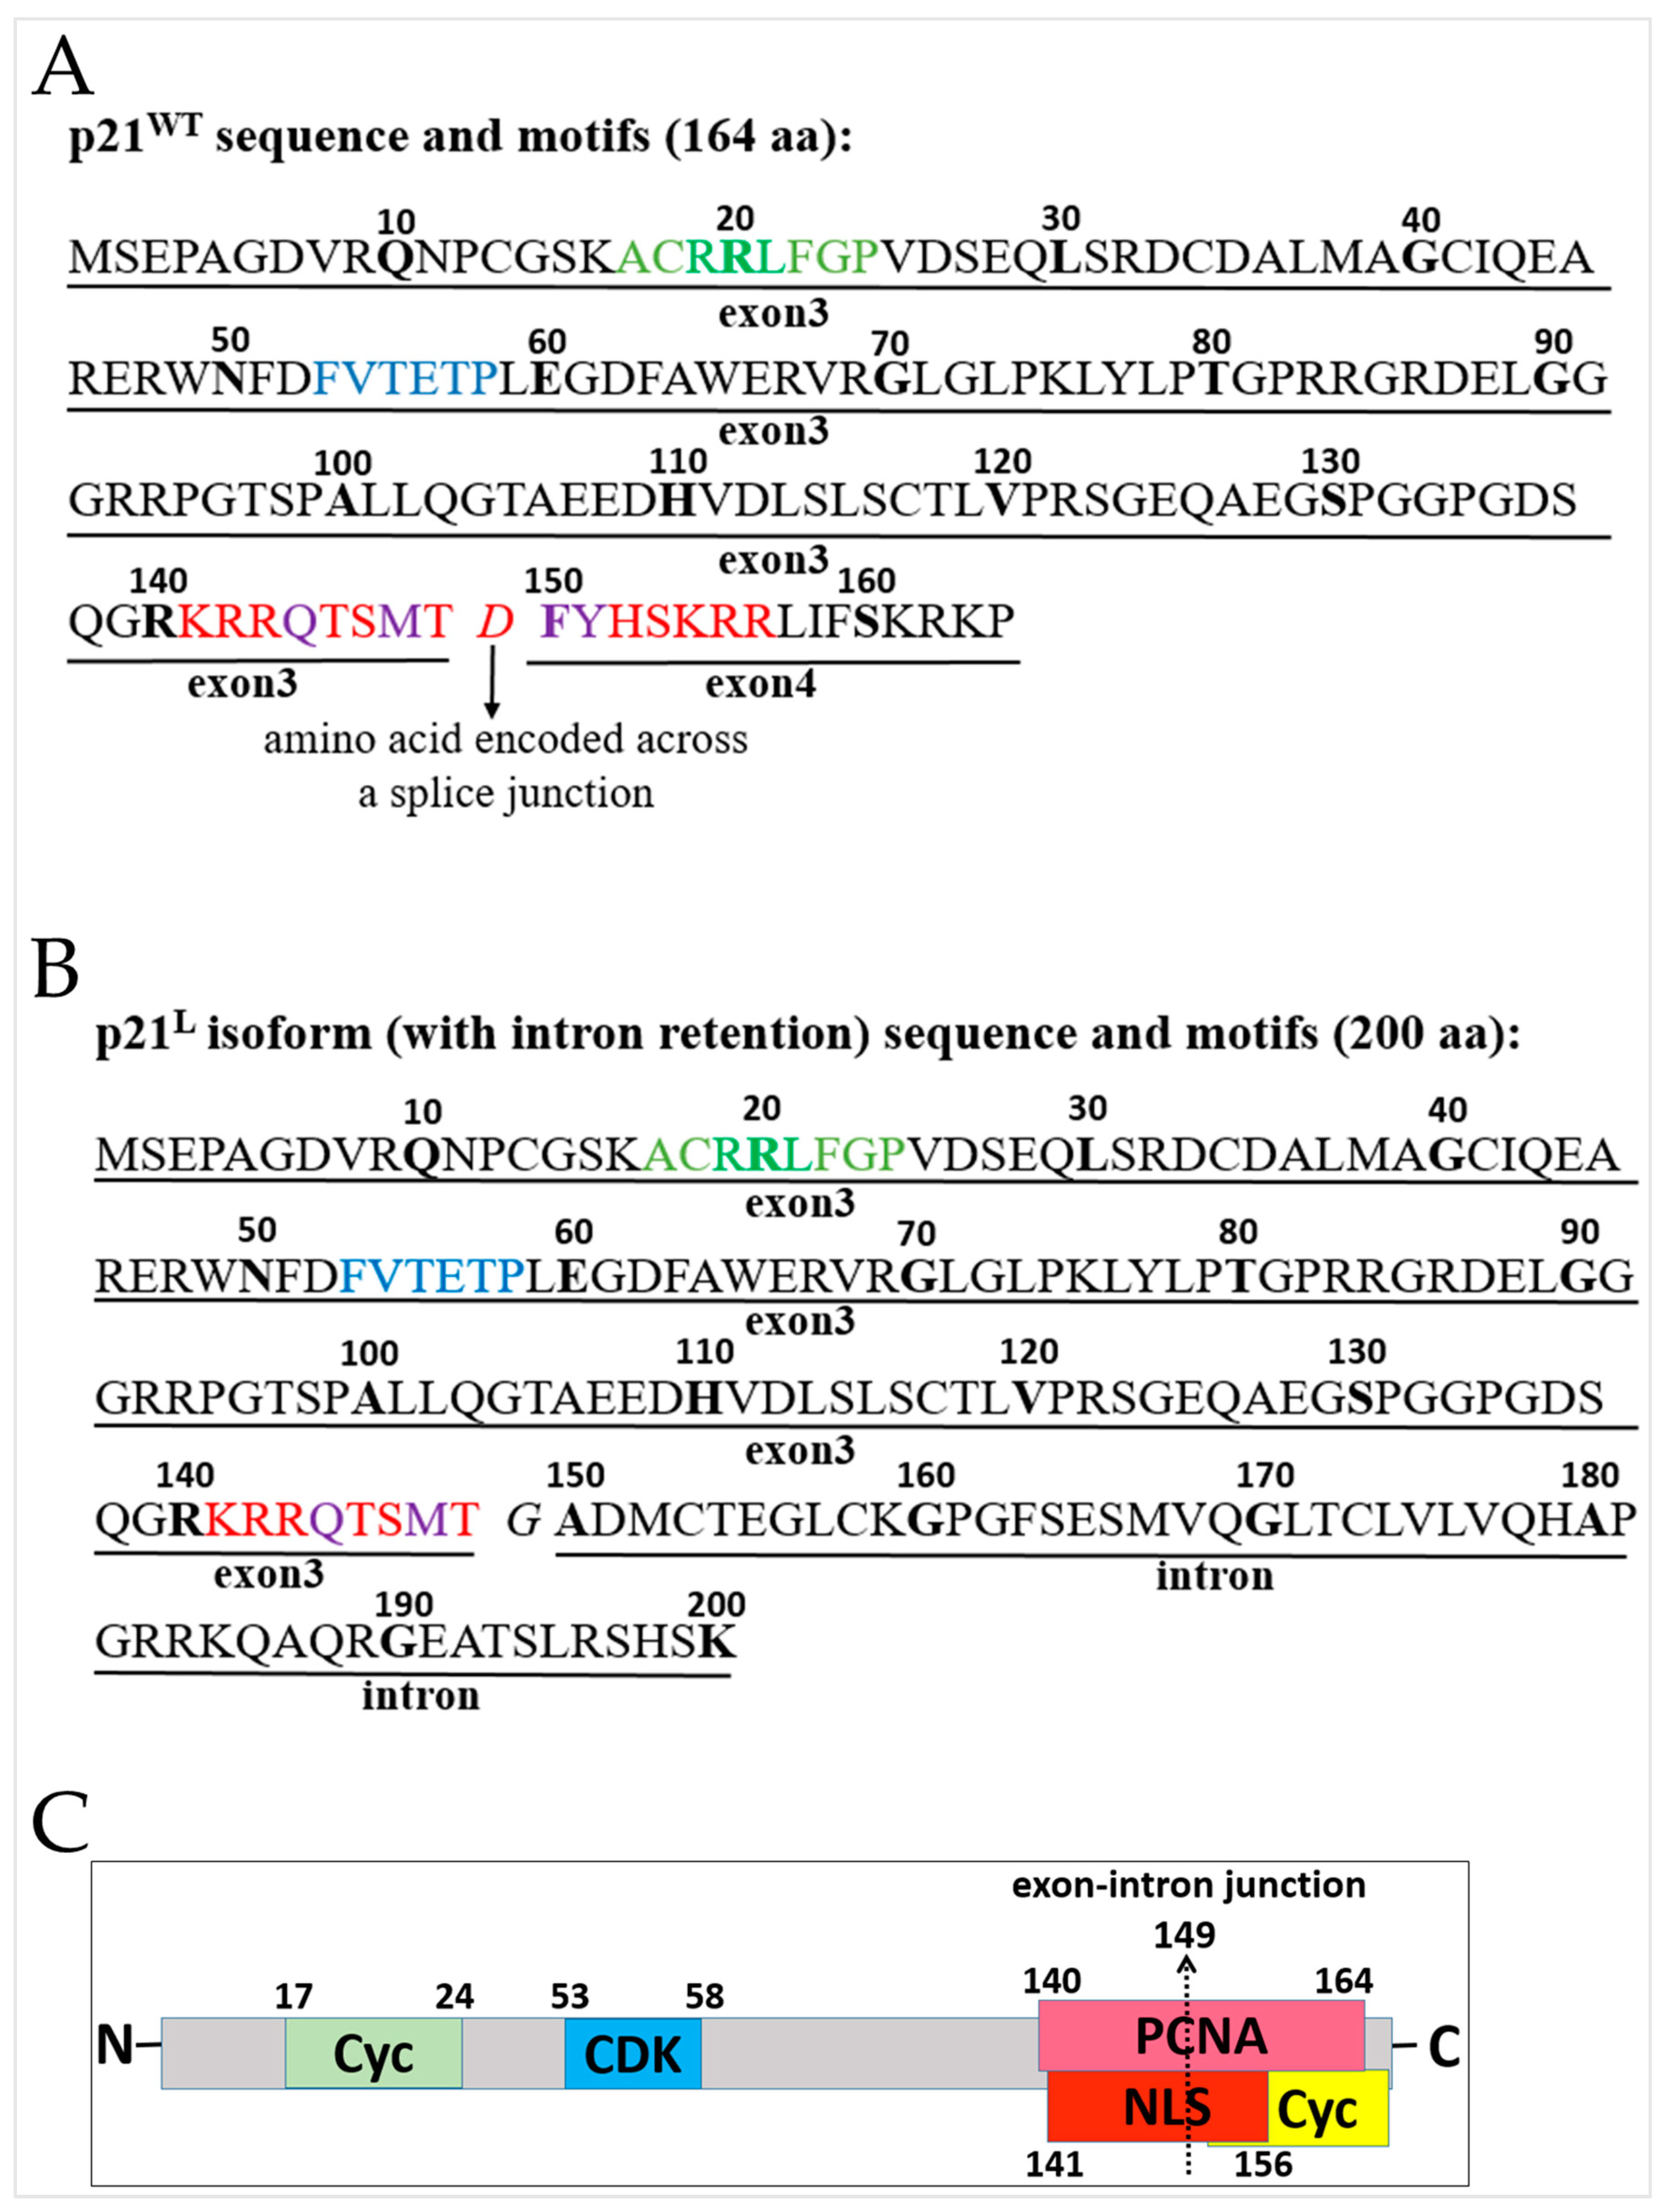
2.3. The PCNA Binding Site and NLS Are Disrupted in the Intron-Retaining Isoform of P21WAF1
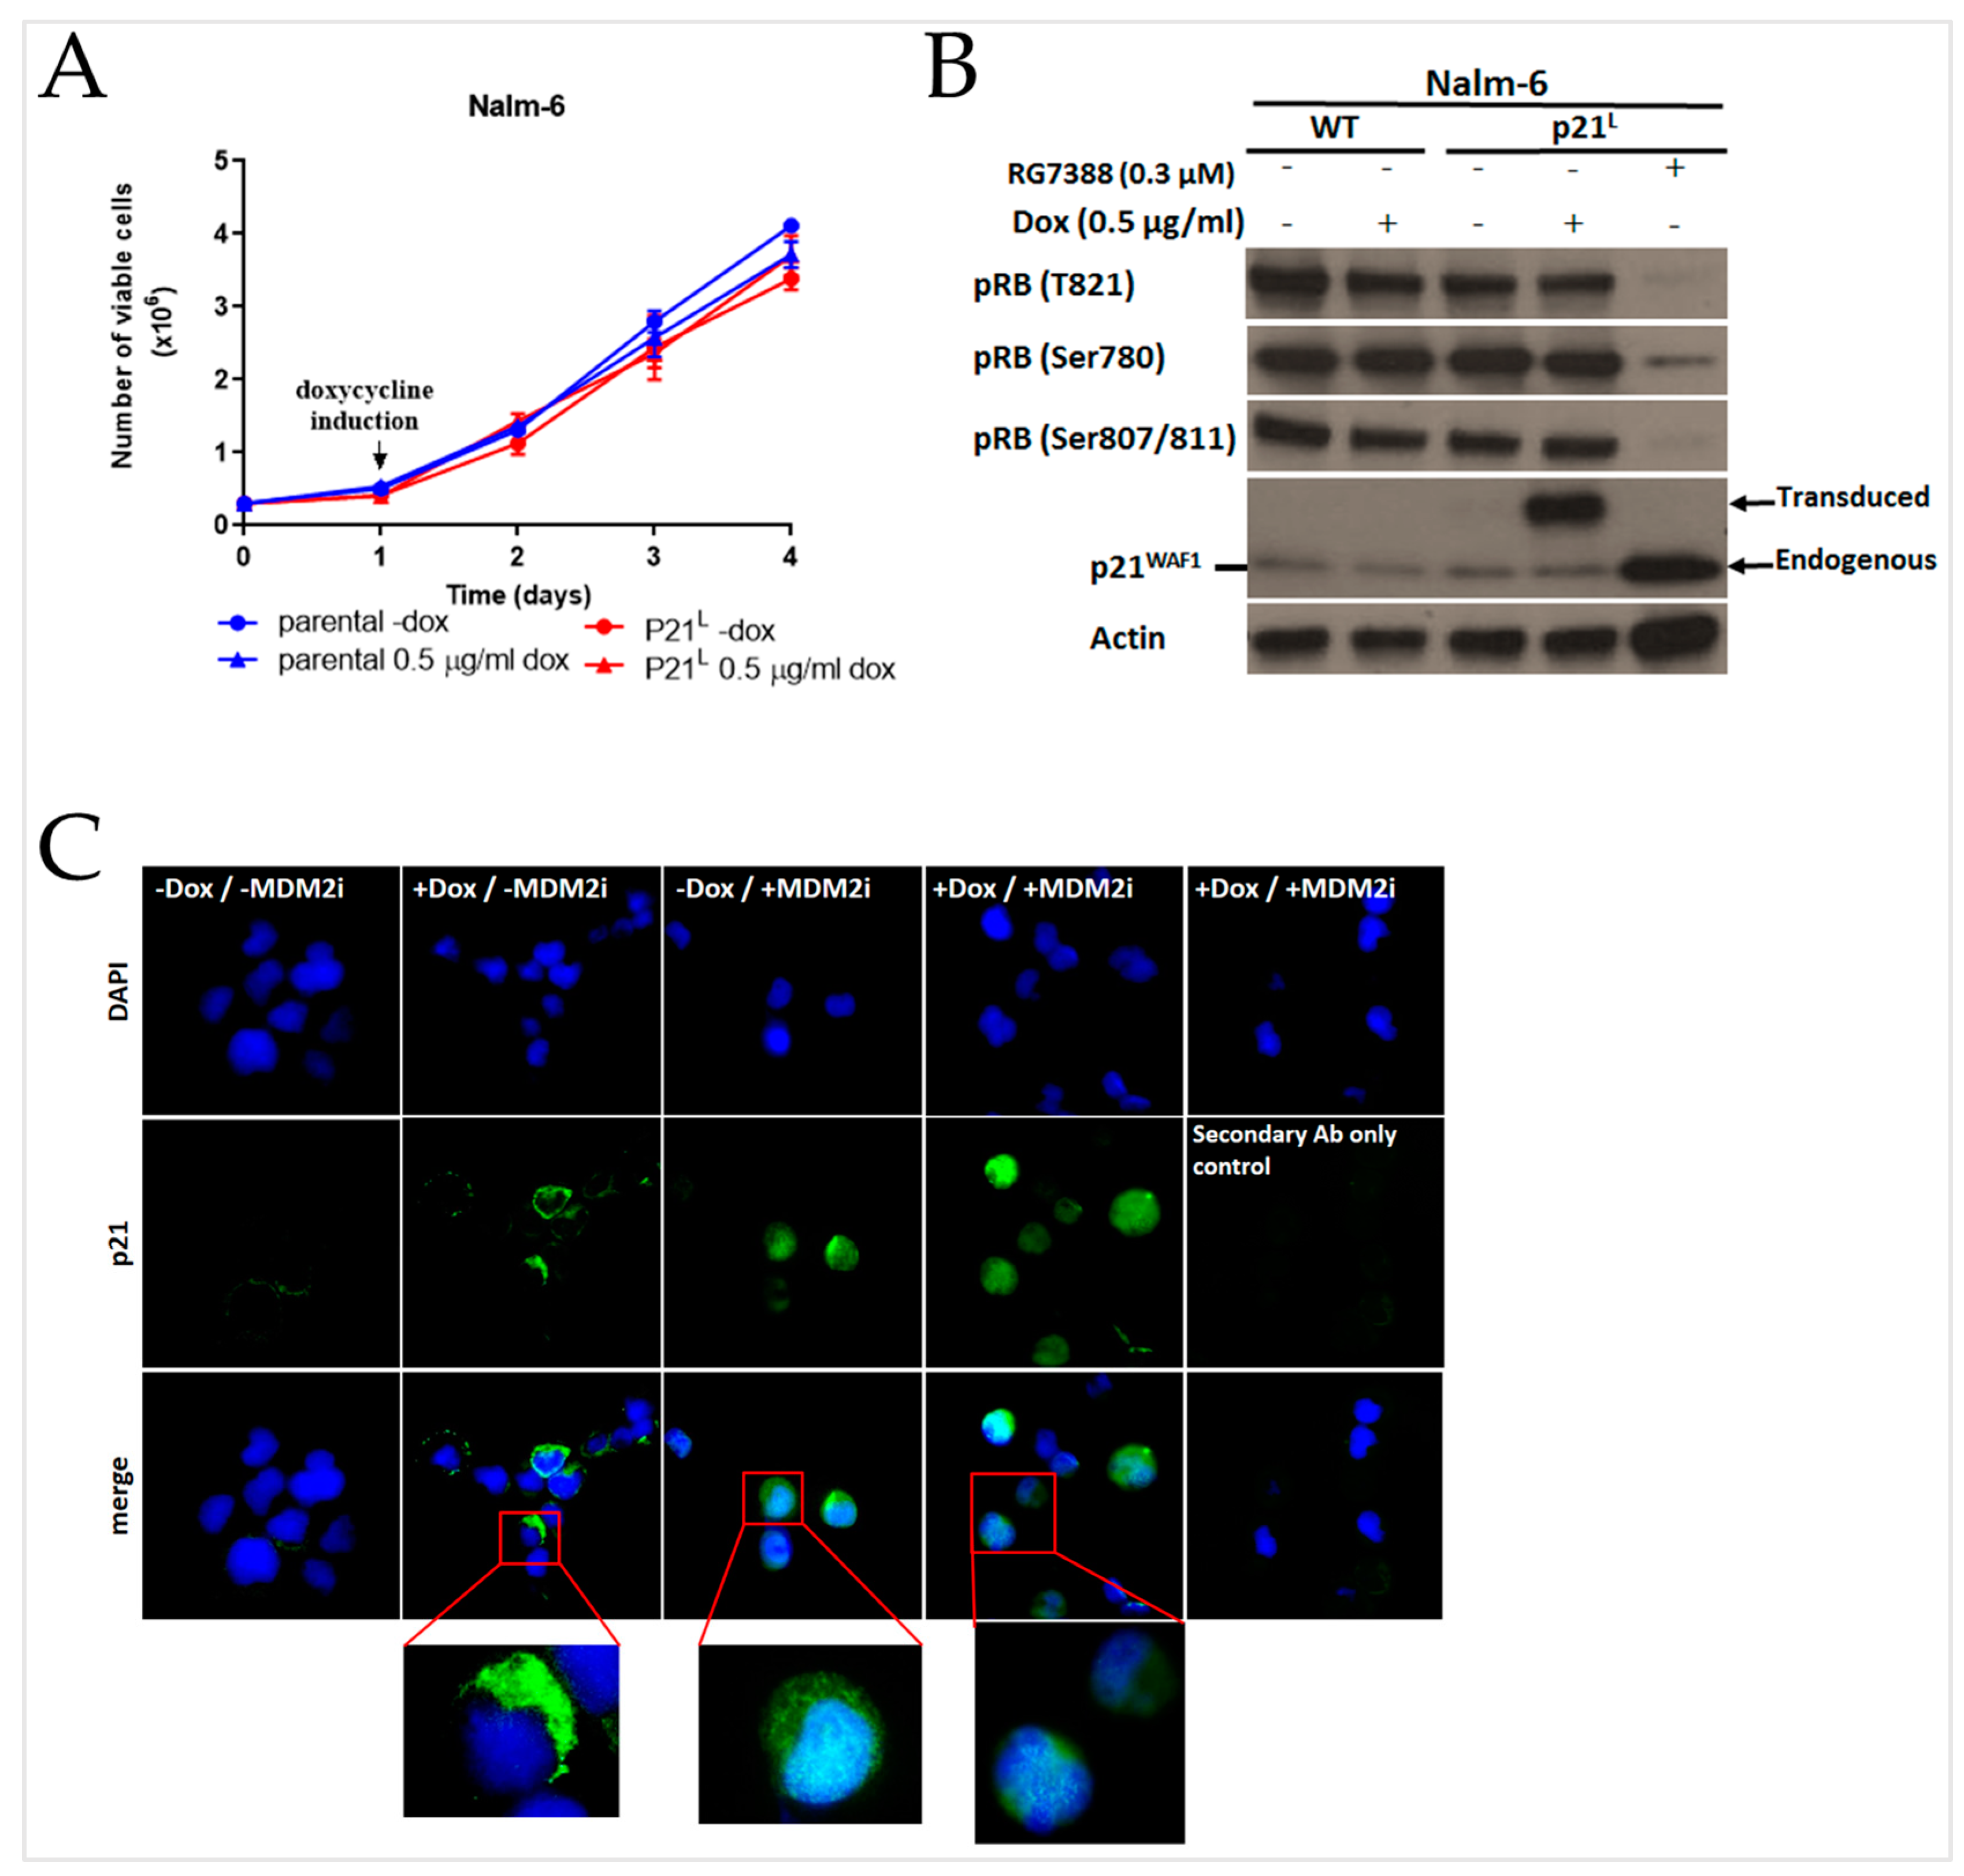
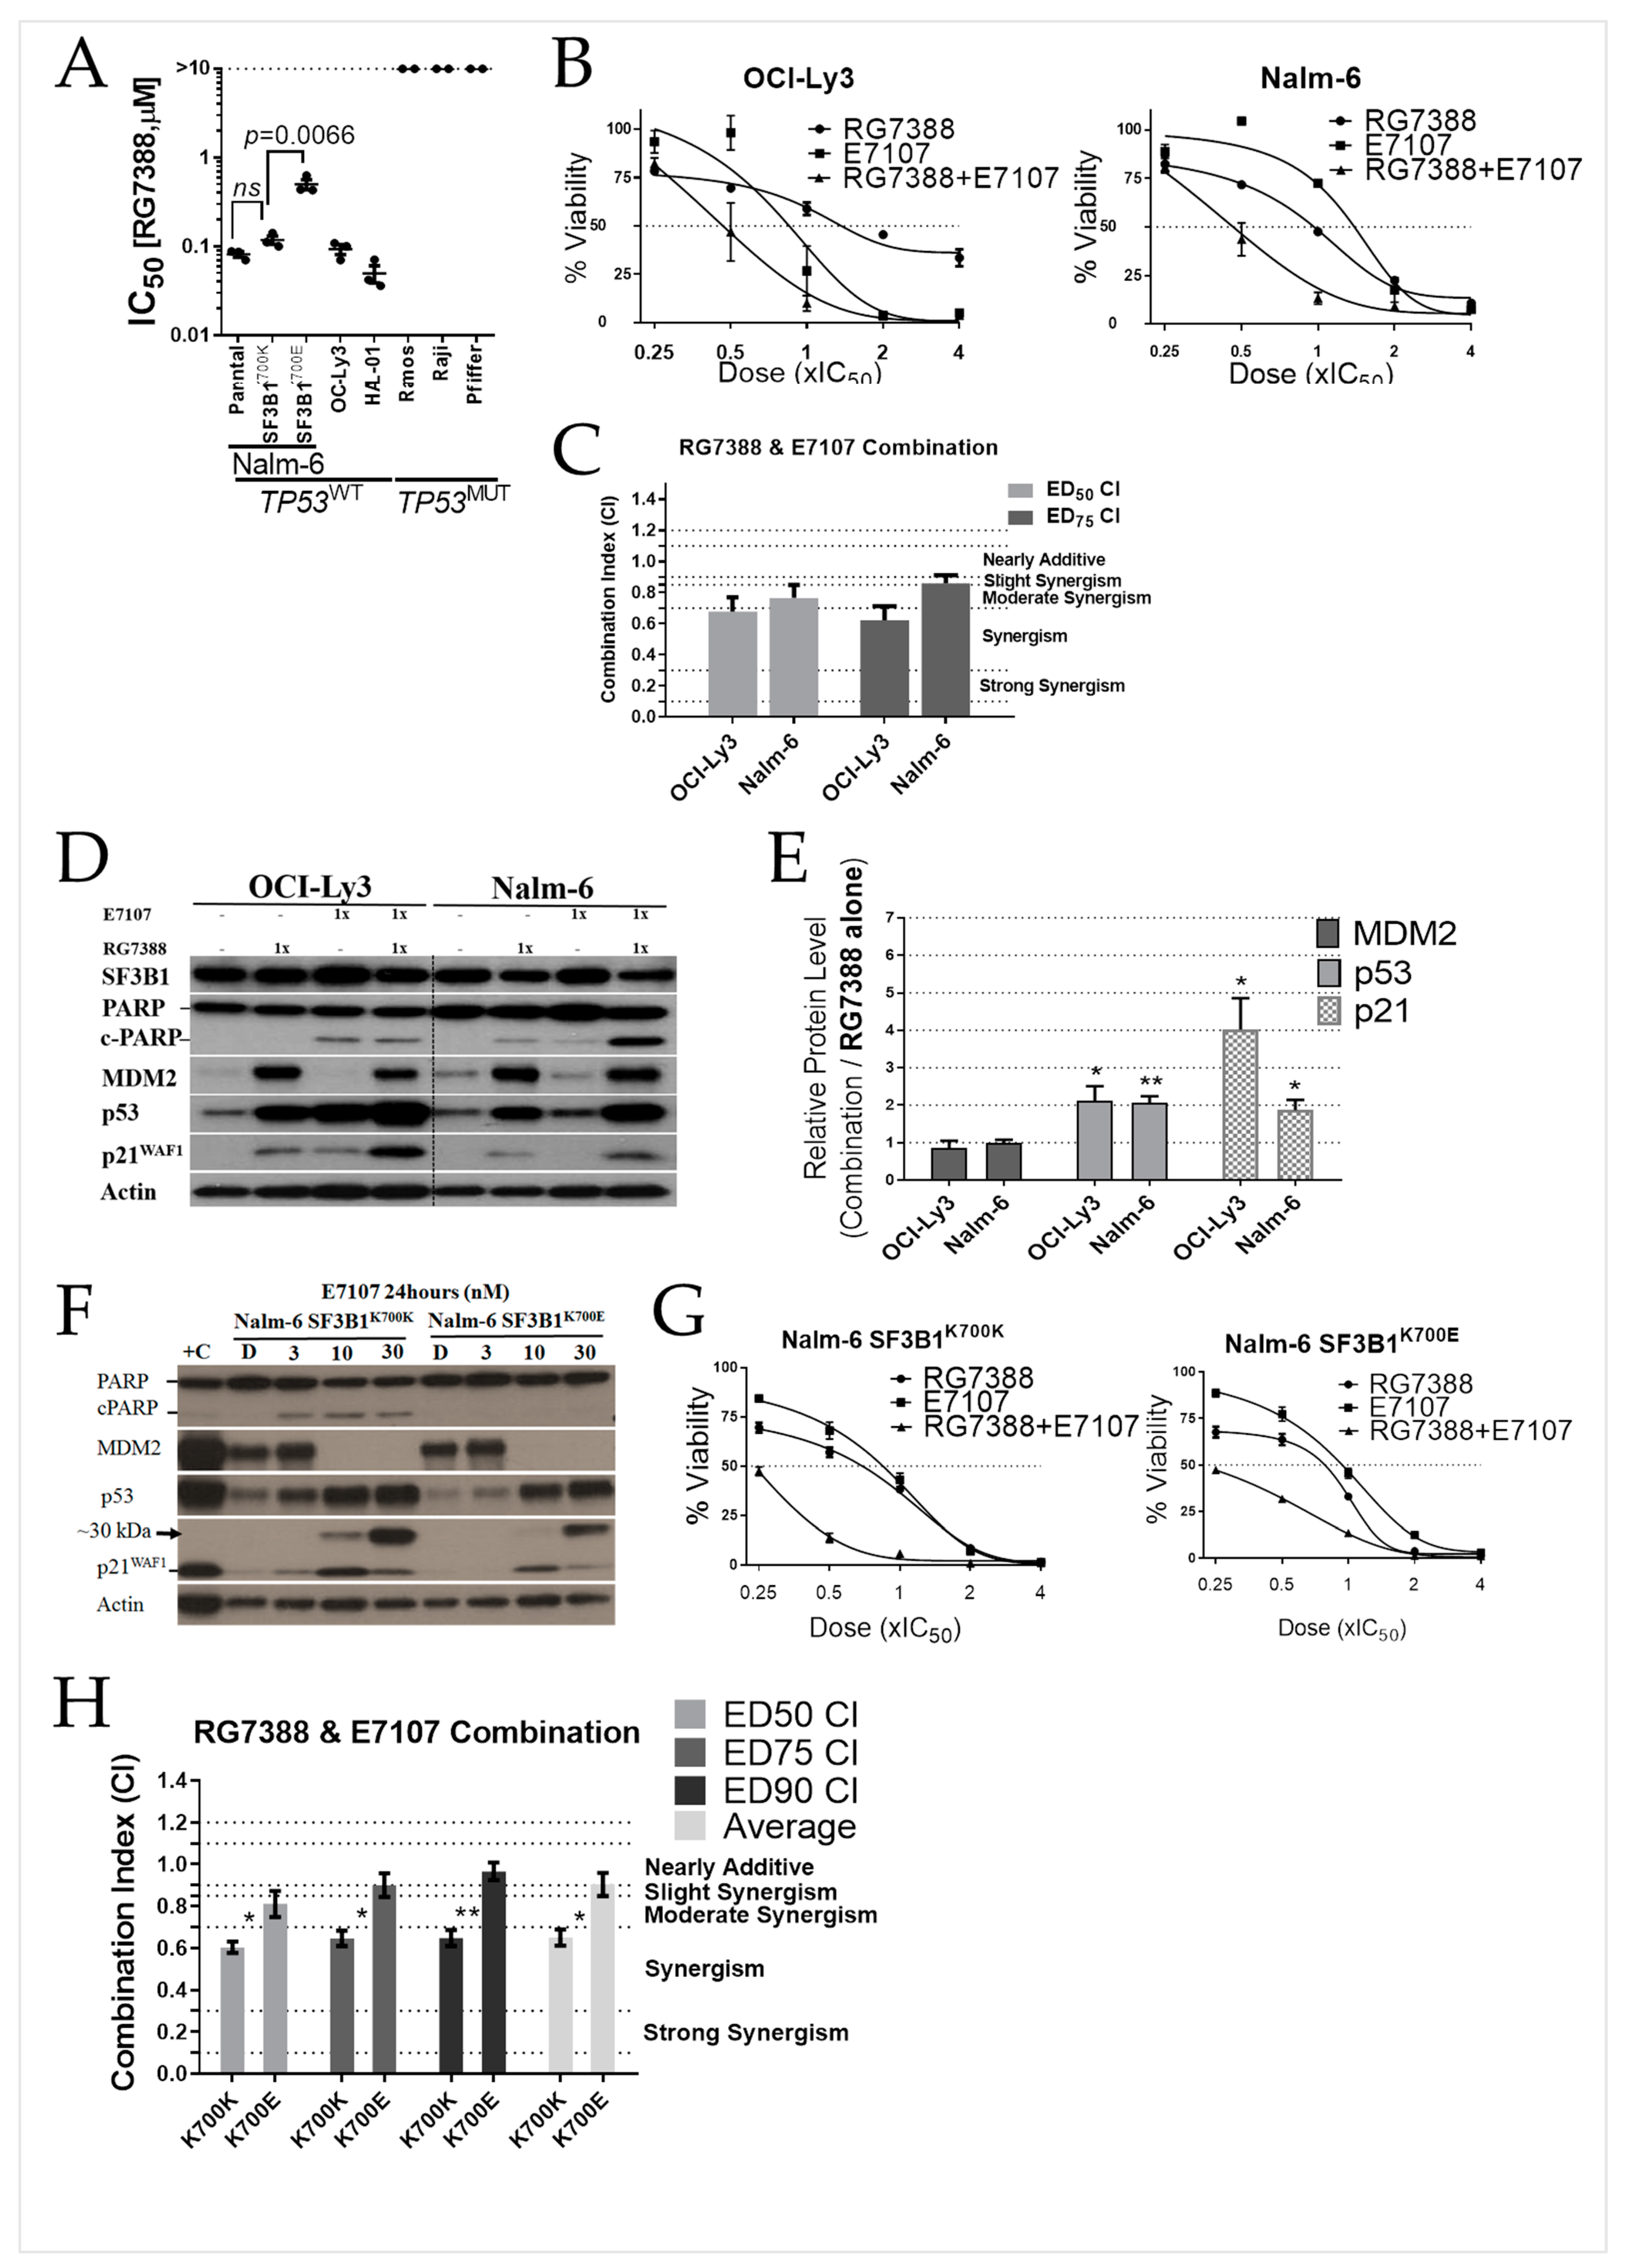
2.4. E7107 Sensitizes B-Cell Lines to Non-Genotoxic MDM2 Inhibition with RG7388
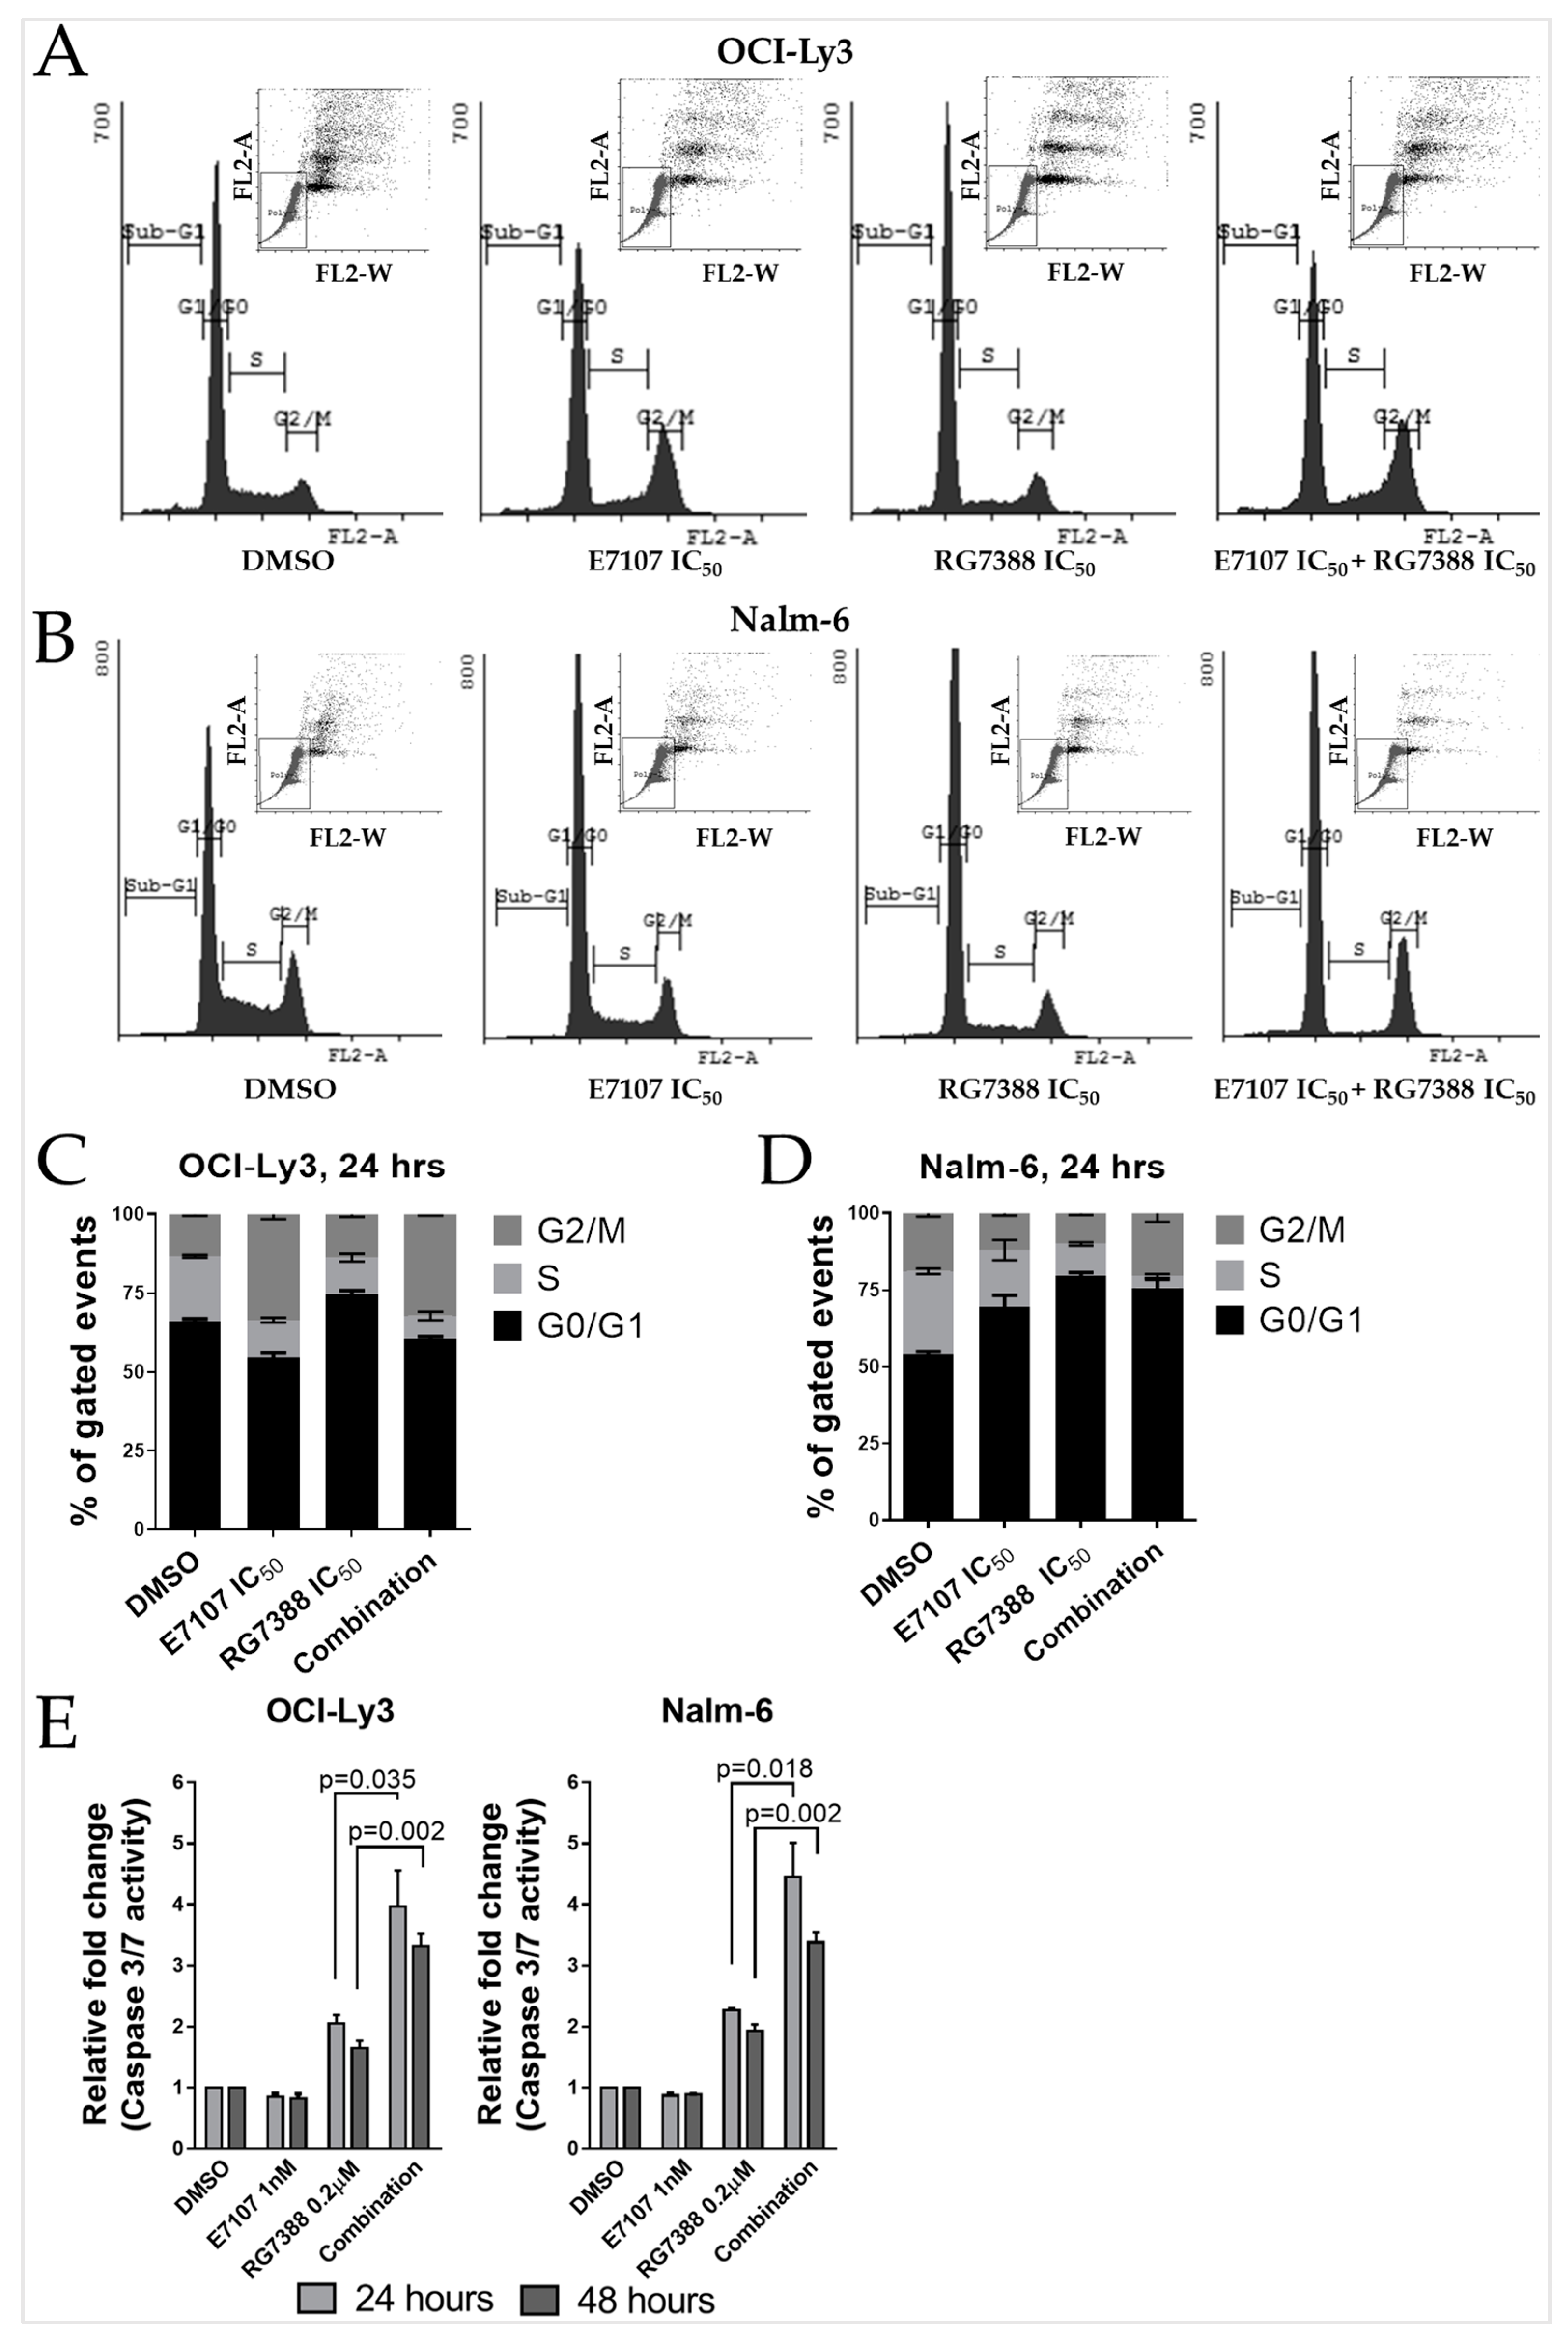
2.5. Combination Treatment with E7107 and RG7388 Increases Cell Cycle Arrest and Apoptosis
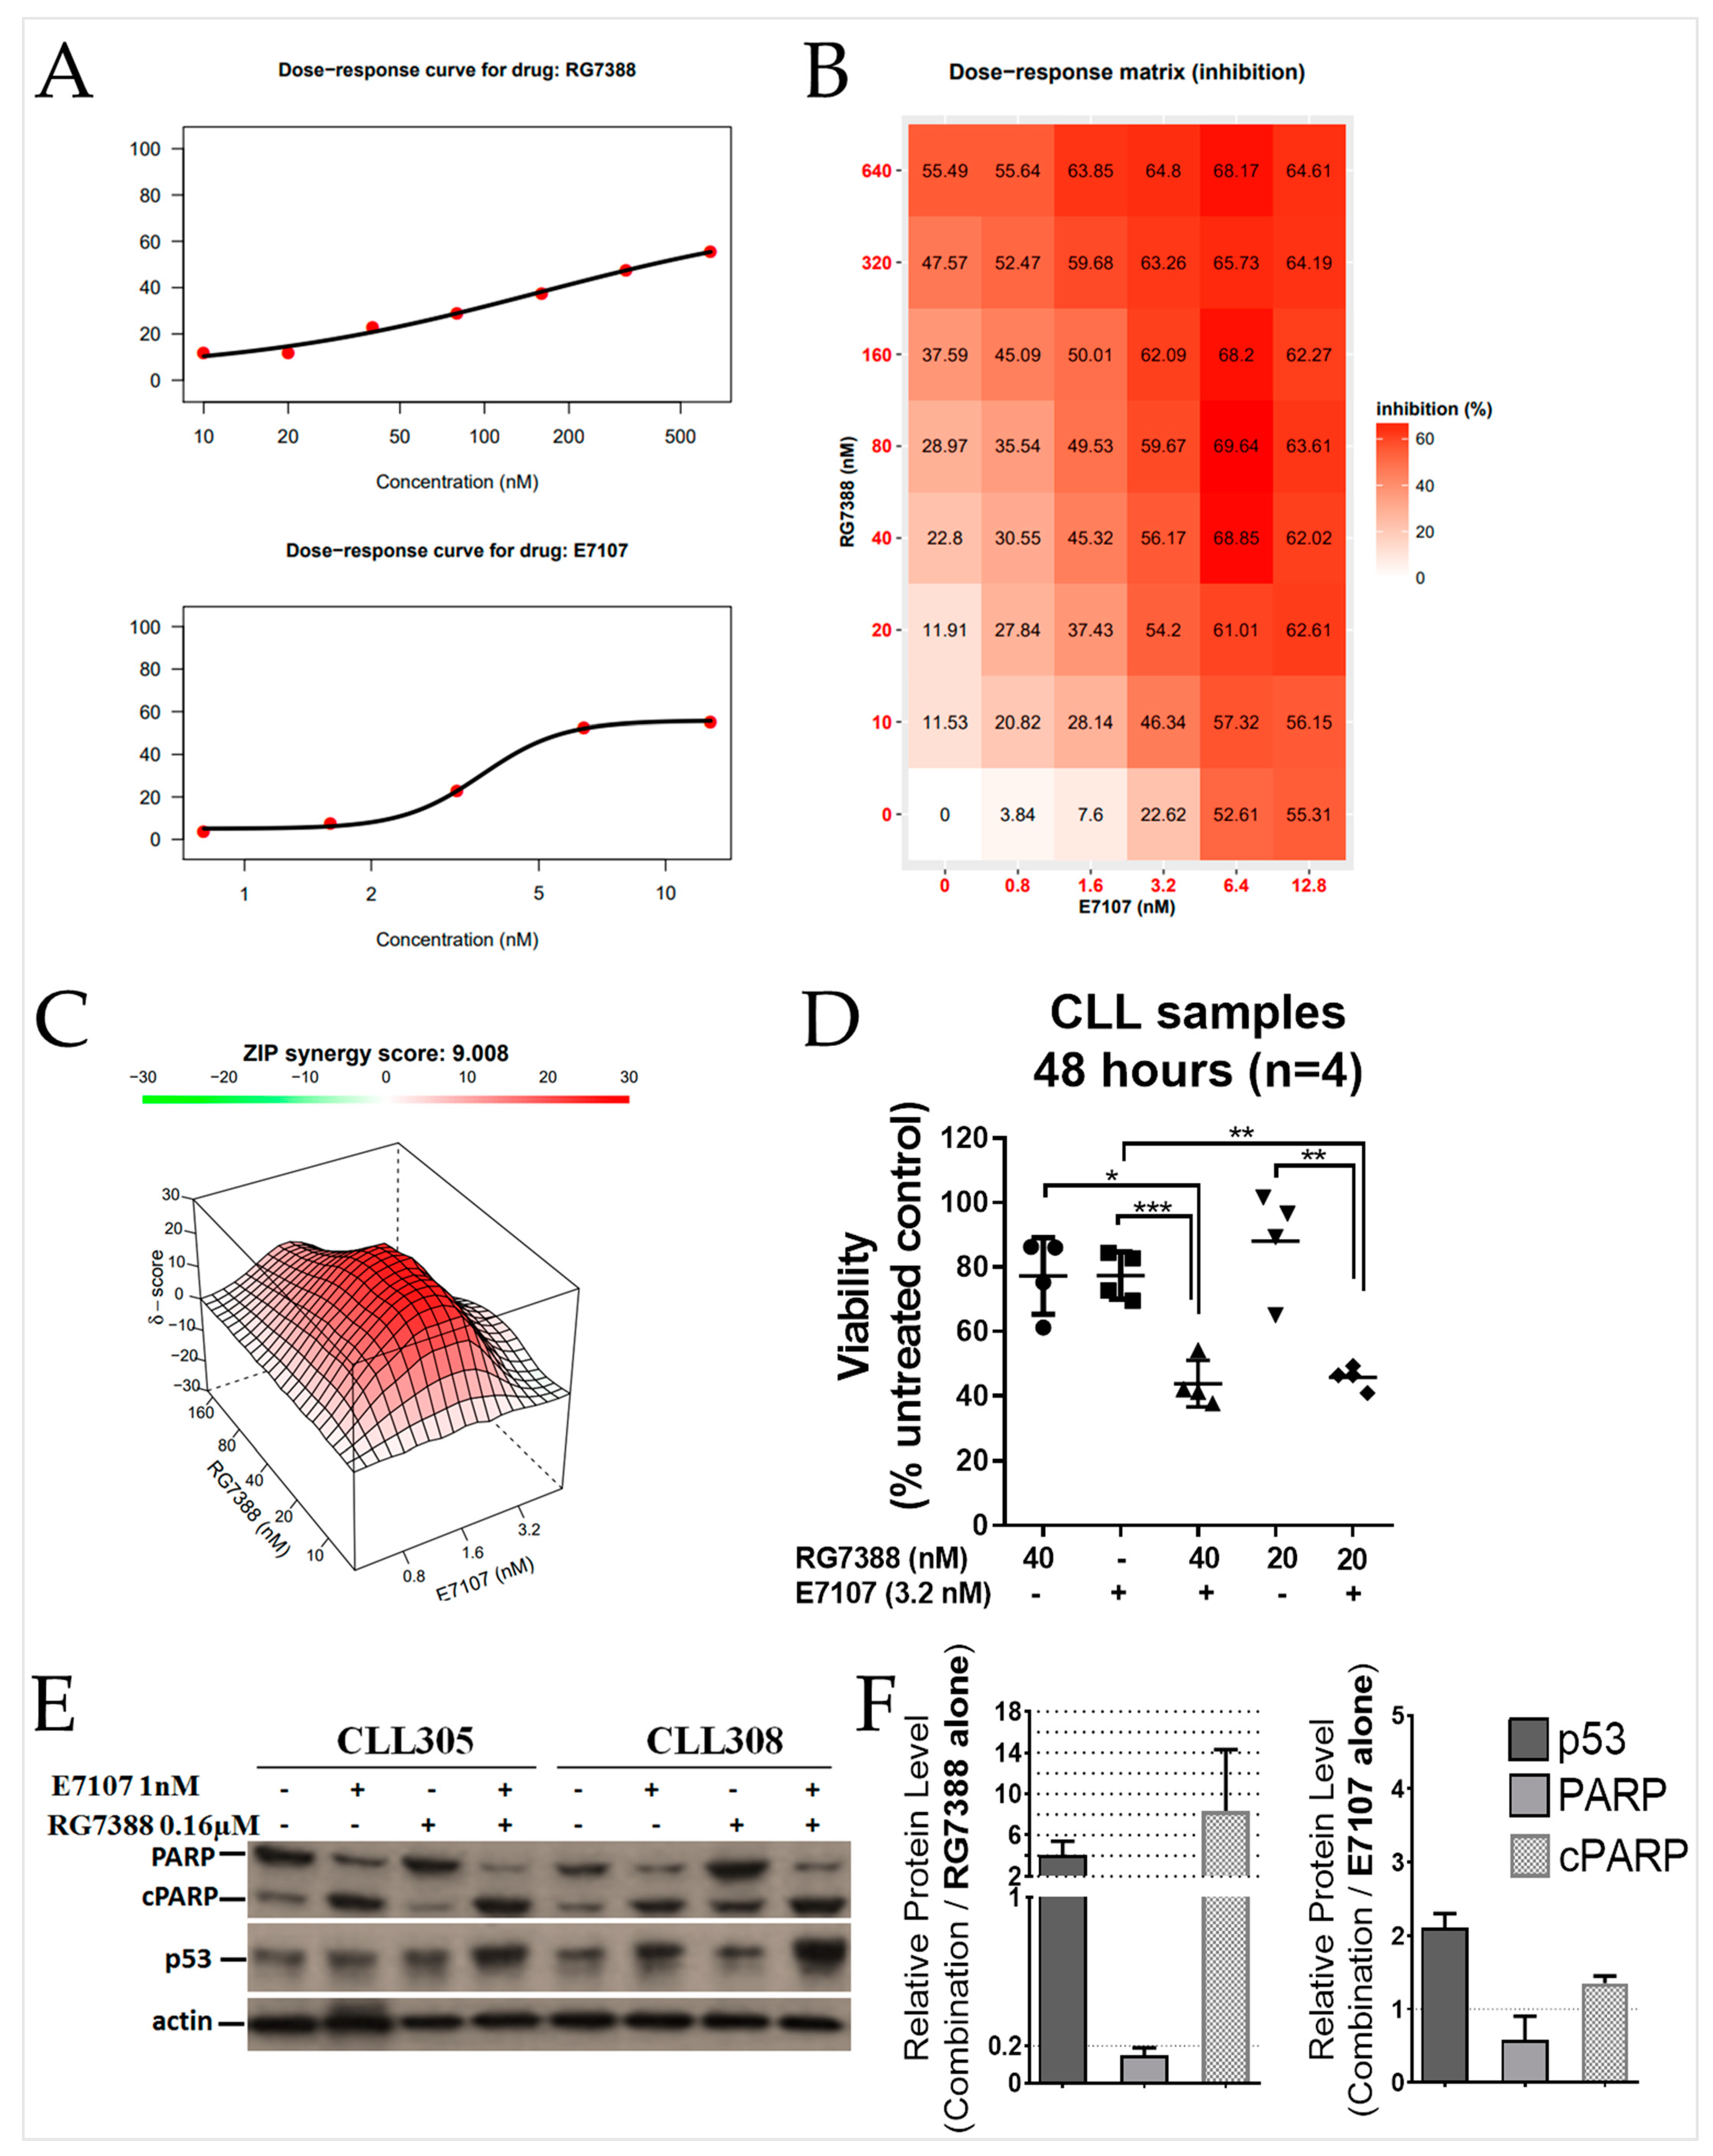
2.6. Combined Spliceosome Disruption and MDM2 Inhibition Has a Synergistic Cytotoxic Effect on Primary CLL Cells
3. Discussion
4. Materials and Methods
4.1. Cell Lines and Compounds
4.2. Patient Samples
4.3. Cell Viability Assay
4.3.1. Cell Lines
4.3.2. PBMCs
4.3.3. Combination Treatment and Median-Effect Analysis
4.4. Apoptosis Assay
4.5. Flow Cytometry
4.6. Sanger Sequencing
- SF3B1 Ex14 F: ACCAACTCATGACTGTCCTTTC, R: ACAACTTACCATGTTCAATG
- SF3B1 Ex15-16 F: AACTTAGGTAATGTTGGGGCA, R: TCAACTGACCTGAAATGAAGAGA
- SF3B1 Ex18 F: CCTTGGAAAAGCAGTCTAAAAGG, R: GTCAACCTTTTCTAACCACCCA
4.7. RT-PCR and Sanger Sequencing of CDKN1A and MDM2
- CDKN1A transcript (spanning exons 3 to 4) F: CTGGAGACTCTCAGGGTCGA, R: CTCTTGGAGAAGATCAGCCG
- MDM2 transcript (spanning exons 1 to 11) F: CTGGGGAGTCTTGAGGGACC, R: CTTTCACATCTTCTTGGCTGC
4.8. Immunoblotting
4.9. Lentiviral Transduction and Gene-Edited Cell Lines
4.10. Immunofluorescence Microscopy
4.11. Statistical Analysis
4.12. SWISS-MODEL
5. Conclusions
Supplementary Materials
Author Contributions
Funding
Institutional Review Board Statement
Informed Consent Statement
Data Availability Statement
Acknowledgments
Conflicts of Interest
References
- Vorlova, S.; Rocco, G.; Lefave, C.V.; Jodelka, F.M.; Hess, K.; Hastings, M.L.; Henke, E.; Cartegni, L. Induction of antagonistic soluble decoy receptor tyrosine kinases by intronic polyA activation. Mol. Cell 2011, 43, 927–939. [Google Scholar] [CrossRef] [Green Version]
- Lee, A.R.; Li, Y.; Xie, N.; Gleave, M.E.; Cox, M.E.; Collins, C.C.; Dong, X. Alternative RNA splicing of the MEAF6 gene facilitates neuroendocrine prostate cancer progression. Oncotarget 2017, 8, 27966–27975. [Google Scholar] [CrossRef] [PubMed] [Green Version]
- Munkley, J.; Rajan, P.; Laferty, N.P.; Dalgliesh, C.; Jackson, R.M.; Robson, C.N.; Leung, H.Y.; Elliott, D.J. A novel androgen-regulated isoform of the TSC2 tumour suppressor gene increases cell proliferation. Oncotarget 2014, 5, 131–139. [Google Scholar] [CrossRef] [PubMed] [Green Version]
- Lee, T.S.; Ma, W.L.; Zhang, X.; Giles, F.; Cortes, J.; Kantarjian, H.; Albitar, M. BCR-ABL alternative splicing as a common mechanism for imatinib resistance: Evidence from molecular dynamics simulations. Mol. Cancer Ther. 2008, 7, 3834–3841. [Google Scholar] [CrossRef] [PubMed] [Green Version]
- Avery-Kiejda, K.A.; Zhang, X.D.; Adams, L.J.; Scott, R.J.; Vojtesek, B.; Lane, D.P.; Hersey, P. Small molecular weight variants of p53 are expressed in human melanoma cells and are induced by the DNA-damaging agent cisplatin. Clin. Cancer Res. 2008, 14, 1659–1668. [Google Scholar] [CrossRef] [Green Version]
- Karni, R.; de Stanchina, E.; Lowe, S.W.; Sinha, R.; Mu, D.; Krainer, A.R. The gene encoding the splicing factor SF2/ASF is a proto-oncogene. Nat. Struct. Mol. Biol. 2007, 14, 185–193. [Google Scholar] [CrossRef] [Green Version]
- Obeng, E.A.; Chappell, R.J.; Seiler, M.; Chen, M.C.; Campagna, D.R.; Schmidt, P.J.; Schneider, R.K.; Lord, A.M.; Wang, L.; Gambe, R.G.; et al. Physiologic Expression of Sf3b1(K700E) Causes Impaired Erythropoiesis, Aberrant Splicing, and Sensitivity to Therapeutic Spliceosome Modulation. Cancer Cell 2016, 30, 404–417. [Google Scholar] [CrossRef] [Green Version]
- Fei, D.L.; Motowski, H.; Chatrikhi, R.; Prasad, S.; Yu, J.; Gao, S.J.; Kielkopf, C.L.; Bradley, R.K.; Varmus, H. Wild-Type U2AF1 Antagonizes the Splicing Program Characteristic of U2AF1-Mutant Tumors and Is Required for Cell Survival. PLoS Genet. 2016, 12, e1006384. [Google Scholar] [CrossRef]
- Shirai, C.L.; White, B.S.; Tripathi, M.; Tapia, R.; Ley, J.N.; Ndonwi, M.; Kim, S.; Shao, J.; Carver, A.; Saez, B.; et al. Mutant U2AF1-expressing cells are sensitive to pharmacological modulation of the spliceosome. Nat. Commun. 2017, 8, 14060. [Google Scholar] [CrossRef] [Green Version]
- Lee, S.C.W.; Abdel-Wahab, O. Therapeutic targeting of splicing in cancer. Nat. Med. 2016, 22, 976–986. [Google Scholar] [CrossRef]
- Nakajima, H.; Hori, Y.; Terano, H.; Okuhara, M.; Manda, T.; Matsumoto, S.; Shimomura, K. New antitumor substances, FR901463, FR901464 and FR901465. II. Activities against experimental tumors in mice and mechanism of action. J. Antibiot. 1996, 49, 1204–1211. [Google Scholar] [CrossRef]
- Kaida, D.; Motoyoshi, H.; Tashiro, E.; Nojima, T.; Hagiwara, M.; Ishigami, K.; Watanabe, H.; Kitahara, T.; Yoshida, T.; Nakajima, H.; et al. Spliceostatin A targets SF3b and inhibits both splicing and nuclear retention of pre-mRNA. Nat. Chem. Biol. 2007, 3, 576–583. [Google Scholar] [CrossRef] [PubMed]
- Fan, L.; Lagisetti, C.; Edwards, C.C.; Webb, T.R.; Potter, P.M. Sudemycins, novel small molecule analogues of FR901464, induce alternative gene splicing. ACS Chem. Biol. 2011, 6, 582–589. [Google Scholar] [CrossRef] [PubMed] [Green Version]
- Kotake, Y.; Sagane, K.; Owa, T.; Mimori-Kiyosue, Y.; Shimizu, H.; Uesugi, M.; Ishihama, Y.; Iwata, M.; Mizui, Y. Splicing factor SF3b as a target of the antitumor natural product pladienolide. Nat. Chem. Biol. 2007, 3, 570–575. [Google Scholar] [CrossRef]
- Iwata, M.; Ozawa, Y.; Uenaka, T.; Shimizu, H.; Niijima, J.; Kanada, R.; Fukuda, Y.; Nagai, M.; Kotake, Y.; Yoshida, M. E7107, a new 7-urethane derivative of pladienolide D, displays curative effect against several human tumor xenografts. Cancer Res. 2004, 64, 691. [Google Scholar]
- Mizui, Y.; Sakai, T.; Iwata, M.; Uenaka, T.; Okamoto, K.; Shimizu, H.; Yamori, T.; Yoshimatsu, K.; Asada, M. Pladienolides, new substances from culture of Streptomyces platensis Mer-11107. III. In vitro and in vivo antitumor activities. J. Antibiot. 2004, 57, 188–196. [Google Scholar] [CrossRef] [PubMed] [Green Version]
- Folco, E.G.; Coil, K.E.; Reed, R. The anti-tumor drug E7107 reveals an essential role for SF3b in remodeling U2 snRNP to expose the branch point-binding region. Genes Dev. 2011, 25, 440–444. [Google Scholar] [CrossRef] [Green Version]
- Chan, S.; Sridhar, P.; Kirchner, R.; Lock, Y.J.; Herbert, Z.; Buonamici, S.; Smith, P.; Lieberman, J.; Petrocca, F. Basal-A Triple-Negative Breast Cancer Cells Selectively Rely on RNA Splicing for Survival. Mol. Cancer Ther. 2017, 16, 2849–2861. [Google Scholar] [CrossRef] [Green Version]
- Ten Hacken, E.; Valentin, R.; Regis, F.F.D.; Sun, J.; Yin, S.; Werner, L.; Deng, J.; Gruber, M.; Wong, J.; Zheng, M.; et al. Splicing modulation sensitizes chronic lymphocytic leukemia cells to venetoclax by remodeling mitochondrial apoptotic dependencies. JCI Insight 2018, 3, 19. [Google Scholar] [CrossRef] [Green Version]
- Brown, C.J.; Lain, S.; Verma, C.S.; Fersht, A.R.; Lane, D.P. Awakening guardian angels: Drugging the p53 pathway. Nat. Rev. Cancer 2009, 9, 862–873. [Google Scholar] [CrossRef]
- Ding, Q.; Zhang, Z.; Liu, J.J.; Jiang, N.; Zhang, J.; Ross, T.M.; Chu, X.J.; Bartkovitz, D.; Podlaski, F.; Janson, C.; et al. Discovery of RG7388, a potent and selective p53-MDM2 inhibitor in clinical development. J. Med. Chem. 2013, 56, 5979–5983. [Google Scholar] [CrossRef] [PubMed]
- Chen, L.D.; Rousseau, R.F.; Middleton, S.A.; Nichols, G.L.; Newell, D.R.; Lunec, J.; Tweddle, D.A. Pre-clinical evaluation of the MDM2-p53 antagonist RG7388 alone and in combination with chemotherapy in neuroblastoma. Oncotarget 2015, 6, 10207–10221. [Google Scholar] [CrossRef] [Green Version]
- Zanjirband, M.; Edmondson, R.J.; Lunec, J. Pre-clinical efficacy and synergistic potential of the MDM2-p53 antagonists, Nutlin-3 and RG7388, as single agents and in combined treatment with cisplatin in ovarian cancer. Oncotarget 2016, 7, 40115–40134. [Google Scholar] [CrossRef] [PubMed] [Green Version]
- Wu, C.E.; Esfandiari, A.; Ho, Y.H.; Wang, N.; Mahdi, A.K.; Aptullahoglu, E.; Lovat, P.; Lunec, J. Targeting negative regulation of p53 by MDM2 and WIP1 as a therapeutic strategy in cutaneous melanoma. Br. J. Cancer 2018, 118, 495–508. [Google Scholar] [CrossRef] [PubMed] [Green Version]
- Chamberlain, V.; Drew, Y.; Lunec, J. Tipping Growth Inhibition into Apoptosis by Combining Treatment with MDM2 and WIP1 Inhibitors in p53(WT) Uterine Leiomyosarcoma. Cancers 2021, 14, 14. [Google Scholar] [CrossRef] [PubMed]
- Ciardullo, C.; Aptullahoglu, E.; Woodhouse, L.; Lin, W.Y.; Wallis, J.P.; Marr, H.; Marshall, S.; Bown, N.; Willmore, E.; Lunec, J. Non-genotoxic MDM2 inhibition selectively induces pro-apoptotic p53 gene signature in chronic lymphocytic leukemia cells. Haematologica 2019, 104, 2429. [Google Scholar] [CrossRef] [Green Version]
- Italiano, A.; Miller, W.H., Jr.; Blay, J.Y.; Gietema, J.A.; Bang, Y.J.; Mileshkin, L.R.; Hirte, H.W.; Higgins, B.; Blotner, S.; Nichols, G.L.; et al. Phase I study of daily and weekly regimens of the orally administered MDM2 antagonist idasanutlin in patients with advanced tumors. Invest. New Drugs 2021, 39, 1587–1597. [Google Scholar] [CrossRef]
- Daver, N.G.; Dail, M.; Garcia, J.S.; Jonas, B.A.; Yee, K.W.L.; Kelly, K.R.; Vey, N.; Assouline, S.; Roboz, G.J.; Paolini, S.; et al. Venetoclax and idasanutlin in relapsed/refractory AML: A non-randomized, open-label phase 1b trial. Blood 2022, 1, 6362. [Google Scholar] [CrossRef]
- Yee, K.; Papayannidis, C.; Vey, N.; Dickinson, M.J.; Kelly, K.R.; Assouline, S.; Kasner, M.; Seiter, K.; Drummond, M.W.; Yoon, S.S.; et al. Murine double minute 2 inhibition alone or with cytarabine in acute myeloid leukemia: Results from an idasanutlin phase 1/1b study small star, filled. Leuk. Res. 2021, 100, 106489. [Google Scholar] [CrossRef]
- Oliner, J.D.; Kinzler, K.W.; Meltzer, P.S.; George, D.L.; Vogelstein, B. Amplification of a gene encoding a p53-associated protein in human sarcomas. Nature 1992, 358, 80–83. [Google Scholar] [CrossRef] [Green Version]
- el-Deiry, W.S.; Harper, J.W.; O’Connor, P.M.; Velculescu, V.E.; Canman, C.E.; Jackman, J.; Pietenpol, J.A.; Burrell, M.; Hill, D.E.; Wang, Y.; et al. WAF1/CIP1 is induced in p53-mediated G1 arrest and apoptosis. Cancer Res. 1994, 54, 1169–1174. [Google Scholar]
- el-Deiry, W.S.; Tokino, T.; Velculescu, V.E.; Levy, D.B.; Parsons, R.; Trent, J.M.; Lin, D.; Mercer, W.E.; Kinzler, K.W.; Vogelstein, B. WAF1, a potential mediator of p53 tumor suppression. Cell 1993, 75, 817–825. [Google Scholar] [CrossRef]
- Yadav, B.; Wennerberg, K.; Aittokallio, T.; Tang, J. Searching for Drug Synergy in Complex Dose-Response Landscapes Using an Interaction Potency Model. Comput. Struct. Biotec. 2015, 13, 504–513. [Google Scholar] [CrossRef] [PubMed] [Green Version]
- Sarraf Yazdy, M.; Mato, A.R.; Cheson, B.D. Combinations or sequences of targeted agents in CLL: Is the whole greater than the sum of its parts (Aristotle, 360 BC)? Blood 2019, 133, 121–129. [Google Scholar] [CrossRef] [Green Version]
- Surget, S.; Khoury, M.P.; Bourdon, J.C. Uncovering the role of p53 splice variants in human malignancy: A clinical perspective. Oncotargets Ther. 2014, 7, 57–67. [Google Scholar] [CrossRef] [Green Version]
- Bourdon, J.C.; Fernandes, K.; Murray-Zmijewski, F.; Liu, G.; Diot, A.; Xirodimas, D.P.; Saville, M.K.; Lane, D.P. p53 isoforms can regulate p53 transcriptional activity. Genes Dev. 2005, 19, 2122–2137. [Google Scholar] [CrossRef] [PubMed] [Green Version]
- Zhang, D.X.; Hu, Q.; Liu, X.Z.; Ji, Y.B.; Chao, H.P.; Liu, Y.; Tracz, A.; Kirk, J.; Buonamici, S.; Zhu, P.; et al. Intron retention is a hallmark and spliceosome represents a therapeutic vulnerability in aggressive prostate cancer. Nat. Commun. 2020, 11, 2089. [Google Scholar] [CrossRef]
- Lee, S.C.W.; Dvinge, H.; Kim, E.; Cho, H.; Micol, J.B.; Chung, Y.R.; Durham, B.H.; Yoshimi, A.; Kim, Y.J.; Thomas, M.; et al. Modulation of splicing catalysis for therapeutic targeting of leukemia with mutations in genes encoding spliceosomal proteins. Nat. Med. 2016, 22, 672–678, Erratum in Nat. Med. 2016, 22, 692. [Google Scholar] [CrossRef] [Green Version]
- Zou, C.; Zhang, D.X. The spliceosome as a new therapeutic vulnerability in aggressive prostate cancer. Mol. Cell. Oncol. 2020, 7, 1778420. [Google Scholar] [CrossRef]
- Sciarrillo, R.; Wojtuszkiewicz, A.; El Hassouni, B.; Funel, N.; Gandellini, P.; Lagerweij, T.; Buonamici, S.; Blijlevens, M.; van der Laan, E.A.Z.; Zaffaroni, N.; et al. Splicing modulation as novel therapeutic strategy against diffuse malignant peritoneal mesothelioma. Ebiomedicine 2019, 39, 215–225. [Google Scholar] [CrossRef] [Green Version]
- Sollier, J.; Cimprich, K.A. Breaking bad: R-loops and genome integrity. Trends Cell Biol. 2015, 25, 514–522. [Google Scholar] [CrossRef] [Green Version]
- Santos-Pereira, J.M.; Aguilera, A. R loops: New modulators of genome dynamics and function. Nat. Rev. Genet. 2015, 16, 583–597. [Google Scholar] [CrossRef] [PubMed]
- Aguilera, A. The connection between transcription and genomic instability. Embo J. 2002, 21, 195–201. [Google Scholar] [CrossRef] [PubMed]
- Chen, L.; Chen, J.Y.; Huang, Y.J.; Gu, Y.; Qiu, J.S.; Qian, H.; Shao, C.W.; Zhang, X.; Hu, J.; Li, H.R.; et al. The Augmented R-Loop Is a Unifying Mechanism for Myelodysplastic Syndromes Induced by High-Risk Splicing Factor Mutations. Mol. Cell 2018, 69, 412. [Google Scholar] [CrossRef] [Green Version]
- Nguyen, H.D.; Leong, W.Y.; Li, W.L.; Reddy, P.N.G.; Sullivan, J.D.; Walter, M.J.; Zou, L.; Graubert, T.A. Spliceosome Mutations Induce R Loop-Associated Sensitivity to ATR Inhibition in Myelodysplastic Syndromes. Cancer Res. 2018, 78, 5363–5374. [Google Scholar] [CrossRef] [PubMed] [Green Version]
- Hong, D.S.; Kurzrock, R.; Naing, A.; Wheler, J.J.; Falchook, G.S.; Schiffman, J.S.; Faulkner, N.; Pilat, M.J.; O’Brien, J.; LoRusso, P. A phase I, open-label, single-arm, dose-escalation study of E7107, a precursor messenger ribonucleic acid (pre-mRNA) splicesome inhibitor administered intravenously on days 1 and 8 every 21 days to patients with solid tumors. Investig. New Drugs 2014, 32, 436–444. [Google Scholar] [CrossRef]
- Seiler, M.; Yoshimi, A.; Darman, R.; Chan, B.; Keaney, G.; Thomas, M.; Agrawal, A.A.; Caleb, B.; Csibi, A.; Sean, E.; et al. H3B-8800, an orally available small-molecule splicing modulator, induces lethality in spliceosome-mutant cancers. Nat. Med. 2018, 24, 497. [Google Scholar] [CrossRef]
- Hallek, M.; Cheson, B.D.; Catovsky, D.; Caligaris-Cappio, F.; Dighiero, G.; Dohner, H.; Hillmen, P.; Keating, M.J.; Montserrat, E.; Rai, K.R.; et al. Guidelines for the diagnosis and treatment of chronic lymphocytic leukemia: A report from the International Workshop on Chronic Lymphocytic Leukemia updating the National Cancer Institute-Working Group 1996 guidelines. Blood 2008, 111, 5446–5456. [Google Scholar] [CrossRef] [Green Version]
- Chou, T.C. Theoretical basis, experimental design, and computerized simulation of synergism and antagonism in drug combination studies. Pharmacol. Rev. 2006, 58, 621–681. [Google Scholar] [CrossRef]
- Arnold, K.; Bordoli, L.; Kopp, J.; Schwede, T. The SWISS-MODEL workspace: A web-based environment for protein structure homology modelling. Bioinformatics 2006, 22, 195–201. [Google Scholar] [CrossRef] [Green Version]


Disclaimer/Publisher’s Note: The statements, opinions and data contained in all publications are solely those of the individual author(s) and contributor(s) and not of MDPI and/or the editor(s). MDPI and/or the editor(s) disclaim responsibility for any injury to people or property resulting from any ideas, methods, instructions or products referred to in the content. |
© 2023 by the authors. Licensee MDPI, Basel, Switzerland. This article is an open access article distributed under the terms and conditions of the Creative Commons Attribution (CC BY) license (https://creativecommons.org/licenses/by/4.0/).
Share and Cite
Aptullahoglu, E.; Ciardullo, C.; Wallis, J.P.; Marr, H.; Marshall, S.; Bown, N.; Willmore, E.; Lunec, J. Splicing Modulation Results in Aberrant Isoforms and Protein Products of p53 Pathway Genes and the Sensitization of B Cells to Non-Genotoxic MDM2 Inhibition. Int. J. Mol. Sci. 2023, 24, 2410. https://doi.org/10.3390/ijms24032410
Aptullahoglu E, Ciardullo C, Wallis JP, Marr H, Marshall S, Bown N, Willmore E, Lunec J. Splicing Modulation Results in Aberrant Isoforms and Protein Products of p53 Pathway Genes and the Sensitization of B Cells to Non-Genotoxic MDM2 Inhibition. International Journal of Molecular Sciences. 2023; 24(3):2410. https://doi.org/10.3390/ijms24032410
Chicago/Turabian StyleAptullahoglu, Erhan, Carmela Ciardullo, Jonathan P. Wallis, Helen Marr, Scott Marshall, Nick Bown, Elaine Willmore, and John Lunec. 2023. "Splicing Modulation Results in Aberrant Isoforms and Protein Products of p53 Pathway Genes and the Sensitization of B Cells to Non-Genotoxic MDM2 Inhibition" International Journal of Molecular Sciences 24, no. 3: 2410. https://doi.org/10.3390/ijms24032410