
5-Aza-2′-Deoxycytidine Alters the Methylation Profile of Bortezomib-Resistant U266 Multiple Myeloma Cells and Affects Their Proliferative Potential
 , , and
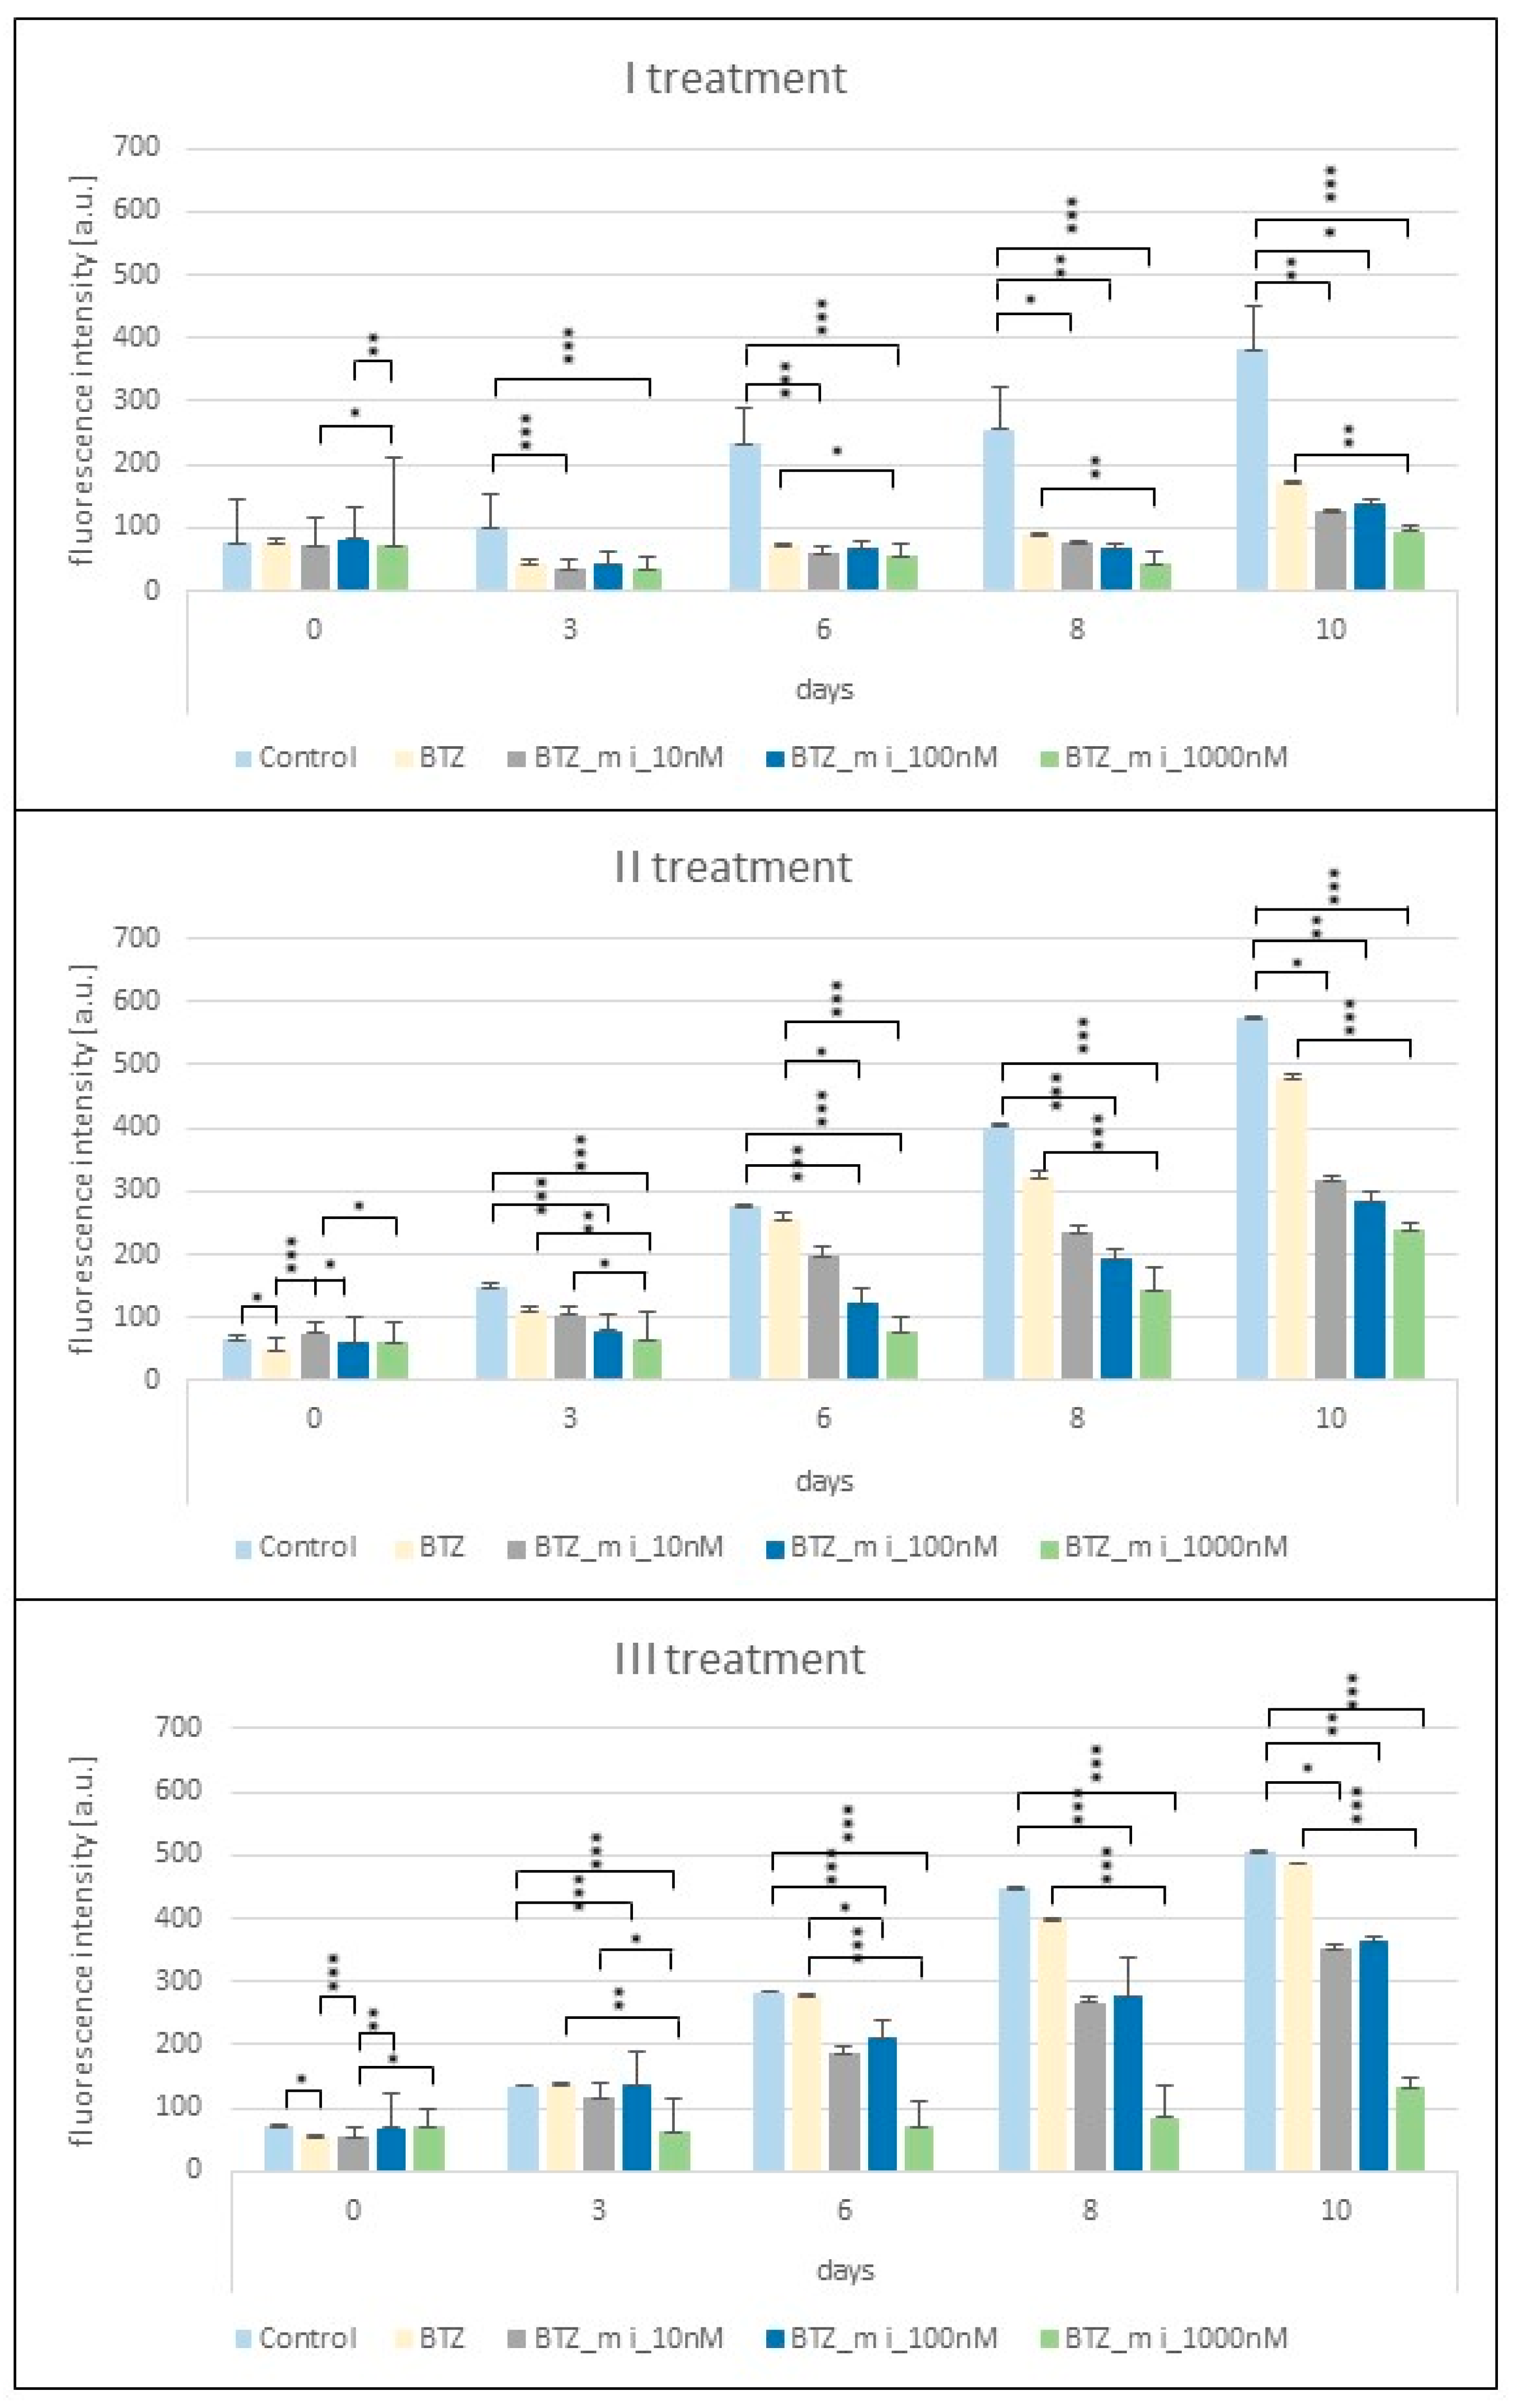
Abstract
:1. Introduction
2. Results
2.1. Proliferation Assay
2.2. Effect of a Methylation Inhibitor on the Development of BTZ Resistance in U266 Myeloma Cells
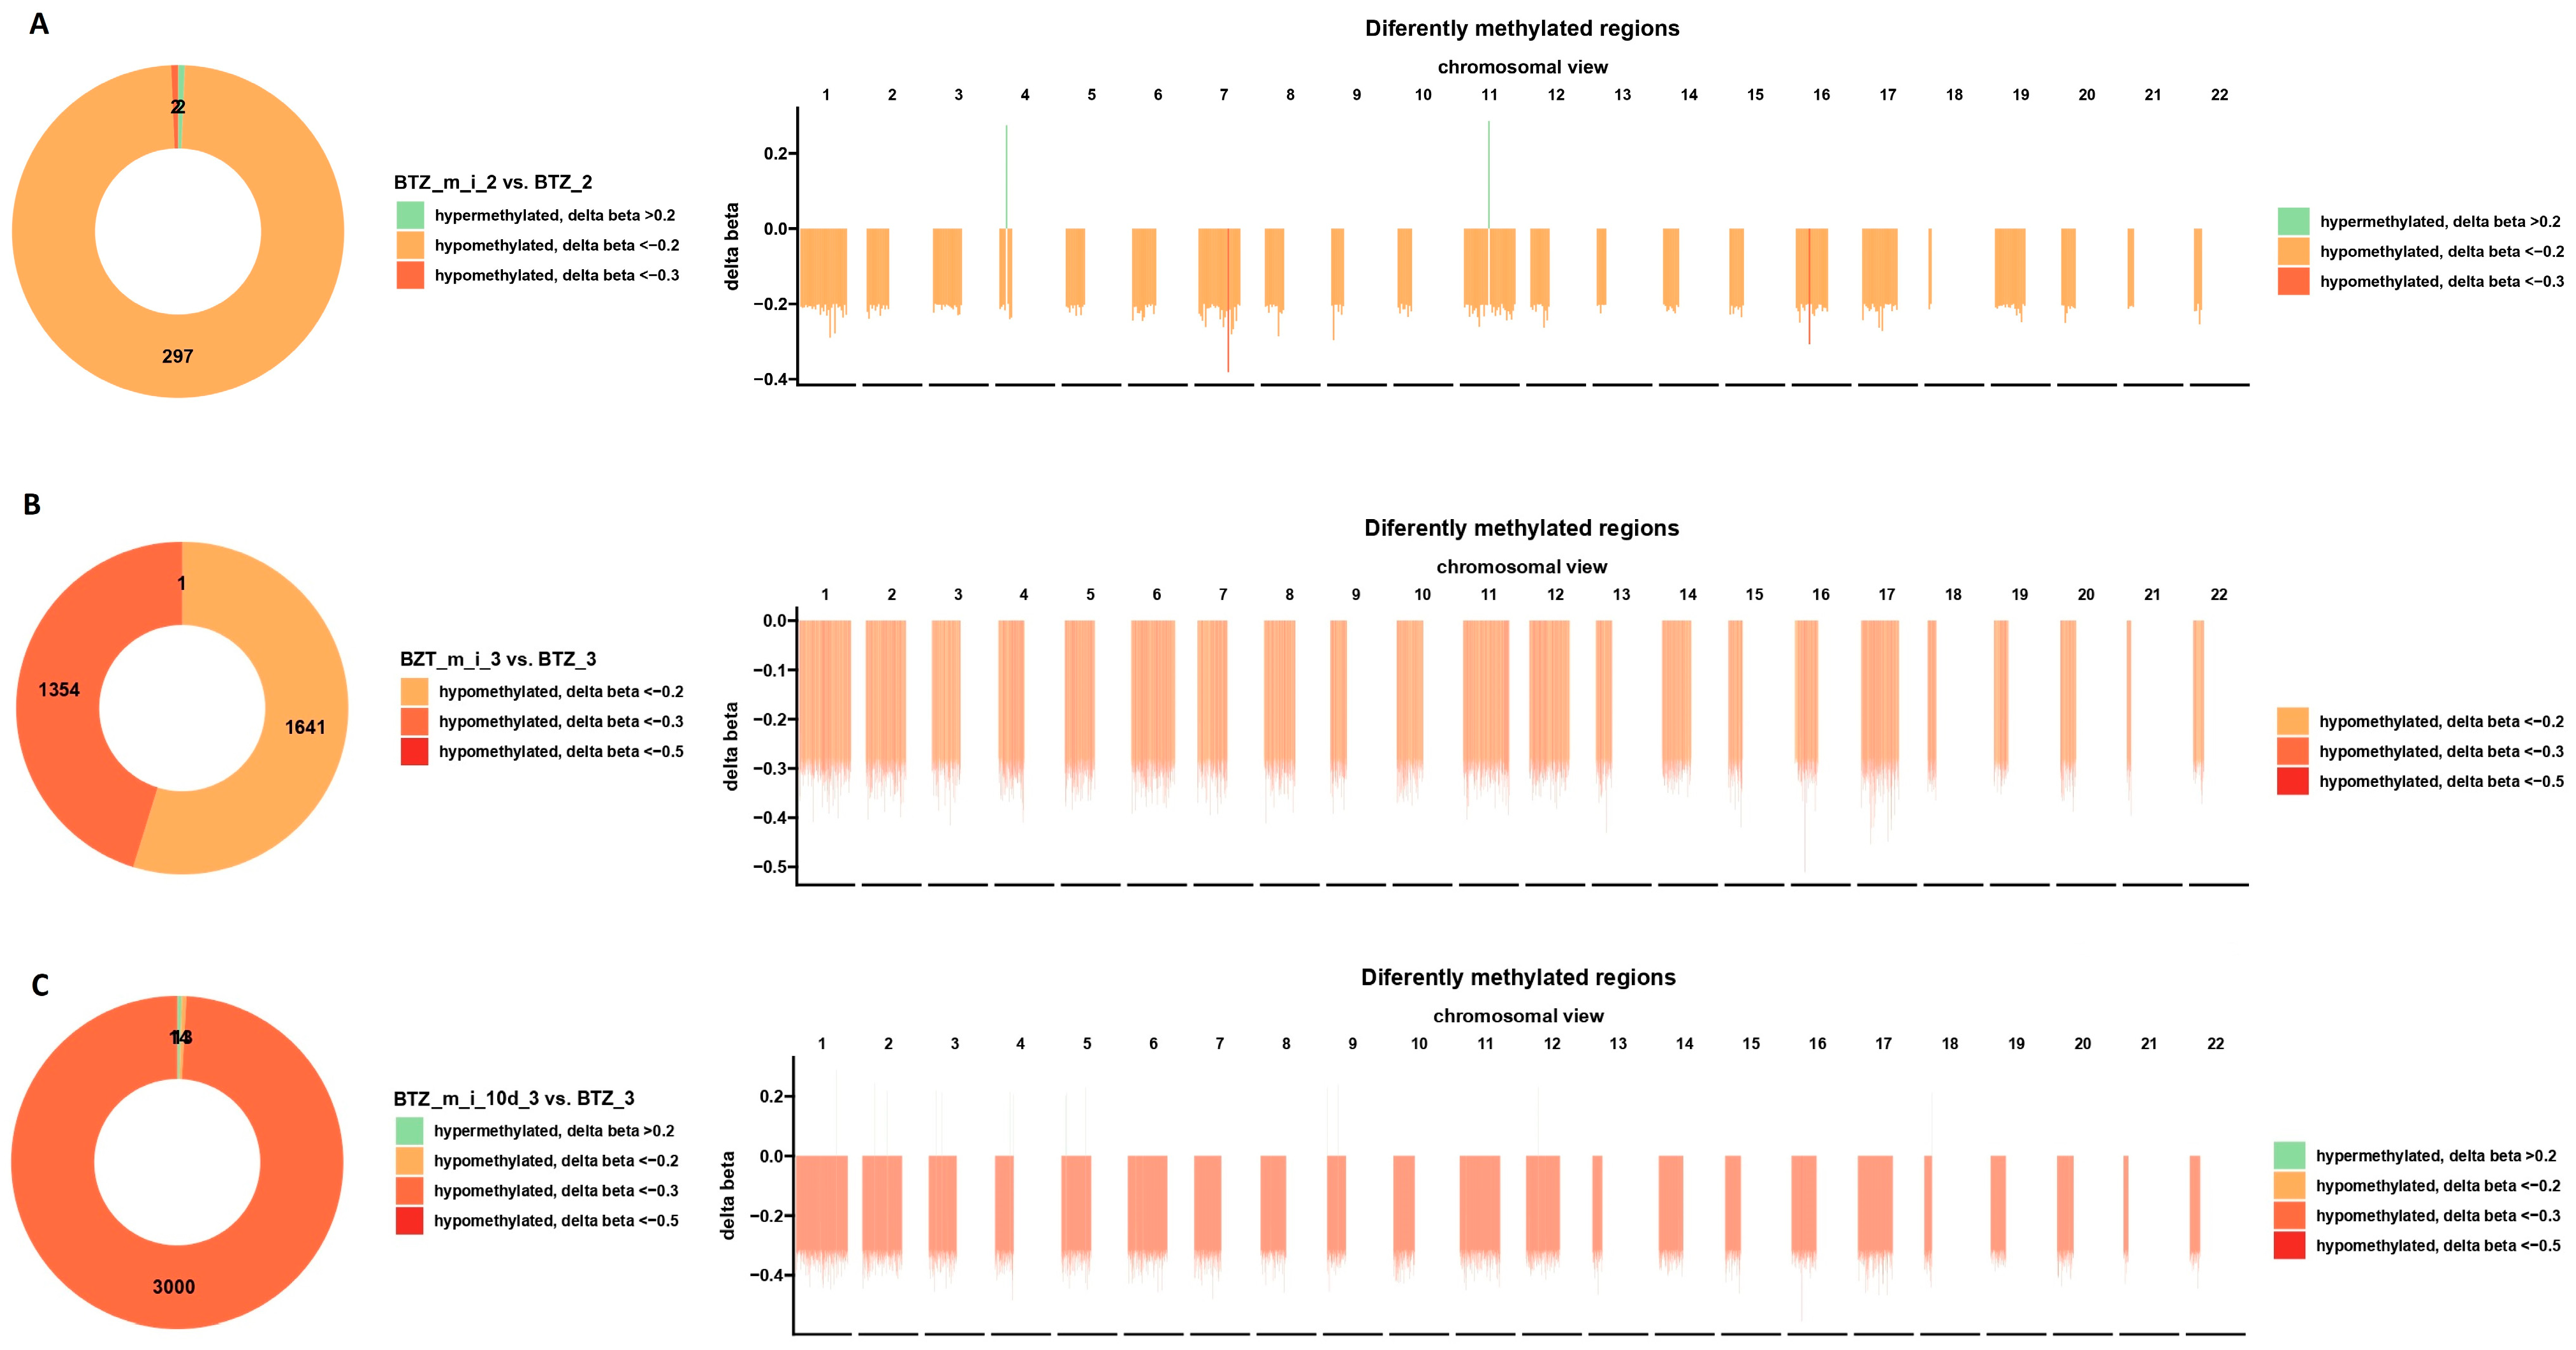
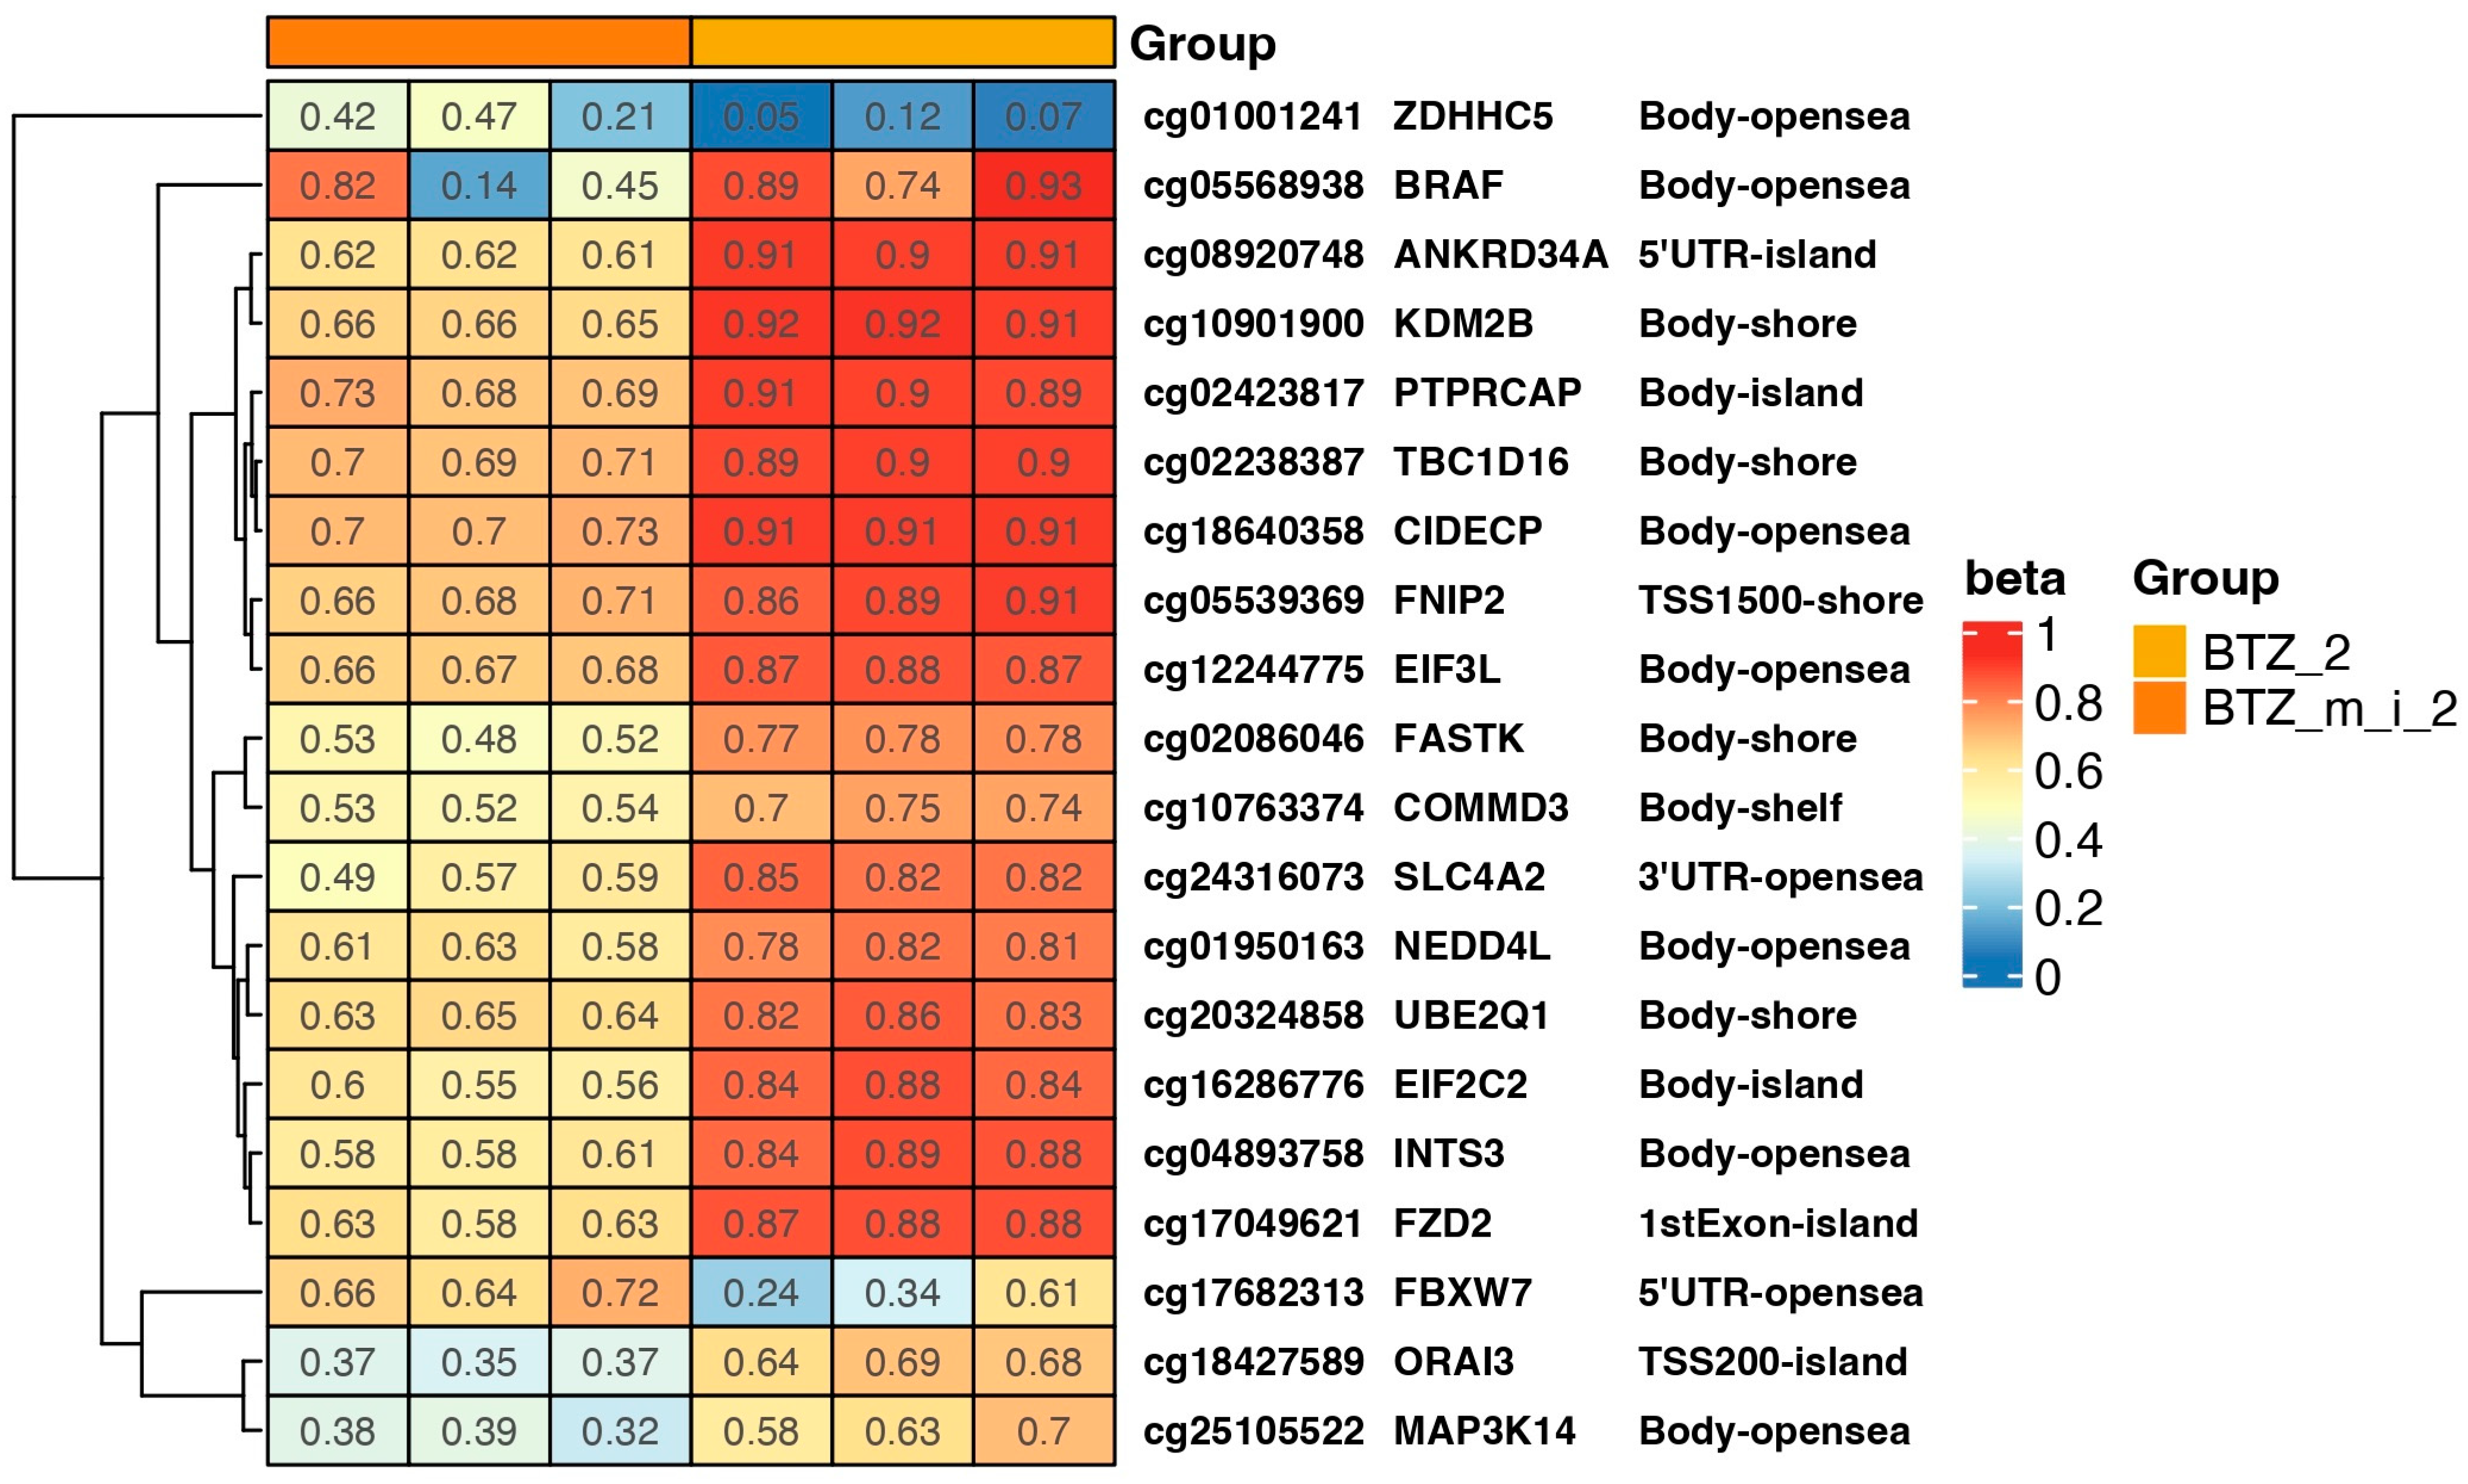
2.3. Results of DNA Methylation Profile Analysis Obtained after Two Treatments
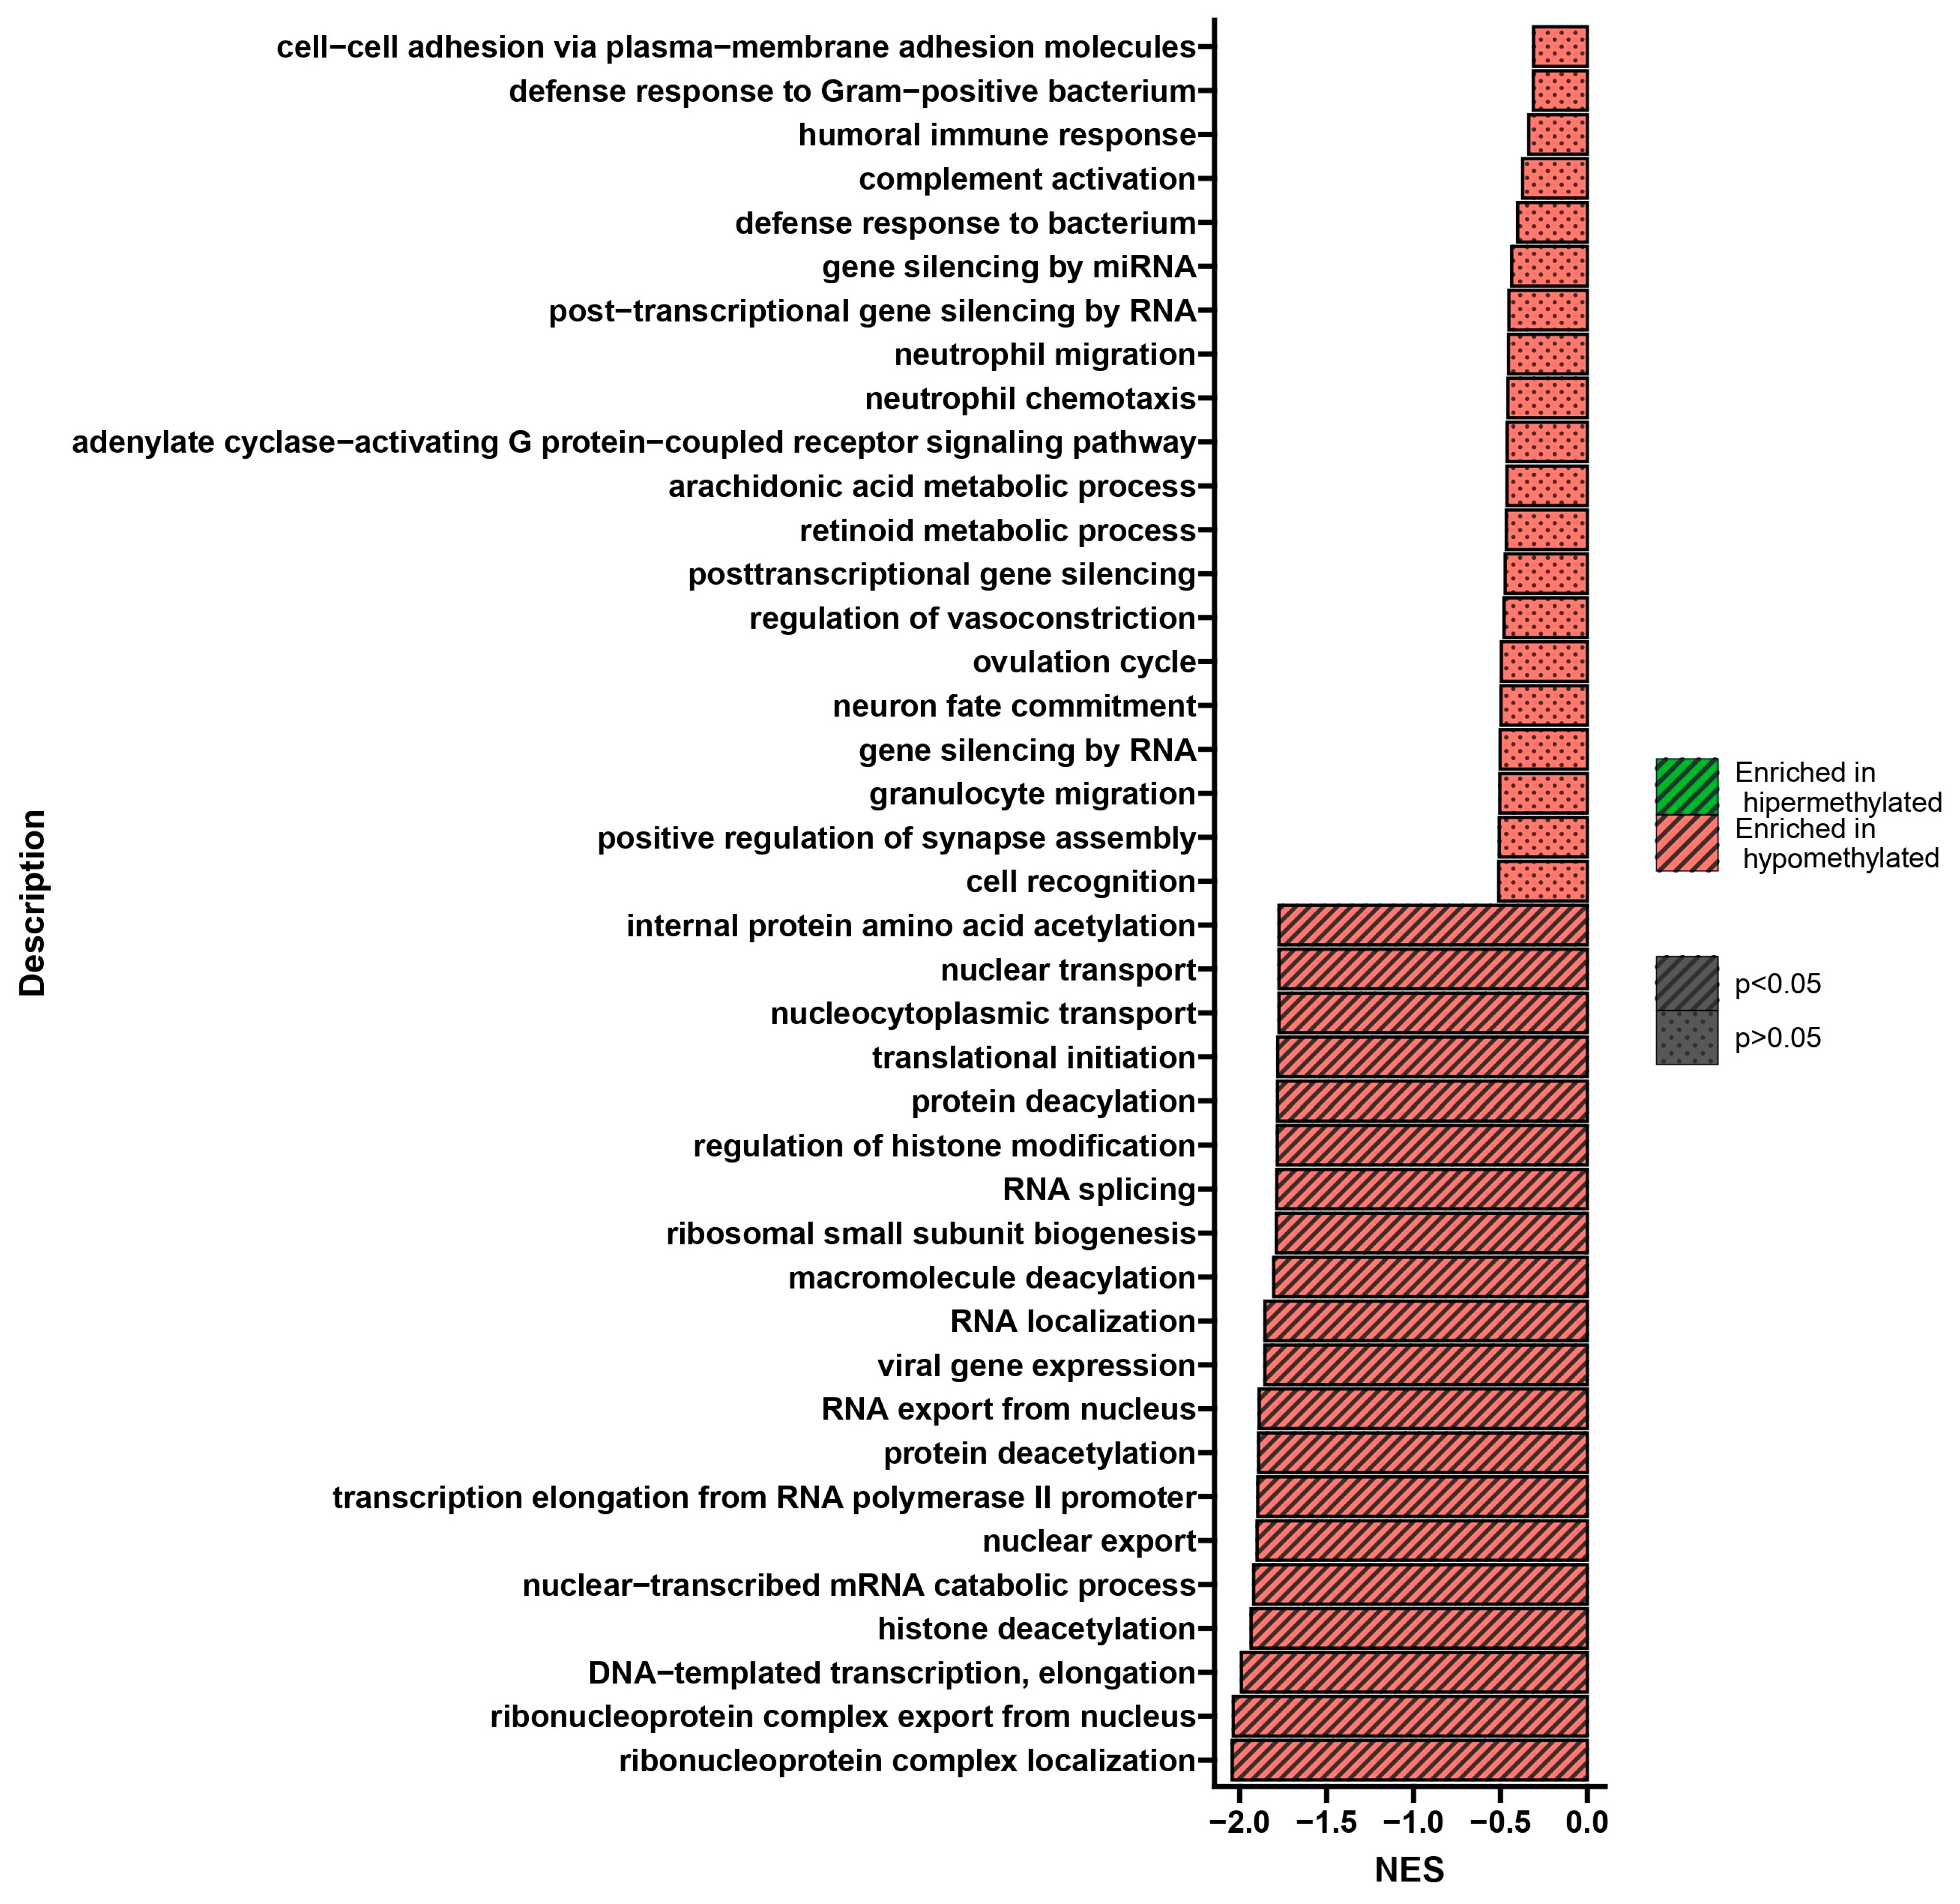
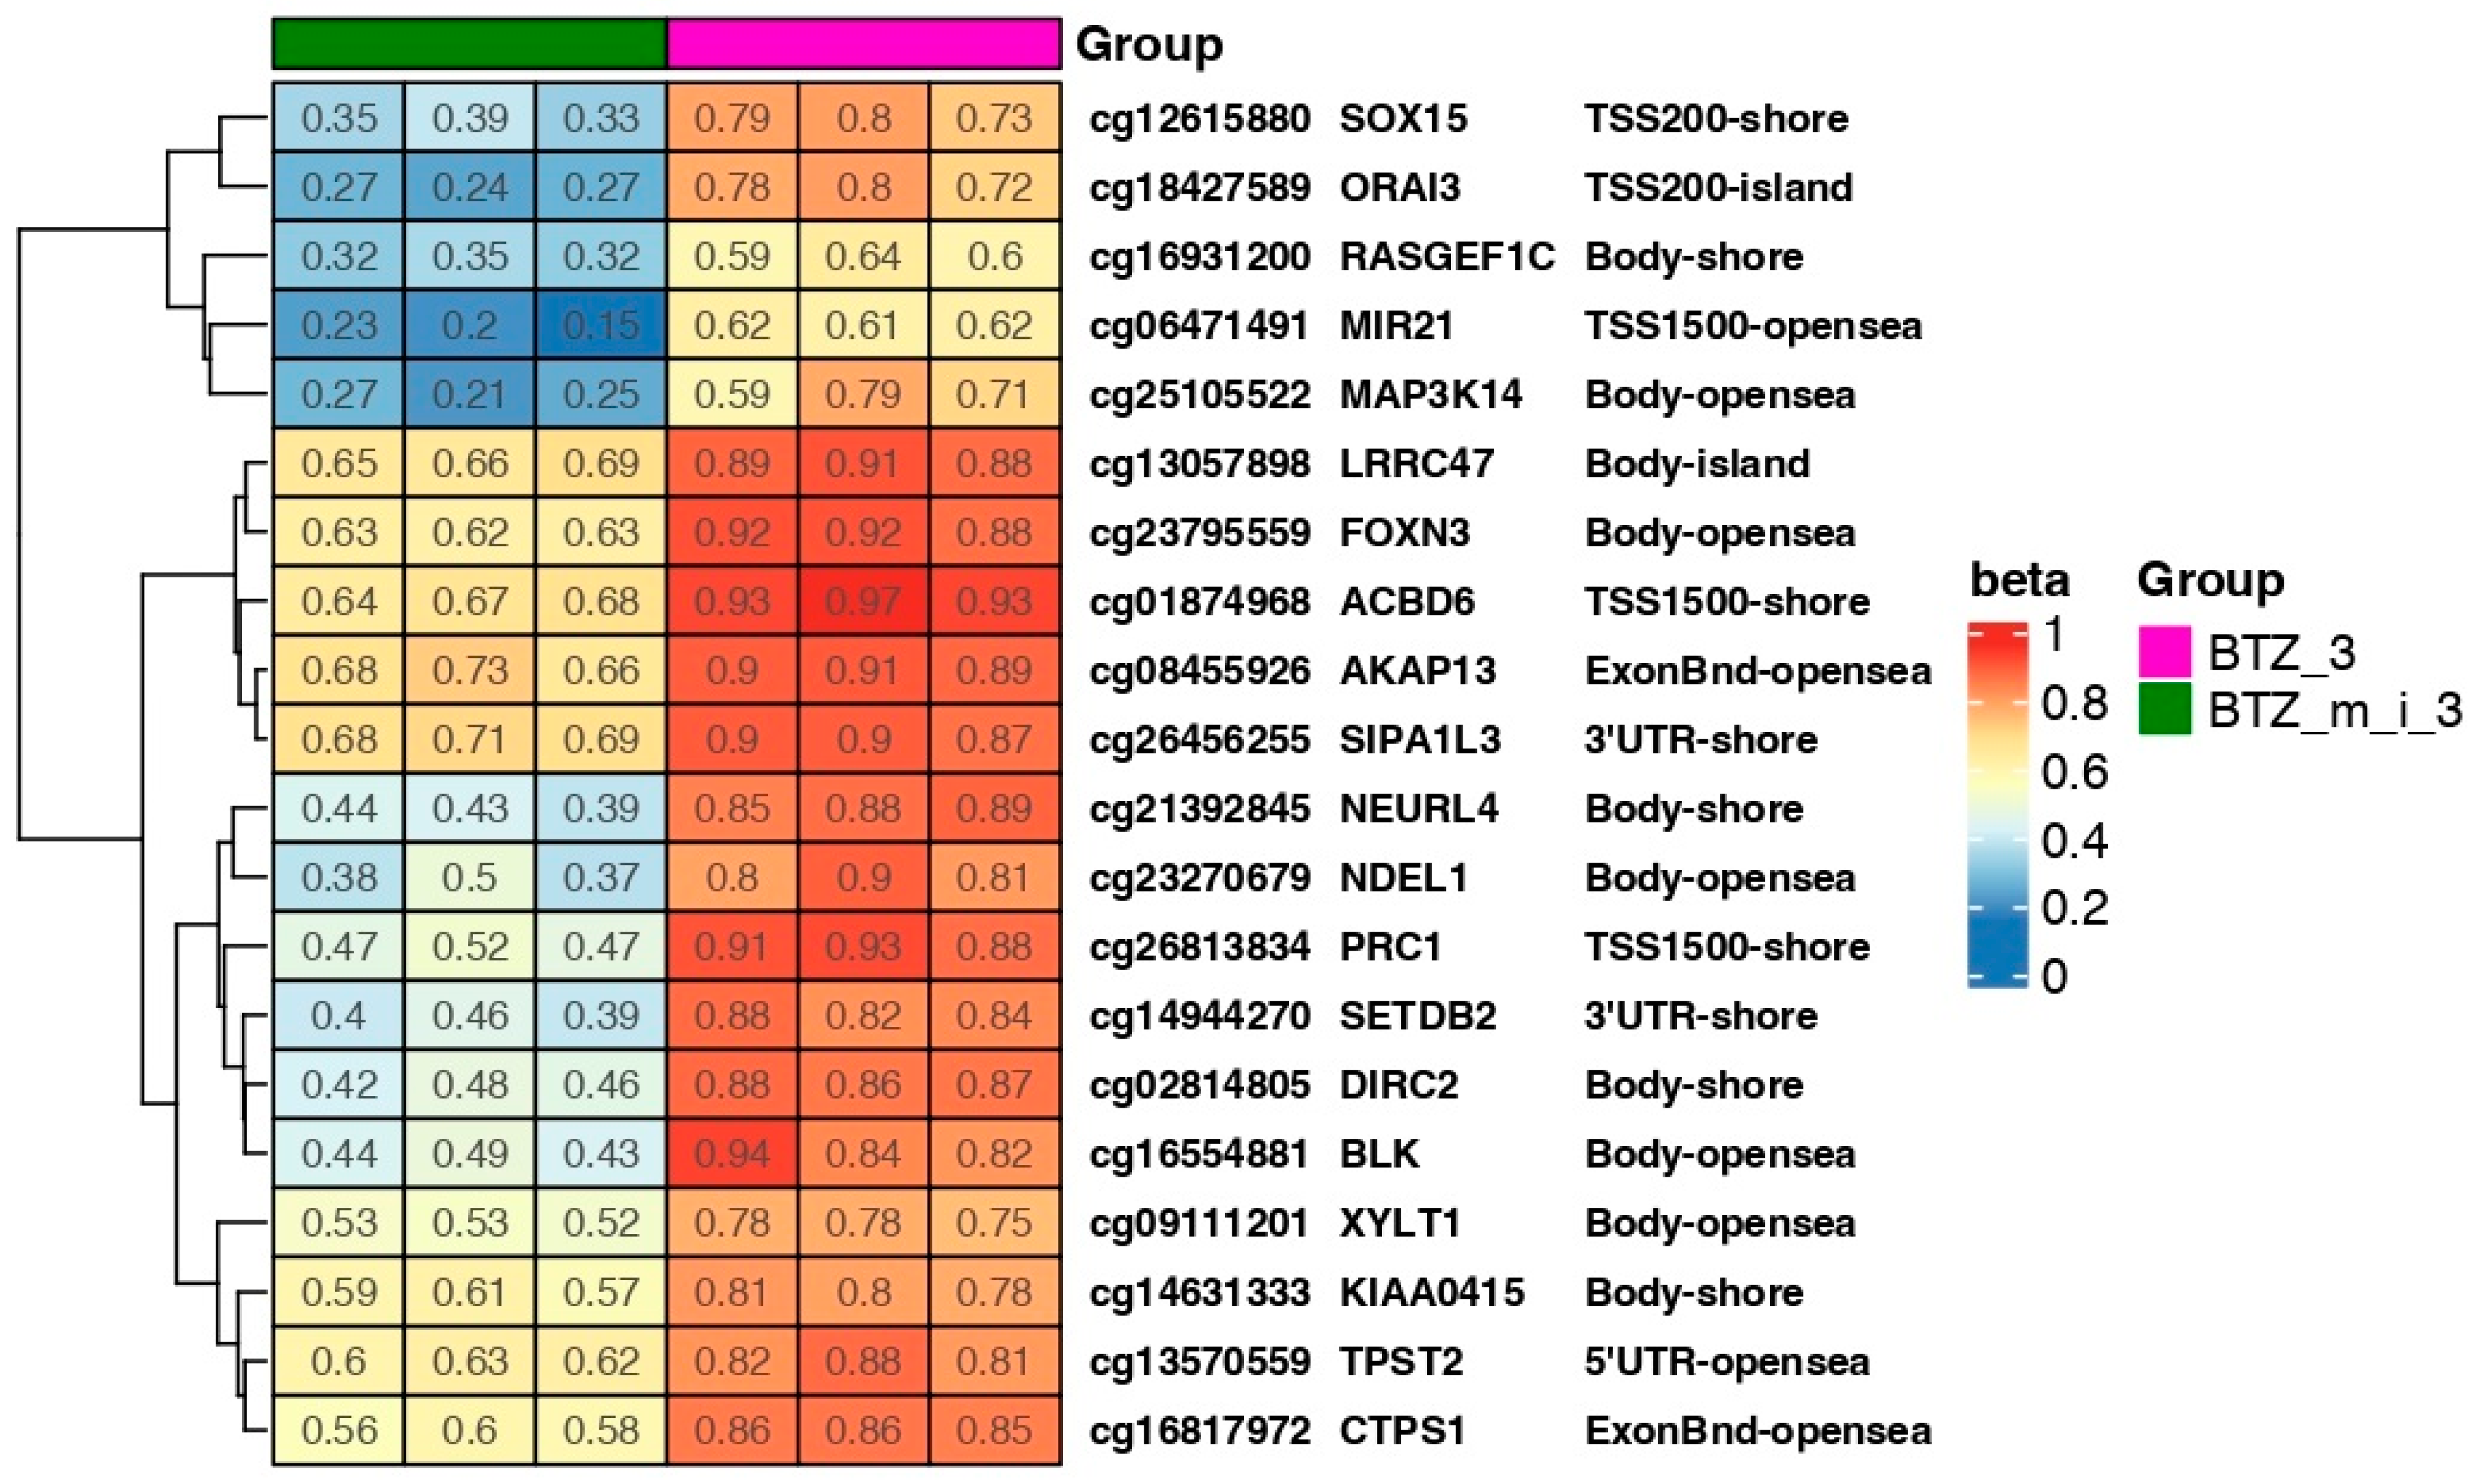
2.4. Results of DNA Methylation Profile Analysis Obtained after Three Treatments
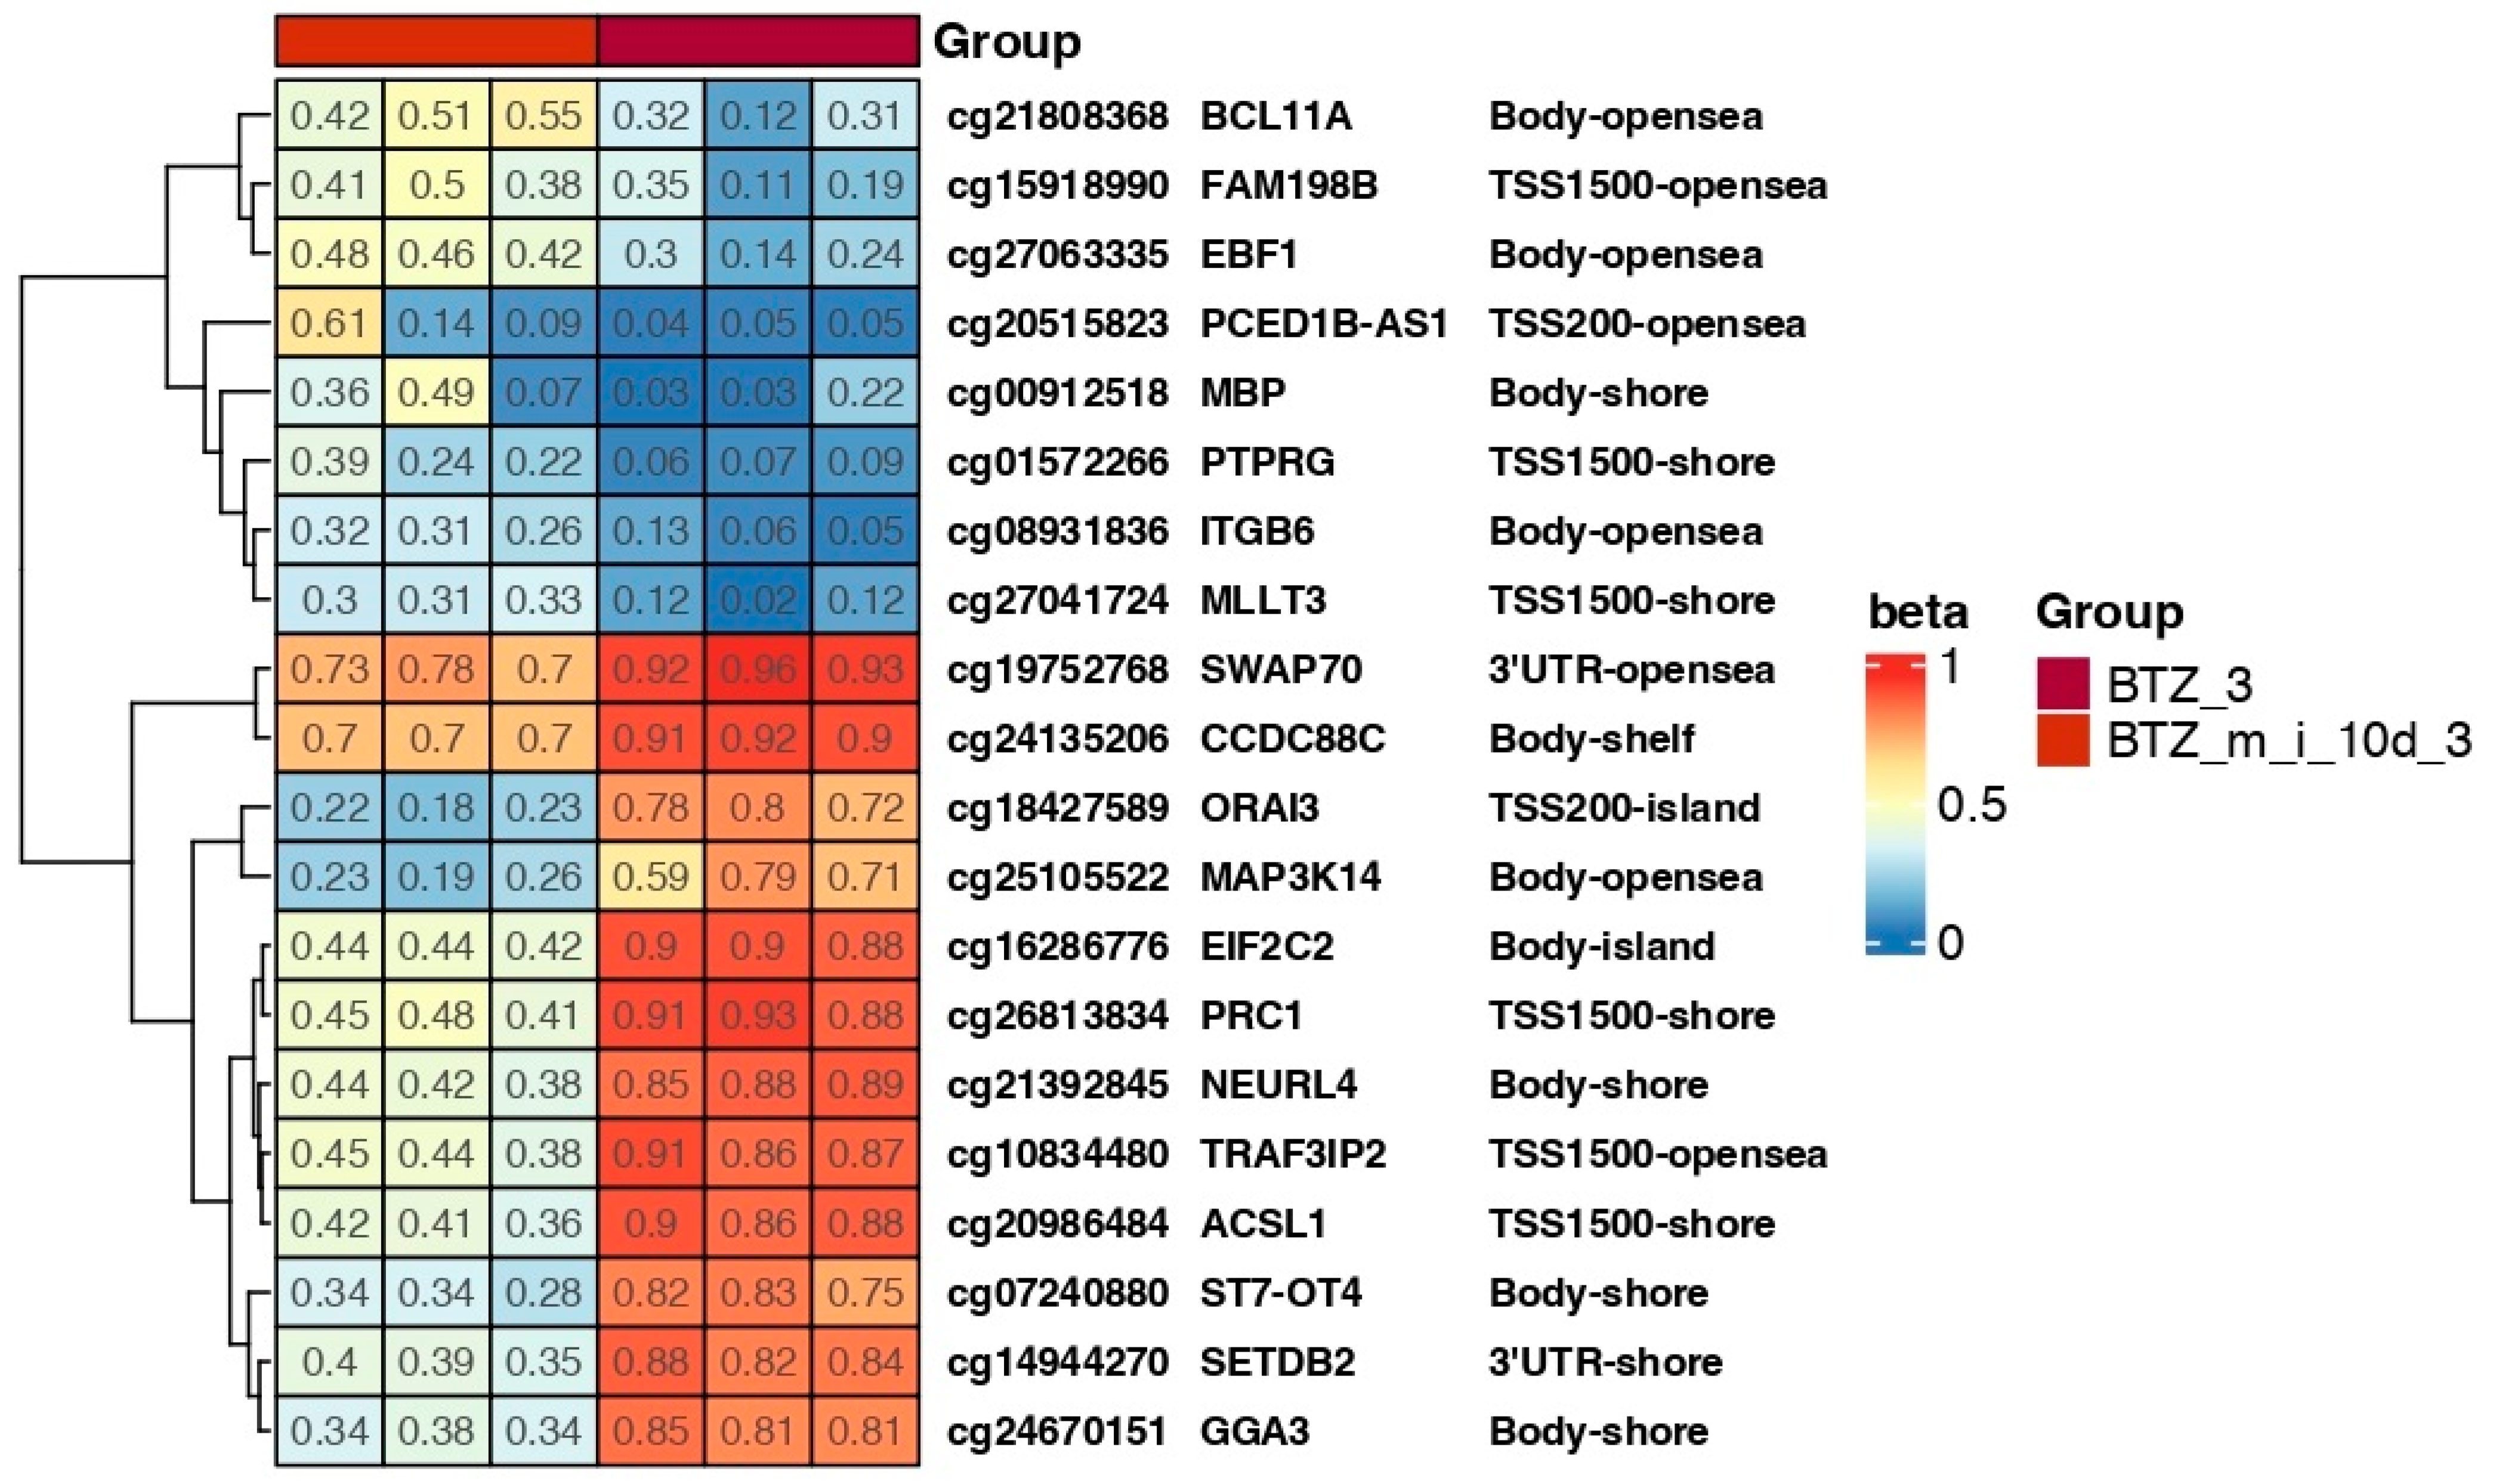
2.5. Results of DNA Methylation Profile Analysis Obtained 10 Days after the Third Treatment
3. Discussion
4. Materials and Methods
4.1. Cell Culture and Course of the Experiment
4.2. DNA Extraction and Bisulfite Conversion
4.3. Methylation Arrays
4.4. Dose Titration of 5-Aza-2′-Deoxycytidine
4.5. Bioinformatics Analysis of Genome-Wide Methylation
5. Conclusions
6. Study Limitations
Author Contributions
Funding
Institutional Review Board Statement
Informed Consent Statement
Data Availability Statement
Conflicts of Interest
References
- Huang, J.; Chan, S.C.; Lok, V.; Zhang, L.; Lucero-Prisno, D.E.; Xu, W.; Zheng, Z.J.; Elcarte, E.; Withers, M.; Wong, M.C.S.; et al. The epidemiological landscape of multiple myeloma: A global cancer registry estimate of disease burden, risk factors, and temporal trends. Lancet Haematol. 2022, 9, e670–e677. [Google Scholar] [CrossRef]
- Diamond, E.; Lahoud, O.B.; Landau, H. Managing multiple myeloma in elderly patients. Leuk. Lymphoma 2018, 59, 1300–1311. [Google Scholar] [CrossRef]
- Jurczyszyn, A.; Suska, A. Multiple Myeloma. In Reference Module in Biomedical Sciences; Elsevier: Amsterdam, The Netherlands, 2019; p. B9780128012383114126. [Google Scholar]
- Rajkumar, S.V. Multiple myeloma: 2020 update on diagnosis, risk-stratification and management. Am. J. Hematol. 2020, 95, 548–567. [Google Scholar] [CrossRef]
- Medical Masterclass Contributors; Firth, J. Haematology: Multiple myeloma. Clin. Med. 2019, 19, 58–60. [Google Scholar]
- Dhodapkar, M.V. MGUS to myeloma: A mysterious gammopathy of underexplored significance. Blood 2016, 128, 2599–2606. [Google Scholar] [CrossRef]
- Kyle, R.A.; Therneau, T.M.; Rajkumar, S.V.; Offord, J.R.; Larson, D.R.; Plevak, M.F.; Melton 3rd, L.J. A Long-Term Study of Prognosis in Monoclonal Gammopathy of Undetermined Significance. N. Engl. J. Med. 2002, 346, 564–569. [Google Scholar] [CrossRef]
- Kyle, R.A.; Remstein, E.D.; Therneau, T.M.; Dispenzieri, A.; Kurtin, P.J.; Hodnefield, J.M.; Larson, D.R.; Plevak, M.F.; Jelinek, D.F.; Fonseca, R.; et al. Clinical Course and Prognosis of Smoldering (Asymptomatic) Multiple Myeloma. N. Engl. J. Med. 2007, 356, 2582–2590. [Google Scholar] [CrossRef]
- Rajkumar, S.V.; Kumar, S. Multiple Myeloma: Diagnosis and Treatment. Mayo Clin. Proc. 2016, 91, 101–119. [Google Scholar] [CrossRef]
- Rajkumar, S.V.; Kumar, S. Multiple myeloma current treatment algorithms. Blood Cancer J. 2020, 10, 94. [Google Scholar] [CrossRef]
- Koeppen, S. Treatment of Multiple Myeloma: Thalidomide-, Bortezomib-, and Lenalidomide-Induced Peripheral Neuropathy. Oncol. Res. Treat. 2014, 37, 506–513. [Google Scholar] [CrossRef]
- Richardson, P.G.; Sonneveld, P.; Schuster, M.; Irwin, D.; Stadtmauer, E.; Facon, T.; Harousseau, J.-L.; Ben-Yehuda, D.; Lonial, S.; Goldschmidt, H.; et al. Extended follow-up of a phase 3 trial in relapsed multiple myeloma: Final time-to-event results of the APEX trial. Blood 2007, 110, 3557–3560. [Google Scholar] [CrossRef]
- Soave, C.L.; Guerin, T.; Liu, J.; Dou, Q.P. Targeting the ubiquitin-proteasome system for cancer treatment: Discovering novel inhibitors from nature and drug repurposing. Cancer Metastasis Rev. 2017, 36, 717–736. [Google Scholar] [CrossRef]
- Haeri, M.; Knox, B.E. Endoplasmic Reticulum Stress and Unfolded Protein Response Pathways: Potential for Treating Age-related Retinal Degeneration. J. Ophthalmic Vis. Res. 2012, 7, 45–59. [Google Scholar] [PubMed]
- Adams, J.; Palombella, V.J.; Sausville, E.A.; Johnson, J.; Destree, A.; Lazarus, D.D.; Maas, J.; Pien, C.S.; Prakash, S.; Elliott, P.J. Proteasome inhibitors: A novel class of potent and effective antitumor agents. Cancer Res. 1999, 59, 2615–2622. [Google Scholar] [PubMed]
- Handy, D.E.; Castro, R.; Loscalzo, J. Epigenetic Modifications: Basic Mechanisms and Role in Cardiovascular Disease. Circulation 2011, 123, 2145–2156. [Google Scholar] [CrossRef]
- Holoch, D.; Moazed, D. RNA-mediated epigenetic regulation of gene expression. Nat. Rev. Genet. 2015, 16, 71–84. [Google Scholar] [CrossRef] [PubMed]
- Zhang, P.; Torres, K.; Liu, X.; Liu, C.; Pollock, R.E. An Overview of Chromatin-Regulating Proteins in Cells. Curr. Protein Pept. Sci. 2016, 17, 401–410. [Google Scholar] [CrossRef]
- Palomeras, S.; Diaz-Lagares, Á.; Viñas, G.; Setien, F.; Ferreira, H.J.; Oliveras, G.; Crujeiras, A.B.; Hernández, A.; Lum, D.H.; Welm, A.L.; et al. Epigenetic silencing of TGFBI confers resistance to trastuzumab in human breast cancer. Breast Cancer Res. 2019, 21, 79. [Google Scholar] [CrossRef]
- Haertle, L.; Barrio, S.; Munawar, U.; Han, S.; Zhou, X.; Vogt, C.; Fernández, R.A.; Bittrich, M.; Ruiz-Heredia, Y.; Da Viá, M.; et al. Cereblon enhancer methylation and IMiD resistance in multiple myeloma. Blood 2021, 138, 1721–1726. [Google Scholar] [CrossRef]
- Che, F.; Chen, J.; Dai, J.; Liu, X. Inhibition of Multiple Myeloma Using 5-Aza-2ʹ-Deoxycytidine and Bortezomib-Loaded Self-Assembling Nanoparticles. Cancer Manag. Res. 2020, 12, 6969–6976. [Google Scholar] [CrossRef]
- Łuczkowska, K.; Sokolowska, K.E.; Taryma-Lesniak, O.; Pastuszak, K.; Supernat, A.; Bybjerg-Grauholm, J.; Hansen, L.L.; Paczkowska, E.; Wojdacz, T.K.; Machaliński, B. Bortezomib induces methylation changes in neuroblastoma cells that appear to play a significant role in resistance development to this compound. Sci. Rep. 2021, 11, 9846. [Google Scholar] [CrossRef]
- Łuczkowska, K.; Kulig, P.; Baumert, B.; Machaliński, B. The Evidence That 25(OH)D3 and VK2 MK-7 Vitamins Influence the Proliferative Potential and Gene Expression Profiles of Multiple Myeloma Cells and the Development of Resistance to Bortezomib. Nutrients 2022, 14, 5190. [Google Scholar] [CrossRef]
- Moore, L.D.; Le, T.; Fan, G. DNA Methylation and Its Basic Function. Neuropsychopharmacology 2013, 38, 23–38. [Google Scholar] [CrossRef]
- Romero-Garcia, S.; Prado-Garcia, H.; Carlos-Reyes, A. Role of DNA Methylation in the Resistance to Therapy in Solid Tumors. Front. Oncol. 2020, 10, 1152. [Google Scholar] [CrossRef]
- Cao, Y.; Qiu, G.-Q.; Wu, H.-Q.; Wang, Z.-L.; Lin, Y.; Wu, W.; Xie, X.-B.; Gu, W.-Y. Decitabine enhances bortezomib treatment in RPMI 8226 multiple myeloma cells. Mol. Med. Rep. 2016, 14, 3469–3475. [Google Scholar] [CrossRef]
- Wu, T.; Hu, E.; Xu, S.; Chen, M.; Guo, P.; Dai, Z.; Feng, T.; Zhou, L.; Tang, W.; Zhan, L.; et al. clusterProfiler 4.0: A universal enrichment tool for interpreting omics data. Innovation 2021, 2, 100141. [Google Scholar] [CrossRef]
- Wang, B.-D.; Lee, N.H. Aberrant RNA Splicing in Cancer and Drug Resistance. Cancers 2018, 10, 458. [Google Scholar] [CrossRef]
- Salehan, M.R.; Morse, H.R. DNA damage repair and tolerance: A role in chemotherapeutic drug resistance. Br. J. Biomed. Sci. 2013, 70, 31–40. [Google Scholar] [CrossRef]
- Richardson, P.G.; Barlogie, B.; Berenson, J.; Singhal, S.; Jagannath, S.; Irwin, D.; Rajkumar, S.V.; Srkalovic, G.; Alsina, M.; Alexanian, R.; et al. A Phase 2 Study of Bortezomib in Relapsed, Refractory Myeloma. N. Engl. J. Med. 2003, 348, 2609–2617. [Google Scholar] [CrossRef]
- Palumbo, A.; Chanan-Khan, A.; Weisel, K.; Nooka, A.K.; Masszi, T.; Beksac, M.; Spicka, I.; Hungria, V.; Munder, M.; Mateos, M.V.; et al. Daratumumab, Bortezomib, and Dexamethasone for Multiple Myeloma. N. Engl. J. Med. 2016, 375, 754–766. [Google Scholar] [CrossRef]
- Mateos, M.-V.; Sonneveld, P.; Hungria, V.; Nooka, A.K.; Estell, J.A.; Barreto, W.; Corradini, P.; Min, C.K.; Medvedova, E.; Weisel, K.; et al. Daratumumab, Bortezomib, and Dexamethasone Versus Bortezomib and Dexamethasone in Patients With Previously Treated Multiple Myeloma: Three-year Follow-up of CASTOR. Clin. Lymphoma Myeloma Leuk. 2020, 20, 509–518. [Google Scholar] [CrossRef]
- Rosiñol, L.; Oriol, A.; Teruel, A.I.; Hernández, D.; López-Jiménez, J.; De La Rubia, J.; Granell, M.; Besalduch, J.; Palomera, L.; González, Y.; et al. Superiority of bortezomib, thalidomide, and dexamethasone (VTD) as induction pretransplantation therapy in multiple myeloma: A randomized phase 3 PETHEMA/GEM study. Blood 2012, 120, 1589–1596. [Google Scholar] [CrossRef]
- Rosiñol, L.; Oriol, A.; Rios, R.; Sureda, A.; Blanchard, M.J.; Hernández, M.T.; Martínez-Martínez, R.; Moraleda, J.M.; Jarque, I.; Bargay, J.; et al. Bortezomib, lenalidomide, and dexamethasone as induction therapy prior to autologous transplant in multiple myeloma. Blood 2019, 134, 1337–1345. [Google Scholar] [CrossRef]
- Richardson, P.G.; Oriol, A.; Beksac, M.; Liberati, A.M.; Galli, M.; Schjesvold, F.; Lindsay, J.; Weisel, K.; White, D.; Facon, T.; et al. Pomalidomide, bortezomib, and dexamethasone for patients with relapsed or refractory multiple myeloma previously treated with lenalidomide (OPTIMISMM): A randomised, open-label, phase 3 trial. Lancet Oncol. 2019, 20, 781–794. [Google Scholar] [CrossRef] [PubMed]
- Moreau, P.; Attal, M.; Hulin, C.; Arnulf, B.; Belhadj, K.; Benboubker, L.; Béné, M.C.; Broijl, A.; Caillon, H.; Caillot, D.; et al. Bortezomib, thalidomide, and dexamethasone with or without daratumumab before and after autologous stem-cell transplantation for newly diagnosed multiple myeloma (CASSIOPEIA): A randomised, open-label, phase 3 study. Lancet 2019, 394, 29–38. [Google Scholar] [CrossRef]
- Richardson, P.G.; Mitsiades, C.; Hideshima, T.; Anderson, K.C. Bortezomib: Proteasome Inhibition as an Effective Anticancer Therapy. Annu. Rev. Med. 2006, 57, 33–47. [Google Scholar] [CrossRef]
- Oerlemans, R.; Franke, N.E.; Assaraf, Y.G.; Cloos, J.; Van Zantwijk, I.; Berkers, C.R.; Scheffer, G.L.; Debipersad, K.; Vojtekova, K.; Lemos, C.; et al. Molecular basis of bortezomib resistance: Proteasome subunit β5 (PSMB5) gene mutation and overexpression of PSMB5 protein. Blood 2008, 112, 2489–2499. [Google Scholar] [CrossRef] [PubMed]
- Wu, Y.-X.; Yang, J.-H.; Saitsu, H. Bortezomib-resistance is associated with increased levels of proteasome subunits and apoptosis-avoidance. Oncotarget 2016, 7, 77622–77634. [Google Scholar] [CrossRef] [PubMed]
- Beyar-Katz, O.; Magidey, K.; Reiner-Benaim, A.; Barak, N.; Avivi, I.; Cohen, Y.; Timaner, M.; Avraham, S.; Hayun, M.; Lavi, N.; et al. Proinflammatory Macrophages Promote Multiple Myeloma Resistance to Bortezomib Therapy. Mol. Cancer Res. 2019, 17, 2331–2340. [Google Scholar] [CrossRef] [PubMed]
- Leshchenko, V.V.; Kuo, P.-Y.; Jiang, Z.; Weniger, M.A.; Overbey, J.; Dunleavy, K.; Wilson, W.H.; Wiestner, A.; Parekh, S. Harnessing Noxa demethylation to overcome Bortezomib resistance in mantle cell lymphoma. Oncotarget 2015, 6, 27332–27342. [Google Scholar] [CrossRef] [PubMed]
- Yang, L.-H.; Du, P.; Liu, W.; An, L.-K.; Li, J.; Zhu, W.-Y.; Yuan, S.; Wang, L.; Zang, L. LncRNA ANRIL promotes multiple myeloma progression and bortezomib resistance by EZH2-mediated epigenetically silencing of PTEN. Neoplasma 2021, 68, 788–797. [Google Scholar] [CrossRef] [PubMed]
- Tang, J.; Chen, Q.; Li, Q.; He, Y.; Xiao, D. Exosomal mRNAs and lncRNAs involved in multiple myeloma resistance to bortezomib. Cell Biol. Int. 2021, 45, 965–975. [Google Scholar] [CrossRef] [PubMed]
- Watkins, N.J.; Bohnsack, M.T. The box C/D and H/ACA snoRNPs: Key players in the modification, processing and the dynamic folding of ribosomal RNA. WIREs RNA 2012, 3, 397–414. [Google Scholar] [CrossRef] [PubMed]
- Liu, S.; Liu, Z.; Xie, Z.; Pang, J.; Yu, J.; Lehmann, E.; Huynh, L.; Vukosavljevic, T.; Takeki, M.; Klisovic, R.B.; et al. Bortezomib induces DNA hypomethylation and silenced gene transcription by interfering with Sp1/NF-κB–dependent DNA methyltransferase activity in acute myeloid leukemia. Blood 2008, 111, 2364–2373. [Google Scholar] [CrossRef] [PubMed]
- Hu, X.; Xuan, H.; Du, H.; Jiang, H.; Huang, J. Down-Regulation of CD9 by Methylation Decreased Bortezomib Sensitivity in Multiple Myeloma. Agoulnik IU, editor. PLoS ONE 2014, 9, e95765. [Google Scholar]
- Fernández De Larrea, C.; Martín-Antonio, B.; Cibeira, M.T.; Navarro, A.; Tovar, N.; Díaz, T.; Rosiñol, L.; Monzó, M.; Urbano-Ispizua, A.; Bladé, J. Impact of global and gene-specific DNA methylation pattern in relapsed multiple myeloma patients treated with bortezomib. Leuk. Res. 2013, 37, 641–646. [Google Scholar] [CrossRef] [PubMed]
- Hasna, J.; Hague, F.; Rodat-Despoix, L.; Geerts, D.; Leroy, C.; Tulasne, D.; Ouadid-Ahidouch, H.; Kischel, P. Orai3 calcium channel and resistance to chemotherapy in breast cancer cells: The p53 connection. Cell Death Differ. 2018, 25, 693–707. [Google Scholar] [CrossRef]
- Fan, J.; Bellon, M.; Ju, M.; Zhao, L.; Wei, M.; Fu, L.; Nicot, C. Clinical significance of FBXW7 loss of function in human cancers. Mol. Cancer 2022, 21, 87. [Google Scholar] [CrossRef]
- Chen, S.; Lin, J.; Zhao, J.; Lin, Q.; Liu, J.; Wang, Q.; Mui, R.; Ma, L. FBXW7 attenuates tumor drug resistance and enhances the efficacy of immunotherapy. Front. Oncol. 2023, 13, 1147239. [Google Scholar] [CrossRef]
- Mun, G.-I.; Choi, E.; Lee, Y.; Lee, Y.-S. Decreased expression of FBXW7 by ERK1/2 activation in drug-resistant cancer cells confers transcriptional activation of MDR1 by suppression of ubiquitin degradation of HSF1. Cell Death Dis. 2020, 11, 395. [Google Scholar] [CrossRef]
- Wang, Z.; Fukushima, H.; Gao, D.; Inuzuka, H.; Wan, L.; Lau, A.W.; Liu, P.; Wei, W. The two faces of FBW7 in cancer drug resistance. BioEssays 2011, 33, 851–859. [Google Scholar] [CrossRef] [PubMed]
- Sheng, S.; Su, W.; Mao, D.; Li, C.; Hu, X.; Deng, W.; Yao, Y.; Ji, Y. MicroRNA-21 induces cisplatin resistance in head and neck squamous cell carcinoma. PLoS ONE 2022, 17, e0267017. [Google Scholar] [CrossRef] [PubMed]
- Gaudelot, K.; Gibier, J.-B.; Pottier, N.; Hémon, B.; Van Seuningen, I.; Glowacki, F.; Leroy, X.; Cauffiez, C.; Gnemmi, V.; Aubert, S.; et al. Targeting miR-21 decreases expression of multi-drug resistant genes and promotes chemosensitivity of renal carcinoma. Tumor Biol. 2017, 39, 101042831770737. [Google Scholar] [CrossRef]
- Bu, H.; Li, Y.; Jin, C.; Yu, H.; Wang, X.; Chen, J.; Wang, Y.; Ma, Y.; Zhang, Y.; Kong, B. Overexpression of PRC1 indicates a poor prognosis in ovarian cancer. Int. J. Oncol. 2020, 56, 685–696. [Google Scholar] [CrossRef] [PubMed]
- Parreno, V.; Martinez, A.-M.; Cavalli, G. Mechanisms of Polycomb group protein function in cancer. Cell Res. 2022, 32, 231–253. [Google Scholar] [CrossRef] [PubMed]
- Liang, Z.; Li, X.; Chen, J.; Cai, H.; Zhang, L.; Li, C.; Tong, J.; Hu, W. PRC1 promotes cell proliferation and cell cycle progression by regulating p21/p27-pRB family molecules and FAK-paxillin pathway in non-small cell lung cancer. Transl. Cancer Res. 2019, 8, 2059–2072. [Google Scholar] [CrossRef]
- Lee, T.-S.; Ma, W.; Zhang, X.; Giles, F.; Cortes, J.; Kantarjian, H.; Albitar, M. BCR-ABL alternative splicing as a common mechanism for imatinib resistance: Evidence from molecular dynamics simulations. Mol. Cancer Ther. 2008, 7, 3834–3841. [Google Scholar] [CrossRef]
- Wang, Y.; Bernhardy, A.J.; Cruz, C.; Krais, J.J.; Nacson, J.; Nicolas, E.; Peri, S.; van der Gulden, H.; van der Heijden, I.; O’Brien, S.W.; et al. The BRCA1-Δ11q Alternative Splice Isoform Bypasses Germline Mutations and Promotes Therapeutic Resistance to PARP Inhibition and Cisplatin. Cancer Res. 2016, 76, 2778–2790. [Google Scholar] [CrossRef]
- Tian, Y.; Morris, T.J.; Webster, A.P.; Yang, Z.; Beck, S.; Feber, A.; Teschendorff, A.E. ChAMP: Updated methylation analysis pipeline for Illumina BeadChips. Bioinformatics 2017, 33, 3982–3984. [Google Scholar] [CrossRef]
- Morris, T.J.; Butcher, L.M.; Feber, A.; Teschendorff, A.E.; Chakravarthy, A.R.; Wojdacz, T.K.; Beck, S. ChAMP: 450k Chip Analysis Methylation Pipeline. Bioinformatics 2014, 30, 428–430. [Google Scholar] [CrossRef]
- Leek, J.T.; Evan Johnson, W.; Parker, H.S.; Fertig, E.J.; Jaffe, A.E.; Zhang, Y.; Storey, J.D.; Collado Torres, L. Sva: Surrogate Variable Analysis; CRAN: Vienna, Austria, 2021. [Google Scholar]
- Ritchie, M.E.; Phipson, B.; Wu, D.; Hu, Y.; Law, C.W.; Shi, W.; Smyth, G.K. limma powers differential expression analyses for RNA-sequencing and microarray studies. Nucleic Acids Res. 2015, 43, e47. [Google Scholar] [CrossRef] [PubMed]
- Dennis, G.; Sherman, B.T.; Hosack, D.A.; Yang, J.; Gao, W.; Lane, H.C.; Lempicki, R.A. DAVID: Database for Annotation, Visualization, and Integrated Discovery. Genome Biol. 2003, 4, P3. [Google Scholar] [CrossRef]
- Fresno, C.; Fernández, E.A. RDAVIDWebService: A versatile R interface to DAVID. Bioinformatics 2013, 29, 2810–2811. [Google Scholar] [CrossRef] [PubMed]


Disclaimer/Publisher’s Note: The statements, opinions and data contained in all publications are solely those of the individual author(s) and contributor(s) and not of MDPI and/or the editor(s). MDPI and/or the editor(s) disclaim responsibility for any injury to people or property resulting from any ideas, methods, instructions or products referred to in the content. |
© 2023 by the authors. Licensee MDPI, Basel, Switzerland. This article is an open access article distributed under the terms and conditions of the Creative Commons Attribution (CC BY) license (https://creativecommons.org/licenses/by/4.0/).
Share and Cite
Łuczkowska, K.; Kulig, P.; Rusińska, K.; Baumert, B.; Machaliński, B. 5-Aza-2′-Deoxycytidine Alters the Methylation Profile of Bortezomib-Resistant U266 Multiple Myeloma Cells and Affects Their Proliferative Potential. Int. J. Mol. Sci. 2023, 24, 16780. https://doi.org/10.3390/ijms242316780
Łuczkowska K, Kulig P, Rusińska K, Baumert B, Machaliński B. 5-Aza-2′-Deoxycytidine Alters the Methylation Profile of Bortezomib-Resistant U266 Multiple Myeloma Cells and Affects Their Proliferative Potential. International Journal of Molecular Sciences. 2023; 24(23):16780. https://doi.org/10.3390/ijms242316780
Chicago/Turabian StyleŁuczkowska, Karolina, Piotr Kulig, Klaudia Rusińska, Bartłomiej Baumert, and Bogusław Machaliński. 2023. "5-Aza-2′-Deoxycytidine Alters the Methylation Profile of Bortezomib-Resistant U266 Multiple Myeloma Cells and Affects Their Proliferative Potential" International Journal of Molecular Sciences 24, no. 23: 16780. https://doi.org/10.3390/ijms242316780