Article

Characterization of the FLA Gene Family in Tomato (Solanum lycopersicum L.) and the Expression Analysis of SlFLAs in Response to Hormone and Abiotic Stresses

1
College of Horticulture, Gansu Agricultural University, 1 Yinmen Village, Anning District, Lanzhou 730070, China
2
College of Agriculture, Guangxi University, Nanning 530004, China
*
Author to whom correspondence should be addressed.
Int. J. Mol. Sci. 2023, 24(22), 16063; https://doi.org/10.3390/ijms242216063
Submission received: 21 September 2023 / Revised: 24 October 2023 / Accepted: 4 November 2023 / Published: 7 November 2023

Abstract

:
Fasciclin-like arabinogalactan proteins (FLAs), a subclass of arabinogalactan proteins (AGPs), participate in mediating plant growth, development, and response to abiotic stress. However, the characterization and function of FLAs in tomato are currently unknown. In this study, members of the tomato FLA family are characterized and analyzed in relation to their response to phytohormonal and abiotic stresses. The results show that a total of 24 FLA members were characterized in tomato. The structural domain analysis showed that these members have a high protein similarity. The expression profiles of different tissues indicated that the genes of most members of the tomato FLA gene family are highly expressed in roots, but to a lower extent in fruits. qRT-PCR analysis revealed that all 24 tomato FLA genes are responsive to ABA and MeJA. SlFLAs showed a positive response to salt and cold stress. SlFLA1, SlFLA12, and SlFLA14 are significantly induced under darkness. SlFLA1 and SlFLA3 are significantly induced under drought stress. This study provides a basis for a further understanding of the role of tomato FLA homologous genes in plant response to abiotic stress and lays the foundation for further research on the function of FLAs in tomato.

1. Introduction

Cell-to-cell interactions and communication provide key structural, positional, and environmental signals during plant development. These signals need to pass through the plant cell wall, which surrounds the plasma membrane [1,2]. The plant cell wall is a dynamic and complex organelle that serves as the primary source of structural support and protection for plants. It is mainly composed of cellulose, hemicellulose, pectin, polysaccharides, and proteins. Additionally, the cell wall plays a significant role in signal transduction, intercellular communication, and immunity, in addition to providing mechanical protection and structural support [3,4]. Hydroxyproline-rich glycoproteins (HRGPs) are typical cell wall proteins that participate in plant growth, development, and immunity [5]. HRGPs have several repeating glycosylation motifs containing hydroxyproline (Hyp) residues as glycosylation sites. Depending on the level of glycosylation, the HRGP superfamily can be divided into three subfamilies: hyperglycosylated arabinogalactan proteins (AGPs), minimally glycosylated Pro-rich proteins (PRPs), and moderately glycosylated extensins (EXTs) [6]. AGPs are abundant in plants and can be classified into six main subclasses: classical AGPs, AG peptides, lysine-rich AGPs, fasciclin-like (FLAs), non-classical AGPs, and chimeric AGPs [7]. Fasciclin-like arabinogalactan proteins (FLAs) are characterized by fasciclin (FAS) structural domains, which were first found in fruit flies (Drosophila melanogaster) and later in other organisms, including algae, lichens, plants, and animals. FLAs typically have one or two bundled protein structural domains, and they are found in Drosophila, mammals, sea urchins, plants, yeast, and bacteria. In addition to the bundle protein structural domains, FLAs typically contain an N-terminal signal peptide and a C-terminal glycosylphosphatidylinositol (GPI)-anchored signal peptide. The GPI and fasciclin structural domains are functionally important and are thought to mediate cell adhesion [1,8].
To date, FLA family members have been identified in a wide range of plant species. A total of 21, 27, 34, 35, 19, 30, and 33 FLA members have been identified in Arabidopsis (Arabidopsis thaliana, At) [1], rice (Oryza sativa, Os) [9], wheat (Triticum aestivum, Ta) [2], poplar (Populus trichocarpa, Ptr) [10], cotton (Gossypium hirsutum, Gh) [11], pepper (Capsicum annuum) [12], and cabbage (Brassica rapa, Br) [13], respectively. FLAs are cell wall structural glycoproteins that mediate cellulose deposition and cell wall development. They are thought to be involved in fiber development, elongation, and stem dynamics. FLAs affect fiber and wood quality in cotton and woody plants, such as poplar and eucalyptus (Eucalyptus globules Labill, Egr) [14], and they are abundant in xylem [15]. Studies on plant FLAs have focused on tissue-specific functions, pollination, and embryogenesis, and on general responses to biotic and abiotic stresses [10,16]. In addition, many studies have demonstrated the importance of FLAs in cell wall biosynthesis. For example, in A. thaliana, AtFLA4 induced aberrant cell expansion, adhesion, cell wall synthesis, and seed coat pectin mucilage [17]. AtFLA11 and AtFLA12 play a role in stem tensile strength, biomechanics, and elastic modulus, thereby affecting cell wall composition and structure [18]. Studies on AtFLA16 mutants have shown that the deletion of AtFLA16 resulted in a shorter stem length and altered biomechanical properties [19]. The PtFLA6 gene was associated with xylem fiber cells, cell wall composition, and stem biomechanics in poplar [14,20]. Stem lignification is more developed in herbaceous plants, and lignified stems are mainly composed of secondary wall-enhancing cells. FLAs are cell wall structural glycoproteins that mediate cellulose deposition and cell wall development. They are believed to participate in fiber development, elongation, and stem dynamics [14].
Tomato (Solanum lycopersicum L.) has long been used as a model plant for fruit ripening, disease response, genetics, and whole-genome sequence studies [21]. Abiotic stresses can adversely affect yield, productivity, and quality in tomato [22]. To date, FLAs have been studied in many plants, but reports of FLAs in tomato are relatively rare. Therefore, to better understand the key role of the FLA family in plants, the coding genes of tomato FLA subfamily members are characterized and analyzed in this study. The tomato FLA members were analyzed for gene structure, secondary structure, chromosomal location, conserved motif analysis, cis-acting element analysis, phylogenetic tree, and subcellular localization. The expression patterns of these FLAs in various tissue-specific processes and gene transcription analysis under different abiotic stresses and hormonal conditions are also investigated. The objective of this study is to lay the foundation for future research on the role of FLAs in tomato growth, development, and resistance to stresses.

2. Results

2.1. Identification of FLA Genes in Tomato

A total of 25 protein sequences containing the FLA structural domain (E-value = 1 × 10⁻⁵) were retrieved from the Tomato Genome Database. The incomplete proteins (not containing start or stop codons) and proteins whose annotation information in Blastp (database SSWISS-PROT/Uniprot (accessed on 5 June 2023)) in NCBI did not contain FLA structural domains were screened out, and 24 FLA proteins were finally characterized (Table 1). They were sequentially named SlFLA1~SlFLA24. Using tomato genome annotation information and the TBtools software, we visualized the chromosomal distributions of the tomato FLA gene family members. As shown in Figure 1, tomato FLA genes are unevenly distributed on 10 chromosomes, where the number of genes on each chromosome is independent of the chromosome size. The average amino acid number of the tomato FLA family is 339, the molecular weight is in the range of 25.79 kDa~49.43 kDa, and the isoelectric point (pI) is lower than 7, except for SlFLA9, SlFLA17, SlFLA18, and SlFLA24, in which it is greater than 7. The average value of the instability index is 44.33, and the mean value of the aliphatic index is 91.42. The maximum value of the grand average of hydropathicity is 0.289 and the minimum value is −0.29; within this range, the members with a grand average of hydropathicity of less than 0 account for 50%. The results of the subcellular localization prediction indicate that chloroplasts contain the most members of the tomato FLA gene family, with nine members localized to chloroplasts, followed by vesicles and extracellular material (Table 1). The signal peptide prediction results indicate that all members of the tomato FLA family, except SlFLA19, have signal peptides with loci located around 20. The results of the transmembrane structure prediction indicate that all members of the tomato FLA family have transmembrane structures (Table 1).

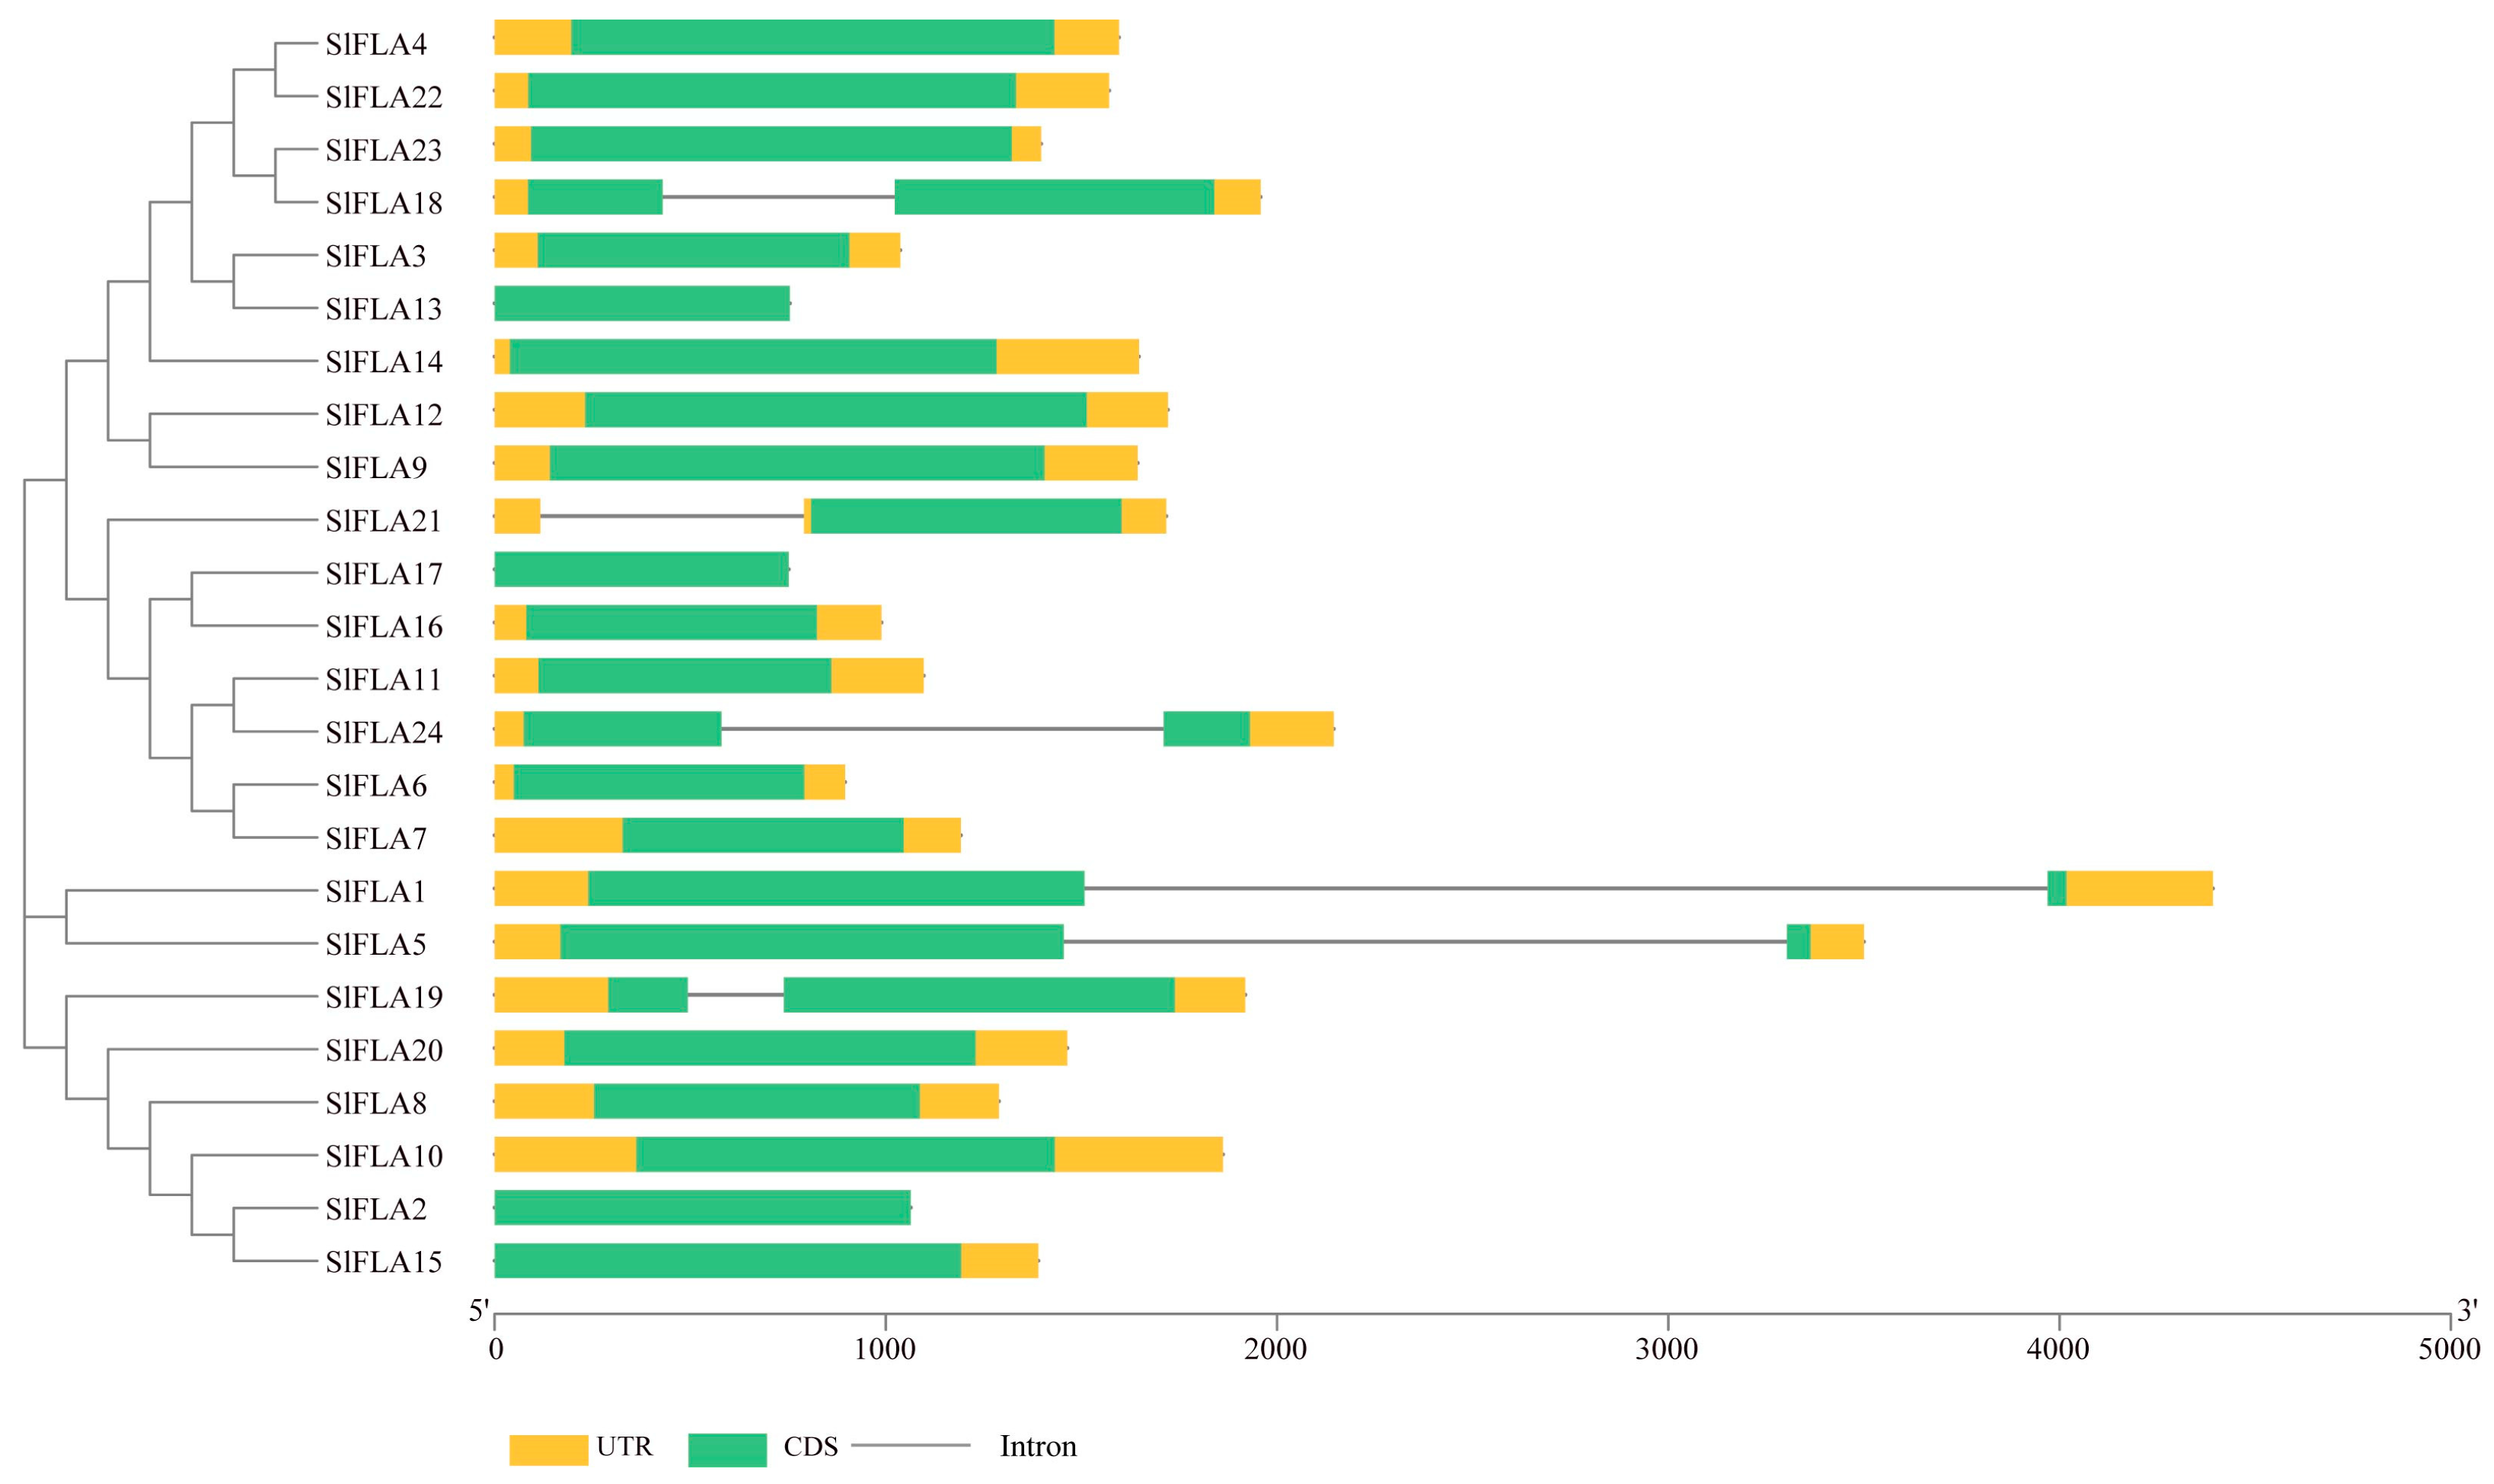
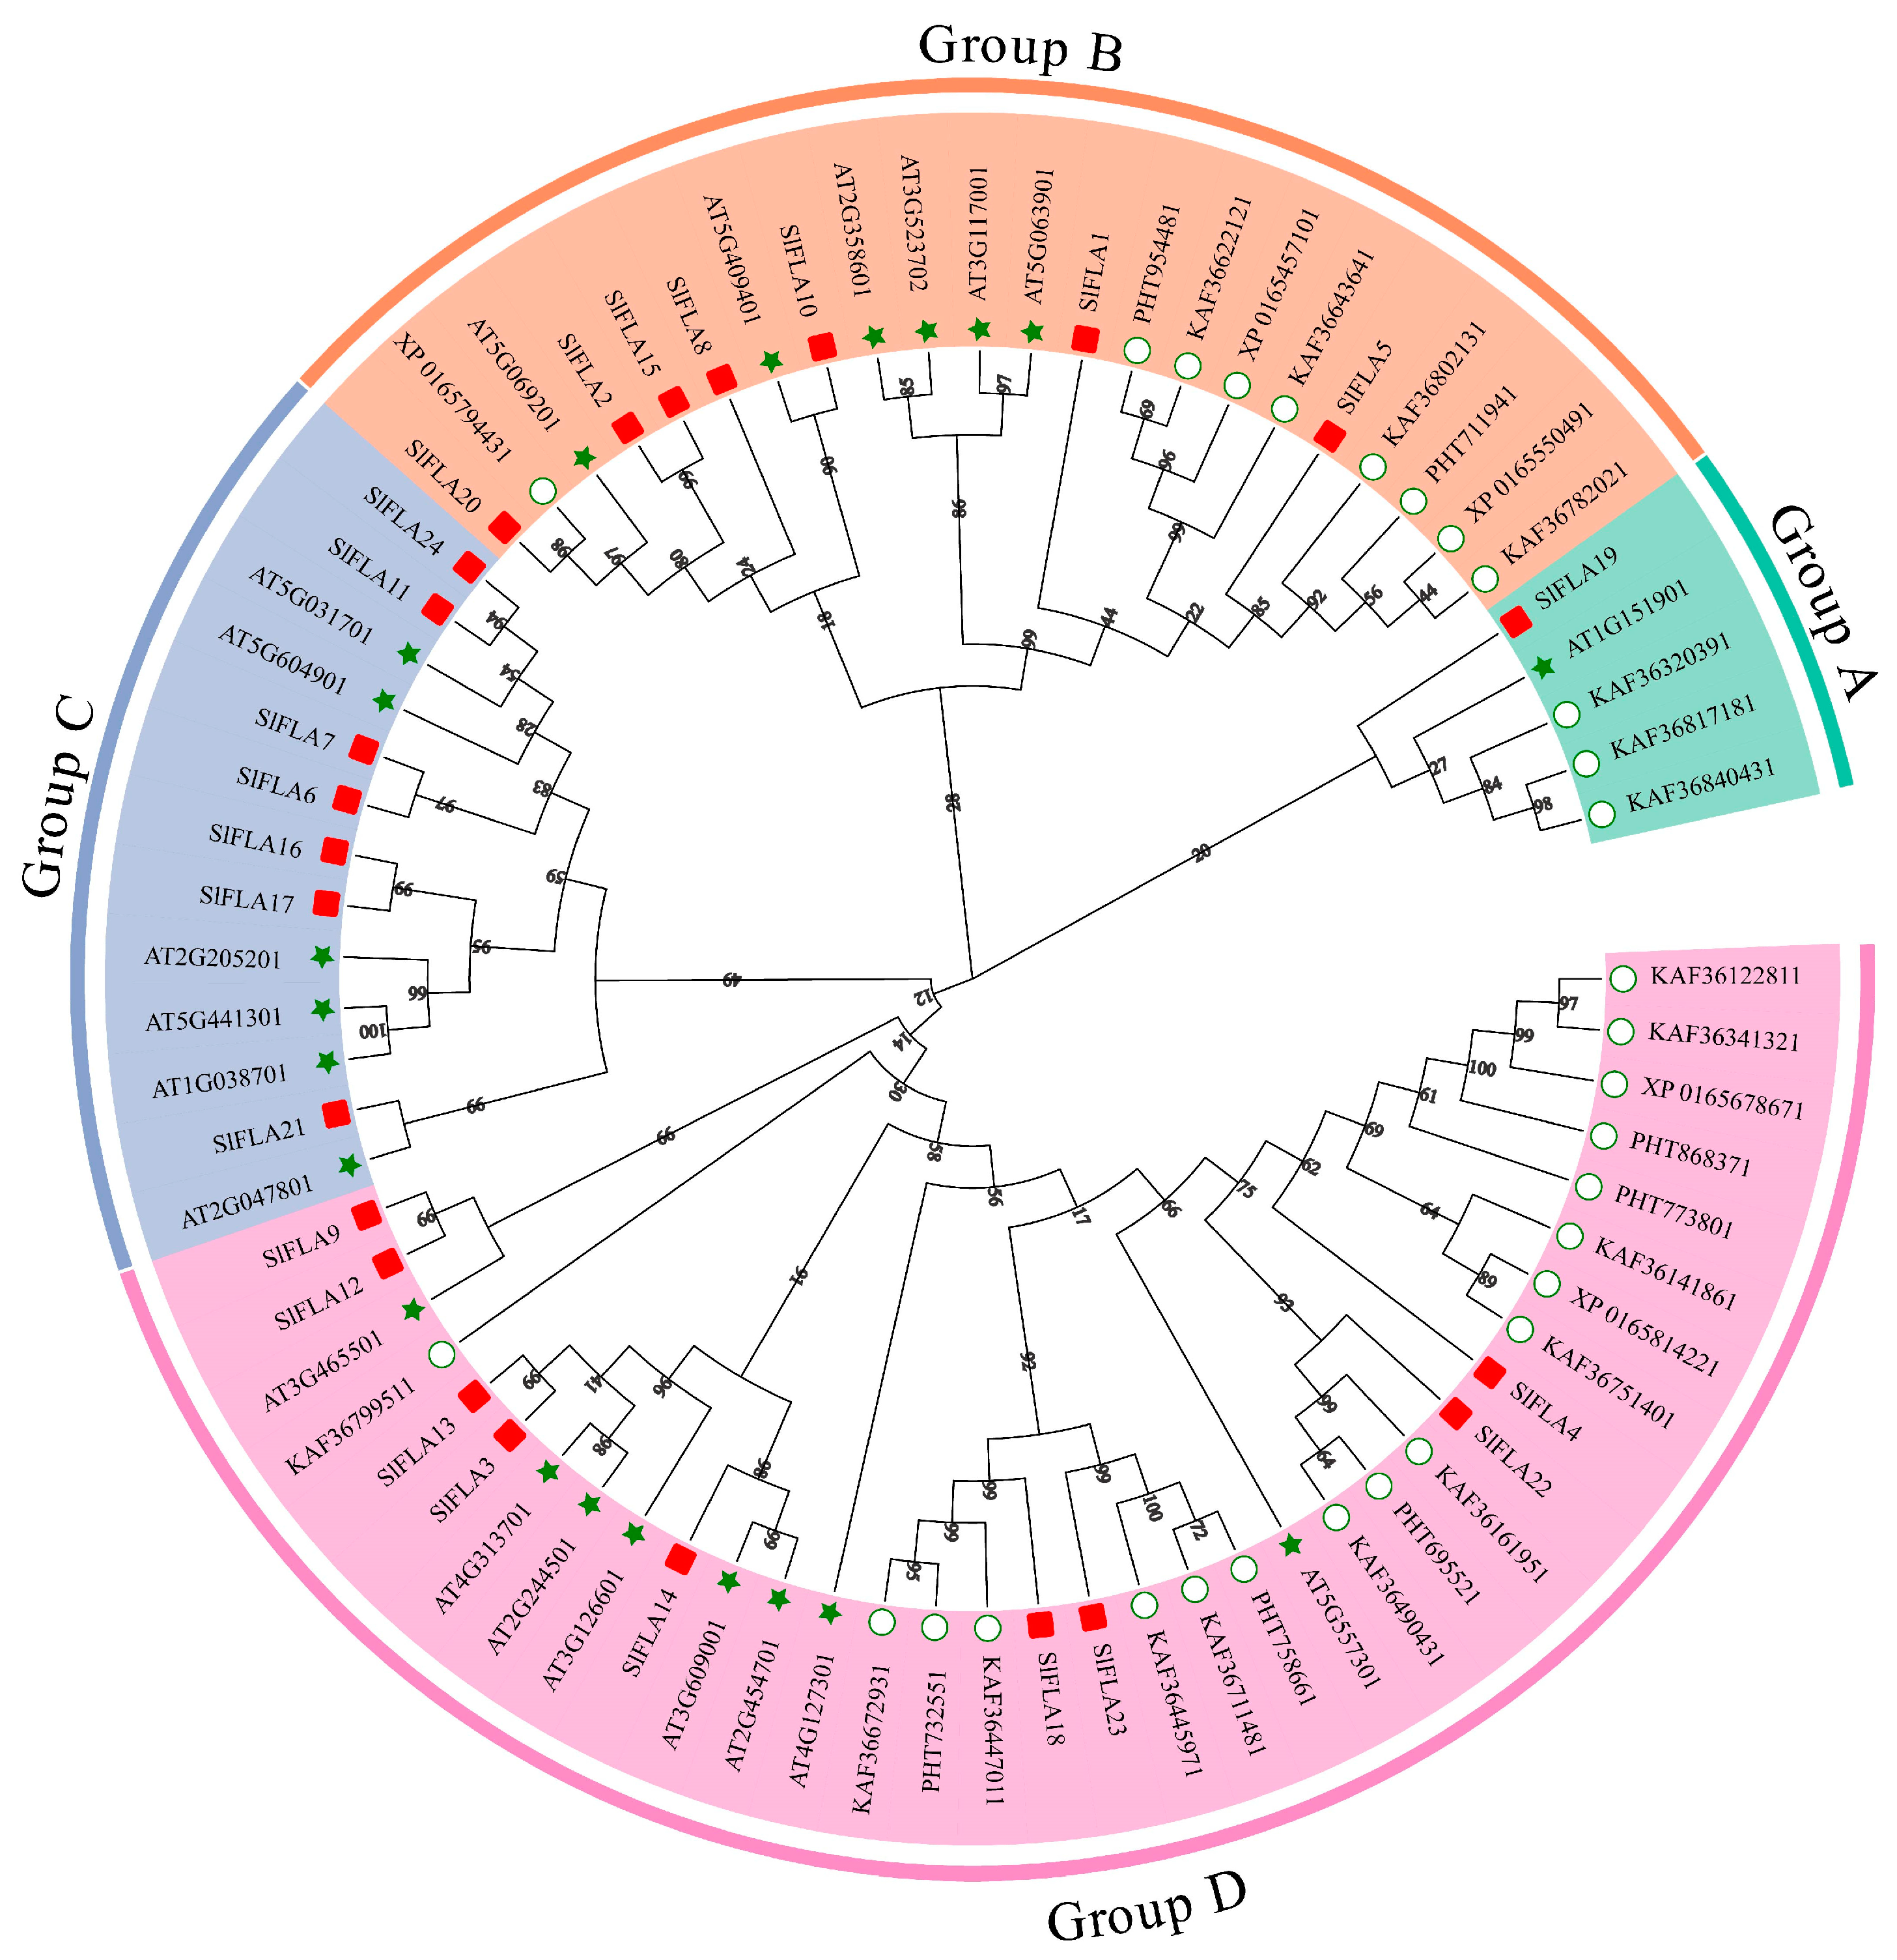
2.2. Structural Analysis and Phylogenetic Tree Analysis of the SlFLA Gene Family

Our analysis revealed that 25% of the tomato FLA family members, namely, SlFLA1, SlFLA5, SlFLA18, SlFLA19, SlFLA21, and SlFLA24, contain one intron; it is worth noting that SlFLA1 and SlFLA5 have longer introns, and the remaining family members do not have any introns (Figure 2). To investigate the selection pressure during the evolution of SlFLA genes, the Ka/Ks values of tomato FLAs were calculated (File S1). The results show that the Ka/Ks ratio was lower than 1 was 59% for SlFLA genes, indicating that the SlFLA gene family might be selected for purification.
FLA proteins from these plants were divided into four subgroups based on homology (A, B, C, and D; Figure 3), in which group A contained the smallest number of members (5 members, with 1 tomato FLA member); group B (22 members) contained 7 FLA members, one branch of which was the pepper FLA family in addition to SlFLA5 and a further 8 members; and group C (13 members) contained only tomato and Arabidopsis FLA members, of which the closest relatives were Arabidopsis AT1G03870.1 and Arabidopsis AT5G44130.1. Group D (35 members) contained the largest number of members, and the closest relatives were tomato SlFLA4 and SlFLA5, SlFLA13, and SlFLA3. In addition, among the four subgroups, the plant most closely related to tomato was pepper; so, we hypothesized that tomato and pepper have a certain evolutionary relationship. Meanwhile, members of the tomato FLA family are closely related to Arabidopsis and pepper (Figure 3).

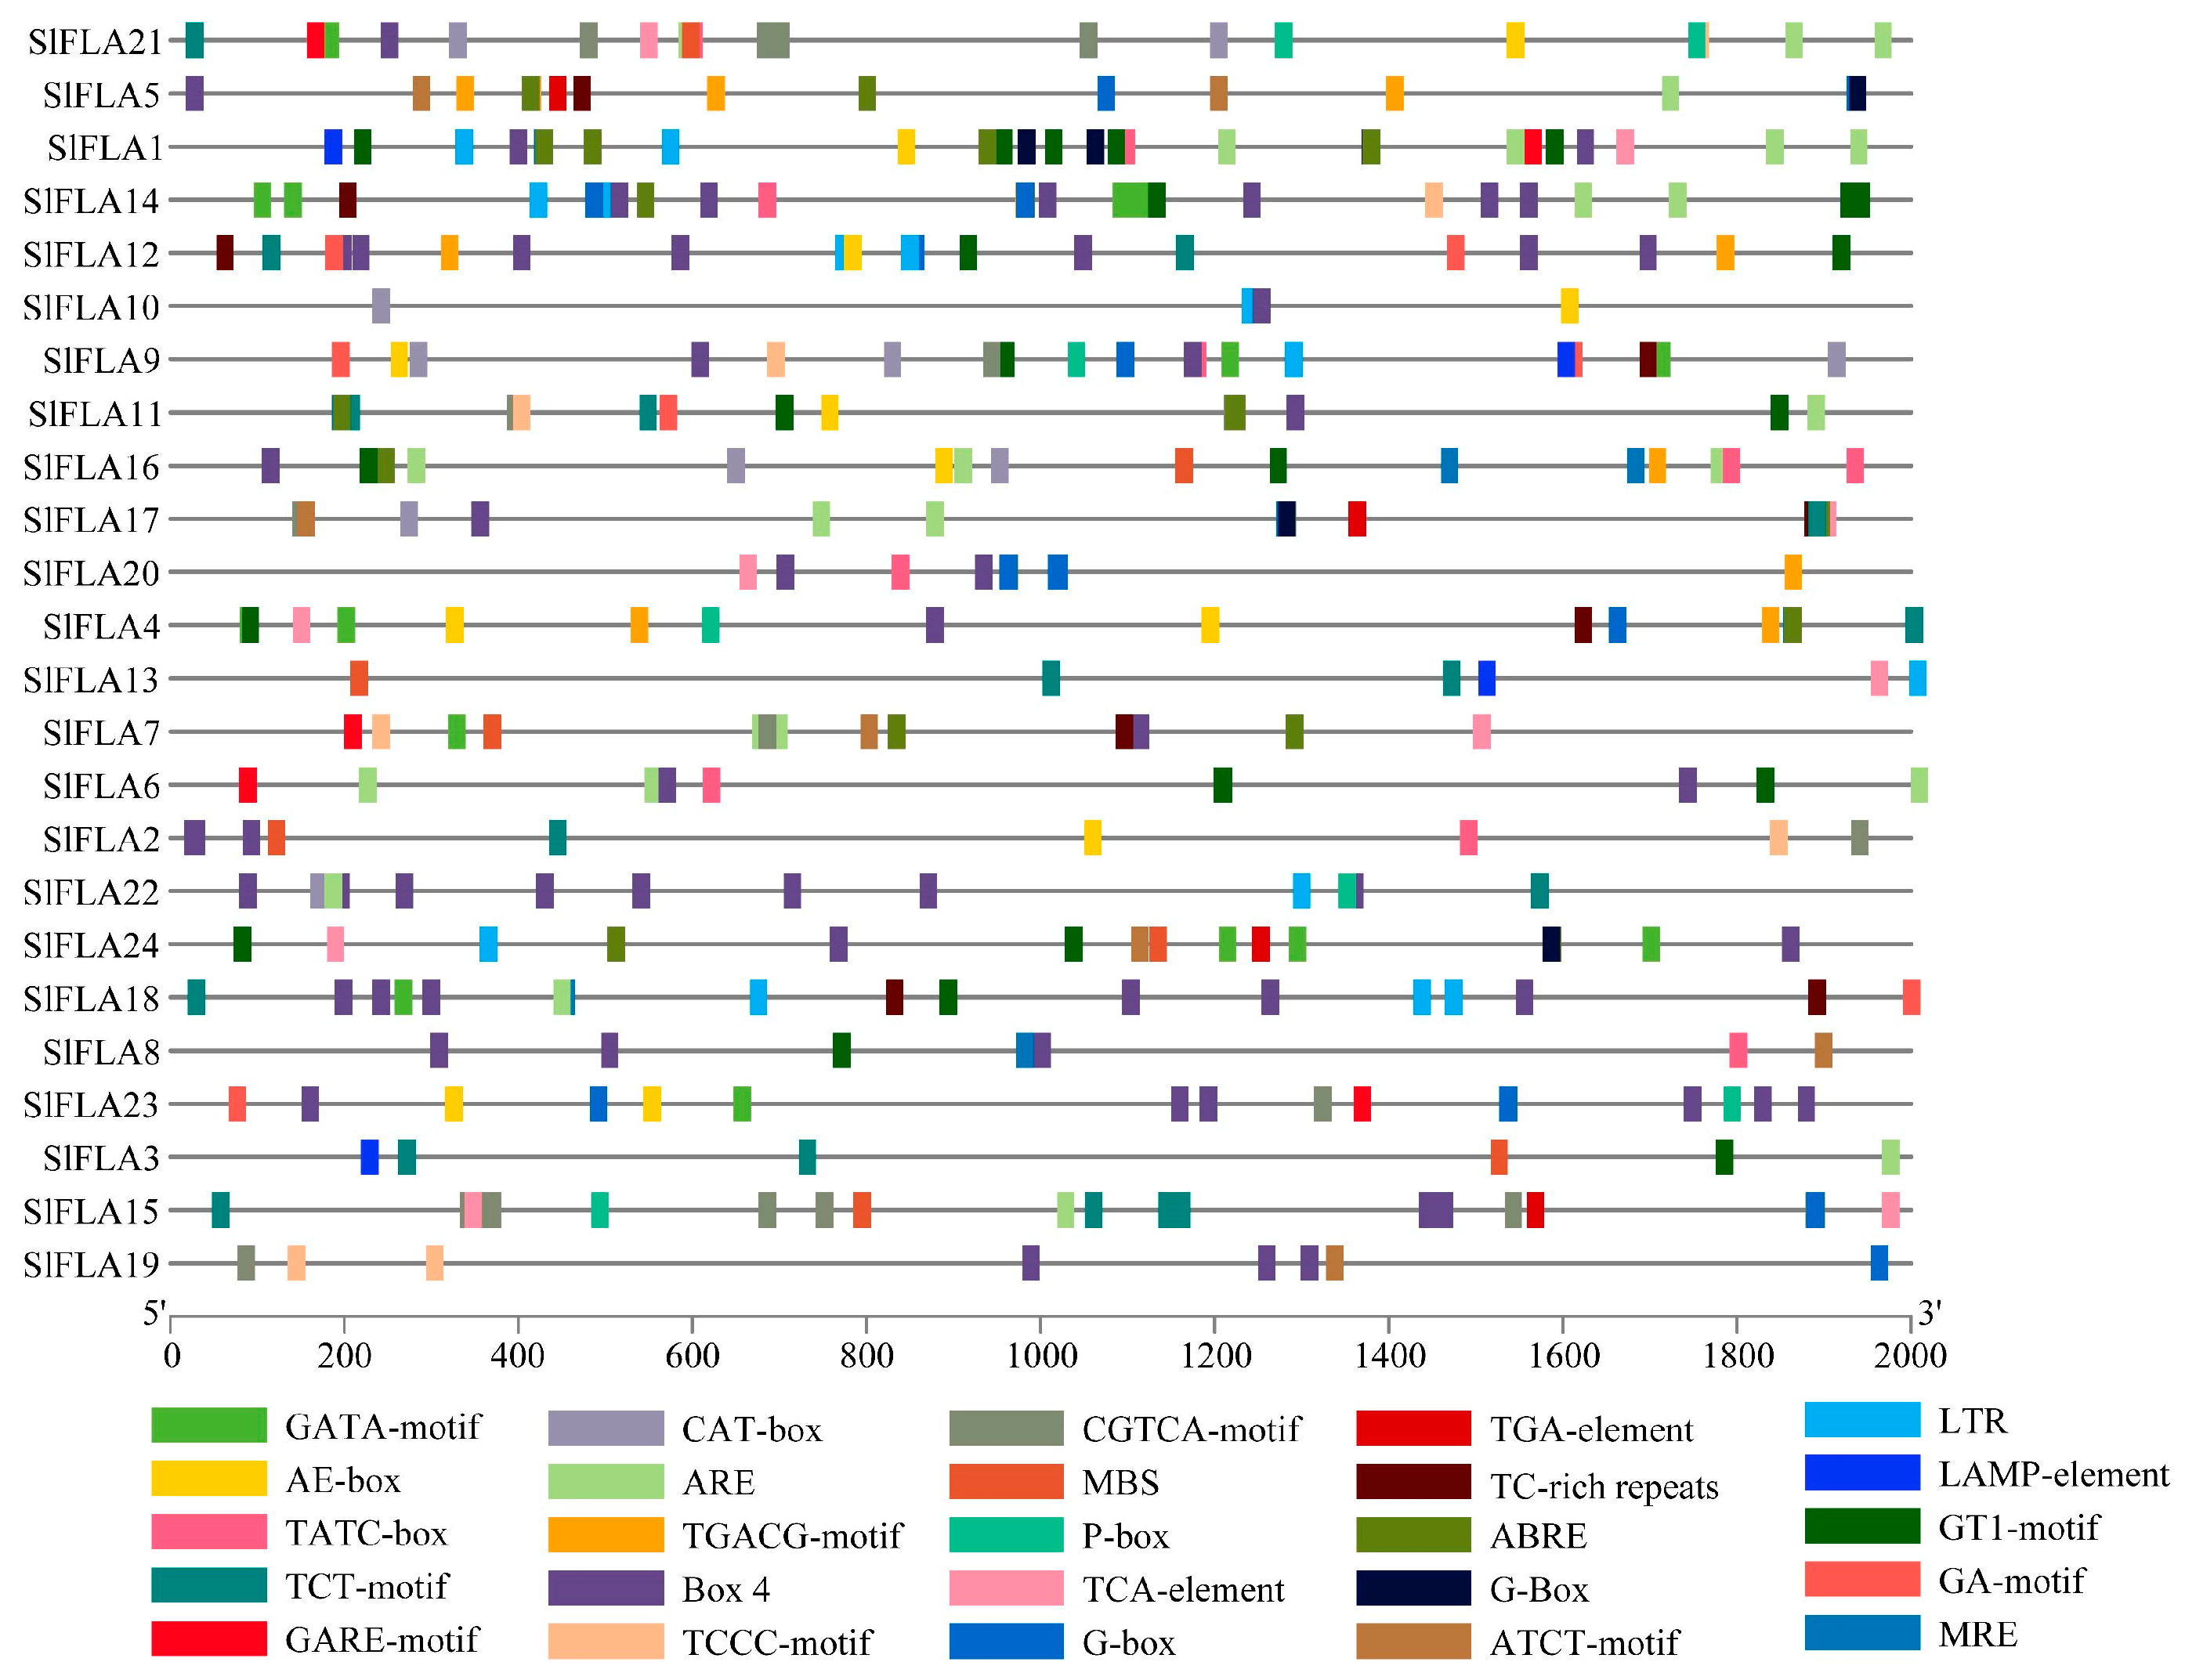
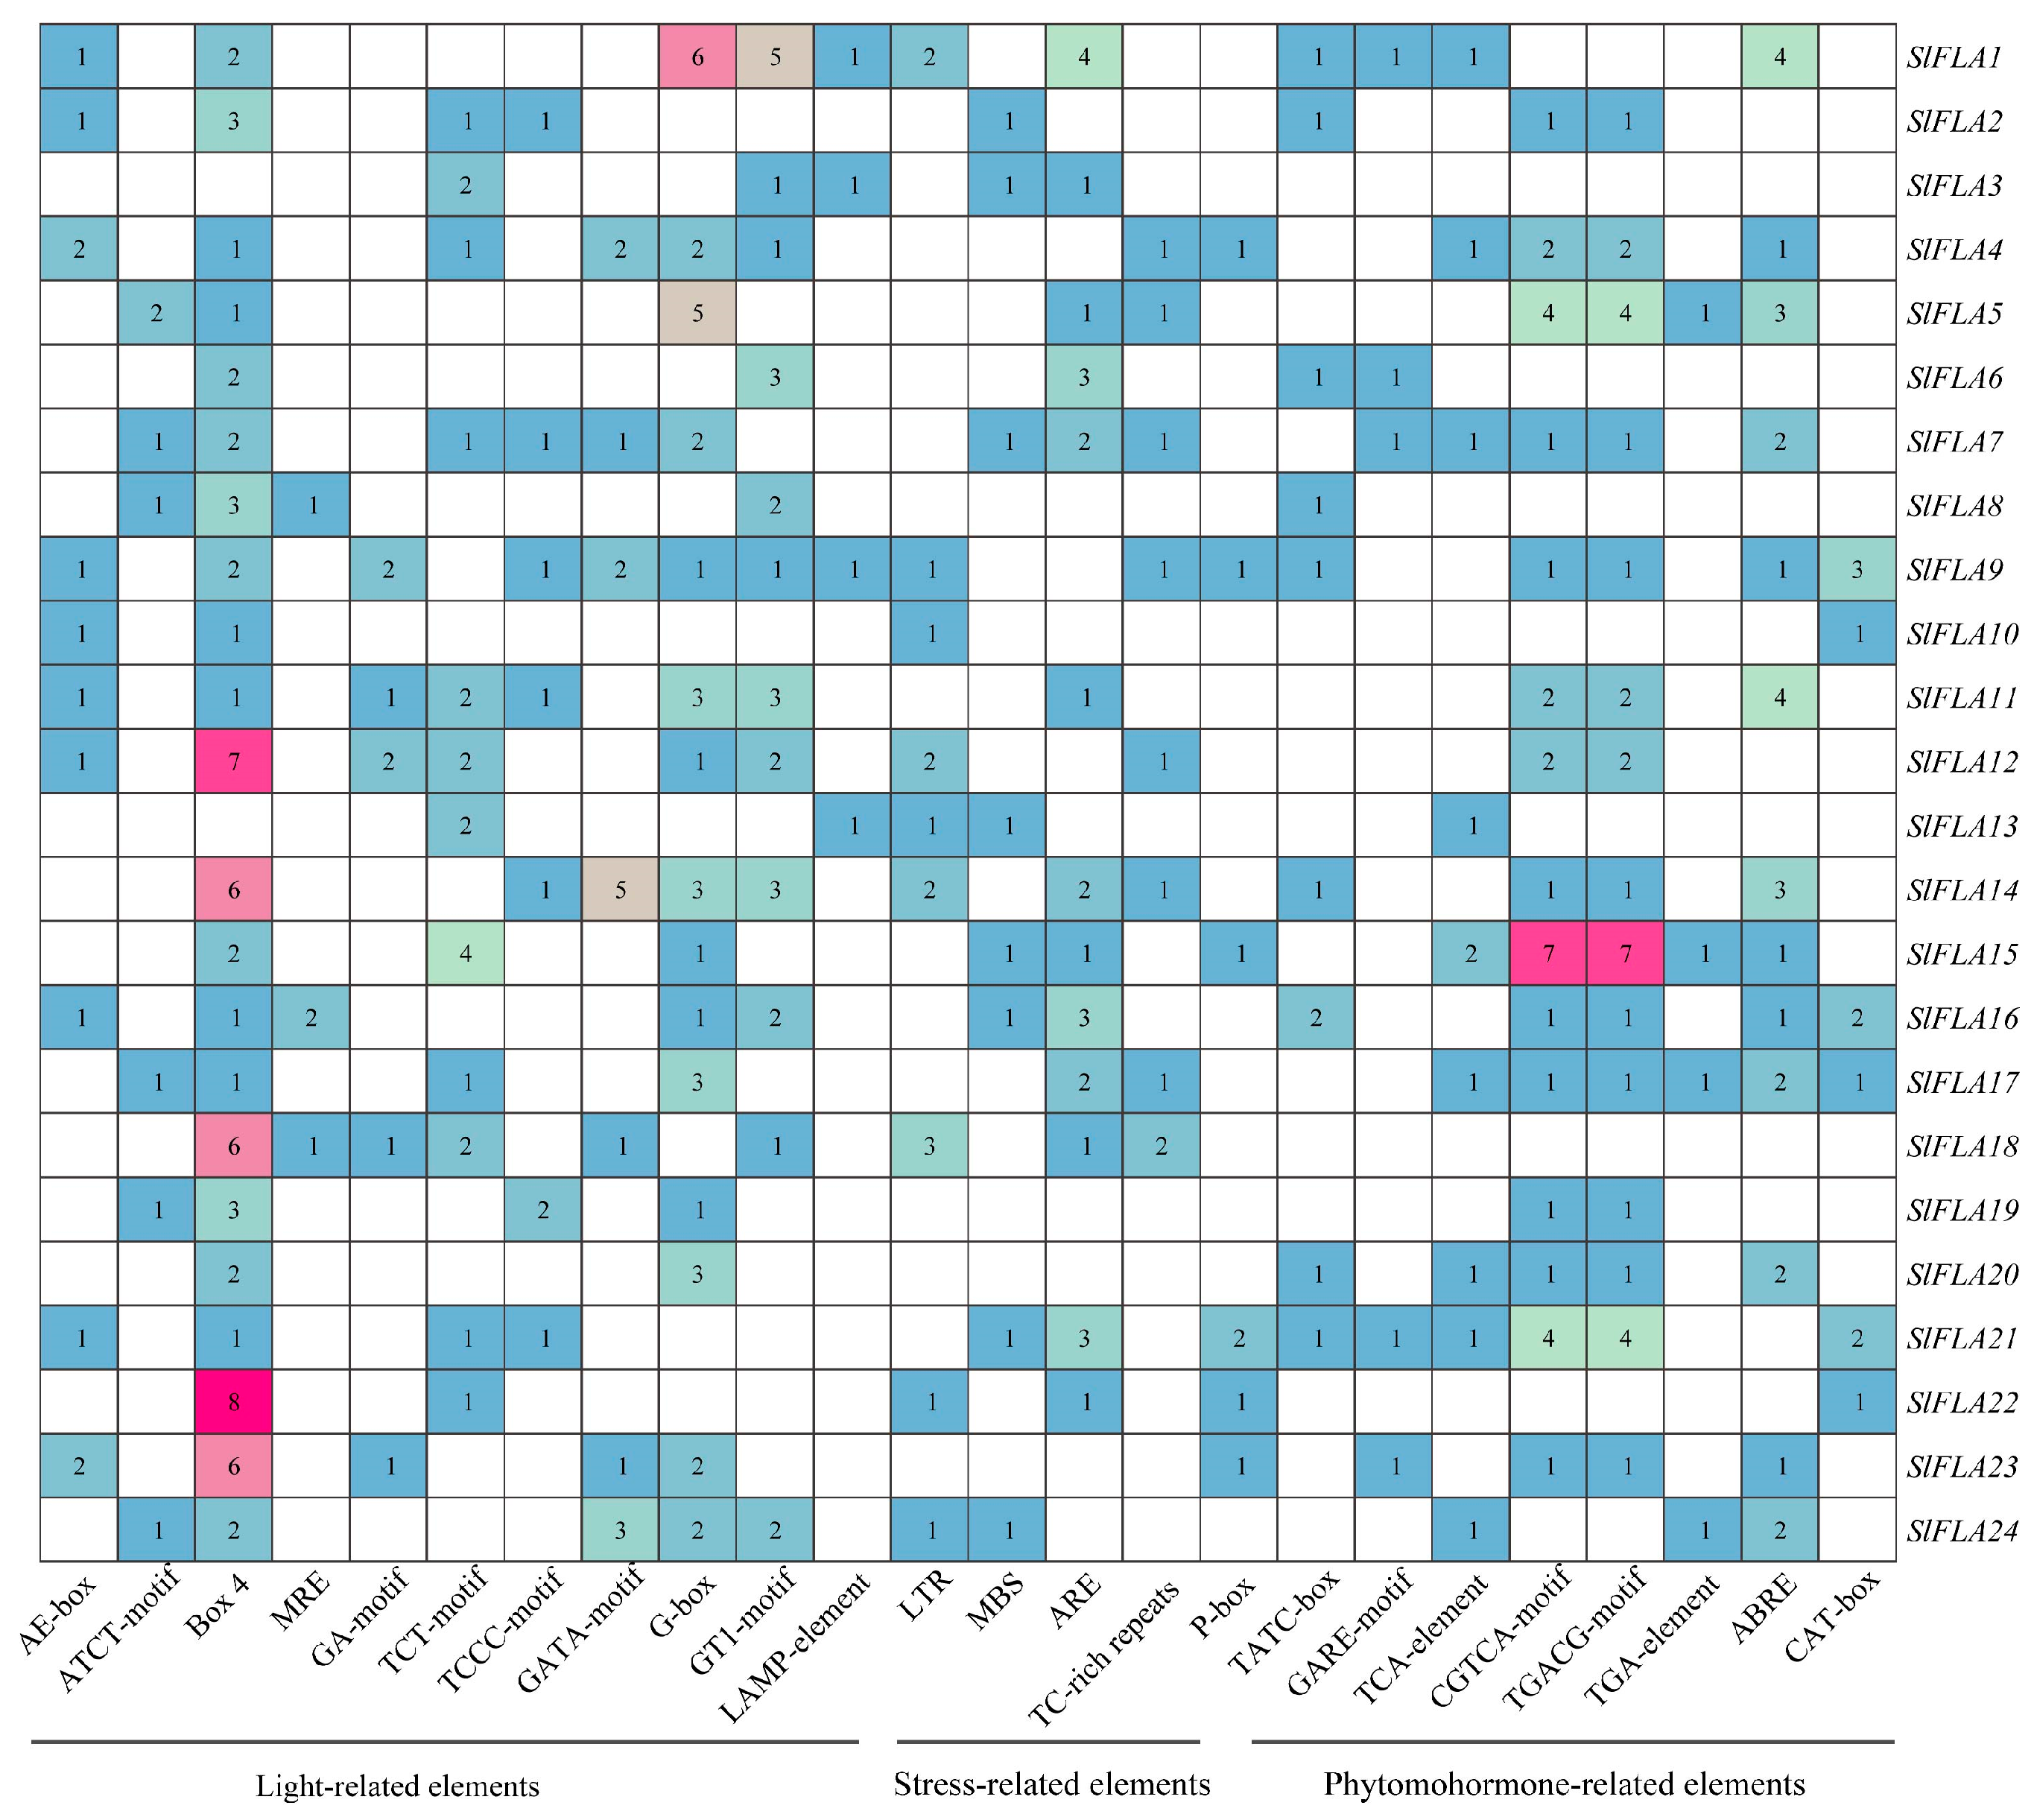
2.3. Analysis of Cis-Acting Elements of Tomato FLA Family Genes

The tomato FLA gene contains a total of 25 homeotic-acting elements (Figure 4 and Table 2). Among them, eleven elements (AE-box, ATCT-motif, Box 4, MRE, GA-motif, TCT-motif, TCCC-motif, GATA-motif, G-box, GT1-motif, and LAMP-element) are associated with light response, four elements (LTR, MBS, ARE, and TC-rich repeats) are related to stress response, and nine elements (P-box, TATC-box, GARE-motif, and TCA-element) are related to hormone response (Figure 4). To further investigate the cis-elements in the FLA promoter sequence, three major cis-acting elements were identified, including light-, stress-, and hormone-acting elements (Figure 5). Box 4 element is distributed in all tomato FLA genes, except SlFLA3, and SlFLA22 contains the highest number. The GA-motif is the least light-responsive element. The LTR element is mainly distributed in SlFLA1, SlFLA12, SlFLA4, and SlFLA18. The ARE element is mainly distributed in SlFLA1 and SlFLA6. Both CGTCA-motif and TGACG-motif elements are mainly distributed in SlFLA15. Thus, the relative abundance of cis-elements related to light, stress, and hormones suggests that the tomato FLA gene might play a crucial role in regulating plant growth and hormone responses.

2.4. Conserved Domain and Conserved Motifs of the Tomato FLA family

The conserved structural domains of the proteins encoded by tomato FLA was analyzed. The results show that the FLA protein has a conserved protein structure including three conserved domains of H1, H2, and [Y/F] H at the N-terminus (Figure 6A) [11]. The tomato FLA protein has a conserved fasciclin structural domain. In the tomato FLA family, the maximum value was set to 10 conserved motifs (Figure 6B), and the sequence information of the characterized conserved motifs is shown in Table 3, where the amino acid sequences of the different conserved motifs are indicated by a stack of letters at each position (Figure 6C). The length of each motif varies between 10 and 50 amino acids. The results show that the 10 characterized tomato FLA motifs are very similar, with Motif4 presented in all tomato FLA proteins. In addition, Motif4, Motif7, and Motif8 occur twice in some members.

2.5. Analysis of the Protein Secondary Structure of Tomato FLA Family Genes

The most abundant protein secondary structures in tomato FLA members were mainly α-helices and random coils (Table 4). The 24 FLA-encoded protein secondary structures were α-helices (22.6–41.43%), extended chains (13.15–25.99%), β-turns (2.41–8.01%), and random coils (36.69–53.41%).

2.6. Tissue-Specific Expression Pattern of Tomato FLA Genes

In order to study the expression of FLA genes in tomato tissues at different growth stages, we analyzed the expression of FLA genes in 16 tomato tissues, including unopened flower buds, fully opened flowers, leaves, roots, 1 cm fruits, 2 cm fruits, 3 cm fruits, ripened green fruits, pink fruits, red fruits, breaker fruit, breaker fruit+5, breaker fruit+7, breaker fruit+10, and ripened fruits (Figure 7). SlFLA expression was relatively high in root, stem, leaf, flower, and green fruit, whereas the expression was lower in fruits at the breaker fruit and ripening stages. Most SlFLAs were most highly expressed in roots, whereas SlFLA8, SlFLA9, SlFLA19, and SlFLA20 were most highly expressed in flower buds. In addition, SlFLA1 expression was significantly higher in fruits than other genes. But SlFLA14 had a low expression level in all tissues. Thus, the SlFLA family is mainly expressed in roots, followed by leaves and stems.

2.7. Expression of Tomato FLA Genes in Response to MeJA and ABA Treatments

In order to clarify the role of FLAs in tomato under hormone stress, the expression of 12 tomato FLA genes under different treatments was determined based on the statistical analysis of cis-acting elements. Its most hormone-responsive elements are MeJA (methyl jasmonate) and ABA (abscisic acid) based on the results of cis-acting element analysis, and thus MeJA and ABA were used to treat tomato seedlings. The tomato FLA family responded to MeJA and ABA to varying degrees (Figure 8). SlFLA1 was significantly up-regulated after 6 h of MeJA and ABA treatments. Under the MeJA treatment, the expression of all members, except SlFLA5 and SlFLA7, was significantly up-regulated at 6 h. In contrast, SlFLA1 reached the highest levels at 12 h of treatment with MeJA. Under the ABA treatment, the expression of all members, except SlFLA7, was significantly up-regulated at 6 h; SlFLA7 increased by 6.5-fold at 6 h compared with at 0 h. SlFLA1 reached its highest value at 12 h, and both SlFLA3 and SlFLA7 increased gradually, reaching their highest levels at 24 h. Interestingly, the expression of SlFLA14 and SlFLA21 under the ABA treatment showed a gradual increase over time. Therefore, most of the tomato FLA genes were significantly up-regulated under the stimulation of ABA and MeJA, and their expression reached the highest value at 6 h, and then gradually decreased to the lowest at 48 h.

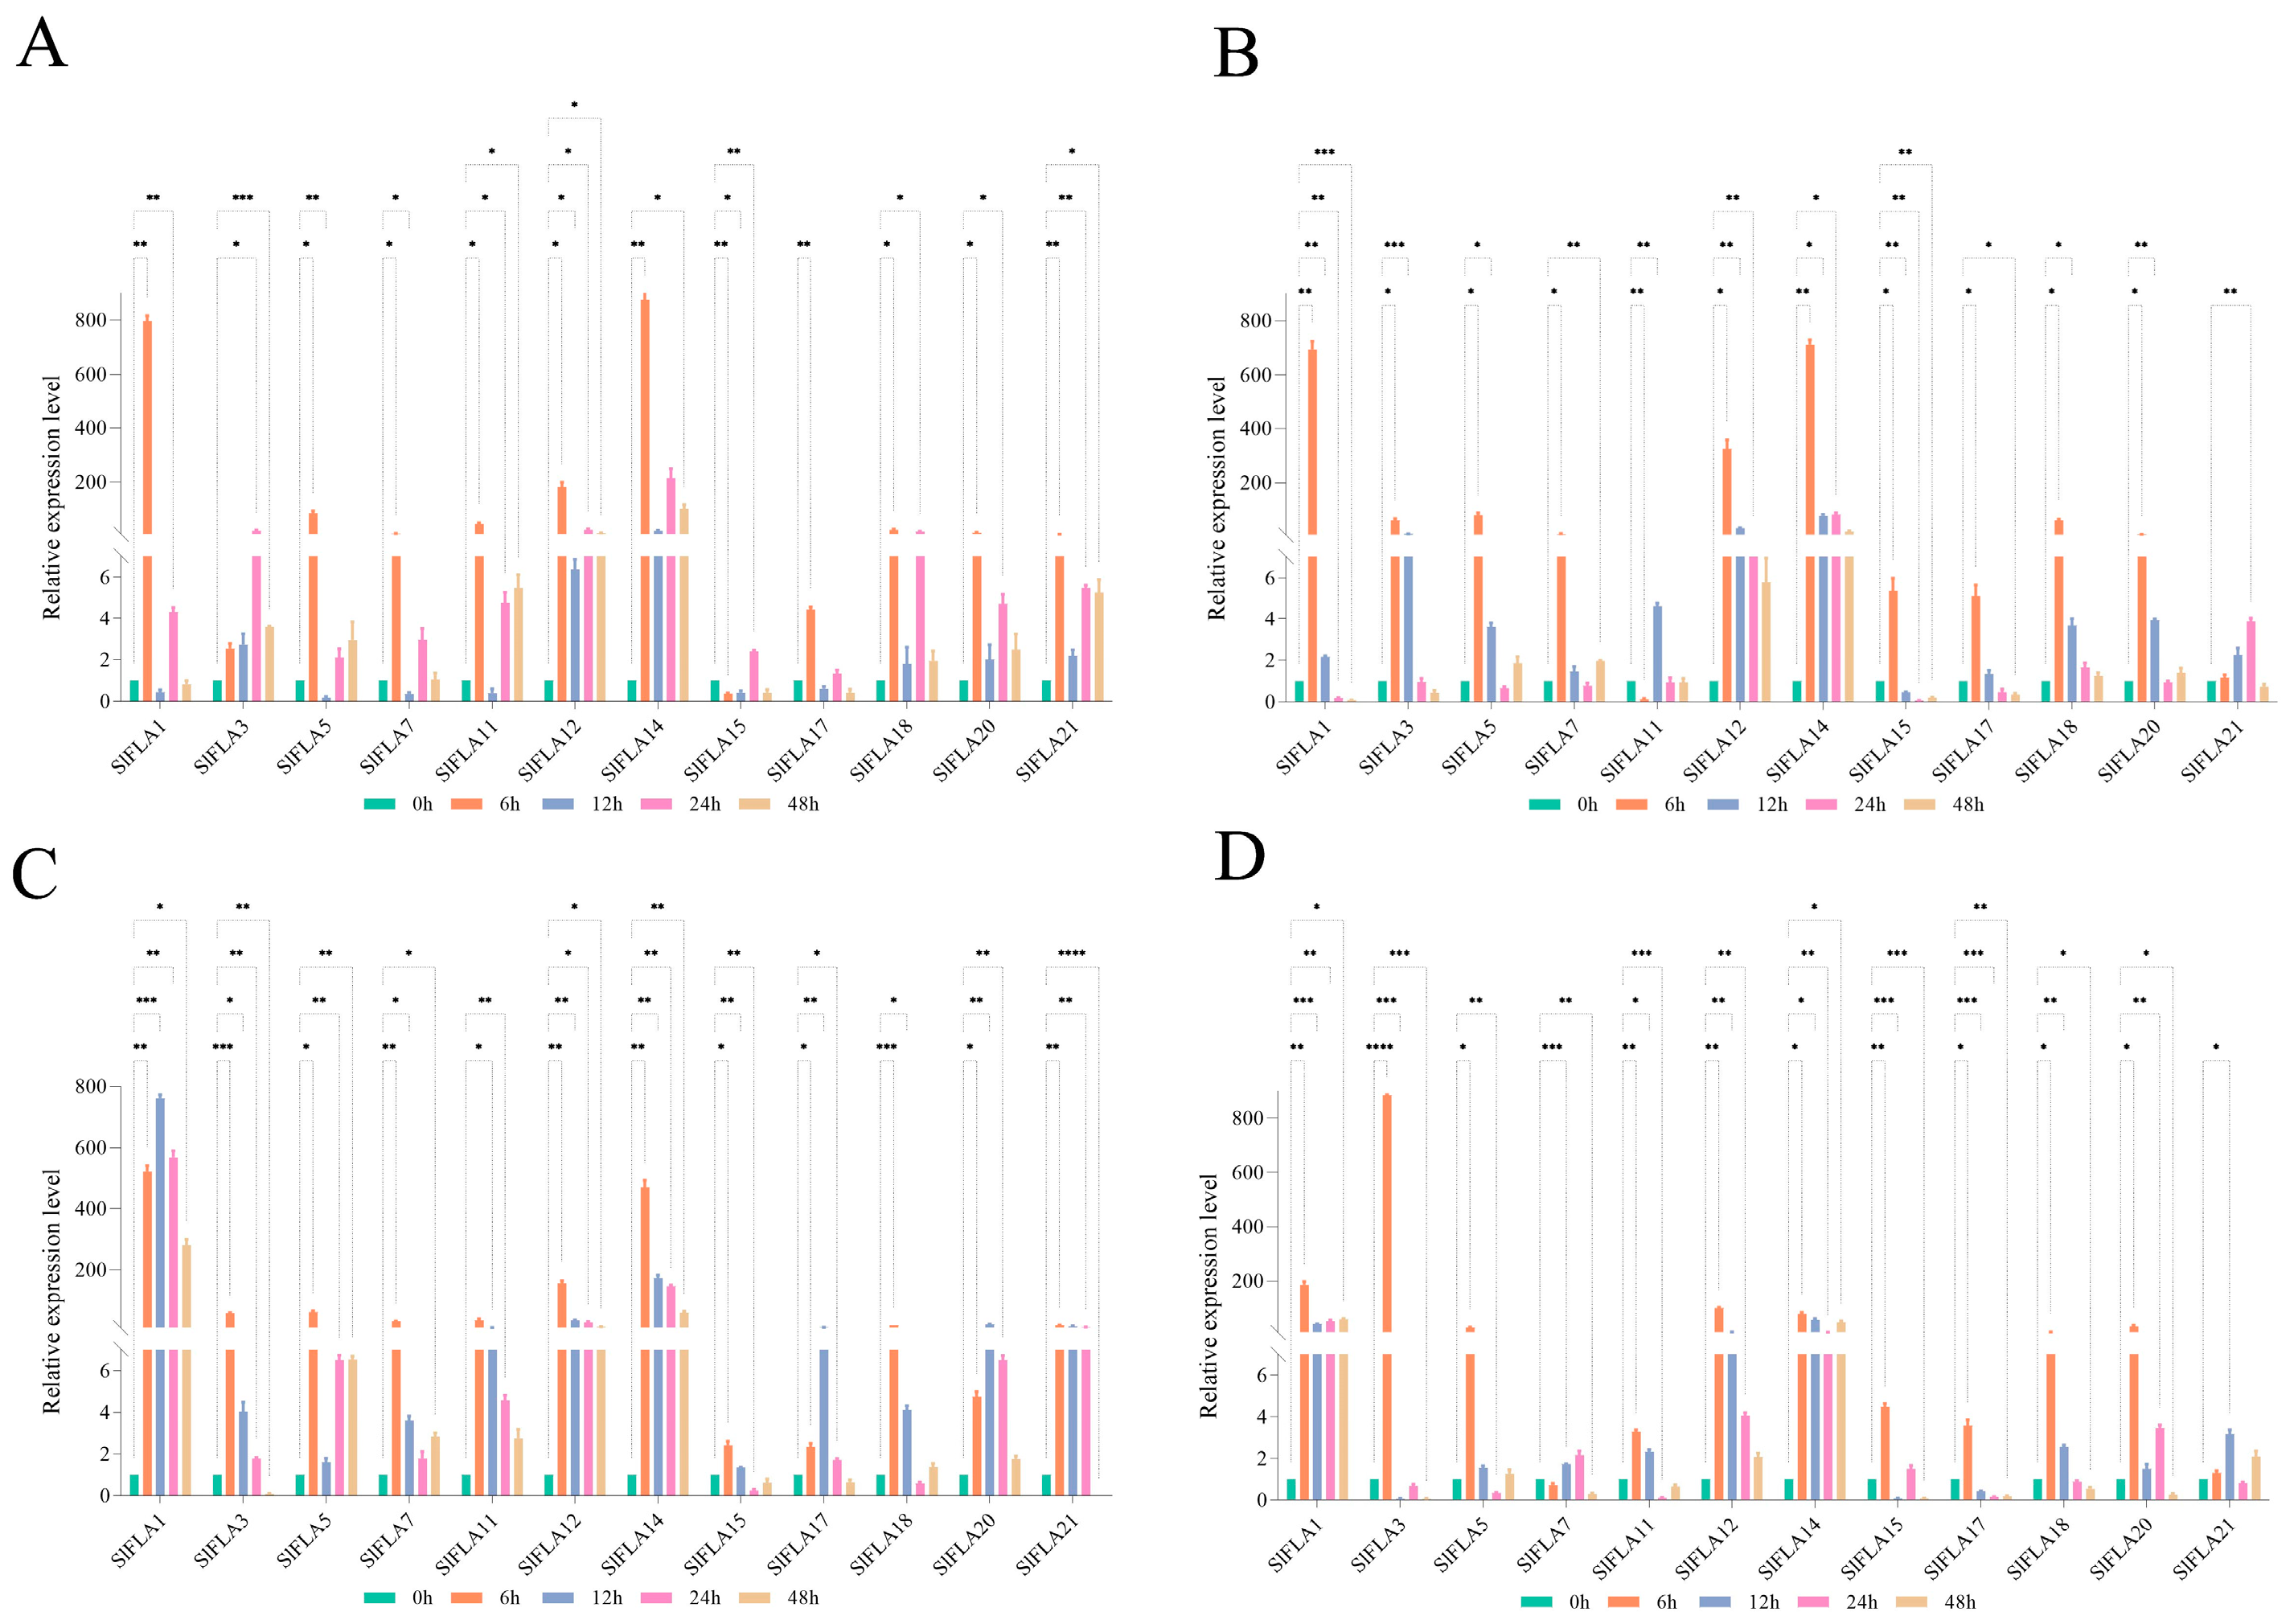
2.8. Expression Profile Analysis of FLA Genes in Tomato under NaCl, Dark, Cold, and PEG Treatments

To elucidate the role of FLAs in tomato under abiotic stress, the expression levels of 12 FLA genes were investigated in tomato under low temperature, darkness, NaCl, and PEG (Polyethylene glycol) treatments. As shown in Figure 9, the relative expression of the 12 SlFLA genes was different under low-temperature conditions. Under low-temperature conditions, the expression of all members, except SlFLA15, was significantly up-regulated at 6 h (Figure 9A); SlFLA15 was down-regulated by 0.3-fold at 6 h compared with at 0 h. Among all members, SlFLA3 reached its highest value at 24 h; the expression levels of the remaining genes were highest at 24 h and then declined slowly. The greatest changes were observed in SlFLA1 and SlFLA14 in the low-temperature treatment. In addition, SlFLA1 and SlFLA14 were expressed at higher levels than other members under darkness, low temperature, and NaCl stresses; their expression increased by at least 500-fold at 6 h compared with at 0 h.
Under darkness stress, SlFLAs were significantly upregulated at 6 h, except for SlFLA11 (Figure 9B); SlFLA21 reached its highest value at 24 h and other members reached their highest values at 6 h. Tomato FLA expression was up-regulated by NaCl treatment (Figure 9C). The expression levels of all members, except SlFLA1, reached their highest values at 6 h. The relative expression of SlFLA12 and SlFLA14 remained unchanged after 12 h, whereas the expression of the remaining SlFLA genes gradually decreased. The greatest change in expression was observed in SlFLA14, which increased by 470.3-fold at 6 h compared with at 0 h. In addition, SlFLA was significantly up-regulated to a higher extent under NaCl stress compared with other abiotic stresses (dark, PEG, and low temperature). Thus, we predict that tomato FLA mainly responds to NaCl stress.
The relative expression of the twelve tomato FLA genes showed a similar trend under PEG treatment (Figure 9D). Ten of these genes (SlFLA1, SlFLA3, SlFLA5, SlFLA11, SlFLA21, SlFLA14, SlFLA15, SlFLA17, SlFLA18, and SlFLA20) were up-regulated under short-term (6 h) PEG stress. The greatest change in expression was observed in SlFLA1, SlFLA3, and SlFLA12, which increased by 522.11-fold, 55.96-fold, and 154.81-fold, respectively, compared with that at 0 h. With the increase in drought treatment time, the expression of SlFLA1 and SlFLA14 tended towards stability.

3. Discussion

FLAs are a subdivided type of HRGPs, which are typical cell wall proteins involved in plant growth and development and immunity [5]. FLAs may be involved in plant growth and development and adaptation to environmental conditions [10]. In total, 21 FLA genes have been identified in A. thaliana [1], 27 FLA genes have been identified in rice [9], 34 FLA genes have been identified in wheat [2], 35 FLA genes have been identified in poplar [10], and 19 FLA genes have been identified in cotton [11]. In this study, a more comprehensive and systematic analysis of the FLA gene family in tomato was carried out using bioinformatic techniques, and 24 FLA genes were characterized and shown to be distributed on 10 chromosomes in tomato (Figure 1).
In addition, we found that their structural domains were conserved (Figure 6). Of the 24 SlFLAs, 17 had a single-bundle protein structural domain and 7 had two structural domains. The signal peptide prediction indicated that all members of the tomato FLA family, except for SlFLA19, had signal peptides, and loci located around 20. Additionally, 24 tomato FLAs are GPI-anchored. Most putative GhFLAs have a C-terminal signal sequence recognized by a transamidase that replaces this peptide sequence with a GPI module [11]. GPI-anchored signals with bundle protein structural domains are important for cell adhesion, membrane localization, and enabling more stable interactions between adhesion complexes. However, there is no consistent pattern in the number of fasciclin domains or the presence of a GPI signal. It has been suggested that plants may have FLAs that are GPI-anchored to maintain the integrity of the plasma membrane, whereas FLAs that are not GPI-anchored are used to mediate cell expansion [5].
We analyzed the structure of 24 SlFLA genes and found that 25% of SlFLAs contain one intron, whereas the remaining members have lost their introns (Figure 3). In Salicornia spp., 34.88% of FLA genes contain one intron [23], and a similar structure occurs in tobacco, where the majority of the members do not have introns [24]. The introns of FLA genes are normally lost during plant evolution [23]. The previously reported fasciclin structural domain contains about 110–150 amino acid residues and has two highly conserved regions (H1 and H2) and a [Phe/Tyr]-His ([Y/F] H) motif [11], which has been found in tobacco, wheat, Arabidopsis, and rice [2,24]. We found that tomato FLAs also possess this structural domain (Figure 6A), which is similar to previous identifications in other species, suggesting that the members of the tomato FLA gene family are conserved in gene structure. As in the case of the FLAs found in other species, these 24 SlFLAs contain the conserved structural domains of typical FLA proteins. Therefore, fasciclin domains are important for the function of the molecule.
To understand the relationship between tomato FLA members and other species, we constructed a phylogenetic tree of FLA members in tomato, Arabidopsis, and pepper, and we classified 75 FLA members into four groups. The 24 SlFLA members belonged to these four types (Figure 3), which indicates that the structure and function of SlFLAs are highly conserved during plant evolution [25]. In group D, the number of FLA members in tomato and other species was greater than the number of members distributed in groups A, B, and C, suggesting that FLAs underwent rapid adaptive evolution in group D [26]. In addition, in the same group, the closest members have similar gene structures and may have similar functions. It has been demonstrated that AtFLA1 and AtFLA3 play important roles in Arabidopsis in response to low temperature and salt stress [27]. Therefore, we speculated that SlFLA1 might have a similar function to these genes. Subsequent experiments also demonstrated that most of the SlFLA genes were indeed up-regulated under salt stress (Figure 9). Related studies have found a correlation between the abundance of AtFLA11 and AtFLA12 transcripts containing a single FAS domain and the onset of secondary cell wall cellulose synthase expression in Arabidopsis stems [18]. In addition, the phenotypes of AtFLA11 mutants showed the presence of a mild collapsed vessel phenotype and reduced stem cellulose content [18]. These analyses indicated that the FLA members in group C are associated with secondary wall and cellulose synthesis in the stem.
Previous studies have shown that FLAs are expressed in different patterns in various plant tissues [18,24,28]. For example, AtFLA11/12 and some EgrFLAs were highly expressed in stems [18], 10 Pop-FLAs were highly expressed in poplar stems [28], NbFLA11/18/31/32/34 were highly expressed in young leaves, and NbFLA4 was highly expressed in flowers [24]. In addition, some FLAs were highly expressed in roots, for example, PtrFLA12/21/22/24/27/28/30 and NbFLA7/34 [10,24]. In the present study, we found that most of the members of the tomato FLA gene family were highly expressed in roots (Figure 7), including SlFLA6/7/16/18/21/24, suggesting that SlFLAs might be involved in the development of root apical meristematic tissue. Previously, it was reported that PtFLA6 was specifically expressed in tension wood, and the reduction in PtFLA6 transcripts affected trunk dynamics [20]. It was suggested that Arabidopsis FLA11 and FLA12 might have an effect on plant stem strength and stem elastic modulus [18]. Indeed, our results show that SlFLA11 (homologue AtFLA11/12) was highly expressed in stems (Figure 7), and it was hypothesized that SlFLA11 may have the same function as AtFLA11/12 in Arabidopsis, indicating that it may play a role in stem dynamics. For tomato, lodging resistance is essential in order to avoid yield losses, and has become one of the main goals of crop breeding [29]. Considering that Arabidopsis AtFLA11 and AtFLA12 are involved in plant stem strength and stem elasticity modulus, analyzing the homologues of these genes (SlFLA11) may help to reveal their roles in regulating tomato stem strength and ultimately contribute to the breeding of tomato varieties.
Several biotic and abiotic stresses result in significant changes in the transcription of FLAs. For example, the expression level of wheat FLA proteins was elevated under H2O2 stress, which may contribute to H2O2 tolerance in wheat [30]. Similarly, the expression of AtFLA3 was enhanced by cold stress [31]. In this study, we found that all SlFLA expression levels were elevated at 6 h and relatively reduced at 12 to 24 h after exposure to low temperature or salt stress. PtrFLA2/12/20/21/24/30 expression was up-regulated under salt stress [10], and OsFLA10/18 expression was reduced [9]. Interestingly, cotton FLAs were down-regulated under salt stress [11], whereas our results show that tomato FLAs were all up-regulated after 6 h of salt stress. We hypothesize that this could be due to an initial stress response triggered by low temperature or salt stress, followed by a subsequent adaptation phase. However, further studies are needed to confirm this.
In addition, TaFLA3/4/9 were down-regulated after either ABA or NaCl treatment [2], and OsFLA24 and AtFLA1/2/8 were significantly reduced by the exogenous ABA treatment [8,9]. In this paper, we found that SlFLA15 and SlFLA17 were down-regulated by the ABA treatment (Figure 8A), suggesting that they are involved in ABA signal transduction pathways. In addition, this study showed that tomato FLAs were also up-regulated by the MeJA treatment, with SlFLA1 being the most significant, and that both drought and darkness caused different degrees of up-regulation of tomato FLAs. TaFLA9/12/14 were specifically upregulated by dehydration stress [2]. Therefore, the tomato FLA gene family has important potential functions for growth and abiotic stress response, whereas the specific functions of tomato FLA genes need to be investigated in depth.

4. Materials and Methods

4.1. Identification of the FLA Family Members in Tomato

The whole-genome data (SL3.0) and annotation files (SL3.0) for tomato were downloaded from NCBI (https://www.NCBI.nlm.nih.gov/ (accessed on 5 June 2023)). Tomato CDS sequences were extracted through the “Gtf/Gff3 Sequences Extract” feature of TBtools software (v1.09876), and the software’s “Batch TranSlate CDS to Protein” function was then used to convert CDSs to protein sequences [28]. The Arabidopsis database was used to search for the identified FLA gene family members, and the ID and protein sequences of the Arabidopsis FLA gene family were saved. To determine further whether an identified protein belonged to the FLA gene family, the “Batch Web CD-Search Tool” function of NCBI and the “Visualize NCBI CDD Domain Pattern” function of TBtools were used to analyze the protein domain, and those that did not contain FLA domains were deleted. Finally, the members of the cucumber FLA gene family were obtained, and these genes were named SlFLA genes.

4.2. Physicochemical Properties and Signal Peptide Analysis of the FLA Gene Family in Tomato

To analyze the physicochemical properties of the tomato FLA gene family, the molecular weights, instability coefficients, isoelectric points, and hydrophilicity of each member of the horse tomato FLA gene were analyzed using the Expasy online website (https://web.expasy.org/compute_pi/ (accessed on 8 June 2023)). The WoLF PSORT online website (https://wolfpsort.hgc.jp/ (accessed on 8 June 2023)) was used to analyze the subcellular localization of each SlFLA. The signal peptide prediction of the tomato FLA protein was performed using SignalP (https://services.healthtech.dtu.dk/service.php?SignalP-5.0 (accessed on 8 June 2023)).

4.3. Gene Location, Ka (Nonsynonymous)/Ks (Synonymous) Analysis, and Gene Structure Analysis

The chromosomal position distribution of tomato FLA genes was analyzed using the “Gene Location Visualize from GTF/GFF” function of TBtools software [32]. The “Simple Ka/Ks Calculator (NG)” function of TBtools software was used to calculate the selection and evolutionary pressure values of the tomato FLA gene family.

4.4. Conserved Motif and Protein Conserved Domain Analysis

The shared conserved motifs of the tomato FLA gene family were analyzed online using the MEME website (https://meme-suite.org/meme/tools/meme (accessed on 10 June 2023)), and the results were visualized using the TBtools software; the structural visualization of the tomato FLA gene family was undertaken using the TBtools “Gene Structure View (Advanced)”. The conserved structural domains of the tomato FLA gene family were analyzed using the DNAMAN software (v6).

4.5. Phylogenetic Tree and Cis-Acting Elements Analysis

The FLA protein sequences of Arabidopsis and pepper (Capsicum annuum) were downloaded from the Arabidopsis and NCBI databases, respectively. The protein sequences of tomato, Arabidopsis, and pepper were combined in the same file, and the evolutionary tree was constructed using the MEGA11 software (v11.0.13), in which the neighbor-joining method was used; the number of replicates was set to 1000, and the rest of the options were set to the default values. The website Evolview (https://www.evolgenius.info//evolview/#mytrees/clcle/123 (accessed on 12 June 2023)) was then used for the further modification of the evolutionary tree.
The “Gtf/Gff3 Sequences Extract” and “Fasta Extract (Recommended)” functions of TBtools were used to extract the 2000 upstream FLA genes of tomato from the tomato gene databases. Here, 2000 bp of data upstream of the tomato FLA genes were extracted from the tomato gene databases; these were submitted to the PlantCARE (http://bioinformatics.psb.ugent.be/webtools/plantcare/ (accessed on 26 June 2023)) database for gene homeotic element (promoter) analysis and were visualized using TBtools.

4.6. Tissue Expression Analysis of the FLA Genes in Tomato

The IDs of the SlFLA genes were searched in the TomExpress (http://tomexpress.toulouse.inra.fr/ (accessed on 4 July 2023)) database. Then, the data were sorted and the expression patterns of SlFLA in different tissues were drawn using TBtools [33].

4.7. Transcriptional Analysis of the FLA Genes in Tomato under Different Abiotic Stresses and Hormone Treatments, Plant Materials, and Treatments

Tomato (S. lycopersicum ’Micro-Tom’) seeds were provided by Gansu Agricultural University. The sterilized seeds were put into a 250 mL conical flask filled with 100 mL sterile water, then placed in a HYG-C type shaker, and cultured at a rotation speed of 180 r min−1. The sterile water was changed once a day. After germination, tomato seeds were transferred to plug trays containing substrate. After the cotyledons were fully expanded, a nutrient solution was added to the plant container every 2 d. The environmental photoperiod of the control growth chamber was 16/8 h (light/dark), the air temperature was 26/20 °C (day/night), and the light intensity was 250 µmol m−2 s−1. After 21 d, healthy seedlings of uniform size were selected for subsequent treatments. For the NaCl, ABA, MeJA, and PEG 6000 treatments, the seedlings were transplanted into 1/2 Hoagland nutrient solution containing NaCl (150 mM), ABA (100 µM), MeJA (50 µM), and PEG 6000 (20%) and incubated for 0, 6, 12, 24, and 48 h. For the cold treatments, the seedlings were placed in 1/2 Hoagland nutrient solution and in a refrigerator (Qingdao Haier Specialty Appliances Co., Ltd., Qingdao, China) at 4 °C for 0, 6, 12, 24, and 48 h. For the dark treatment, the tomato seedlings were treated in black airtight and breathable paper boxes. Leaf samples were collected for qRT-PCR experiments after treatment at 0, 6, 12, 24, and 48 h [34].
The collected samples were immediately frozen with liquid nitrogen and stored in a vertical ultra-low-temperature refrigerator at −80 °C (Qingdao Haier Special Electric Appliance Co., Ltd., Qingdao, China). Each treatment contained three biological replicates.

4.8. RNA Extraction and qRT-PCR Fluorescence Quantification

Total RNA was extracted from the samples using TRIzol reagent (Invitrogen, Carlsbad, CA, USA), taking advantage of the FastQuant First Strand cDNA Synthesis Kit (Tiainen, Beijing, China) to synthesize cDNA. These reactions were carried out under the following conditions: 37 °C for 15 min, 85 °C for 5 s, and finally ending at 4 °C. LightCycler 480 Real-Time PCR System (Roche Applied Science, Penzberg, Germany) and SYBR Green Premix Pro Taq HS Premix kit were used for qRT-PCR. The reaction system was 2×SYBR Green Pro Taq HS Premix 10 mL, primer F 0.4 μL, primer R 0.4 μL, cDNA 2 μL, and ddH2O 7.2 μL. The primers used in qRT-PCR were designed with Primer 5.0, and the internal reference was Actin (NC015447.3) as shown in File S2. The qRT-PCR data were analyzed using the 2−ΔΔCt calculation method.

4.9. Data Statistics and Analysis

The data were analyzed using the SPSS 22.0 software (SPPS Inc., Chicago, IL, USA). In all experiments, at least three biological replicates were used. All data from three independent experiments were used. Statistical differences between measurements at different times or in different treatments were analyzed using Duncan’s multiple range test. Differences were considered significant at a probability level of p < 0.05 [35].

5. Conclusions

In general, 24 FLA genes were characterized in the tomato genome. This gene family contains a common conserved structural domain, and its members all contain signal peptides and transmembrane structures. Furthermore, SlFLA members might have key housekeeping functions by regulating cellular metabolism during plant growth and development. Last but not least, we provide evidence that tomato FLAs might be involved in mitigating various abiotic stresses and hormonal responses, and we predict that tomato FLAs mainly respond to NaCl stress, with SlFLA1 showing the greatest changes in expression under hormonal and abiotic stresses. SlFLA1 and SlFLA3 are significantly induced under drought stress. Thus, the present study may provide support for further studies on the involvement of the SlFLA gene family in tomato growth regulation and stress response, and provide a theoretical basis for the further exploration of the functions of plant FLA members.

Supplementary Materials

The following supporting information can be downloaded at: https://www.mdpi.com/article/10.3390/ijms242216063/s1.

Author Contributions

Conceptualization, W.L.; Formal Analysis, Z.Z., Y.Y. and X.P.; Funding Acquisition, W.L.; Investigation, Y.Z. and Y.H.; Resources, W.L.; Supervision, C.W. and A.L.; Writing—Original Draft Preparation, K.Y. and Z.D.; Writing—Review and Editing, C.L. and W.L. All authors have read and agreed to the published version of the manuscript.

Funding

This work was supported by the National Natural Science Foundation of China (Nos. 32360743, 32072559, 31860568, 31560563, and 31160398); the Key Research and Development Program of Gansu Province, China (No. 21YF5WA096); the National Key Research and Development Program (2018YFD1000800); the Research Fund of Higher Education of Gansu, China (Nos. 2018C-14 and 2019B-082); and the Natural Science Foundation of Gansu Province, China (No. 1606RJZA073). The funders had no role in the study design, data collection and analyses, decision to publish, or preparation of the manuscript.

Institutional Review Board Statement

Not applicable.

Informed Consent Statement

Not applicable.

Data Availability Statement

All data, tables, and figures in this manuscript are original, and are contained within the article and Supplementary Materials.

Conflicts of Interest

The authors declare no conflict of interest.

References

  1. Johnson, K.L.; Jones, B.J.; Bacic, A.; Schultz, C.J. The Fasciclin-Like Arabinogalactan Proteins of Arabidopsis. A multigene family of putative cell adhesion molecules. Plant Physiol. 2003, 133, 1911–1925. [Google Scholar] [CrossRef] [PubMed]
  2. Faik, A.; Abouzouhair, J.; Sarhan, F. Putative fasciclin-like arabinogalactan-proteins (FLA) in wheat (Triticum aestivum) and rice (Oryza sativa): Identification and bioinformatic analyses. Mol. Genet. Genom. MGG 2006, 276, 478–494. [Google Scholar] [CrossRef] [PubMed]
  3. De Lorenzo, G.; Ferrari, S.; Giovannoni, M.; Mattei, B.; Cervone, F. Cell wall traits that influence plant development, immunity, and bioconversion. Plant J. 2019, 97, 134–147. [Google Scholar] [CrossRef] [PubMed]
  4. Bacete, L.; Melida, H.; Miedes, E.; Molina, A. Plant cell wall-mediated immunity: Cell wall changes trigger disease resistance responses. Plant J. 2018, 93, 614–636. [Google Scholar] [CrossRef]
  5. Showalter, A.M.; Keppler, B.; Lichtenberg, J.; Gu, D.; Welch, L.R. A Bioinformatics Approach to the Identification, Classification, and Analysis of Hydroxyproline-Rich Glycoproteins. Plant Physiol. 2010, 153, 485–513. [Google Scholar] [CrossRef] [PubMed]
  6. Hijazi, M.; Velasquez, S.M.; Jamet, E.; Estevez, J.M.; Albenne, C. An update on post-translational modifications of hydroxyproline-rich glycoproteins: Toward a model highlighting their contribution to plant cell wall architecture. Front. Plant Sci. 2014, 5, 395. [Google Scholar] [CrossRef]
  7. Showalter, A.M. Arabinogalactan-proteins: Structure, expression and function. Cell. Mol. Life Sci. CMLS 2001, 58, 1399–1417. [Google Scholar] [CrossRef]
  8. Clout, N.J.; Tisi, D.; Hohenester, E. Novel fold revealed by the structure of a FAS1 domain pair from the insect cell adhesion molecule fasciclin I. Structure 2003, 11, 197–203. [Google Scholar] [CrossRef]
  9. Ma, H.; Zhao, J. Genome-wide identification, classification, and expression analysis of the arabinogalactan protein gene family in rice (Oryza sativa L.). J. Exp. Bot. 2010, 61, 2647–2668. [Google Scholar] [CrossRef]
  10. Zang, L.; Zheng, T.; Chu, Y.; Ding, C.; Zhang, W.; Huang, Q.; Su, X. Genome-Wide Analysis of the Fasciclin-Like Arabinogalactan Protein Gene Family Reveals Differential Expression Patterns, Localization, and Salt Stress Response in Populus. Front. Plant Sci. 2015, 6, 1140. [Google Scholar] [CrossRef] [PubMed]
  11. Huang, G.-Q.; Xu, W.-L.; Gong, S.-Y.; Li, B.; Wang, X.-L.; Xu, D.; Li, X.-B. Characterization of 19 novel cotton FLA genes and their expression profiling in fiber development and in response to phytohormones and salt stress. Physiol. Plant. 2008, 134, 348–359. [Google Scholar] [CrossRef] [PubMed]
  12. Kim, S.; Park, J.; Yeom, S.I.; Kim, Y.M.; Seo, E.; Kim, K.T.; Kim, M.S.; Lee, J.M.; Cheong, K.; Shin, H.S.; et al. New reference genome sequences of hot pepper reveal the massive evolution of plant disease-resistance genes by retroduplication. Genome Biol. 2017, 18, 210. [Google Scholar] [CrossRef] [PubMed]
  13. Li, J.; Wu, X. Genome-wide identification, classification and expression analysis of genes encoding putative fasciclin-like arabinogalactan proteins in Chinese cabbage (Brassica rapa L.). Mol. Biol. Rep. 2012, 39, 10541–10555. [Google Scholar] [CrossRef]
  14. Wang, H.; Jin, Y.; Wang, C.; Li, B.; Jiang, C.; Sun, Z.; Zhang, Z.; Kong, F.; Zhang, H. Fasciclin-like arabinogalactan proteins, PtFLAs, play important roles in GA-mediated tension wood formation in Populus. Sci. Rep. 2017, 7, 6182. [Google Scholar] [CrossRef]
  15. Zhang, Z.; Xin, W.; Wang, S.; Zhang, X.; Dai, H.; Sun, R.; Frazier, T.; Zhang, B.; Wang, Q. Xylem sap in cotton contains proteins that contribute to environmental stress response and cell wall development. Funct. Integr. Genom. 2015, 15, 17–26. [Google Scholar] [CrossRef] [PubMed]
  16. Pereira, A.M.; Pereira, L.G.; Coimbra, S. Arabinogalactan proteins: Rising attention from plant biologists. Plant Reprod. 2015, 28, 1–15. [Google Scholar] [CrossRef]
  17. Shi, H.; Kim, Y.; Guo, Y.; Stevenson, B.; Zhu, J.-K. The Arabidopsis SOS5 locus encodes a putative cell surface adhesion protein and is required for normal cell expansion. Plant Cell 2003, 15, 19–32. [Google Scholar] [CrossRef]
  18. MacMillan, C.P.; Mansfield, S.D.; Stachurski, Z.H.; Evans, R.; Southerton, S.G. Fasciclin-like arabinogalactan proteins: Specialization for stem biomechanics and cell wall architecture in Arabidopsis and Eucalyptus. Plant J. 2010, 62, 689–703. [Google Scholar] [CrossRef]
  19. Liu, E.; MacMillan, C.P.; Shafee, T.; Ma, Y.; Ratcliffe, J.; van de Meene, A.; Bacic, A.; Humphries, J.; Johnson, K.L. Fasciclin-Like Arabinogalactan-Protein 16 (FLA16) Is Required for Stem Development in Arabidopsis. Front. Plant Sci. 2020, 11, 615392. [Google Scholar] [CrossRef]
  20. Wang, H.; Jiang, C.; Wang, C.; Yang, Y.; Yang, L.; Gao, X.; Zhang, H. Antisense expression of the fasciclin-like arabinogalactan protein FLA6 gene in Populus inhibits expression of its homologous genes and alters stem biomechanics and cell wall composition in transgenic trees. J. Exp. Bot. 2015, 66, 1291–1302. [Google Scholar] [CrossRef]
  21. Hsieh, T.-H.; Li, C.-W.; Su, R.-C.; Cheng, C.-P.; Sanjaya; Tsai, Y.-C.; Chan, M.-T. A tomato bZIP transcription factor, SlAREB, is involved in water deficit and salt stress response. Planta 2010, 231, 1459–1473. [Google Scholar] [CrossRef] [PubMed]
  22. Krishna, R.; Karkute, S.G.; Ansari, W.A.; Jaiswal, D.K.; Verma, J.P.; Singh, M. Transgenic tomatoes for abiotic stress tolerance: Status and way ahead. 3 Biotech 2019, 9, 143. [Google Scholar] [CrossRef] [PubMed]
  23. Zhang, Y.; Zhou, F.; Wang, H.; Chen, Y.; Yin, T.; Wu, H. Genome-Wide Comparative Analysis of the Fasciclin-like Arabinogalactan Proteins (FLAs) in Salicacea and Identification of Secondary Tissue Development-Related Genes. Int. J. Mol. Sci. 2023, 24, 1481. [Google Scholar] [CrossRef] [PubMed]
  24. Wu, X.; Lai, Y.; Lv, L.; Ji, M.; Han, K.; Yan, D.; Lu, Y.; Peng, J.; Rao, S.; Yan, F.; et al. Fasciclin-like arabinogalactan gene family inNicotiana benthamiana: Genome-wide identification, classification and expression in response to pathogens. BMC Plant Biol. 2020, 20, 305. [Google Scholar] [CrossRef] [PubMed]
  25. Qin, N.; Gao, Y.; Cheng, X.; Yang, Y.; Wu, J.; Wang, J.; Li, S.; Xing, G. Genome-wide identification of CLE gene family and their potential roles in bolting and fruit bearing in cucumber (Cucumis sativus L.). BMC Plant Biol. 2021, 21, 143. [Google Scholar] [CrossRef]
  26. Hsu, P.D.; Scott, D.A.; Weinstein, J.A.; Ran, F.A.; Konermann, S.; Agarwala, V.; Li, Y.; Fine, E.J.; Wu, X.; Shalem, O.; et al. DNA targeting specificity of RNA-guided Cas9 nucleases. Nat. Biotechnol. 2013, 31, 827–832. [Google Scholar] [CrossRef] [PubMed]
  27. Li, J.; Yu, M.; Geng, L.L.; Zhao, J. The fasciclin-like arabinogalactan protein gene, FLA3, is involved in microspore development of Arabidopsis. Plant J. 2010, 64, 482–497. [Google Scholar] [CrossRef]
  28. Lafarguette, F.; Leple, J.-C.; Dejardin, A.; Laurans, F.; Costa, G.; Lesage-Descauses, M.-C.; Pilate, G. Poplar genes encoding fasciclin-like arabinogalactan proteins are highly expressed in tension wood. New Phytol. 2004, 164, 107–121. [Google Scholar] [CrossRef] [PubMed]
  29. Adelana, B.O. Relationship between lodging, morphological characters and yield of tomato cultivars. Sci. Hortic. 1980, 13, 143–148. [Google Scholar] [CrossRef]
  30. Ge, P.; Hao, P.; Cao, M.; Guo, G.; Lv, D.; Subburaj, S.; Li, X.; Yan, X.; Xiao, J.; Ma, W.; et al. iTRAQ-based quantitative proteomic analysis reveals new metabolic pathways of wheat seedling growth under hydrogen peroxide stress. Proteomics 2013, 13, 3046–3058. [Google Scholar] [CrossRef]
  31. Takahashi, D.; Kawamura, Y.; Uemura, M. Cold acclimation is accompanied by complex responses of glycosylphosphatidylinositol (GPI)-anchored proteins in Arabidopsis. J. Exp. Bot. 2016, 67, 5203–5215. [Google Scholar] [CrossRef] [PubMed]
  32. Chen, C.; Chen, H.; Zhang, Y.; Thomas, H.R.; Frank, M.H.; He, Y.; Xia, R. TBtools: An Integrative Toolkit Developed for Interactive Analyses of Big Biological Data. Mol. Plant 2020, 13, 1194–1202. [Google Scholar] [CrossRef] [PubMed]
  33. Kim, M.-H.; Sato, S.; Sasaki, K.; Saburi, W.; Matsui, H.; Imai, R. COLD SHOCK DOMAIN PROTEIN 3 is involved in salt and drought stress tolerance in Arabidopsis. FEBS Open Bio 2013, 3, 438–442. [Google Scholar] [CrossRef]
  34. Pan, X.; Wang, C.; Liu, Z.; Gao, R.; Feng, L.; Li, A.; Yao, K.; Liao, W. Identification of ABF/AREB gene family in tomato (Solanum lycopersicum L.) and functional analysis of ABF/AREB in response to ABA and abiotic stresses. PeerJ 2023, 11, e15310. [Google Scholar] [CrossRef] [PubMed]
  35. Bertinetto, C.; Engel, J.; Jansen, J. ANOVA simultaneous component analysis: A tutorial review. Anal. Chim. Acta X 2020, 6, 100061. [Google Scholar] [CrossRef] [PubMed]
Figure 1. Chromosomal localization of the FLA gene in tomato. Chromosome positioning was based on the physical location of the 24 tomato FLAs. Chromosome numbers are shown at the top of each bar chart. Gene names are indicated in black. The scale bar is on the left.
Ijms 24 16063 g001
Figure 2. Exon-intron structure of the FLA gene family in tomato. The evolutionary tree was constructed based on the full lengths of tomato FLA protein sequences using MEGA11.0 (v11.0.13). The exon-intron graph of tomato FLA genes was drawn using TBtools software (v1.09876). The untranslated regions (UTRs) are indicated by thick yellow boxes; the exons are indicated by thick green boxes; the introns are indicated by black lines.
Ijms 24 16063 g002
Figure 3. The unrooted phylogenetic tree of the FLA gene family in S. lycopersicum, Arabidopsis, and Capsicum annuum. The maximum likelihood method was used to construct a phylogenetic tree containing 24 tomato, 21 A. thaliana (At), and 30 pepper FLA proteins. The four subgroups are colored differently. The three differently colored shapes represent FLA proteins from three species. The red rectangles are S. lycopersicum, the green stars are Arabidopsis, and the white circles are Capsicum annuum. The number on the node in the phylogenetic tree represents the percentage of trustworthiness of the branch in the bootstrap validation.
Ijms 24 16063 g003
Figure 4. Analysis of cis-acting elements of the FLA gene family in tomato. Different colored wedges represent different cis elements. The length and position of each SlFLA gene were mapped to scale. The scale bar represents the length of the DNA sequence.
Ijms 24 16063 g004
Figure 5. The number of cis-acting elements in tomato FLA genes. The different colors and numbers of the grid indicate the numbers of different cis-acting regulatory elements in these SlFLA genes.
Ijms 24 16063 g005
Figure 6. Conserved motif analysis of the FLA gene family in tomato. (A) Conserved structural domains of the tomato FLA gene family. Identical residues are shaded in blue. (B) Sequence analysis of FLA gene family in tomato. The differently colored rectangles are different motifs. (C) Amino acid sequences of different conserved motifs displayed by stacks of letters at each position. The total height of the stack represents the information content of the relative amino acid in the position of each letter in the motif in bits. The height of the individual letter in a stack was calculated by the probability of the letter at that position times the total information content of the stack. The X- and Y-axes represent the width and the bits of each letter, respectively.
Ijms 24 16063 g006
Figure 7. Expression analysis of different tissues of the FLA gene family in tomato. Color scale represents fold change normalized by log2-transformed data. Heatmaps are shown in blue/yellow/red for low/medium/high expression, respectively.
Ijms 24 16063 g007
Figure 8. Relative expression analysis of the SlFLA gene under the ABA (A) and MeJA (B) treatments. Error bars represent the standard deviation of the three biological replicates. Different colors indicate different time periods. The asterisk (*) indicates that the expression level of the stress group is significantly different from that of the control group (* p ≤ 0.05, ** p ≤ 0.01, *** p ≤ 0.001, **** p ≤ 0.0001, one-way ANOVA, Tukey’s test).
Ijms 24 16063 g008
Figure 9. Relative expression analysis of tomato FLA genes under the abiotic stresses of cold (A), dark (B), NaCl (C) and PEG (D). Error bars represent the standard deviation of three biological replicates. Different colors indicate different time periods. The asterisk (*) indicates that the expression level of the stress group is significantly different from that of the control group (* p ≤ 0.05, ** p ≤ 0.01, *** p ≤ 0.001, **** p ≤ 0.0001, one-way ANOVA, Tukey’s test).
Ijms 24 16063 g009
Table 1. Physicochemical properties of the FLA gene family in tomato.
Gene NameGene IDNumber of Amino AcidMolecular WeightTheoretical pIInstability IndexAliphatic IndexGrand Average of HydropathicitySubcellular LocalizationSignal PeptideTransmembrane DomainGPI
SlFLA110126374043948,342.315.8949.194.62−0.215ChloroplastYesYesYes
SlFLA210126265841443,073.975.643.0693.550.085ChloroplastYesYesYes
SlFLA310126293742746,167.185.0646.3797.470.076ChloroplastYesYesYes
SlFLA410125581235639,469.924.5448.6894.380.114ExtracellularYesYesYes
SlFLA510124424124926,003.194.9936.8983.090.031CytoplasmYesYesYes
SlFLA610124975442145,266.735.9152.28101.160.204ChloroplastYesYesYes
SlFLA710124948241143,611.725.6145.2889.34−0.013ChloroplastYesYesYes
SlFLA810464453225027,513.024.8935.7693.96−0.238MitochondrionYesYesYes
SlFLA910124917935038,531.738.8352.89109.740.249ExtracellularYesYesYes
SlFLA1010126482224726,425.846.0839.0185.26−0.29ChloroplastYesYesYes
SlFLA1110126141926428,015.186.5850.293.140.17ChloroplastYesYesYes
SlFLA1210125237740944,082.416.0631.1588.7−0.068ExtracellularYesYesYes
SlFLA1310125270526527,776.554.8352.1183.66−0.064ChloroplastYesYesYes
SlFLA1410125701025126,706.265.8944.1682.87−0.186ExtracellularYesYesYes
SlFLA1510464963236236,790.894.4960.7873.76−0.096Endoplasmic
ergatoplasm
YesYesYes
SlFLA1610125601424726,542.25.646.3689.6−0.006Plasma membraneYesYesYes
SlFLA1710126665423926,134.938.5647.5989.460.023VacuoleYesYesYes
SlFLA1810125487135438,682.997.1639.12101.050.289VacuoleYesYesYes
SlFLA1910464478544949,434.645.6746.595.75−0.14Endoplasmic
ergatoplasm
NoYesYes
SlFLA2010124460041544,208.45.7338.7381.9−0.047ChloroplastYesYesYes
SlFLA2110124918739742,609.936.2949.1495.520.251Plasma membraneYesYesYes
SlFLA2210126548440144,767.546.344.9599.680.047VacuoleYesYesYes
SlFLA2310126024824225,793.385.4327.9892.690.058VacuoleYesYesYes
SlFLA2410125406027730,716.849.3436.0383.86−0.168ChloroplastYesYesYes
Gene IDs were derived from NCBI’s Gene IDs. The physicochemical properties of the genes were calculated using TBtools. Yes: the sequence has a signal peptide or transmembrane domain or GPI signal. No: the sequence does not have a signal peptide or transmembrane domain or GPI signal.
Table 2. Functions of the cis-acting elements of each gene in the tomato FLA gene family.
Cis-ElementNumber of GenesSequence of Cis-ElementFunctions of Cis-Elements
ABRE27ACGTGcis-acting element involved in abscisic acid responsiveness
AE-box12AGAAACTTpart of a module for light response
ARE25AAACCAcis-acting regulatory element essential for anaerobic induction
ATCT-motif7AATCTAATCCpart of a conserved DNA module involved in light responsiveness
Box 463ATTAATpart of a conserved DNA module involved in light responsiveness
CAT-box10GCCACTcis-acting regulatory element related to meristem expression
CGTCA-motif30CGTCAcis-acting regulatory element involved in MeJA responsiveness
GA-motif7ATAGATAApart of a light-responsive element
GARE-motif5TCTGTTGgibberellin-responsive element
GATA-motif15GATAGGGpart of a light-responsive element
G-box36CACGTCcis-acting regulatory element involved in light responsiveness
GT1-motif26GGTTAAlight-responsive element
LAMP-element4CTTTATCApart of a light-responsive element
LTR14CCGAAAcis-acting element involved in low-temperature responsiveness
MBS8TTTTTACGGTTAMYB binding site involved in drought inducibility
MRE4AACCTAAMYB binding site involved in light responsiveness
P-box7CCTTTTGgibberellin-responsive element
TATC-box10TATCCCAcis-acting element involved in gibberellin responsiveness
TCA-element10CCATCTTTTTcis-acting element involved in salicylic acid responsiveness
TCCC-motif8TCTCCCTpart of a light-responsive element
TC-rich repeats9ATTCTCTAACcis-acting element involved in defense and stress responsiveness
TCT-motif20TCTTACpart of a light-responsive element
TGACG-motif30TGACGcis-acting regulatory element involved in MeJA responsiveness
TGA-element4AACGACauxin-responsive element
Number of genes: Total number of such cis-acting elements contained in tomato FLAs.
Table 3. Ten conserved motif sequences of the tomato FLA protein.
MotifWidth (aa)Motif Sequence
Motif 141AHNITKILEKYPZFSTFNRLLSTTQLAAEINSRLTITVLAV
Motif 250JKNVLSLHVLLDYFDAKKLHKITDGTTLVTTMFQATGKAPGNSGFVNITD
Motif 350ATNGAGKFPLNITTDGDQVNISTGIVTAKISNTIYDDNPLAIYQVDKVLL
Motif 429ZQKVQLLQYHVJPSYYSLSSLQTLSNPVR
Motif 548KGGKVGFGSADNBGHLPSTFVKSVMEIPYNISVJQISQPJVSPGAEAP
Motif 614TIFAPTDEAFSNLK
Motif 723FINGVEITDPDJYVNGRFVVHGI
Motif 821SPAPAPAPAPETAKAKTKSSK
Motif 929LMSAHGCKVFASLLLASPVEKTFEDBEEG
Motif 1050DSHYTELSELVEKALLLQPLEEAVSKHNITIFAPKNEALERDLDPEFKRF
Width (aa): number of amino acids included in the motif. The results were obtained by MEME.
Table 4. Secondary structure of the tomato FLA protein.
ProteinAlpha Helix (%)Extended Strand (%)Beta Turn (%)Random Coil (%)Distribution of Secondary Structure Elements
SlFLA135.0815.266.6143.05Ijms 24 16063 i001
SlFLA222.625.996.544.92Ijms 24 16063 i002
SlFLA337.3614.723.444.53Ijms 24 16063 i003
SlFLA436.9816.557.0639.42Ijms 24 16063 i004
SlFLA535.1918.045.1241.65Ijms 24 16063 i005
SlFLA628.3419.844.8646.96Ijms 24 16063 i006
SlFLA737.6616.745.4440.17Ijms 24 16063 i007
SlFLA830.3222.385.0542.24Ijms 24 16063 i008
SlFLA932.319.483.844.42Ijms 24 16063 i009
SlFLA102519.947.8747.19Ijms 24 16063 i010
SlFLA1128.9215.262.4153.41Ijms 24 16063 i011
SlFLA1230.6819.677.2642.39Ijms 24 16063 i012
SlFLA1341.4313.154.7840.64Ijms 24 16063 i013
SlFLA1433.3318.65.3142.75Ijms 24 16063 i014
SlFLA1528.9715.375.5450.13Ijms 24 16063 i015
SlFLA1627.1318.224.0550.61Ijms 24 16063 i016
SlFLA1732.820.82.843.6Ijms 24 16063 i017
SlFLA1835.419.98.0136.69Ijms 24 16063 i018
SlFLA1930.9221.77.2340.15Ijms 24 16063 i019
SlFLA2027.43186.8647.71Ijms 24 16063 i020
SlFLA2135.6117.426.0640.91Ijms 24 16063 i021
SlFLA2241.214.466.2738.07Ijms 24 16063 i022
SlFLA2334.7219.566.3639.36Ijms 24 16063 i023
SlFLA2428.123.974.9642.98Ijms 24 16063 i024
The different secondary structures are expressed as percentages. In the secondary structure figure, blue indicates alpha helix; green indicates beta turn; red indicates extended strand; and pink indicates random coil.
Disclaimer/Publisher’s Note: The statements, opinions and data contained in all publications are solely those of the individual author(s) and contributor(s) and not of MDPI and/or the editor(s). MDPI and/or the editor(s) disclaim responsibility for any injury to people or property resulting from any ideas, methods, instructions or products referred to in the content.

