
Ketosis Suppression and Ageing (KetoSAge): The Effects of Suppressing Ketosis in Long Term Keto-Adapted Non-Athletic Females
 , , , , , ,
  , ,
, ,
Abstract
:1. Introduction
2. Results
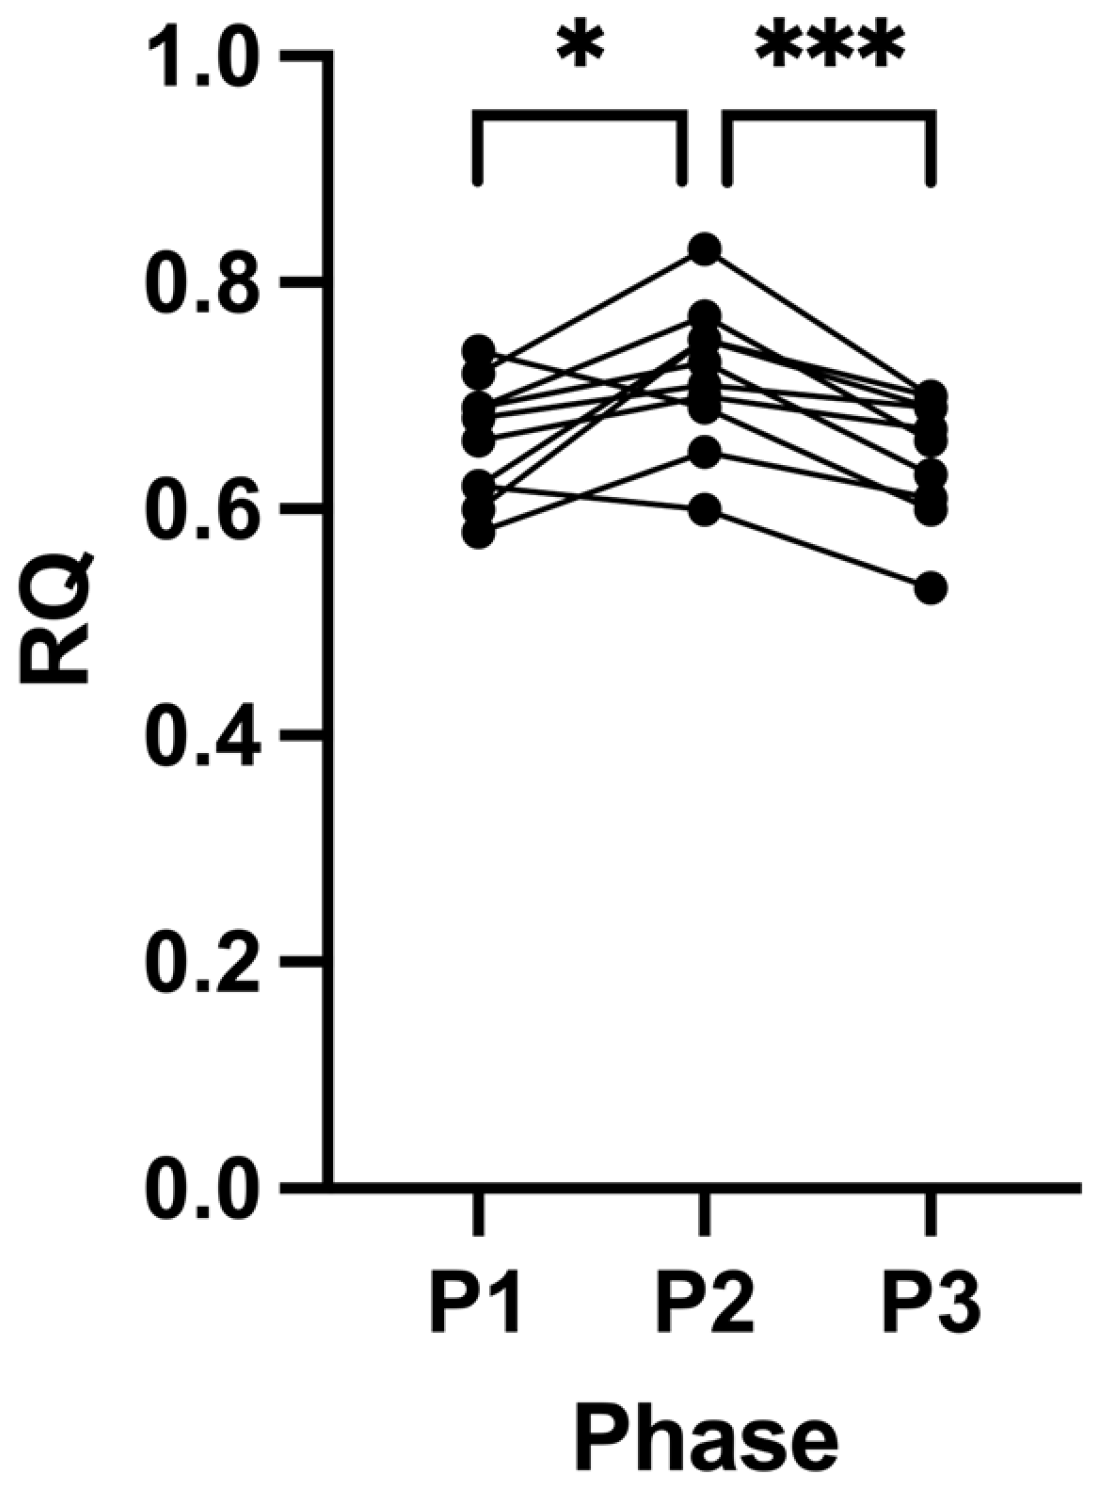
2.1. Suppression of Ketosis Increases BMI and Fat Mass
2.2. Adherence
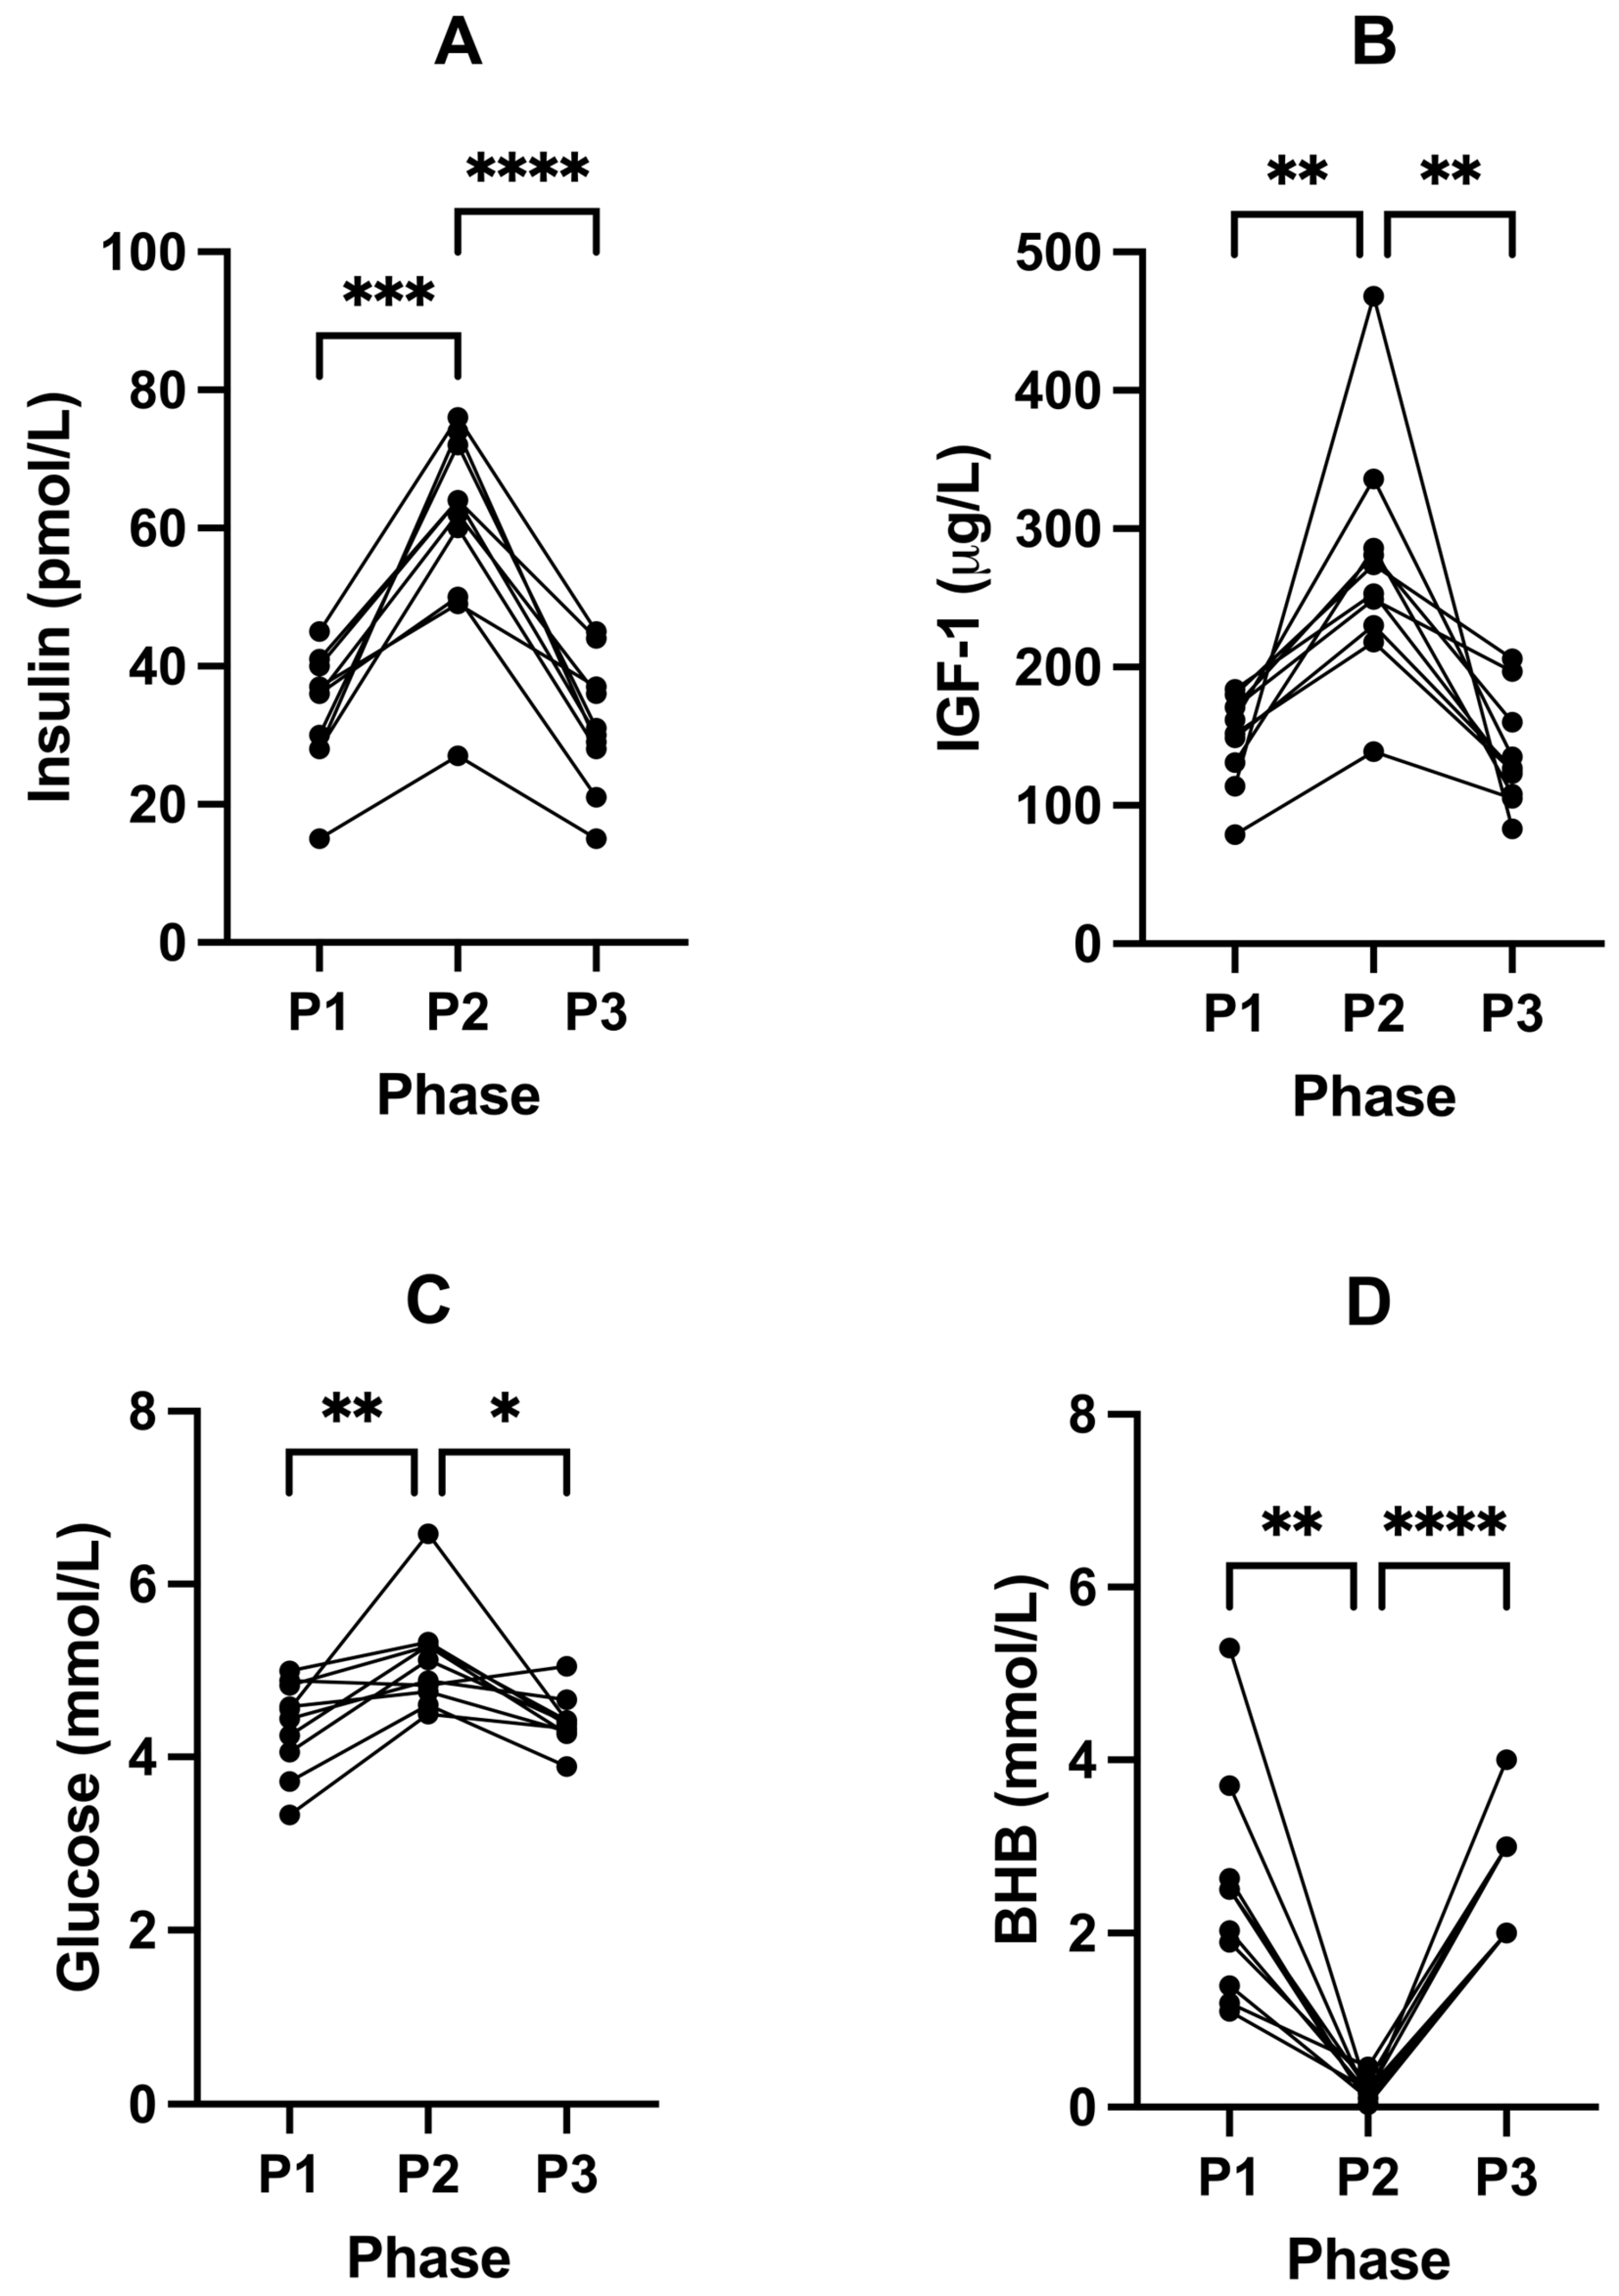
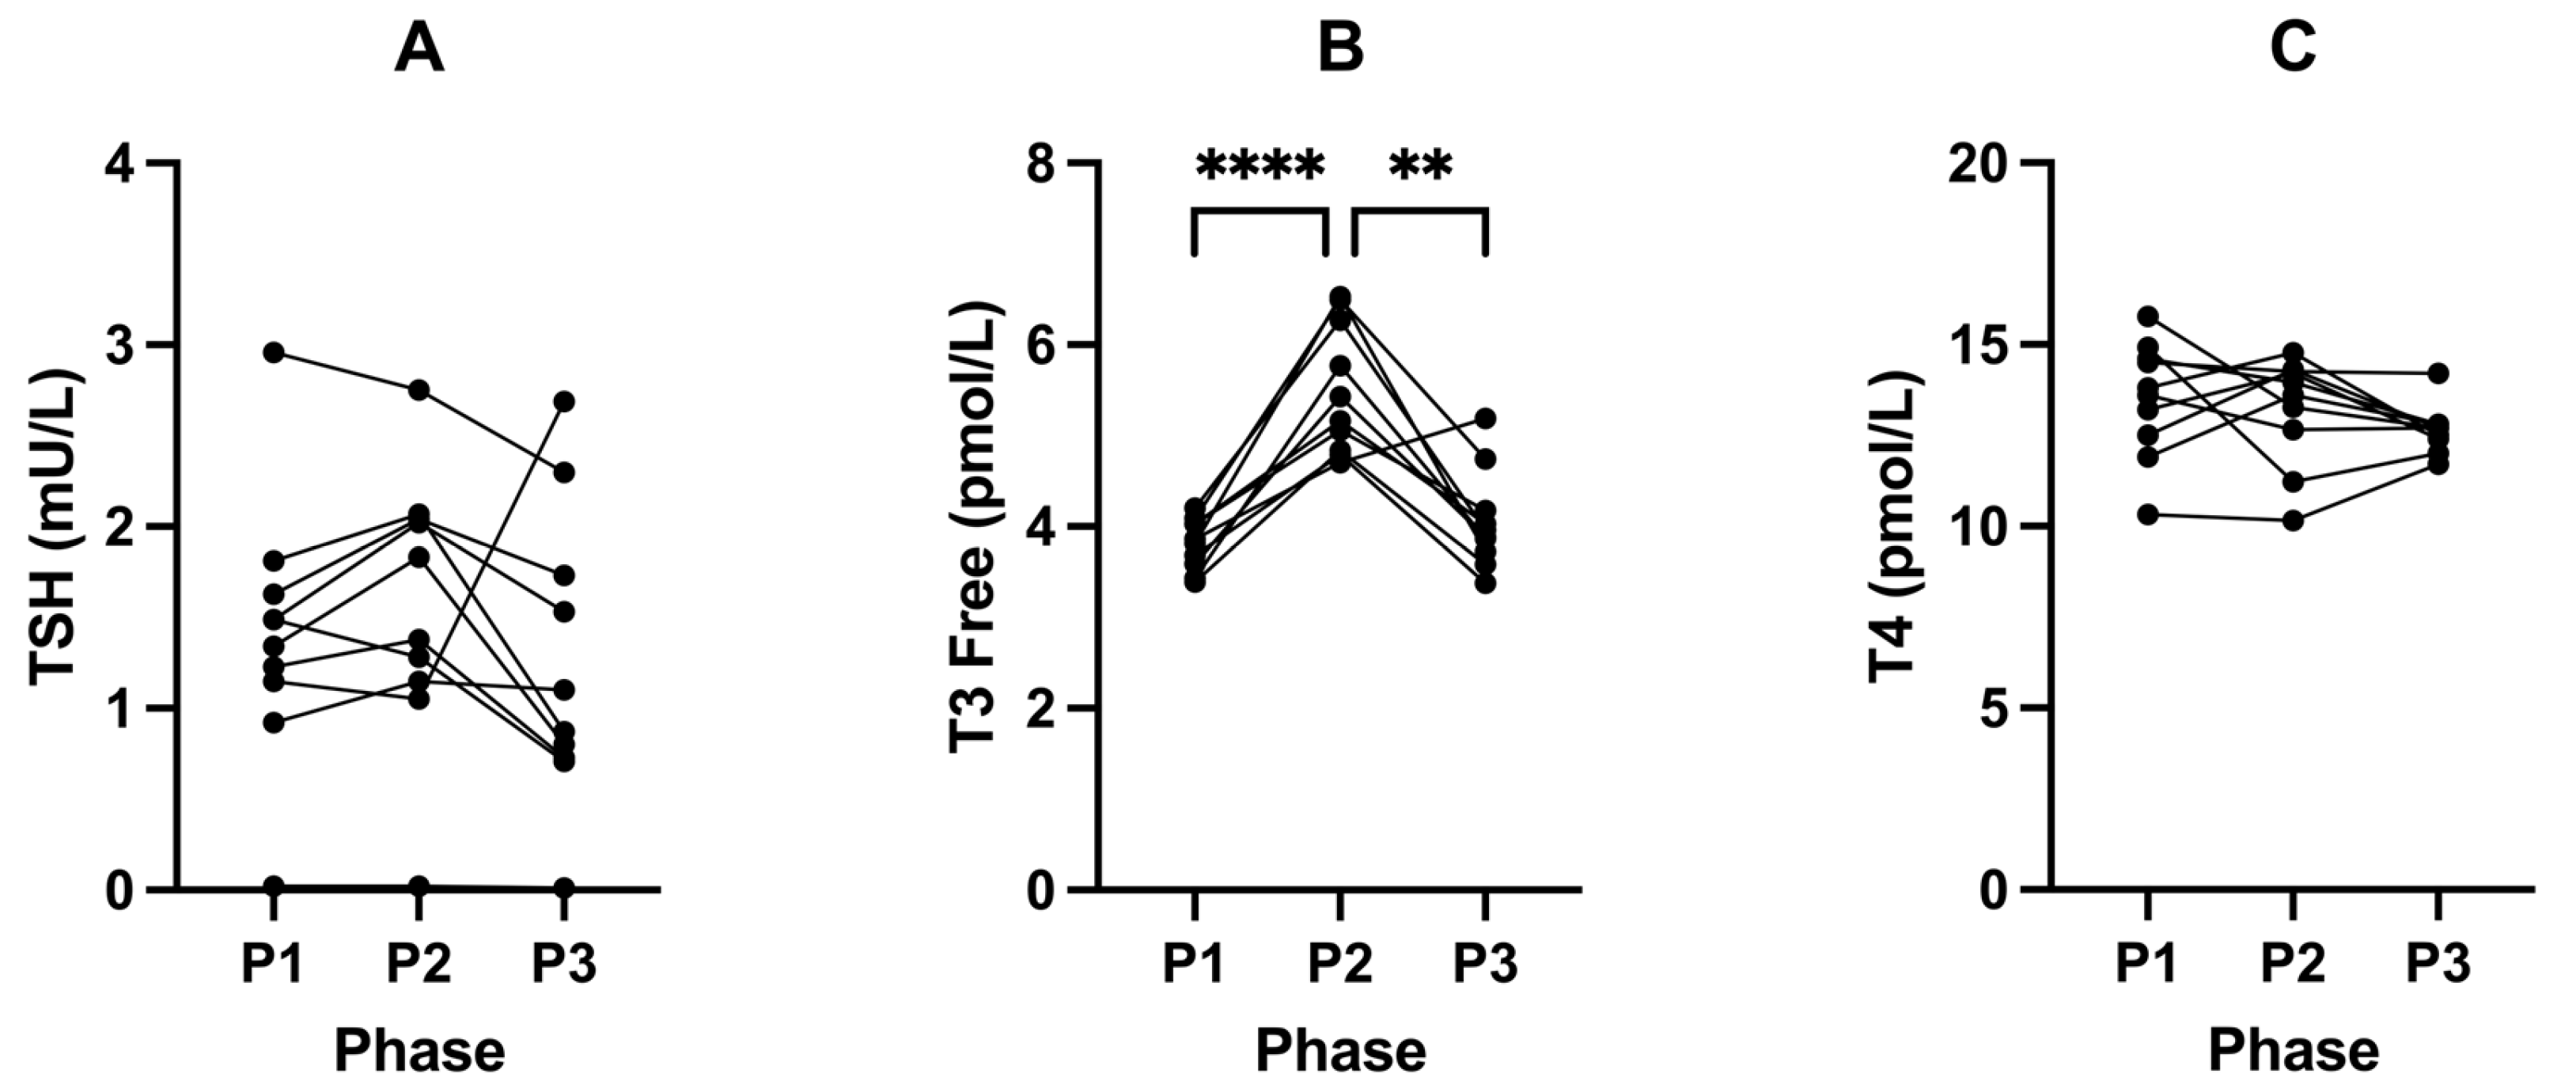
2.3. Suppression of Ketosis Is Associated with Increases in Insulin, IGF-1, Glucose and T3
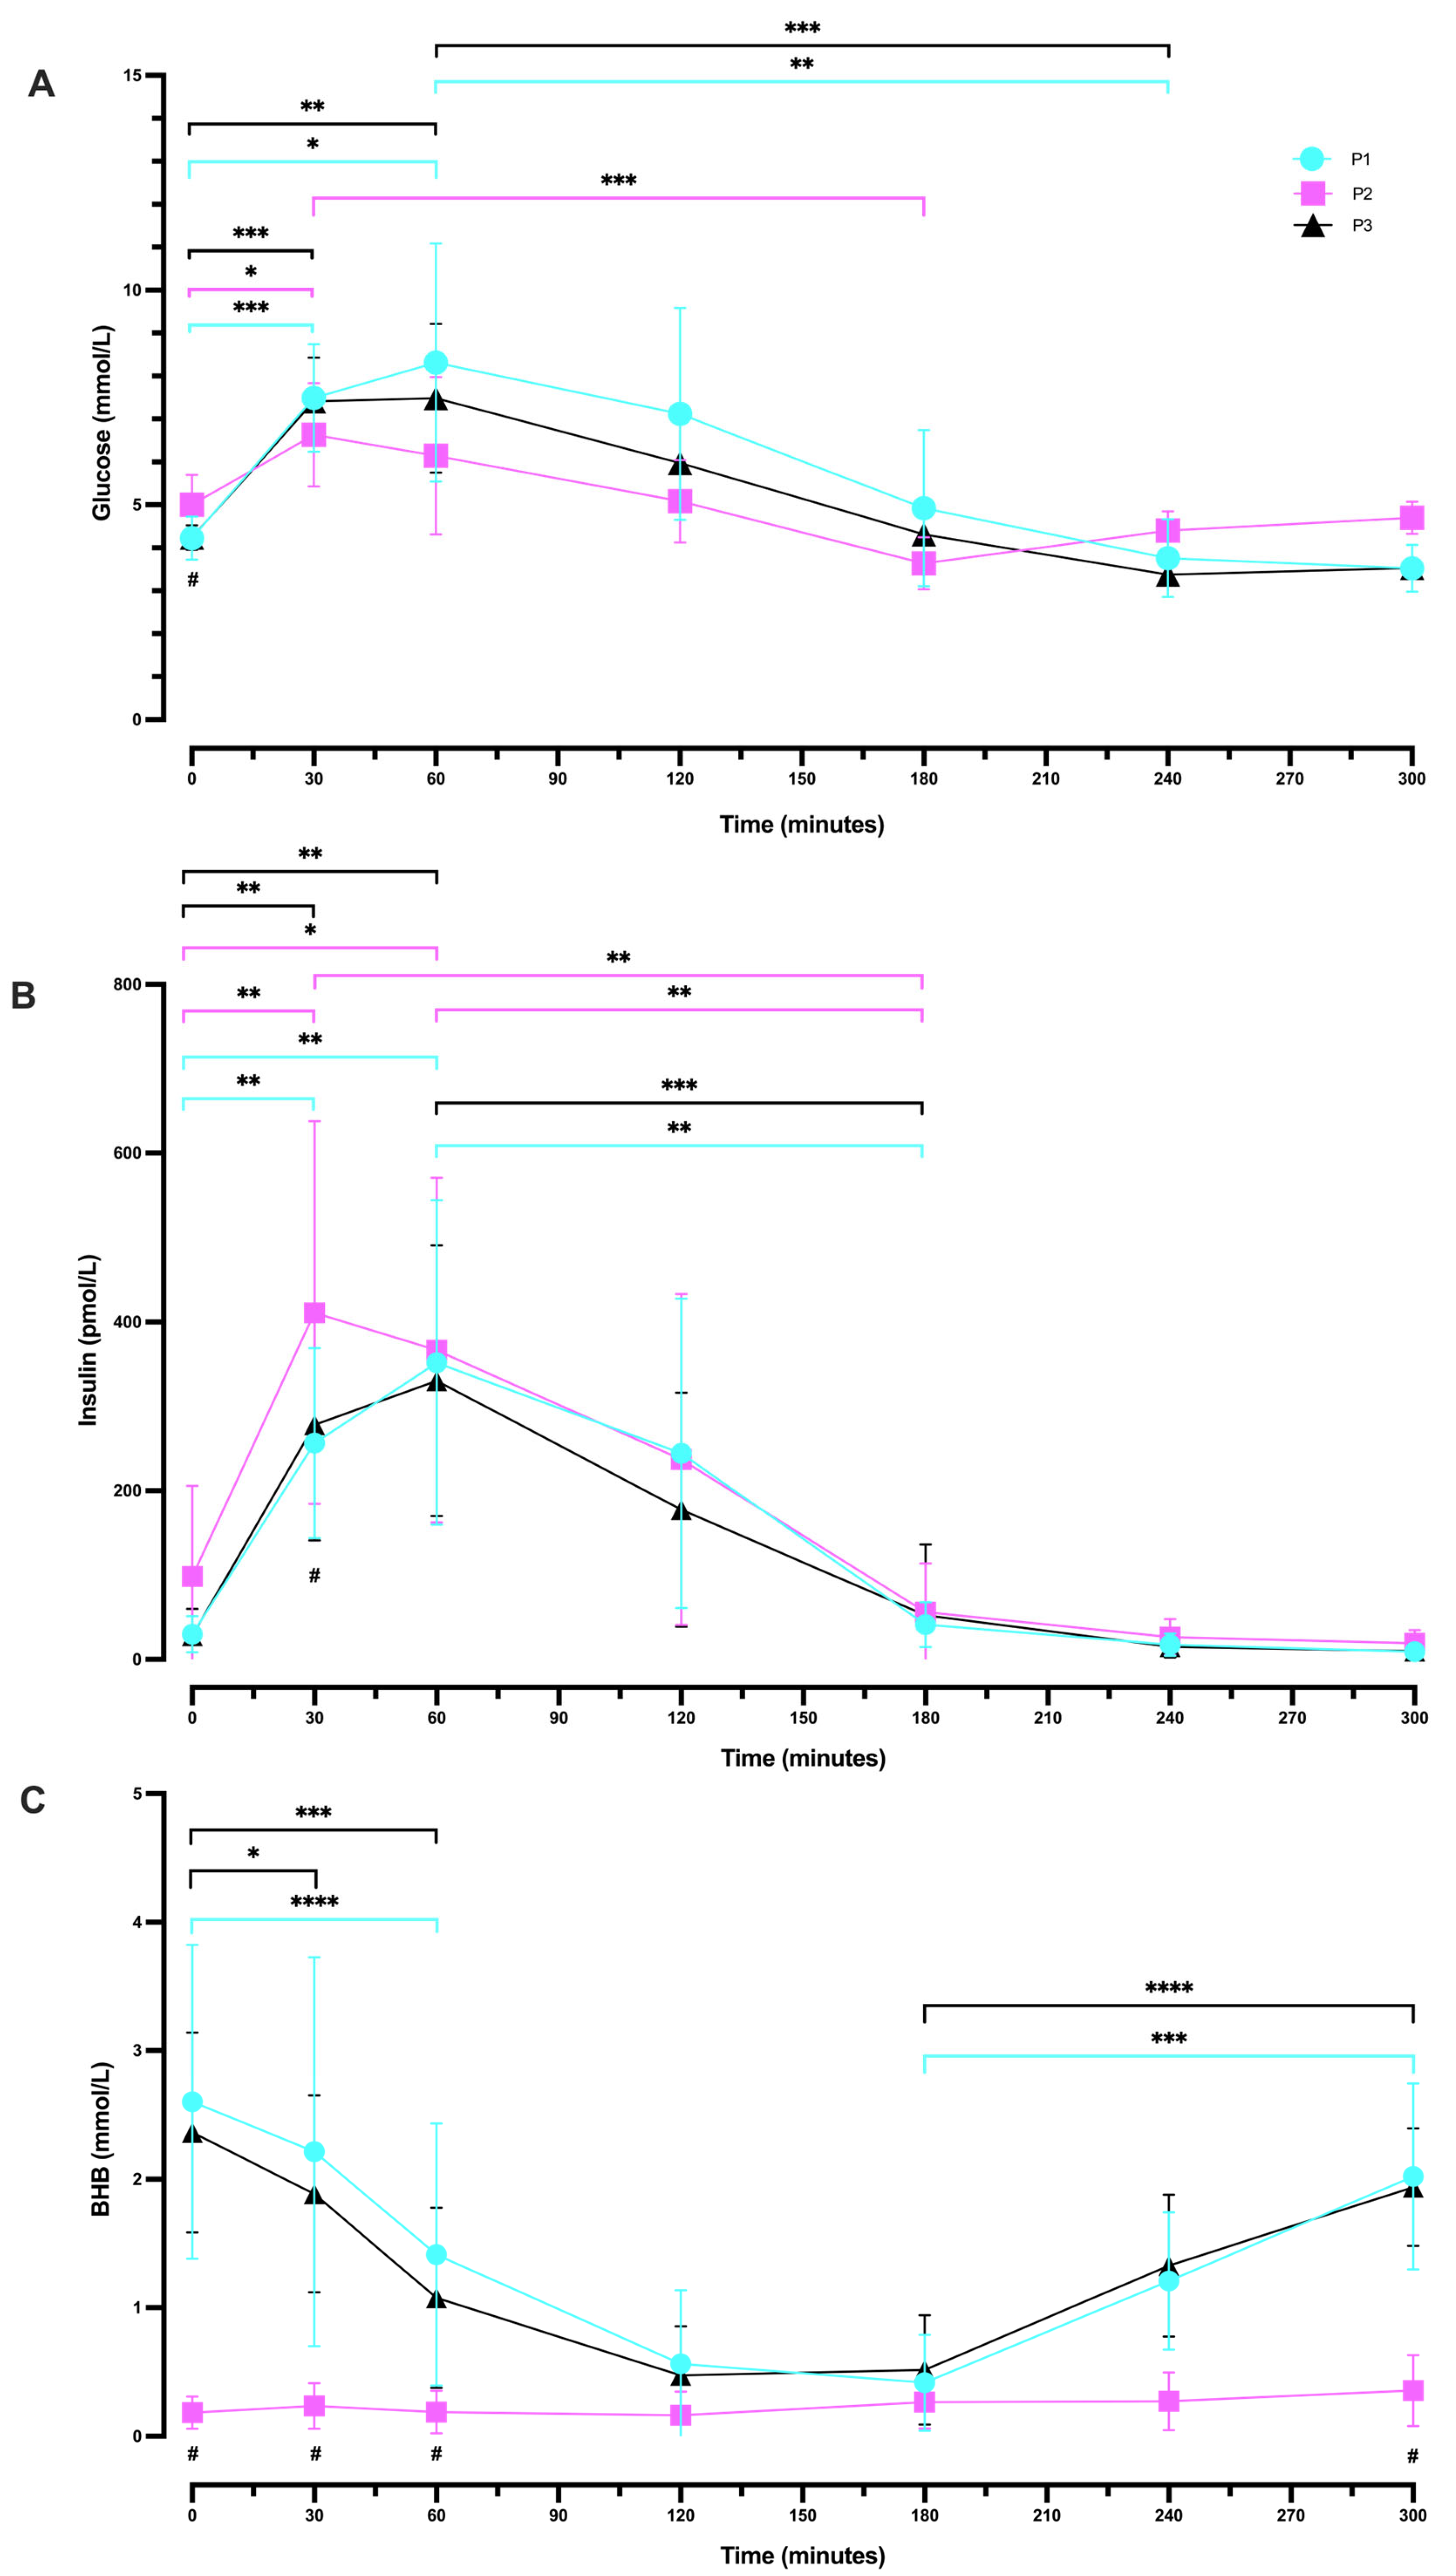
2.4. Oral Glucose Tolerance Tests
2.4.1. Between Phases (P1 vs. P2 vs. P3) OGTT Glucose Response
2.4.2. Within-Phase Glucose Response during a 5 h OGTT
2.4.3. Following Plateau, Blood Glucose Concentration Increased during Ketosis Suppression
2.4.4. Between Phases (P1 vs. P2 vs. P3) OGTT Insulin Response
2.4.5. Within-Phase Insulin Response during a 5 h OGTT
2.4.6. Between Phases (P1 vs. P2 vs. P3) OGTT BHB Response
2.4.7. Within-Phase BHB Response during a 5 h OGTT
2.5. Suppression of Ketosis Is Associated with Increases in Inflammatory Liver Markers
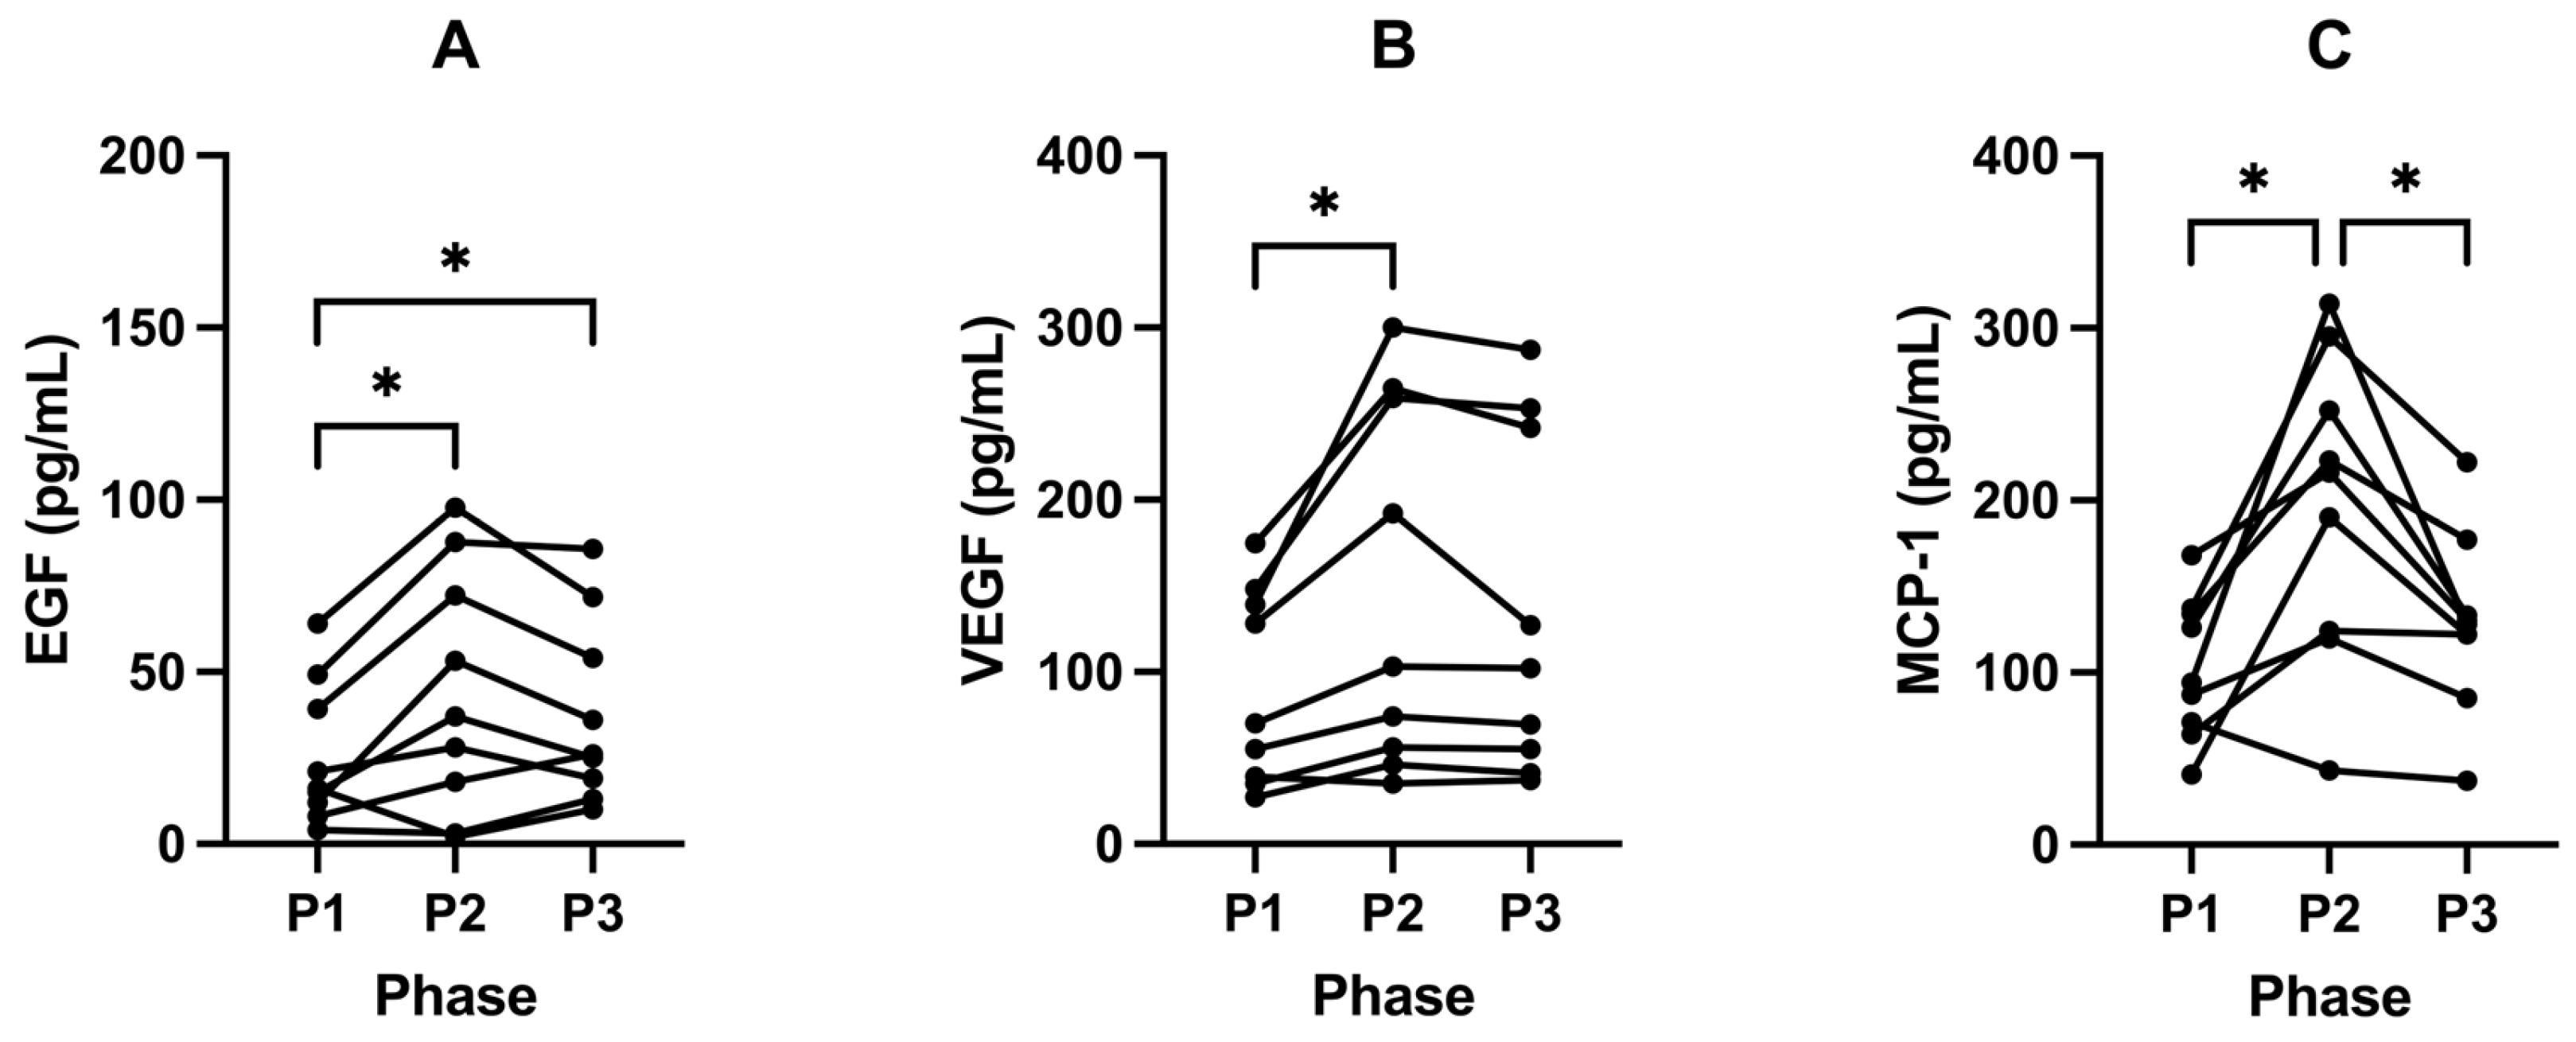
2.6. Ketosis Maintains Lower Levels of EGF, VEGF and MCP-1
3. Discussion
3.1. Macroscopic Changes/Anthropometrics
3.2. Insulin, IGF-1, and Glucose
3.3. Thyroid—Free T3
3.4. OGTT
3.5. Liver Markers
3.5.1. GGT
3.5.2. PAI-1
3.6. Cytokines
3.6.1. VEGF and EGF
3.6.2. MCP-1
4. Strengths and Limitations
5. Translational Importance
6. Materials and Methods
6.1. Ethical Approval
6.2. Participants
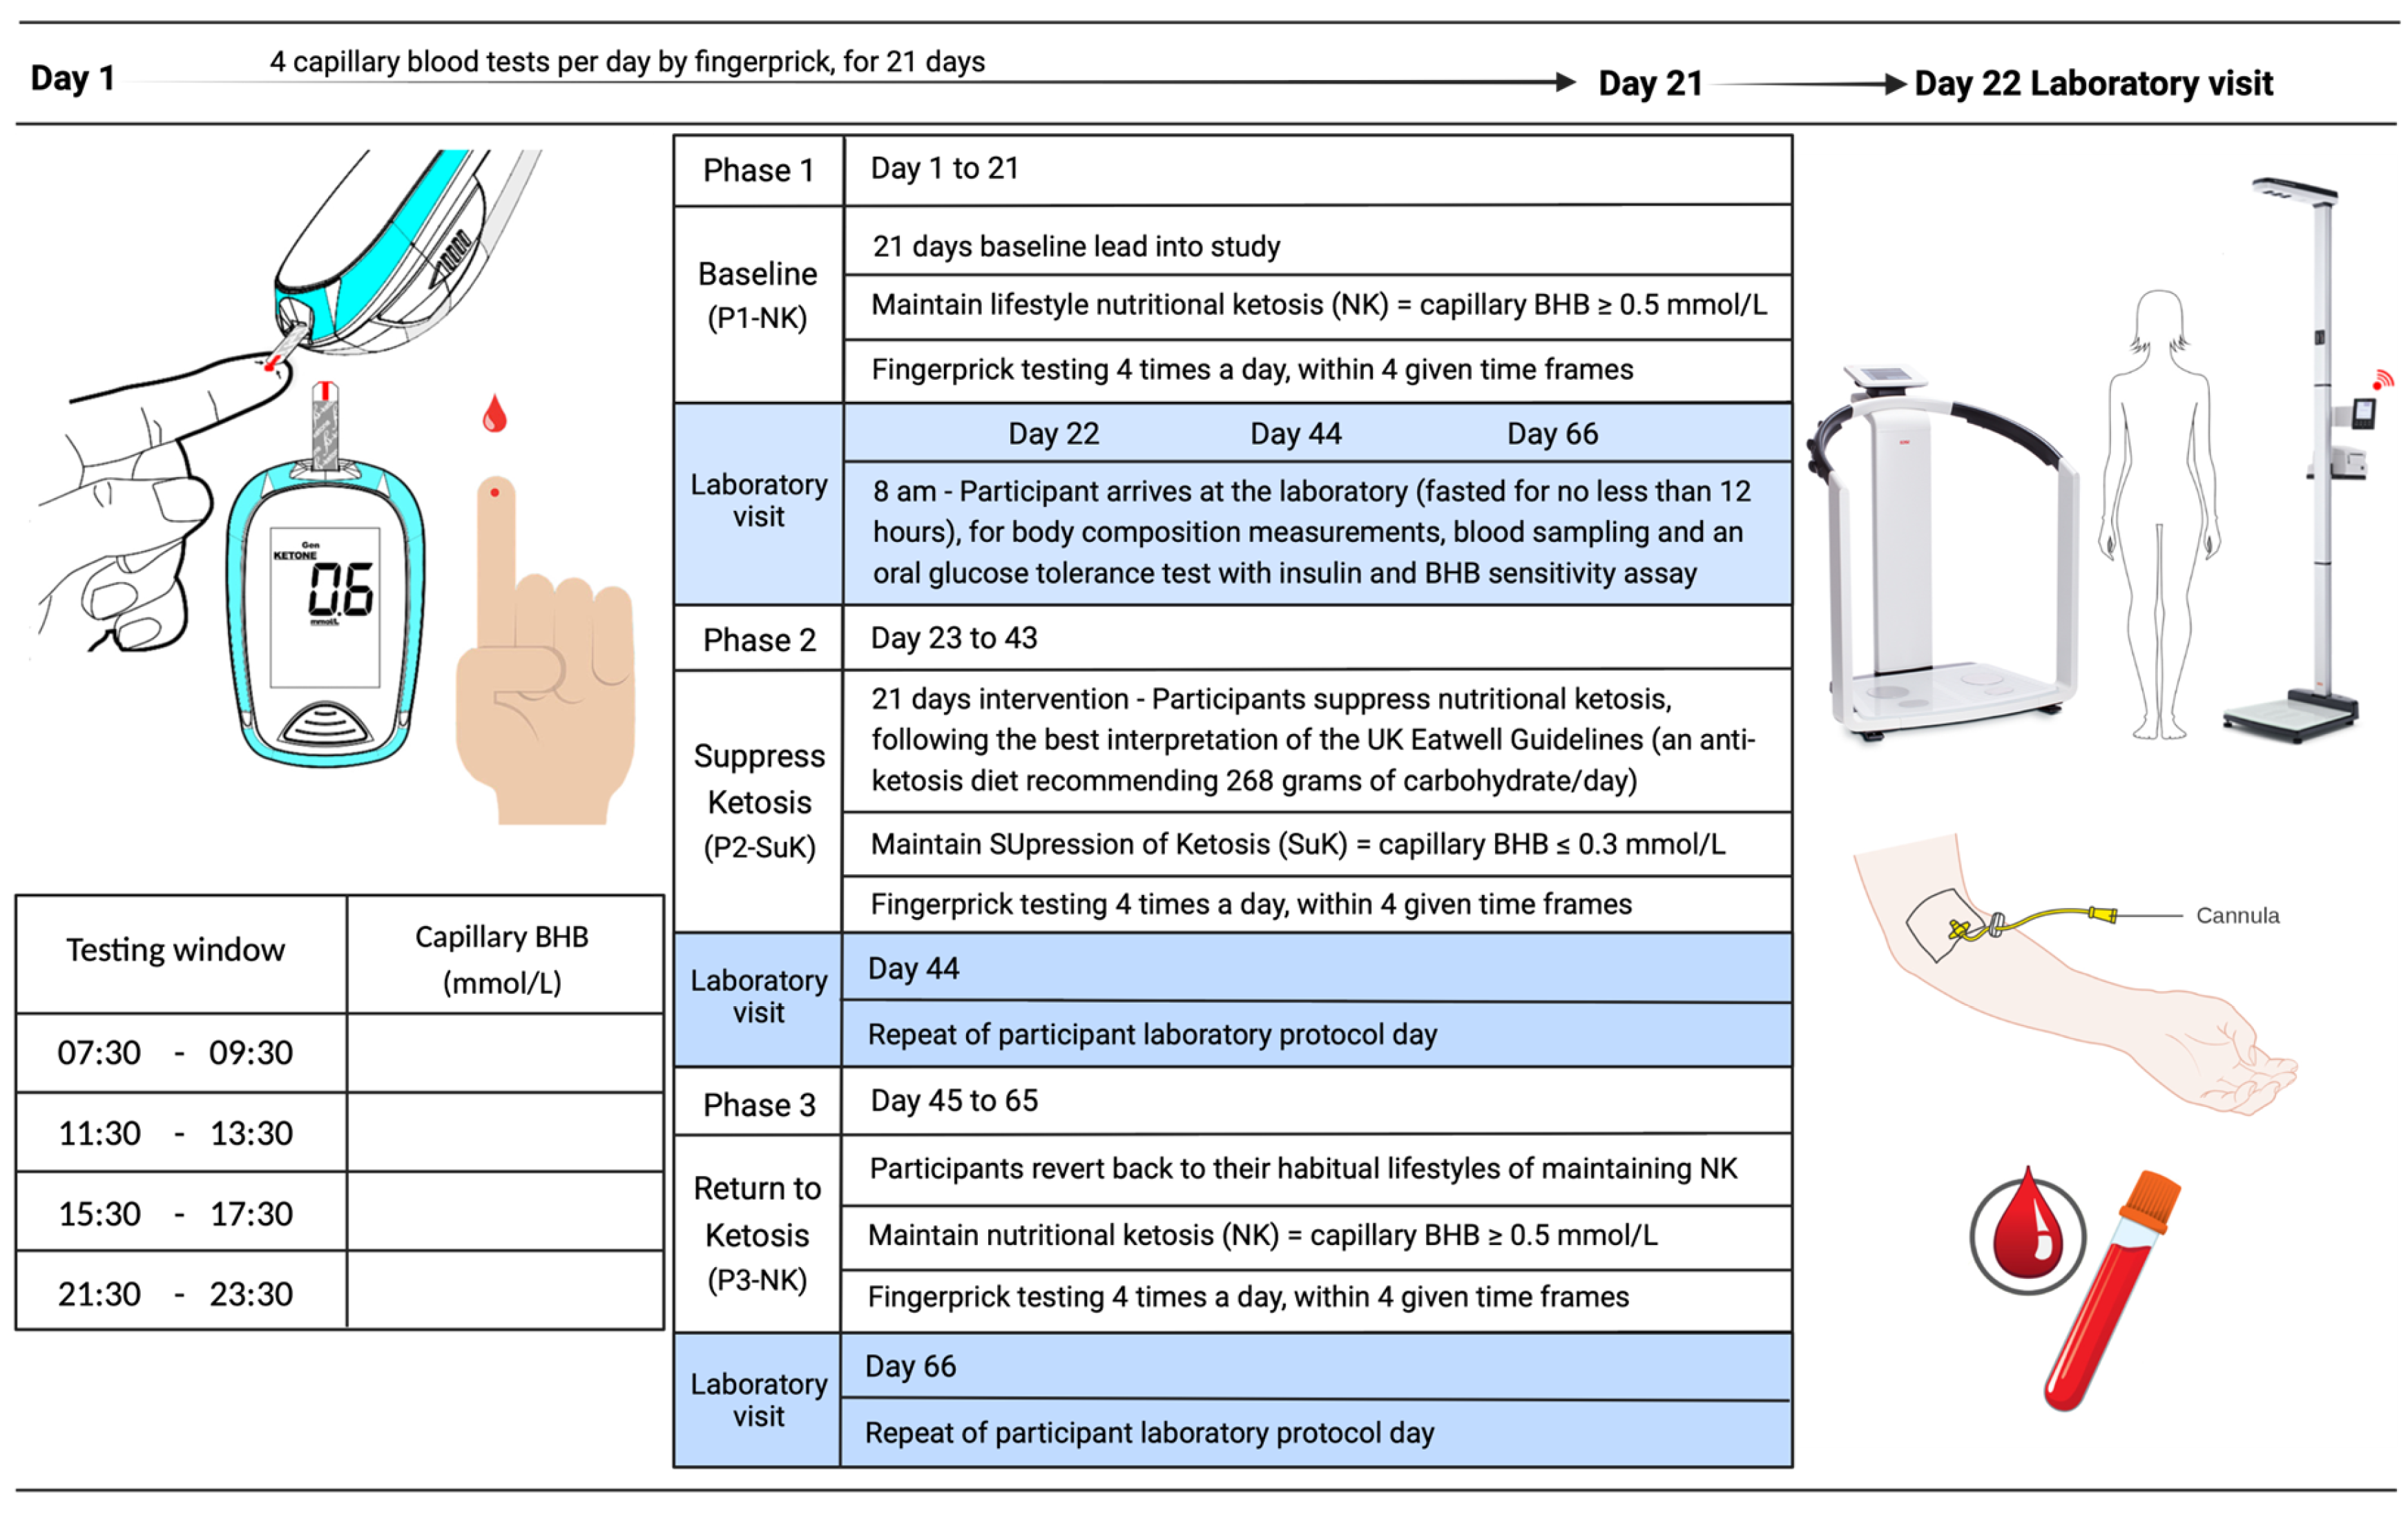
6.3. Study Design
6.4. Anthropometric Measurements
6.5. Metabolic Measurements
6.6. Blood Collection
6.7. Blood Profiling Analysis
6.8. Oral Glucose Tolerance Test
6.9. Statistical Analysis
6.10. Sample Size Calculation
7. Conclusions
Author Contributions
Funding
Institutional Review Board Statement
Informed Consent Statement
Data Availability Statement
Acknowledgments
Conflicts of Interest
References
- O’Connor, D.; Molloy, A.M.; Laird, E.; Kenny, R.A.; O’Halloran, A.M. Sustaining an ageing population: The role of micronutrients in frailty and cognitive impairment. Proc. Nutr. Soc. 2023, 82, 315–328. [Google Scholar] [CrossRef]
- UN. World Population Ageing 2019: Highlights. 2019. Available online: https://www.un.org/en/development/desa/population/publications/pdf/ageing/WorldPopulationAgeing2019-Report.pdf (accessed on 13 September 2023).
- ONS. Death Registration Summary Statistics, England and Wales—Office for National Statistics. 2023. Available online: https://www.ons.gov.uk/peoplepopulationandcommunity/birthsdeathsandmarriages/deaths/articles/deathregistrationsummarystatisticsenglandandwales/2022 (accessed on 14 September 2023).
- WHO. Global Health Estimates: Leading Causes of Death. 2019. Available online: https://www.who.int/data/gho/data/themes/mortality-and-global-health-estimates/ghe-leading-causes-of-death (accessed on 13 September 2023).
- Araújo, J.; Cai, J.; Stevens, J. Prevalence of optimal metabolic ealth in american adults: National health and nutrition examination survey 2009–2016. Metab. Syndr. Relat. Disord. 2018, 17, 46–52. [Google Scholar] [CrossRef]
- Cooper, I.D.; Kyriakidou, Y.; Petagine, L.; Edwards, K.; Elliott, B.T. Bio-hacking better health—Leveraging metabolic biochemistry to maximise healthspan. Antioxidants 2023, 12, 1749. [Google Scholar] [CrossRef]
- Crofts, C.A.P.; Zinn, C.; Wheldon, M.; Schofield, M. Hyperinsulinemia: A unifying theory of chronic disease? Diabesity 2015, 1, 34. [Google Scholar] [CrossRef]
- Cooper, I.D.; Brookler, K.H.; Kyriakidou, Y.; Elliott, B.T.; Crofts, C.A.P. Metabolic phenotypes and step by step evolution of type 2 diabetes: A new paradigm. Biomedicines 2021, 9, 800. [Google Scholar] [CrossRef] [PubMed]
- Ambroselli, D.; Masciulli, F.; Romano, E.; Catanzaro, G.; Besharat, Z.M.; Massari, M.C.; Ferretti, E.; Migliaccio, S.; Izzo, L.; Ritieni, A.; et al. New advances in metabolic syndrome, from prevention to treatment: The role of diet and food. Nutrients 2023, 15, 640. [Google Scholar] [CrossRef]
- Hayflick, L.; Moorhead, P.S. The serial cultivation of human diploid cell strains. Exp. Cell Res. 1961, 25, 585–621. [Google Scholar] [CrossRef] [PubMed]
- Veech, R.L.; Bradshaw, P.C.; Clarke, K.; Curtis, W.; Pawlosky, R.; King, M.T. Ketone bodies mimic the life span extending properties of caloric restriction. IUBMB Life 2017, 69, 305–314. [Google Scholar] [CrossRef]
- Saxton, R.A.; Sabatini, D.M. mTOR Signaling in Growth, Metabolism, and Disease. Cell 2017, 168, 960–976. [Google Scholar] [CrossRef] [PubMed]
- Pignatti, C.; D’adamo, S.; Stefanelli, C.; Flamigni, F.; Cetrullo, S. Nutrients and pathways that regulate health span and life span. Geriatrics 2020, 5, 95. [Google Scholar] [CrossRef]
- Ottens, F.; Franz, A.; Hoppe, T. Build-UPS and break-downs: Metabolism impacts on proteostasis and aging. Cell Death Differ. 2021, 28, 505–521. [Google Scholar] [CrossRef]
- Roberts, M.N.; Wallace, M.A.; Tomilov, A.A.; Zhou, Z.; Marcotte, G.R.; Tran, D.; Perez, G.; Gutierrez-Casado, E.; Koike, S.; Knotts, T.A.; et al. A ketogenic diet extends longevity and healthspan in adult mice. Cell Metab. 2017, 26, 539–546.e5. [Google Scholar] [CrossRef]
- Napoleão, A.; Fernandes, L.; Miranda, C.; Marum, A.P. Effects of calorie restriction on health span and insulin resistance: Classic calorie restriction diet vs. ketosis-inducing diet. Nutrients 2021, 13, 1302. [Google Scholar] [CrossRef]
- Newman, J.C.; Verdin, E. Ketone bodies as signaling metabolites. Trends Endocrinol. Metab. 2014, 25, 42–52. [Google Scholar] [CrossRef]
- Shimazu, T.; Hirschey, M.D.; Newman, J.; He, W.; Shirakawa, K.; Le Moan, N.; Grueter, C.A.; Lim, H.; Saunders, L.R.; Stevens, R.D.; et al. Suppression of oxidative stress by β-hydroxybutyrate, an endogenous histone deacetylase inhibitor. Science 2013, 339, 211–214. [Google Scholar] [CrossRef] [PubMed]
- Grabacka, M.; Pierzchalska, M.; Dean, M.; Reiss, K. Regulation of ketone body metabolism and the role of PPARα. Int. J. Mol. Sci. 2016, 17, 2093. [Google Scholar] [CrossRef]
- Wang, L.; Chen, P.; Xiao, W. β-hydroxybutyrate as an anti-aging metabolite. Nutrients 2021, 13, 3420. [Google Scholar] [CrossRef]
- Puchalska, P.; Crawford, P.A. Multi-dimensional roles of ketone bodies in fuel metabolism, signaling, and therapeutics. Cell Metab. 2017, 25, 262–284. [Google Scholar] [CrossRef] [PubMed]
- Miller, V.J.; Villamena, F.A.; Volek, J.S. Nutritional ketosis and mitohormesis: Potential implications for mitochondrial function and human health. J. Nutr. Metab. 2018, 2018, 5157645. [Google Scholar] [CrossRef]
- Qu, C.; Keijer, J.; Adjobo-Hermans, M.J.W.; van de Wal, M.; Schirris, T.; van Karnebeek, C.; Pan, Y.; Koopman, W.J.H. The ketogenic diet as a therapeutic intervention strategy in mitochondrial disease. Int. J. Biochem. Cell Biol. 2021, 138, 106050. [Google Scholar] [CrossRef] [PubMed]
- Benjamin, D.I.; Both, P.; Benjamin, J.S.; Nutter, C.W.; Tan, J.H.; Kang, J.; Machado, L.A.; Klein, J.D.D.; de Morree, A.; Kim, S.; et al. Fasting induces a highly resilient deep quiescent state in muscle stem cells via ketone body signaling. Cell Metab. 2022, 34, 902–918.e6. [Google Scholar] [CrossRef]
- Zhu, H.; Bi, D.; Zhang, Y.; Kong, C.; Du, J.; Wu, X.; Wei, Q.; Qin, H. Ketogenic diet for human diseases: The underlying mechanisms and potential for clinical implementations. Signal Transduct. Target. Ther. 2022, 7, 11. [Google Scholar] [CrossRef]
- Nadal, A.; Marrero, P.F.; Haro, D. Down-regulation of the mitochondrial 3-hydroxy-3-methylglutaryl-CoA synthase gene by insulin: The role of the forkhead transcription factor FKHRL1. Biochem. J. 2002, 366, 289–297. [Google Scholar] [CrossRef]
- DiNicolantonio, J.J.; Bhutani, J.; OKeefe, J.H.; Crofts, C. Postprandial insulin assay as the earliest biomarker for diagnosing pre-diabetes, type 2 diabetes and increased cardiovascular risk. Open Heart 2017, 4, e000656. [Google Scholar] [CrossRef]
- Cooper, I.D.; Brookler, K.H.; Crofts, C.A.P. Rethinking fragility fractures in type 2 diabetes: The link between hyperinsulinaemia and osteofragilitas. Biomedicines 2021, 9, 1165. [Google Scholar] [CrossRef]
- PHE. Government Dietary Recommendations: Government Recommendations for Energy and Nutrients for Males and Females Aged 1–18 Years and 19+ Years; PHE Publications Gateway Number: 2016202; Department of Health: London, UK, 2016. [Google Scholar]
- Cooper, I.D.; Crofts, C.A.P.; DiNicolantonio, J.J.; Malhotra, A.; Elliott, B.; Kyriakidou, Y.; Brookler, K.H. Relationships between hyperinsulinaemia, magnesium, vitamin D, thrombosis and COVID-19: Rationale for clinical management. Open Heart 2020, 7, e001356. [Google Scholar] [CrossRef] [PubMed]
- Dilliraj, L.N.; Schiuma, G.; Lara, D.; Strazzabosco, G.; Clement, J.; Giovannini, P.P.; Trapella, C.; Narducci, M.; Rizzo, R. The evolution of ketosis: Potential impact on clinical conditions. Nutrients 2022, 14, 3613. [Google Scholar] [CrossRef]
- Bronisz, A.; Ozorowski, M.; Hagner-Derengowska, M. Pregnancy ketonemia and development of the fetal central nervous system. Int. J. Endocrinol. 2018, 2018, 1242901. [Google Scholar] [CrossRef] [PubMed]
- Kinzig, K.P.; Honors, M.A.; Hargrave, S.L. Insulin sensitivity and glucose tolerance are altered by maintenance on a ketogenic diet. Endocrinology 2010, 151, 3105–3114. [Google Scholar] [CrossRef]
- Skow, S.L.; Jha, R.K. A ketogenic diet is effective in improving insulin sensitivity in individuals with type 2 diabetes. Curr. Diabetes Rev. 2022, 19, e250422203985. [Google Scholar] [CrossRef] [PubMed]
- Paoli, A.; Bianco, A.; Moro, T.; Mota, J.F.; Coelho-Ravagnani, C.F.; Paoli, A.; Bianco, A.; Moro, T.; Felipe Mota, J.; Coelho-Ravagnani, C.F. The effects of ketogenic diet on insulin sensitivity and weight loss, which came first: The chicken or the egg? Nutrients 2023, 15, 3120. [Google Scholar] [CrossRef]
- Jiang, Z.; Yin, X.; Wang, M.; Chen, T.; Wang, Y.; Gao, Z.; Wang, Z. Effects of ketogenic diet on neuroinflammation in neurodegenerative diseases. Aging Dis. 2022, 13, 1146. [Google Scholar] [CrossRef]
- Koh, S.; Dupuis, N.; Auvin, S. Ketogenic diet and neuroinflammation. Epilepsy Res. 2020, 167, 106454. [Google Scholar] [CrossRef] [PubMed]
- Arima, Y.; Nakagawa, Y.; Takeo, T.; Ishida, T.; Yamada, T.; Hino, S.; Nakao, M.; Hanada, S.; Umemoto, T.; Suda, T.; et al. Murine neonatal ketogenesis preserves mitochondrial energetics by preventing protein hyperacetylation. Nat. Metab. 2021, 3, 196–210. [Google Scholar] [CrossRef] [PubMed]
- Schutz, Y.; Ravussin, E. Respiratory quotients lower than 0.70 in ketogenic diets. Am. J. Clin. Nutr. 1980, 33, 1317–1319. [Google Scholar] [CrossRef] [PubMed]
- Goldenshluger, A.; Constantini, K.; Goldstein, N.; Shelef, I.; Schwarzfuchs, D.; Zelicha, H.; Meir, A.Y.; Tsaban, G.; Chassidim, Y.; Gepner, Y. Effect of dietary strategies on respiratory quotient and its association with clinical parameters and organ fat loss: A randomized controlled trial. Nutrients 2021, 13, 2230. [Google Scholar] [CrossRef]
- Ramos-Jiménez, A.; Hernández-Torres, R.P.; Torres-Durán, P.V.; Romero-Gonzalez, J.; Mascher, D.; Posadas-Romero, C.; Juárez-Oropeza, M.A. The Respiratory Exchange Ratio is Associated with Fitness Indicators Both in Trained and Untrained Men: A Possible Application for People with Reduced Exercise Tolerance. Clin. Med. Circ. Respirat. Pulm. Med. 2008, 2, 1–9. [Google Scholar] [CrossRef]
- Bergman, B.C.; Brooks, G.A. Respiratory gas-exchange ratios during graded exercise in fed and fasted trained and untrained men. J. Appl. Physiol. 1999, 86, 479–487. [Google Scholar] [CrossRef]
- Nishida, C.; Ko, G.T.; Kumanyika, S. Body fat distribution and noncommunicable diseases in populations: Overview of the 2008 WHO Expert Consultation on Waist Circumference and Waist–Hip Ratio. Eur. J. Clin. Nutr. 2009, 64, 2–5. [Google Scholar] [CrossRef]
- WHO. Waist Circumference and Waist–Hip Ratio. WHO Expert. 2011. Available online: https://www.who.int/publications/i/item/9789241501491 (accessed on 14 September 2023).
- Choi, S.M.; Tucker, D.F.; Gross, D.N.; Easton, R.M.; DiPilato, L.M.; Dean, A.S.; Monks, B.R.; Birnbaum, M.J. Insulin regulates adipocyte lipolysis via an Akt-independent signaling pathway. Mol. Cell. Biol. 2010, 30, 5009. [Google Scholar] [CrossRef]
- Althaher, A.R. An overview of hormone-sensitive lipase (HSL). Sci. World J. 2022, 2022, 1964684. [Google Scholar] [CrossRef] [PubMed]
- Lan, Y.L.; Lou, J.C.; Lyu, W.; Zhang, B. Update on the synergistic effect of HSL and insulin in the treatmentof metabolic disorders. Ther. Adv. Endocrinol. Metab. 2019, 10, 2042018819877300. [Google Scholar] [CrossRef]
- Sandhu, M.S.; Dunger, D.B.; Giovannucci, E.L. Insulin, insulin-like growth factor-I (IGF-I), IGF binding proteins, their biologic interactions, and colorectal cancer. JNCI J. Natl. Cancer Inst. 2002, 94, 972–980. [Google Scholar] [CrossRef]
- Goalstone, M.L.; Leitner, J.W.; Wall, K.; Dolgonos, L.; Rother, K.I.; Accili, D.; Draznin, B. Effect of insulin on farnesyltransferase. J. Biol. Chem. 1998, 273, 23892–23896. [Google Scholar] [CrossRef]
- Draznin, B.; Miles, P.; Kruszynska, Y.; Olefsky, J.; Friedman, J.; Golovchenko, I.; Stjernholm, R.; Wall, K.; Reitman, M.; Accili, D.; et al. Effects of insulin on prenylation as a mechanism of potentially detrimental influence of hyperinsulinemia. Endocrinology 2000, 141, 1310–1316. [Google Scholar] [CrossRef]
- Goalstone, M.L.; Draznin, B. What does insulin do to Ras? Cell. Signal. 1998, 10, 297–301. [Google Scholar] [CrossRef]
- Cao, J.; Yee, D. Disrupting insulin and IGF receptor function in cancer. Int. J. Mol. Sci. 2021, 22, 555. [Google Scholar] [CrossRef]
- Pollak, M. Insulin and insulin-like growth factor signalling in neoplasia. Nat. Rev. Cancer 2008, 8, 915–928. [Google Scholar] [CrossRef]
- Zhang, W.B.; Aleksic, S.; Gao, T.; Weiss, E.F.; Demetriou, E.; Verghese, J.; Holtzer, R.; Barzilai, N.; Milman, S. Insulin-like growth factor-1 and IGF binding proteins predict all-cause mortality and morbidity in older adults. Cells 2020, 9, 1368. [Google Scholar] [CrossRef] [PubMed]
- Narasimhan, S.D.; Yen, K.; Tissenbaum, H.A. Converging pathways in lifespan regulation. Curr. Biol. 2009, 19, R657. [Google Scholar] [CrossRef] [PubMed]
- Barbieri, M.; Bonafè, M.; Franceschi, C.; Paolisso, G. Insulin/IGF-I-signaling pathway: An evolutionarily conserved mechanism of longevity from yeast to humans. Am. J. Physiol.-Endocrinol. Metab. 2003, 285, E1064–E1071. [Google Scholar] [CrossRef] [PubMed]
- Holzenberger, M.; Dupont, J.; Ducos, B.; Leneuve, P.; Géloën, A.; Even, P.C.; Cervera, P.; Le Bouc, Y. IGF-1 receptor regulates lifespan and resistance to oxidative stress in mice. Nature 2003, 421, 182–187. [Google Scholar] [CrossRef] [PubMed]
- Rahmani, J.; Montesanto, A.; Giovannucci, E.; Zand, H.; Barati, M.; Kopchick, J.J.; Mirisola, M.G.; Lagani, V.; Bawadi, H.; Vardavas, R.; et al. Association between IGF-1 levels ranges and all-cause mortality: A meta-analysis. Aging Cell 2022, 21, e13540. [Google Scholar] [CrossRef]
- Jag, U.R.; Zavadil, J.; Stanley, F.M. Insulin acts through FOXO3a to activate transcription of plasminogen activator inhibitor type 1. Mol. Endocrinol. 2009, 23, 1587–1602. [Google Scholar] [CrossRef] [PubMed]
- Webb, A.E.; Brunet, A. FOXO transcription factors: Key regulators of cellular quality control. Trends Biochem. Sci. 2014, 39, 159. [Google Scholar] [CrossRef] [PubMed]
- Klotz, L.O.; Sánchez-Ramos, C.; Prieto-Arroyo, I.; Urbánek, P.; Steinbrenner, H.; Monsalve, M. Redox regulation of FoxO transcription factors. Redox Biol. 2015, 6, 51–72. [Google Scholar] [CrossRef] [PubMed]
- Newman, J.C.; Verdin, E. β-hydroxybutyrate: A signaling metabolite. Annu. Rev. Nutr. 2017, 37, 51–76. [Google Scholar] [CrossRef]
- Miyauchi, T.; Uchida, Y.; Kadono, K.; Hirao, H.; Kawasoe, J.; Watanabe, T.; Ueda, S.; Okajima, H.; Terajima, H.; Uemoto, S. Up-regulation of FOXO1 and reduced inflammation by β-hydroxybutyric acid are essential diet restriction benefits against liver injury. Proc. Natl. Acad. Sci. USA 2019, 116, 13533–13542. [Google Scholar] [CrossRef]
- Willcox, B.J.; Donlon, T.A.; He, Q.; Chen, R.; Grove, J.S.; Yano, K.; Masaki, K.H.; Willcox, D.C.; Rodriguez, B.; Curb, J.D. FOXO3A genotype is strongly associated with human longevity. Proc. Natl. Acad. Sci. USA 2008, 105, 13987–13992. [Google Scholar] [CrossRef]
- Visscher, T.L.S.; Seidell, J.C. The public health impact of obesity. Annu. Rev. Public Health 2001, 22, 355–375. [Google Scholar] [CrossRef]
- Ahmed, S.B.M.; Radwan, N.; Amer, S.; Saheb Sharif-Askari, N.; Mahdami, A.; Samara, K.A.; Halwani, R.; Jelinek, H.F. Assessing the link between diabetic metabolic dysregulation and breast cancer progression. Int. J. Mol. Sci. 2023, 24, 11816. [Google Scholar] [CrossRef]
- WHO. Breast Cancer. World Health Organization. 2023. Available online: https://www.who.int/news-room/fact-sheets/detail/breast-cancer#:~:text=In2020%2C (accessed on 19 September 2023).
- Kautzky-Willer, A.; Harreiter, J.; Pacini, G. Sex and gender differences in risk, pathophysiology and complications of type 2 diabetes mellitus. Endocr. Rev. 2016, 37, 278–316. [Google Scholar] [CrossRef] [PubMed]
- Bolla, A.M.; Caretto, A.; Laurenzi, A.; Scavini, M.; Piemonti, L. Low-carb and ketogenic diets in type 1 and type 2 diabetes. Nutrients 2019, 11, 962. [Google Scholar] [CrossRef]
- Paradies, G.; Paradies, V.; Ruggiero, F.M.; Petrosillo, G. Role of cardiolipin in mitochondrial function and dynamics in health and disease: Molecular and pharmacological aspects. Cells 2019, 8, 728. [Google Scholar] [CrossRef] [PubMed]
- Martinez, B.; Ortiz, R.M. Thyroid hormone regulation and insulin resistance: Insights from animals naturally adapted to fasting. Physiology 2017, 32, 141–151. [Google Scholar] [CrossRef] [PubMed]
- Petagine, L.; Zariwala, M.G.; Patel, V.B. Non-alcoholic fatty liver disease: Immunological mechanisms and current treatments. World J. Gastroenterol. 2023, 29, 4831–4850. [Google Scholar] [CrossRef]
- Demant, M.; Bagger, J.I.; Suppli, M.P.; Lund, A.; Gyldenløve, M.; Hansen, K.B.; Hare, K.J.; Christensen, M.; Sonne, D.P.; Holst, J.J.; et al. Determinants of fasting hyperglucagonemia in patients with type 2 diabetes and nondiabetic control subjects. Metab. Syndr. Relat. Disord. 2018, 16, 530–536. [Google Scholar] [CrossRef]
- Kumpatla, S.; Parveen, R.; Murugan, P.; Juttada, U.; Devarajan, A.; Viswanathan, V. Hyperglucagonemia and impaired insulin sensitivity are associated with development of prediabetes and type 2 diabetes—A study from South India. Diabetes Metab. Syndr. Clin. Res. Rev. 2021, 15, 102199. [Google Scholar] [CrossRef]
- Luchsinger, J.A.; Tang, M.X.; Shea, S.; Mayeux, R. Hyperinsulinemia and risk of Alzheimer disease. Neurology 2004, 63, 1187–1192. [Google Scholar] [CrossRef] [PubMed]
- Grundy, S.M. Gamma-glutamyl transferase: Another biomarker for metabolic syndrome and cardiovascular risk. Arterioscler. Thromb. Vasc. Biol. 2007, 27, 4–7. [Google Scholar] [CrossRef] [PubMed]
- Unwin, D.J.; Cuthbertson, D.J.; Feinman, R.; Sprung, V.S. A pilot study to explore the role of a low-carbohydrate intervention to improve GGT levels and HbA 1c. Diabesity Pract. 2015, 4, 102–108. [Google Scholar]
- Kwak, J.; Seo, I.H.; Lee, Y.J. Serum γ-glutamyltransferase level and incidence risk of metabolic syndrome in community dwelling adults: Longitudinal findings over 12 years. Diabetol. Metab. Syndr. 2023, 15, 29. [Google Scholar] [CrossRef] [PubMed]
- Gohel, M.G.; Chacko, A.N. Serum GGT activity and hsCRP level in patients with type 2 diabetes mellitus with good and poor glycemic control: An evidence linking oxidative stress, inflammation and glycemic control. J. Diabetes Metab. Disord. 2013, 12, 56. [Google Scholar] [CrossRef] [PubMed]
- Drozdz, R.; Parmentier, C.; Hachad, H.; Leroy, P.; Siest, Ǵ.; Wellman, M. γ-glutamyltransferase dependent generation of reactive oxygen species from a glutathione/transferrin system. Free Radic. Biol. Med. 1998, 25, 786–792. [Google Scholar] [CrossRef]
- Wang, Y.; Wu, T.; Zang, X.; Liu, X.; Xu, W.; Lai, P.; Wang, Y.; Teng, F.; Qiu, Q.; Geng, H.; et al. Relationship between serum gamma-glutamyl transferase level and impaired fasting glucose among chinese community-dwelling adults: A follow-up observation of 6 years. Metab. Syndr. Relat. Disord. 2021, 19, 100–106. [Google Scholar] [CrossRef]
- Xing, M.; Gao, M.; Li, J.; Han, P.; Mei, L.; Zhao, L. Characteristics of peripheral blood Gamma-glutamyl transferase in different liver diseases. Medicine 2022, 101, E28443. [Google Scholar] [CrossRef]
- Bonnet, F.; Ducluzeau, P.H.; Gastaldelli, A.; Laville, M.; Anderwald, C.H.; Konrad, T.; Mari, A.; Balkau, B. Liver enzymes are associated with hepatic insulin resistance, insulin secretion, and glucagon concentration in healthy men and women. Diabetes 2011, 60, 1660. [Google Scholar] [CrossRef]
- Björk, M.P.; Johansson, B. Gamma-Glutamyltransferase (GGT) as a biomarker of cognitive decline at the end of life: Contrasting age and time to death trajectories. Int. Psychogeriatr. 2018, 30, 981–990. [Google Scholar] [CrossRef]
- Sillen, M.; Declerck, P.J. A narrative review on plasminogen activator inhibitor-1 and Its (patho)physiological role: To target or not to target? Int. J. Mol. Sci. 2021, 22, 2721. [Google Scholar] [CrossRef]
- Samad, F.; Pandey, M.; Bell, P.A.; Loskutoff, D.J. Insulin continues to induce plasminogen activator inhibitor 1 gene expression in insulin-resistant mice and adipocytes. Mol. Med. 2000, 6, 680–692. [Google Scholar] [CrossRef]
- Altalhi, R.; Pechlivani, N.; Ajjan, R.A. PAI-1 in diabetes: Pathophysiology and role as a therapeutic target. Int. J. Mol. Sci. 2021, 22, 3170. [Google Scholar] [CrossRef]
- Yarmolinsky, J.; Bordin Barbieri, N.; Weinmann, T.; Ziegelmann, P.K.; Duncan, B.B.; Inês Schmidt, M. Plasminogen activator inhibitor-1 and type 2 diabetes: A systematic review and meta-analysis of observational studies. Sci. Rep. 2016, 6, 17714. [Google Scholar] [CrossRef] [PubMed]
- Booth, N.A.; Simpson, A.J.; Croll, A.; Bennett, B.; MacGregor, I.R. Plasminogen activator inhibitor (PAI-1) in plasma and platelets. Br. J. Haematol. 1988, 70, 327–333. [Google Scholar] [CrossRef] [PubMed]
- Leitner, J.W.; Kline, T.; Carel, K.; Goalstone, M.; Draznin, B. Hyperinsulinemia potentiates activation of p21Ras by growth factors. Endocrinology 1997, 138, 2211–2214. [Google Scholar] [CrossRef] [PubMed]
- Hopkins, B.D.; Pauli, C.; Xing, D.; Wang, D.G.; Li, X.; Wu, D.; Amadiume, S.C.; Goncalves, M.D.; Hodakoski, C.; Lundquist, M.R.; et al. Suppression of insulin feedback enhances the efficacy of PI3K inhibitors. Nature 2018, 560, 499–503. [Google Scholar] [CrossRef]
- Bye, A.P.; Unsworth, A.J.; Gibbins, J.M. Platelet signaling: A complex interplay between inhibitory and activatory networks. J. Thromb. Haemost. 2016, 14, 918. [Google Scholar] [CrossRef]
- Juhan-Vague, I.; Alessi, M.C.; Mavri, A.; Morange, P.E. Plasminogen activator inhibitor-1, inflammation, obesity, insulin resistance and vascular risk. J. Thromb. Haemost. 2003, 1, 1575–1579. [Google Scholar] [CrossRef]
- Alessi, M.C.; Peiretti, F.; Morange, P.; Henry, M.; Nalbone, G.; Juhan-Vague, I. Production of plasminogen activator inhibitor 1 by human adipose tissue: Possible link between visceral fat accumulation and vascular disease. Diabetes 1997, 46, 860–867. [Google Scholar] [CrossRef]
- Ellulu, M.S.; Patimah, I.; Khaza’ai, H.; Rahmat, A.; Abed, Y. Obesity and inflammation: The linking mechanism and the complications. Arch. Med. Sci. 2017, 13, 851. [Google Scholar] [CrossRef]
- Pandey, M.; Loskutoff, D.J.; Samad, F. Molecular mechanisms of tumor necrosis factor-alpha-mediated plasminogen activator inhibitor-1 expression in adipocytes. FASEB J. 2005, 19, 1317–1319. [Google Scholar] [CrossRef]
- Devy, L.; Blacher, S.; Grignet-Debrus, C.; Bajou, K.; Masson, V.; Gerard, R.D.; Gils, A.; Carmeliet, G.; Carmeliet, P.; Declerck, P.J.; et al. The pro- or antiangiogenic effect of plasminogen activator inhibitor 1 is dose dependent. FASEB J. 2002, 16, 147–154. [Google Scholar] [CrossRef]
- Balsara, R.D.; Ploplis, V.A. Plasminogen activator inhibitor-1: The double-edged sword in apoptosis. Thromb. Haemost. 2008, 100, 1029–1036. [Google Scholar] [CrossRef]
- Bajou, K.; Noël, A.; Gerard, R.D.; Masson, V.; Brunner, N.; Holst-Hansen, C.; Skobe, M.; Fusenig, N.E.; Carmeliet, P.; Collen, D.; et al. Absence of host plasminogen activator inhibitor 1 prevents cancer invasion and vascularization. Nat. Med. 1998, 4, 923–928. [Google Scholar] [CrossRef]
- Roy, A.; Coum, A.; Marinescu, V.D.; Põlajeva, J.; Smits, A.; Nelander, S.; Uhrbom, L.; Westermark, B.; Forsberg-Nilsson, K.; Pontén, F.; et al. Glioma-derived plasminogen activator inhibitor-1 (PAI-1) regulates the recruitment of LRP1 positive mast cells. Oncotarget 2015, 6, 23647–23661. [Google Scholar] [CrossRef]
- Harbeck, N.; Kates, R.E.; Gauger, K.; Willems, A.; Kiechle, M.; Magdolen, V.; Schmitt, M. Urokinase-type plasminogen activator (uPA) and its inhibitor PAI-I: Novel tumor-derived factors with a high prognostic and predictive impact in breast cancer. Thromb. Haemost. 2004, 92, 47–53. [Google Scholar] [CrossRef]
- Leissner, P.; Verjat, T.; Bachelot, T.; Paye, M.; Krause, A.; Puisieux, A.; Mougin, B. Prognostic significance of urokinase plasminogen activator and plasminogen activator inhibitor-1 mRNA expression in lymph node- and hormone receptor-positive breast cancer. BMC Cancer 2006, 6, 216. [Google Scholar] [CrossRef] [PubMed]
- Duffy, M.J.; O’Donovan, N.; McDermott, E.; Crown, J. Validated biomarkers: The key to precision treatment in patients with breast cancer. Breast 2016, 29, 192–201. [Google Scholar] [CrossRef]
- Jevrić, M.; Matić, I.Z.; Krivokuća, A.; Crnogorac, M.D.; Besu, I.; Damjanović, A.; Branković-Magić, M.; Milovanović, Z.; Gavrilović, D.; Susnjar, S.; et al. Association of uPA and PAI-1 tumor levels and 4G/5G variants of PAI-1 gene with disease outcome in luminal HER2-negative node-negative breast cancer patients treated with adjuvant endocrine therapy. BMC Cancer 2019, 19, 71. [Google Scholar] [CrossRef]
- Sobocan, M.; Ledinek, Z.; Crnobrnja, B.; Sikošek, N.Č.; Dovnik, N.F.; Kavalar, R.; Knez, J.; Takač, I. The value of uPA and PAI-1 levels in triple negative breast cancer. Eur. J. Cancer 2020, 138, S73–S74. [Google Scholar] [CrossRef]
- Becker, M.; Szarvas, T.; Wittschier, M.; Vom Dorp, F.; Tötsch, M.; Schmid, K.W.; Rübben, H.; Ergün, S. Prognostic impact of plasminogen activator inhibitor type 1 expression in bladder cancer. Cancer 2010, 116, 4502–4512. [Google Scholar] [CrossRef]
- Chan, O.T.M.; Furuya, H.; Pagano, I.; Shimizu, Y.; Hokutan, K.; Dyrskjøt, L.; Jensen, J.B.; Malmstrom, P.U.; Segersten, U.; Janku, F.; et al. Association of MMP-2, RB and PAI-1 with decreased recurrence-free survival and overall survival in bladder cancer patients. Oncotarget 2017, 8, 99707–99721. [Google Scholar] [CrossRef] [PubMed]
- Herszényi, L.; Farinati, F.; Cardin, R.; István, G.; Molnár, L.D.; Hritz, I.; De Paoli, M.; Plebani, M.; Tulassay, Z. Tumor marker utility and prognostic relevance of cathepsin B, cathepsin L, urokinase-type plasminogen activator, plasminogen activator inhibitor type-1, CEA and CA 19-9 in colorectal cancer. BMC Cancer 2008, 8, 194. [Google Scholar] [CrossRef]
- Iwadate, Y.; Hayama, M.; Adachi, A.; Matsutani, T.; Nagai, Y.; Hiwasa, T.; Saeki, N. High serum level of plasminogen activator inhibitor-1 predicts histological grade of intracerebral gliomas. Anticancer Res. 2008, 28, 415–418. [Google Scholar] [PubMed]
- Kuhn, W.; Schmalfeldt, B.; Reuning, U.; Pache, L.; Berger, U.; Ulm, K.; Harbeck, N.; Späthe, K.; Dettmar, P.; Höfler, H.; et al. Prognostic significance of urokinase (uPA) and its inhibitor PAI-1 for survival in advanced ovarian carcinoma stage FIGO IIIc. Br. J. Cancer 1999, 79, 1746–1751. [Google Scholar] [CrossRef]
- Nakatsuka, E.; Sawada, K.; Nakamura, K.; Yoshimura, A.; Kinose, Y.; Kodama, M.; Hashimoto, K.; Mabuchi, S.; Makino, H.; Morii, E.; et al. Plasminogen activator inhibitor-1 is an independent prognostic factor of ovarian cancer and IMD-4482, a novel plasminogen activator inhibitor-1 inhibitor, inhibits ovarian cancer peritoneal dissemination. Oncotarget 2017, 8, 89887. [Google Scholar] [CrossRef]
- Koensgen, D.; Stope, M.B.; Tuerbachova, I.; Bruennert, D.; Kohlmann, T.; Braicu, I.; Sehouli, J.; Denkert, C.; Darb-Esfahani, S.; Stickeler, E.; et al. Expression, intracellular localization, and prognostic value of plasminogen activator inhibitor 1 and PAI-1 RNA-binding Protein 1 in primary and recurrent ovarian cancer: A study of the tumor bank ovarian cancer network. Gynecol. Obstet. Investig. 2018, 83, 508–514. [Google Scholar] [CrossRef] [PubMed]
- Ostheimer, C.; Evers, C.; Bache, M.; Reese, T.; Vordermark, D. Prognostic implications of the co-detection of the urokinase plasminogen activator system and osteopontin in patients with non-small-cell lung cancer undergoing radiotherapy and correlation with gross tumor volume. Strahlenther. Onkol. 2018, 194, 539–551. [Google Scholar] [CrossRef]
- Zubac, D.P.; Wentzel-Larsen, T.; Seidal, T.; Bostad, L. Type 1 plasminogen activator inhibitor (PAI-1) in clear cell renal cell carcinoma (CCRCC) and its impact on angiogenesis, progression and patient survival after radical nephrectomy. BMC Urol. 2010, 10, 20. [Google Scholar] [CrossRef]
- Vaughan, D.E.; Rai, R.; Khan, S.S.; Eren, M.; Ghosh, A.K. PAI-1 is a marker and a mediator of senescence. Arterioscler. Thromb. Vasc. Biol. 2017, 37, 1446. [Google Scholar] [CrossRef] [PubMed]
- Jiang, C.S.; Rana, T.; Jin, L.W.; Farr, S.A.; Morley, J.E.; Qin, H.; Liu, G.; Liu, R.M. Aging, plasminogen activator inhibitor 1, brain cell senescence, and Alzheimer’s Disease. Aging Dis. 2023, 14, 515–528. [Google Scholar] [CrossRef]
- Ahmed, T.A.; El-Badri, N. Pericytes: The role of multipotent stem cells in vascular maintenance and regenerative medicine. Adv. Exp. Med. Biol. 2018, 1079, 69–86. [Google Scholar] [CrossRef]
- Escudero, C.A.; Herlitz, K.; Troncoso, F.; Guevara, K.; Acurio, J.; Aguayo, C.; Godoy, A.S.; González, M. Pro-angiogenic role of insulin: From physiology to pathology. Front. Physiol. 2017, 8, 224224. [Google Scholar] [CrossRef] [PubMed]
- Miele, C.; Rochford, J.J.; Filippa, N.; Giorgetti-Peraldi, S.; Van Obberghen, E. Insulin and Insulin-like Growth Factor-I Induce Vascular Endothelial Growth Factor mRNA Expression via Different Signaling Pathways. J. Biol. Chem. 2000, 275, 21695–21702. [Google Scholar] [CrossRef] [PubMed]
- Hale, L.J.; Hurcombe, J.; Lay, A.; Santamaría, B.; Valverde, A.M.; Saleem, M.A.; Mathieson, P.W.; Welsh, G.I.; Coward, R.J. Insulin directly stimulates VEGF-A production in the glomerular podocyte. J Physiol Ren. Physiol 2013, 305, 182–188. [Google Scholar] [CrossRef] [PubMed]
- Hill, D.J.; Milner, R.D.G. Insulin as a growth factor. Pediatr. Res. 1985, 19, 879–886. [Google Scholar] [CrossRef]
- Steller, M.A.; Delgado, C.H.; Zou, Z. Insulin-like growth factor II mediates epidermal growth factor-induced mitogenesis in cervical cancer cells. Proc. Natl. Acad. Sci. USA 1995, 92, 11970–11974. [Google Scholar] [CrossRef]
- Ayati, A.; Moghimi, S.; Salarinejad, S.; Safavi, M.; Pouramiri, B.; Foroumadi, A. A review on progression of epidermal growth factor receptor (EGFR) inhibitors as an efficient approach in cancer targeted therapy. Bioorg. Chem. 2020, 99, 103811. [Google Scholar] [CrossRef]
- Mabeta, P.; Steenkamp, V. The VEGF/VEGFR Axis Revisited: Implications for Cancer Therapy. Int. J. Mol. Sci. 2022, 23, 15585. [Google Scholar] [CrossRef]
- Flores-López, L.A.; Martínez-Hernández, M.G.; Viedma-Rodríguez, R.; Díaz-Flores, M.; Baiza-Gutman, L.A. High glucose and insulin enhance uPA expression, ROS formation and invasiveness in breast cancer-derived cells. Cell. Oncol. 2016, 39, 365–378. [Google Scholar] [CrossRef]
- Hou, Y.; Zhou, M.; Xie, J.; Chao, P.; Feng, Q.; Wu, J. High glucose levels promote the proliferation of breast cancer cells through GTPases Breast Cancer-Targets and Therapy Dovepress High glucose levels promote the proliferation of breast cancer cells through GTPases. Breast Cancer Targets Ther. 2017, 9, 429–436. [Google Scholar] [CrossRef]
- Han, L.; Ma, Q.; Li, J.; Liu, H.; Li, W.; Ma, G.; Xu, Q.; Zhou, S.; Wu, E. High glucose promotes pancreatic cancer cell proliferation via the induction of EGF expression and transactivation of EGFR. PLoS ONE 2011, 6, e27074. [Google Scholar] [CrossRef] [PubMed]
- Zhao, W.; Chen, R.; Zhao, M.; Li, L.; Fan, L.; Che, X.M. High glucose promotes gastric cancer chemoresistance in vivo and in vitro. Mol. Med. Rep. 2015, 12, 843–850. [Google Scholar] [CrossRef] [PubMed]
- Fainsod-Levi, T.; Gershkovitz, M.; Vö, S.; Grunewald, M.; Keshet, E.; Correspondence, Z.G.; Vö Ls, S.; Kumar, S.; Khawaled, S.; Sagiv, J.Y.; et al. Hyperglycemia impairs neutrophil mobilization leading to enhanced metastatic seeding. Cell Rep. 2017, 21, 2384–2392. [Google Scholar] [CrossRef] [PubMed]
- Deshmane, S.L.; Kremlev, S.; Amini, S.; Sawaya, B.E. Monocyte chemoattractant protein-1 (MCP-1): An overview. J. Interferon Cytokine Res. 2009, 29, 313. [Google Scholar] [CrossRef] [PubMed]
- Westerbacka, J.; Cornér, A.; Kolak, M.; Makkonen, J.; Turpeinen, U.; Hamsten, A.; Fisher, R.M.; Yki-Järvinen, H. Insulin regulation of MCP-1 in human adipose tissue of obese and lean women. Am. J. Physiol.-Endocrinol. Metab. 2008, 294, 841–845. [Google Scholar] [CrossRef]
- Nio, Y.; Yamauchi, T.; Iwabu, M.; Okada-Iwabu, M.; Funata, M.; Yamaguchi, M.; Ueki, K.; Kadowaki, T. Monocyte chemoattractant protein-1 (MCP-1) deficiency enhances alternatively activated M2 macrophages and ameliorates insulin resistance and fatty liver in lipoatrophic diabetic A-ZIP transgenic mice. Diabetologia 2012, 55, 3350–3358. [Google Scholar] [CrossRef]
- Patsouris, D.; Cao, J.J.; Vial, G.; Bravard, A.; Lefai, E.; Durand, A.; Durand, C.; Chauvin, M.A.; Laugerette, F.; Debard, C.; et al. Insulin resistance is associated with MCP1-mediated macrophage accumulation in skeletal muscle in mice and humans. PLoS ONE 2014, 9, e110653. [Google Scholar] [CrossRef]
- Yuan, X.; Wang, J.; Yang, S.; Gao, M.; Cao, L.; Li, X.; Hong, D.; Tian, S.; Sun, C. Effect of the ketogenic diet on glycemic control, insulin resistance, and lipid metabolism in patients with T2DM: A systematic review and meta-analysis. Nutr. Diabetes 2020, 10, 38. [Google Scholar] [CrossRef]
- Sartipy, P.; Loskutoff, D.J. Monocyte chemoattractant protein 1 in obesity and insulin resistance. Proc. Natl. Acad. Sci. USA 2003, 100, 7265. [Google Scholar] [CrossRef]
- Du, Z.; Wu, X.; Song, M.; Li, P.; Wang, L. Oxidative damage induces MCP-1 secretion and macrophage aggregation in age-related macular degeneration (AMD). Graefes Arch. Clin. Exp. Ophthalmol. 2016, 254, 2469–2476. [Google Scholar] [CrossRef]
- Quoc, Q.L.; Cao, T.B.T.; Moon, J.Y.; Jang, J.H.; Shin, Y.S.; Choi, Y.; Ryu, M.S.; Park, H.S. Contribution of monocyte and macrophage extracellular traps to neutrophilic airway inflammation in severe asthma. Allergol. Int. 2023. [Google Scholar] [CrossRef] [PubMed]
- Gonzalo, J.A.; Lloyd, C.M.; Wen, D.; Albar, J.P.; Wells, T.N.C.; Proudfoot, A.; Martinez-a, C.; Dorf, M.; Bjerke, T.; Coyle, A.J.; et al. The coordinated action of CC chemokines in the lung orchestrates allergic inflammation and airway hyperresponsiveness. J. Exp. Med. 1998, 188, 157. [Google Scholar] [CrossRef] [PubMed]
- Singh, S.; Anshita, D.; Ravichandiran, V. MCP-1: Function, regulation, and involvement in disease. Int. Immunopharmacol. 2021, 101, 107598. [Google Scholar] [CrossRef]
- Kaneko, N.; Kurata, M.; Yamamoto, T.; Morikawa, S.; Masumoto, J. The role of interleukin-1 in general pathology. Inflamm. Regen. 2019, 39, 12. [Google Scholar] [CrossRef]
- Lopez-Castejon, G.; Brough, D. Understanding the mechanism of IL-1β secretion. Cytokine Growth Factor Rev. 2011, 22, 189. [Google Scholar] [CrossRef]
- Abdulla, M.H.; Sultana, S.A.; Vaali-Mohammed, M.A.; Al Khayal, K.A.; Bin Traiki, T.; Zubaidi, A.M.; Al-Johani, T.; Shakoor, Z.; Obeed, O.A. Al Expression of VEGF, EGF and HGF in early- and late-stage colorectal cancer. Mol. Clin. Oncol. 2021, 15, 251. [Google Scholar] [CrossRef]
- Yang, Y.; Cao, Y. The impact of VEGF on cancer metastasis and systemic disease. Semin. Cancer Biol. 2022, 86, 251–261. [Google Scholar] [CrossRef] [PubMed]
- Mulholland, B.S.; Hofstee, P.; Millar, E.K.A.; Bliuc, D.; O’Toole, S.; Forwood, M.R.; McDonald, M.M. MCP-1 expression in breast cancer and its association with distant relapse. Cancer Med. 2023, 12, 16221–16230. [Google Scholar] [CrossRef] [PubMed]
- Wang, L.; Lan, J.; Tang, J.; Luo, N. MCP-1 targeting: Shutting off an engine for tumor development. Oncol. Lett. 2022, 23, 26. [Google Scholar] [CrossRef]
- Meidenbauer, J.J.; Mukherjee, P.; Seyfried, T.N. The glucose ketone index calculator: A simple tool to monitor therapeutic efficacy for metabolic management of brain cancer. Nutr. Metab. 2015, 12, 12. [Google Scholar] [CrossRef]
- Tan-Shalaby, J. Ketogenic diets and cancer: Emerging evidence. Fed. Pract. 2017, 34, 37S. [Google Scholar]
- Weber, D.D.; Aminzadeh-Gohari, S.; Tulipan, J.; Catalano, L.; Feichtinger, R.G.; Kofler, B. Ketogenic diet in the treatment of cancer—Where do we stand? Mol. Metab. 2020, 33, 102. [Google Scholar] [CrossRef] [PubMed]
- Liberti, M.V.; Locasale, J.W. The Warburg Effect: How Does it Benefit Cancer Cells? Trends Biochem. Sci. 2016, 41, 211–218. [Google Scholar] [CrossRef] [PubMed]
- Draznin, B. Mitogenic action of insulin: Friend, foe or “frenemy”? Diabetologia 2010, 53, 229–233. [Google Scholar] [CrossRef]
- Volek, J.S.; Freidenreich, D.J.; Saenz, C.; Kunces, L.J.; Creighton, B.C.; Bartley, J.M.; Davitt, P.M.; Munoz, C.X.; Anderson, J.M.; Maresh, C.M.; et al. Metabolic characteristics of keto-adapted ultra-endurance runners. Metabolism. 2015, 65, 100–110. [Google Scholar] [CrossRef] [PubMed]
- Kyriakidou, Y.; Cooper, I.; Kraev, I.; Lange, S.; Elliott, B.T. Preliminary investigations into the effect of exercise-induced muscle damage on systemic extracellular vesicle release in trained younger and older men. Front. Physiol. 2021, 12, 723931. [Google Scholar] [CrossRef]
- Jansen, L.T.; Yang, N.; Wong, J.M.W.; Mehta, T.; Allison, D.B.; Ludwig, D.S.; Ebbeling, C.B. Prolonged glycemic adaptation following transition from a low- to high-carbohydrate diet: A randomized controlled feeding trial. Diabetes Care 2022, 45, 576–584. [Google Scholar] [CrossRef]
- Jo, U.; Park, K. Carbohydrate-based diet may increase the risk of cardiovascular disease: A pooled analysis of two prospective cohort studies. Clin. Nutr. 2023, 42, 1301–1307. [Google Scholar] [CrossRef]
- Moore, A.R.; Holland-Winkler, A.M.; Ansley, J.K.; Boone, E.D.H.; Schulte, M.K.O. Reliability and diagnostic performance of a new blood ketone and glucose meter in humans. J. Int. Soc. Sports Nutr. 2021, 18, 6. [Google Scholar] [CrossRef]
- Veyrat-Durebex, C.; Reynier, P.; Procaccio, V.; Hergesheimer, R.; Corcia, P.; Andres, C.R.; Blasco, H. How can a ketogenic diet improve motor function? Front. Mol. Neurosci. 2018, 11, 15. [Google Scholar] [CrossRef]


| P1 | P2 | P3 | ANOVA p Value | P1 vs. P2 | P2 vs. P3 | P1 vs. P3 | |
|---|---|---|---|---|---|---|---|
| Age (years) | 32.30 (±8.97) | ||||||
| Height (cm) | 160.95 (±7.28) | ||||||
| Weight (kg) | 52.99 (±4.24) | 55.65 (±4.10) | 53.93 (±4.04) | <0.0001 | 0.0002 | <0.0001 | 0.7888 |
| BMI | 20.52 (±1.39) | 21.54 (±1.30) | 20.82 (±1.46) | <0.0001 | <0.0001 | 0.0025 | 0.0197 |
| Waist/Hip | 0.75 (±0.03) | 0.77 (±0.03) | 0.74 (±0.03) | <0.0001 | 0.0015 | <0.0001 | 0.5361 |
| Waist/Height | 0.43 (±0.03) | 0.45 (±0.03) | 0.43 (±0.03) | <0.0001 | 0.0009 | <0.0001 | >0.9999 |
| Fat mass (kg) | 14.21 (±2.55) | 15.88 (±2.23) | 14.78 (±2.20) | <0.0001 | 0.0008 | 0.0057 | 0.1016 |
| TBW (L) | 28.15 (±2.87) | 29.15 (±2.96) | 28.42 (±3.15) | 0.0005 | 0.0016 | 0.0262 | 0.3473 |
| RQ | 0.66 (±0.05) | 0.72 (±0.06) | 0.65 (±0.06) | 0.0096 | 0.0427 | 0.0005 | 0.8606 |
| Systole (mmHg) | 103.25 (±6.24) | 103.70 (±10.17) | 100.00 (±9.54) | 0.1455 | 0.9753 | 0.1746 | 0.2274 |
| Diastole (mmHg) | 70.75 (±4.91) | 69.45 (±7.14) | 68.15 (±7.36) | 0.3227 | 0.8044 | 0.7147 | 0.1715 |
| Mean Capillary BHB Concentration (mmol/L) | |||||
|---|---|---|---|---|---|
| Participant | No of Tests Taken | % of Tests Fulfilled Out of 252 | P1 | P2 | P3 |
| 1011 | 251 | 99.6 | 2.7 | 0.1 | 2.3 |
| 1021 | 252 | 100 | 2.8 | 0.1 | 2.2 |
| 1031 | 252 | 100 | 2.6 | 0.1 | 1.8 |
| 1041 | 252 | 100 | 1.5 | 0.2 | 1.6 |
| 1051 | 251 | 99.6 | 1.7 | 0 | 1.6 |
| 1061 | 245 | 97.22 | 0.7 | 0.1 | 0.8 |
| 1071 | 248 | 98.41 | 1.7 | 0.2 | 2.4 |
| 1081 | 250 | 99.21 | 2 | 0.1 | 1.2 |
| 1091 | 251 | 99.6 | 1.8 | 0.1 | 2.5 |
| 1101 | 252 | 100 | 1.5 | 0.1 | 2.4 |
| Mean | 250.4 | 99.37 | 1.9 | 0.1 | 1.9 |
| ±SD | 2.15 | 0.85 | 0.7 | 0.1 | 0.6 |
| Capillary BHB (mmol/L) | ||||||||||||
|---|---|---|---|---|---|---|---|---|---|---|---|---|
| ≥ 0.5 | > 0.3 | ≤ 0.3 | < 0.1 | |||||||||
| Participant | P1 | P2 | P3 | P1 | P2 | P3 | P1 | P2 | P3 | P1 | P2 | P3 |
| 1011 | 100.00 | 2.38 | 95.18 | 100.00 | 4.76 | 98.80 | 0.00 | 95.24 | 1.20 | 0.00 | 28.57 | 0.00 |
| 1021 | 100.00 | 2.38 | 88.10 | 100.00 | 2.38 | 94.05 | 0.00 | 97.62 | 5.95 | 0.00 | 60.71 | 0.00 |
| 1031 | 100.00 | 2.38 | 92.86 | 100.00 | 2.38 | 95.24 | 0.00 | 97.62 | 4.76 | 0.00 | 59.52 | 0.00 |
| 1041 | 98.81 | 0.00 | 100.00 | 100.00 | 8.33 | 100.00 | 0.00 | 91.67 | 0.00 | 0.00 | 13.10 | 0.00 |
| 1051 | 100.00 | 0.00 | 97.62 | 100.00 | 1.19 | 98.81 | 0.00 | 98.81 | 0.00 | 0.00 | 94.05 | 0.00 |
| 1061 | 94.05 | 0.00 | 82.93 | 97.62 | 0.00 | 90.24 | 2.38 | 100.00 | 9.76 | 0.00 | 37.97 | 0.00 |
| 1071 | 96.30 | 4.82 | 97.62 | 97.53 | 4.82 | 97.62 | 2.47 | 95.18 | 2.38 | 0.00 | 1.20 | 0.00 |
| 1081 | 96.39 | 0.00 | 90.48 | 98.80 | 1.20 | 95.24 | 1.20 | 98.80 | 4.76 | 0.00 | 33.73 | 0.00 |
| 1091 | 98.81 | 0.00 | 98.80 | 100.00 | 1.19 | 100.00 | 0.00 | 98.81 | 0.00 | 0.00 | 21.43 | 0.00 |
| 1101 | 96.43 | 0.00 | 98.81 | 100.00 | 0.00 | 100.00 | 0.00 | 100.00 | 0.00 | 0.00 | 54.76 | 0.00 |
| P1 | P2 | P3 | ANOVA p Value | P1 vs. P2 | P2 vs. P3 | P1 vs. P3 | |
|---|---|---|---|---|---|---|---|
| Insulin (pmol/L) | 33.60 (± 8.63) | 59.80 (± 14.69) | 31.60 (± 9.38) | <0.0001 | 0.0002 | <0.0001 | 0.5361 |
| IGF-1 (µg/L) | 149.30 (± 32.96) | 273.40 (± 85.66) | 136.90 (± 39.60) | 0.0015 | 0.0045 | 0.0055 | 0.4124 |
| Glucose (mmol/L) | 4.36 (± 0.53) | 5.12 (± 0.59) | 4.41 (± 0.30) | 0.0015 | 0.0088 | 0.0177 | 0.9469 |
| BHB (mmol/L) | 2.43 (± 1.28) | 0.18 (± 0.13) | 2.31 (± 0.71) | 0.0001 | 0.0012 | <0.0001 | 0.9854 |
| IGFBP-3 (mg/mL) | 3.69 (± 0.56) | 4.41 (± 1.27) | 3.67 (± 0.70) | 0.2357 | 0.3621 | 0.4272 | 0.9361 |
| IGF-1/IGFBP-3† | 0.14 (± 0.03) | 0.25 (± 0.08) | 0.15 (± 0.04) | 0.0584 | 0.0870 | 0.1554 | 0.9049 |
| TSH (mU/L) | 1.40 (± 0.74) | 1.56 (± 0.75) | 1.25 (± 0.81) | 0.3065 | 0.2334 | 0.4498 | 0.7742 |
| Free T3 (pmol/L) | 3.81 (± 0.28) | 5.51 (± 0.72) | 4.05 (± 0.54) | <0.0001 | <0.0001 | 0.0015 | 0.3040 |
| Reverse T3 (nmol/L) | 0.29 (± 0.09) | 0.26 (± 0.10) | 0.25 (± 0.09) | 0.6039 | 0.7030 | 0.9674 | 0.6323 |
| T4 (pmol/L) | 13.51 (± 1.61) | 13.24 (± 1.49) | 12.65 (± 0.66) | 0.2125 | 0.8795 | 0.3059 | 0.2099 |
| P1 | P2 | P3 | ANOVA p Value | P1 vs. P2 | P2 vs. P3 | P1 vs. P3 | |
|---|---|---|---|---|---|---|---|
| Triglycerides (mg/dL) | 66.80 (± 28.00) | 66.10 (± 21.09) | 79.30 (± 45.88) | 0.5018 | 0.9972 | 0.6629 | 0.6270 |
| Total cholesterol (mg/dL) | 231.50 (± 62.42) | 188.50 (± 30.28) | 210.20 (± 43.44) | 0.0335 | 0.0802 | 0.2132 | 0.1061 |
| HDL cholesterol (mg/dL) | 70.10 (± 10.37) | 72.70 (± 13.59) | 69.80 (± 11.84) | 0.6231 | 0.7460 | 0.6762 | 0.9943 |
| LDL cholesterol (mg/dL) † | 4.46 (± 2.03) | 3.13 (± 0.91) | 3.96 (± 1.34) | 0.0888 | 0.1798 | 0.3280 | 0.1498 |
| Triglycerides/HDL (mmol/L) | 1.01 (± 0.55) | 0.95(± 0.38) | 1.25 (± 0.90) | 0.3804 | 0.9478 | 0.5358 | 0.5515 |
| CRP (Ultra-Sensitive) (mg/L) § | 1.00 (± 1.19) | 1.16 (± 1.56) | 1.35 (± 2.23) | 0.7103 | 0.9938 | 0.7477 | 0.7728 |
| Gamma-GT (U/L) | 9.60 (± 3.13) | 12.40 (± 2.55) | 9.70 (± 2.50) | 0.0029 | 0.0087 | 0.0286 | 0.9885 |
| Cortisol (µg/dL) | 12.62 (± 5.27) | 11.27 (± 5.85) | 13.19 (± 5.22) | 0.3574 | 0.6886 | 0.4087 | 0.8258 |
| PAI-1 (ng/mL) | 13.34 (± 6.85) | 16.69 (± 6.26) | 17.05 (± 5.58) | 0.0431 | 0.0428 | 0.9483 | 0.1373 |
| P1 | P2 | P3 | ANOVA p Value | P1 vs. P2 | P2 vs. P3 | P1 vs. P3 | |
|---|---|---|---|---|---|---|---|
| EGF (pg/mL) | 33.02 (± 30.96) | 50.13 (± 38.19) | 37.82 (± 26.81) | 0.0139 | 0.0450 | 0.3473 | 0.0478 |
| VEGF (pg/mL) | 93.93 (± 54.30) | 147.33 (± 100.03) | 134.80 (± 98.79) | 0.0147 | 0.0314 | 0.2102 | 0.0801 |
| Interferon-γ (pg/mL) | 1.14 (± 2.64) | 0.72 (± 1.05) | 0.57 (± 0.90) | 0.3755 | 0.7019 | 0.2452 | 0.6019 |
| (MCP-1) (pg/mL) | 103.98 (± 39.30) | 192.53 (± 84.73) | 128.52 (± 51.80) | 0.0026 | 0.0137 | 0.0175 | 0.2622 |
| TNF-α (pg/mL) | 2.23 (± 1.75) | 2.66 (± 1.26) | 2.09 (± 0.97) | 0.1387 | 0.3887 | 0.0785 | 0.8430 |
| IL-1a (pg/mL) | 0.30 (± 0.40) | 0.26 (± 0.25) | 0.26 (± 0.25) | 0.3230 | 0.6266 | 0.5406 | 0.5104 |
| IL-1b (pg/mL) | 2.23 (± 3.42) | 1.85 (± 2.02) | 1.71 (± 2.04) | 0.3090 | 0.7045 | 0.0381 | 0.4989 |
| IL-2 (pg/mL) | 1.92 (± 1.48) | 1.71 (± 1.16) | 1.94 (± 1.37) | 0.2932 | 0.4409 | 0.7569 | 0.3809 |
| IL-4 (pg/mL) | 2.14 (± 0.80) | 2.06 (± 0.99) | 2.25 (± 1.17) | 0.4635 | 0.5358 | 0.5138 | 0.9090 |
| IL-6 (pg/mL) | 0.95 (± 0.80) | 1.22 (± 1.11) | 0.84 (± 0.56) | 0.5034 | 0.9238 | 0.5677 | 0.5771 |
| IL-8 (pg/mL) | 8.91 (± 9.56) | 8.60 (± 5.93) | 8.08 (± 6.30) | 0.6738 | 0.9966 | 0.5725 | 0.8009 |
| IL-10 (pg/mL) | 0.61 (± 0.37) | 0.68 (± 0.46) | 0.53 (± 0.25) | 0.4323 | 0.9084 | 0.4420 | 0.5573 |
Disclaimer/Publisher’s Note: The statements, opinions and data contained in all publications are solely those of the individual author(s) and contributor(s) and not of MDPI and/or the editor(s). MDPI and/or the editor(s) disclaim responsibility for any injury to people or property resulting from any ideas, methods, instructions or products referred to in the content. |
© 2023 by the authors. Licensee MDPI, Basel, Switzerland. This article is an open access article distributed under the terms and conditions of the Creative Commons Attribution (CC BY) license (https://creativecommons.org/licenses/by/4.0/).
Share and Cite
Cooper, I.D.; Kyriakidou, Y.; Edwards, K.; Petagine, L.; Seyfried, T.N.; Duraj, T.; Soto-Mota, A.; Scarborough, A.; Jacome, S.L.; Brookler, K.; et al. Ketosis Suppression and Ageing (KetoSAge): The Effects of Suppressing Ketosis in Long Term Keto-Adapted Non-Athletic Females. Int. J. Mol. Sci. 2023, 24, 15621. https://doi.org/10.3390/ijms242115621
Cooper ID, Kyriakidou Y, Edwards K, Petagine L, Seyfried TN, Duraj T, Soto-Mota A, Scarborough A, Jacome SL, Brookler K, et al. Ketosis Suppression and Ageing (KetoSAge): The Effects of Suppressing Ketosis in Long Term Keto-Adapted Non-Athletic Females. International Journal of Molecular Sciences. 2023; 24(21):15621. https://doi.org/10.3390/ijms242115621
Chicago/Turabian StyleCooper, Isabella D., Yvoni Kyriakidou, Kurtis Edwards, Lucy Petagine, Thomas N. Seyfried, Tomas Duraj, Adrian Soto-Mota, Andrew Scarborough, Sandra L. Jacome, Kenneth Brookler, and et al. 2023. "Ketosis Suppression and Ageing (KetoSAge): The Effects of Suppressing Ketosis in Long Term Keto-Adapted Non-Athletic Females" International Journal of Molecular Sciences 24, no. 21: 15621. https://doi.org/10.3390/ijms242115621